EPA/635/R-05/004 TOXICOLOGICAL REVIEW OF TOLUENE (CAS No. 108-88-3) In Support of Summary Information on the Integrated Risk Information System (IRIS) September 2005 U.S. Environmental Protection Agency Washington D.C.
Transcript
EPA/635/R-05/004
TOXICOLOGICAL REVIEW
OF
TOLUENE(CAS No. 108-88-3)
In Support of Summary Information on theIntegrated Risk Information System (IRIS)
September 2005
U.S. Environmental Protection AgencyWashington D.C.
DISCLAIMER
This document has been reviewed in accordance with U. S. Environmental Protection Agency policy and approved for publication. Mention of trade names or commercial products does not constitute endorsement or recommendation for use.
i
CONTENTS —TOXICOLOGICAL REVIEW OF TOLUENE (CAS No. 108-88-3)
Figure 2. Summary of NOAELs/LOAELs for neurological endpoints for a subset ofoccupational studies of chronic inhalation exposure to toluene . . . . . . . . . . . . . 73
vi
FREQUENTLY USED ABBREVIATIONS AND ACRONYMS
[3H]TdR [3H]thymidine 5-HIAA 5-Hydroxyindoleacetic acid 5-HT 5-Hydroxytryptamine (serotonin) AACCI Alcohol intake-adjusted color confusion index ACGIH American Conference of Governmental Industrial Hygienists ACTH Adrenocorticotropic hormone AIC Akaike Information Criterion ALT L-alanine-aminotransferase anti-GBM Antiglomerular basement membrane antibody anti-LAM Antilaminin antibody ASPH Association of Schools of Public Health ATSDR Agency for Toxic Substances and Disease Registry BAEP Brainstem auditory evoked potentials BMD Benchmark dose BMDL BMD lower 95% confidence limit BMDS Benchmark dose modeling software BMR Benchmark response BTEX Benzene, toluene, ethylbenzene, and xylenes CAS Chemical Abstracts Service CASRN Chemical Abstracts Service Registry Number CATSYS Computerized test system for neurotoxicity CCI Color confusion index CDP Cubic distortion-product CH50 Number of cells necessary to lyse 50% of target cells CHO Chinese hamster ovary CI Confidence interval CIIT Chemical Industry Institute of Toxicology CNS Central Nervous System CoA Coenzyme A Con A Concanavalin A CYP Cytochrome P-450 DA Dopamine DCV Distribution of nerve conduction velocities DH Dehydrogenase DNA Deoxyribonucleic acid DOPAC 3,4-Dihydroxyphenylacetic acid ECG Electrocardiograph ELISA Enzyme-linked immunosorbent assay F0 Parent generation
vii
F1 First filial generation F2 Second filial generation FEP Flash-evoked potential FOB Functional observation battery GABA (-Aminobutyric acid GSH Glutathione (reduced) HEC Human equivalent concentration HVA Homovanillic acid IARC International Agency for Research on Cancer IgE Immunoglobulin E IgG Immunoglobulin G IgM Immunoglobulin M IL-2 Interleukin-2 IRIS Integrated Risk Information System LOAEL Lowest observed adverse effect level LPS Lipopolysaccharide LWAE Lifetime weighted average exposure MCV Maximal motor conduction velocities MLC Mixed lymphocyte culture MLR Mixed lymphocyte reponse MRI Magnetic resonance imaging MTD Maximum tolerated dose NAG N-Acetyl-$-D-glucosaminidase NCEA National Center for Environmental Assessment NE Nonrepinephrine NHEERL National Health and Environmental Effects Research
Laboratory NIOSH National Institute of Occupational Safety and Health NMDA N-Methyl-D-aspartate NOAEL No observed adverse effect level NRC National Research Council NTP National Toxicology Program OSHA Occupational Safety and Health Administration PBPK Physiologically-Based Pharmacokinetic PBTK Physiologically-Based Toxicokinetic PEL Permissible exposure limit PFC Plaque-forming colony PHA Phytohemagglutinin ppm Parts per million PUNPs Periods of unprotected intercourse not leading to pregnancy PVECP Pattern visual evoked cortical potentials PWM Pokeweed mitogen
Microsomal preparation SCE Sister-chromatid exchanges SCV Sensory nerve conduction velocities SD Standard deviation SDH Succinate dehydrogenase SE Standard error SGOT Serum glutamic oxaloacetic transaminase SIR Standardized incidence ratio SMR Standardized mortality ratio SRBC Sheep red blood cells SWAY Computerized test system for neurotoxicity TLV Threshold limit value TOTCI Total confusion index TREMOR Computerized test system for neurotoxicity TTP Time to pregnancy TUI Time of unprotected intercourse TWA Time-weighted average UCEA University Council for Educational Administration UF Uncertainty factor UFA Uncertainty factor, interspecies animal-to-human UFH Uncertainty factor, intraspecies human-to-human UDP Uridine 5’-diphosphate VEP Visual-evoked potentials VMA Vanillylmandelic acid VOCs Volatile organic compounds WHO World Health Organization
ix
FOREWORD
The purpose of this Toxicological Review is to provide scientific support and rationale for the hazard and dose-response assessment in IRIS pertaining to chronic exposure to toluene. It is not intended to be a comprehensive treatise on the chemical or toxicological nature of toluene.
In Section 6, Major Conclusions in the Characterization of Hazard and Dose Response, EPA has characterized its overall confidence in the quantitative and qualitative aspects of hazard and dose response by addressing knowledge gaps, uncertainties, quality of data, and scientific controversies. The discussion is intended to convey the limitations of the assessment and to aid and guide the risk assessor in the ensuing steps of the risk assessment process.
For other general information about this assessment or other questions relating to IRIS, the reader is referred to EPA’s IRIS Hotline at 202-566-1676.
x
AUTHORS, CONTRIBUTORS, AND REVIEWERS
CHEMICAL MANAGER AND AUTHOR Lynn Flowers, Ph.D., DABT National Center for Environmental Assessment (NCEA) USEPA Office of Research and Development Washington, DC
CONTRIBUTING AUTHORS William Boyes, Ph.D.National Health and Environmental Effects Research Laboratory (NHEERL)Office of Research and DevelopmentResearch Triangle Park, NC
Stiven FosterNCEAUSEPA Office of Research and DevelopmentWashington, DC
Martin Gehlhaus, MHSNCEAUSEPA Office of Research and DevelopmentWashington, DC
Karen HoganNCEAUSEPA Office of Research and DevelopmentWashington, DC
Allan Marcus, Ph.D.NCEAUSEPA Office of Research and DevelopmentResearch Triangle Park, NC
Peter McClure, Ph.D., DABTSyracuse Research CorporationNorth Syracuse, NY
Mark Osier, Ph.D.Syracuse Research CorporationNorth Syracuse, NY
xi
Andrew Rooney, Ph.D. NCEA USEPA Office of Research and Development Research Triangle Park, NC
REVIEWERS
This document and the accompanying IRIS Summary have been reviewed by EPA scientists and independent scientists external EPA. Comments from all peer reviewers were evaluated carefully and considered by the Agency during the finalization of this assessment. During the finalization process, the IRIS Program Director achieved common understanding of the assessment among the Office of Research and Development; Office of Air and Radiation; Office of Prevention, Pesticides, and Toxic Substances; Office of Solid Waste and Emergency Response; Office of Water; Office of Policy, Economics, and Innovation; Office of Children’s Health Protection; Office of Environmental Information, and EPA’s regional offices.
INTERNAL EPA REVIEWERS Joyce Donohue, Ph.D. Health and Ecological Criteria Division Office of Water
Andrew Geller, Ph.D. Neurotoxicology Division NHEERL Office of Research and Development
Elaina Kenyon, Ph.D. Pharmacokinetics Branch Experimental Toxicology Division NHEERL Office of Research and Development
EXTERNAL PEER REVIEWERS (AUGUST 2002) Anna M. Fan, Ph.D., DABT Office of Environmental Health Hazard Assessment California Environmental Protection Agency
Prof. Dr. med. Diether Neubert Institute of Clinical Pharmacology and Toxicology Benjamin Franklin Medical Center Free University Berlin
xii
Alan H. Stern, Ph.D., DABT Department of Environmental and Community Medicine University of Medicine and Dentistry of New Jersey
Ronald W. Wood, Ph.D. University of Rochester School of Medicine and Dentistry
EXTERNAL PEER REVIEWERS (JANUARY 2004) Janusz Z. Byczkowski, MSc, Ph.D., DSc, DABT Independent Consultant/Environmental Risk Assessment Coordinator Division of Emergency and Remedial Response Ohio Environmental Protection Agency
Anna M. Fan, Ph.D., DABT Office of Environmental Health Hazard Assessment California Environmental Protection Agency
Fabriziomaria Gobba, Ph.D. University of Modena
Steven Holladay, Ph.D. Dept. Biomedical Sciences and Pathobiology VA-MD Regional College of Veterinary Medicine Virginia Polytechnic Institute and State University
Prof. Dr. med. Diether Neubert Institute of Clinical Pharmacology and Toxicology Benjamin Franklin Medical Center Free University Berlin
Alan H. Stern, Ph.D., DABT Department of Environmental and Community Medicine University of Medicine and Dentistry of New Jersey
Ronald W. Wood, Ph.D. University of Rochester School of Medicine and Dentistry
Summaries of the external peer reviewers’ comments and the disposition of their recommendations are in Appendix A-1 and A-2.
xiii
1. INTRODUCTION
This document presents background information and justification for the Integrated Risk Information System (IRIS) Summary of the hazard and dose-response assessment of toluene. IRIS Summaries may include an oral reference dose (RfD), inhalation reference concentration (RfC) and a carcinogenicity assessment.
The RfD and RfC provide quantitative information for use in risk assessments for health effects known or assumed to be produced through a nonlinear (possibly threshold) mode of action. The RfD is an estimate of an oral exposure for [a given duration], to the human population (including susceptible subgroups) that is likely to be without an appreciable risk of adverse health effects over a lifetime. It is derived from a statistical lower confidence limit on the benchmark dose (BMDL), a no-observed-adverse effect-level (NOAEL), a lowest-observedadverse-effect level (LOAEL), or another suitable point of departure, with uncertainty/variability factors applied to reflect limitations of the data used. The RfD is expressed in units of mg/kgday. The inhalation RfC is analogous to the oral RfD, but provides a continuous inhalation exposure estimate. The inhalation RfC considers toxic effects for both the respiratory system (portal-of-entry) and for effects peripheral to the respiratory system (extrarespiratory or systemic effects). It is generally expressed in units of mg/m3.
The carcinogenicity assessment provides information on the carcinogenic hazard potential of the substance in question and quantitative estimates of risk from oral and inhalation exposure. The information includes a weight-of-evidence judgment of the likelihood that the agent is a human carcinogen and the conditions under which the carcinogenic effects may be expressed. Quantitative risk estimates are presented in three ways to better facilitate their use: (1) generally, the slope factor is the result of application of a low-dose extrapolation procedure and is presented as the risk per mg/kg-day of oral exposure; (2) the unit risk is the quantitative estimate in terms of either risk per µg/L drinking water or risk per µg/m3 continuous airborne exposure; and (3) the 95% lower bound and central estimate on the estimated concentration of the chemical substance in drinking water or air that presents cancer risks of 1 in 10,000, 1 in 100,000, or 1 in 1,000,000.
1
Development of these hazard identification and dose-response assessments for toluene has followed the general guidelines for risk assessment as set forth by the National Research Council (1983). EPA guidelines that were used in the development of this assessment include the following: Guidelines for Developmental Toxicity Risk Assessment (U.S. EPA, 1991), Guidelines for Reproductive Toxicity Risk Assessment (U.S. EPA, 1996), Guidelines for Neurotoxicity Risk Assessment (U.S. EPA, 1998a), Recommendations for and Documentation of Biological Values for Use in Risk Assessment (U.S. EPA, 1988), (proposed) Interim Policy for Particle Size and Limit Concentration Issues in Inhalation Toxicity (U.S. EPA, 1994a), Methods for Derivation of Inhalation Reference Concentrations and Application of Inhalation Dosimetry (U.S. EPA, 1994b), Use of the Benchmark Dose Approach in Health Risk Assessment (U.S. EPA, 1995), Science Policy Council Handbook: Peer Review (U.S. EPA, 1998b, 2000a), Science Policy Council Handbook: Risk Characterization (U.S. EPA, 2000b), Benchmark Dose Technical Guidance Document (U.S. EPA, 2000c), A Review of the Reference Dose and Reference Concentration Processes (U.S. EPA, 2002), and Guidelines for Carcinogen Risk Assessment (U.S. EPA, 2005).
The literature search strategy employed for this compound was based on the CASRN and at least one common name. Any pertinent scientific information submitted by the public to the IRIS Submission Desk was also considered in the development of this document. The relevant literature was reviewed through January, 2005.
2
2. CHEMICAL AND PHYSICAL INFORMATION RELEVANT TO ASSESSMENTS
Toluene is also known as toluol, phenylmethane, methylbenzol, methylbenzene, monomethyl benzene, and methacide. Some relevant physical and chemical properties of toluene are listed below (ATSDR, 2000; NTP, 2001):
CAS Registry number: 108-88-3 Structural formula: C6H5CH3
At room temperature, toluene is a clear-to-amber colorless liquid with a pungent, benzene-like odor. Although it is a liquid at room temperature, toluene’s low vapor pressure results in extensive volatilization. It is flammable with a flash point of 4.4 oC. Toluene is strongly reactive with a number of chemical classes, particularly nitrogen-containing compounds, and may react with some plastics. ACGIH (2000) has recommended an 8-hour time-weighted average (TWA) of 50 ppm (189 mg/m3) for toluene to protect against effects on the central nervous system. OSHA (1993) has promulgated an 8-hour permissible exposure limit (PEL) of 200 ppm (754 mg/m3).
Toluene is used as an additive in gasoline mixtures to increase octane ratings, in benzene production, and as a solvent in paints, coatings, inks, adhesives, and cleaners. Additionally, toluene is used in the production of nylon, plastics, and polyurethanes. Toluene was once used as a medicinal anthelmintic agent against roundworms and hookworms.
3
3. TOXICOKINETICS RELEVANT TO ASSESSMENTS
3.1. ABSORPTION
3.1.1. Oral Exposure
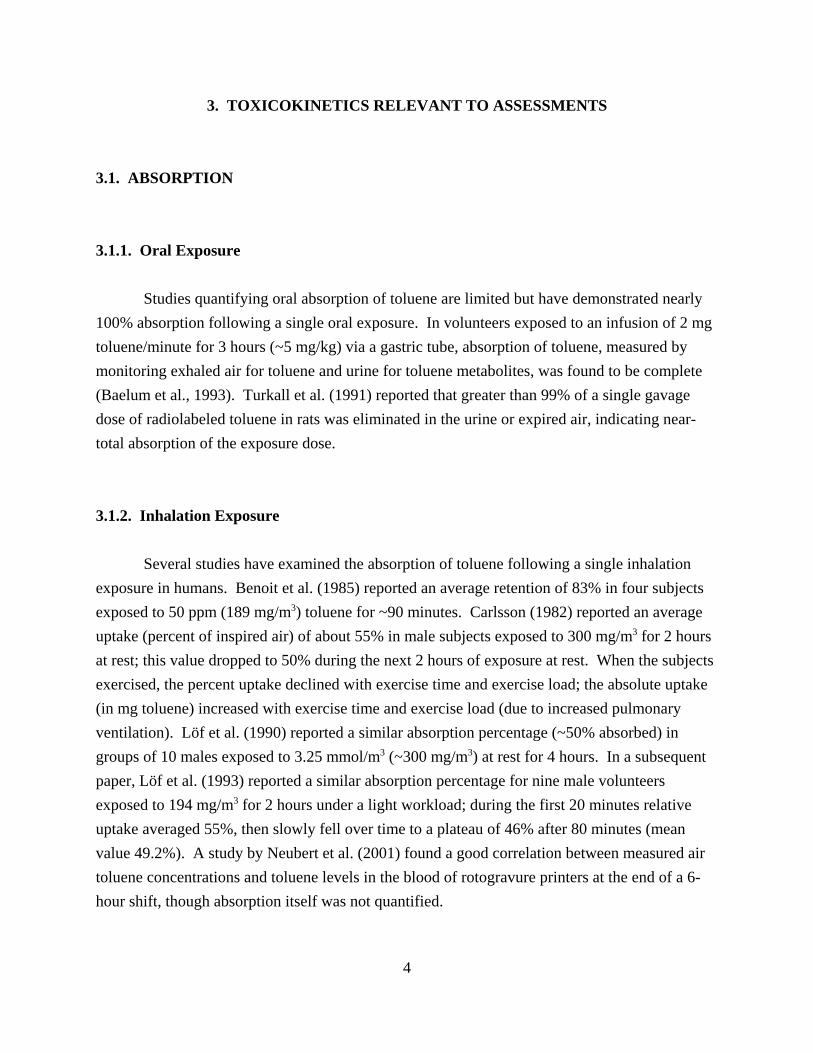
Studies quantifying oral absorption of toluene are limited but have demonstrated nearly 100% absorption following a single oral exposure. In volunteers exposed to an infusion of 2 mg toluene/minute for 3 hours (~5 mg/kg) via a gastric tube, absorption of toluene, measured by monitoring exhaled air for toluene and urine for toluene metabolites, was found to be complete (Baelum et al., 1993). Turkall et al. (1991) reported that greater than 99% of a single gavage dose of radiolabeled toluene in rats was eliminated in the urine or expired air, indicating near-total absorption of the exposure dose.
3.1.2. Inhalation Exposure
Several studies have examined the absorption of toluene following a single inhalation exposure in humans. Benoit et al. (1985) reported an average retention of 83% in four subjects exposed to 50 ppm (189 mg/m3) toluene for ~90 minutes. Carlsson (1982) reported an average uptake (percent of inspired air) of about 55% in male subjects exposed to 300 mg/m3 for 2 hours at rest; this value dropped to 50% during the next 2 hours of exposure at rest. When the subjects exercised, the percent uptake declined with exercise time and exercise load; the absolute uptake (in mg toluene) increased with exercise time and exercise load (due to increased pulmonary ventilation). Löf et al. (1990) reported a similar absorption percentage (~50% absorbed) in groups of 10 males exposed to 3.25 mmol/m3 (~300 mg/m3) at rest for 4 hours. In a subsequent paper, Löf et al. (1993) reported a similar absorption percentage for nine male volunteers exposed to 194 mg/m3 for 2 hours under a light workload; during the first 20 minutes relative uptake averaged 55%, then slowly fell over time to a plateau of 46% after 80 minutes (mean value 49.2%). A study by Neubert et al. (2001) found a good correlation between measured air toluene concentrations and toluene levels in the blood of rotogravure printers at the end of a 6hour shift, though absorption itself was not quantified.
4
Toluene uptake by the inhalation route of exposure has been studied in experimental animals. The uptake ranged from 26 to 93% with a mean of 60% (Egle, 1976; Hobara et al., 1984; Bergman, 1979). Gospe and Al-Bayati (1994) compared oral and inhalation exposures to toluene in the rat in order to determine an appropriate dosing regimen for inhalation toxicity studies. Male F-344 rats were exposed to 14C-toluene by gavage or inhalation. Oral doses of 110, 336, 741, and 911 mg/kg were administered to 82 rats, and blood toluene levels were followed for six hours. For the 120 rats in the inhalation group, three-hour exposures were given at 10, 99, 549, or 1145 ppm. Blood toluene levels were measured during the uptake (exposure) phase and for a 4-hour elimination period. The data from the two exposure methods were fitted to parametric kinetic models, and the resulting curves integrated. The authors concluded that oral dosing produces blood toluene levels that are similar to those produced by inhalation; however, the shape of the time-concentration profile differed for the two methods. Inhalation curves of concentration versus time reached asymptotic levels by one to two hours. Oral blood toluene curves reached asymptotic levels from 1.6 to 6.3 hours postexposure. This suggests a slower absorption via the oral route as the concentration increased.
3.1.3. Dermal Exposure
Toluene is absorbed through human skin slowly (Dutkiewicz and Tyras, 1968), with absorption rates ranging from 14 to 23 mg/cm2-hour. A number of other studies have demonstrated that percutaneous absorption can occur, though they did not quantitate the absorption rate. Sato and Nakajima (1978) reported that 30-minute immersion of the hands of volunteers in pure toluene resulted in a peak level of ~2 :mol toluene/L of blood, which was less than 25% of the blood toluene level achieved by a 2-hour inhalation exposure to 100 ppm (377 mg/m3). Similar blood concentrations were reported by Aitio et al. (1984) in three volunteers who soaked their hands in toluene for 5 minutes; however, there was considerable interindividual variability in toluene blood levels.
Exposure of nude mice, attached to respirators to prevent inhalation, to up to 3000 ppm of toluene vapor resulted in absorption through the skin (Tsuruta, 1989). Absorption varied linearly with exposure concentration and exposure time. Absorption through the shaved skin of guinea pigs (Boman et al., 1995) and rats (Morgan et al., 1991) has also been demonstrated, as evidenced by increased blood levels of toluene following dermal application. Where
5
comparisons were made, dermal absorption was considerably less than absorption following inhalation exposure.
3.2. DISTRIBUTION
Toluene that is absorbed into the blood is distributed throughout the body. Ameno et al. (1989) reported that, in a 51-year-old man who died from accidental oral overdose, the highest toluene concentrations (per gram tissue) were in the liver, followed by pancreas, brain, heart, blood, fat, and cerebrospinal fluid. However, Paterson and Sarvesvaran (1983) reported that a 16-year-old male who was found dead, presumably due to inhalation overdose of toluene, had greater concentrations in the brain than the liver. Takeichi et al. (1986) reported similar findings in a 20-year-old male painter who fell while working with a toluene-based paint; the greatest concentrations upon autopsy were found in the brain, followed by the liver and blood. Within the brain of a 31-year-old man who was found dead in a room full of toluene vapor, the highest concentration of toluene was in the corpus callosum, with the lowest in the caudate-putamen (Ameno et al., 1992). Thus, the available human data suggest that more toluene accumulates in the brain than in the liver following inhalation exposure, whereas following oral exposure, the liver contains the greatest concentrations of toluene.
Pyykko et al. (1977) exposed groups of rats by both the oral and inhalation routes and reported greater toluene concentrations (per gram of wet tissue) in the liver than the brain by both exposure routes. Following inhalation exposure during which dogs were allowed to rebreathe toluene, the liver and brain contained the highest levels (both ~190 μg/g tissue), with lesser levels in the kidneys (Ikeda et al., 1990). Several studies have shown relationships between blood and tissue levels of toluene, particularly for the brain (Benignus et al., 1984; Harabuchi et al., 1993). Toluene is able to cross the placenta and enter the fetus (Ghantous and Danielsson, 1986) and can be found in breast milk (Pellizzari et al., 1982).
3.3. METABOLISM
The main enzymatic pathways involved in toluene metabolism are shown in Figure 1 (Nakajima and Wang, 1994; Tassaneeyakul et al., 1996; Nakajima et al., 1997; Angerer et al., 1998; IARC, 1999). The liver is expected to be the primary site of toluene metabolism. Toluene
6
is metabolized by sequential hydroxylation and oxidation to benzoic acid. The conjugation of glycine with benzoic acid to form hippuric acid constitutes the major route of toluene detoxification and elimination. The initial step in toluene metabolism is transformation by cytochrome P-450 (CYP) enzymes, which occurs mainly in the liver. The most prominent of these transformations is hydroxylation of the methyl group forming benzyl alcohol. Benzyl alcohol is primarily oxidized to benzoic acid, then conjugated with glycine to form hippuric acid. A minor CYP-related pathway involves a transient epoxidation of the aromatic ring to form either ortho- or para-cresol. The cresols may undergo a variety of conjugation reactions, forming mainly sulfates and glucuronides. Glutathione conjugation may also occur resulting in S-benzylglutathione and S-benzylmercapturic acid (conjugation to benzyl alcohol), or S-p-toluyl glutathione and S-p-toluylmercaptic acid (conjugation to the epoxidated ring). A detailed description of the CYP enzymes involved in the metabolism of toluene can be found in ATSDR (2000).
Studies of urinary metabolites in toluene-exposed humans have identified hippuric acid as the major metabolite (Andersen et al., 1983; Angerer, 1979; Angerer et al., 1998; Baelum et al., 1987, 1993; Dossing et al., 1983; Inoue et al., 1986; Jonai and Sato, 1988; Kawai et al., 1992a, 1992b, 1993; Löf et al., 1990, 1993; Maestri et al., 1997; Ng et al., 1990). Minor urinary metabolites (in approximate order of decreasing abundance) include the glucuronyl conjugate of benzoic acid, the sulfate and glucuronide conjugates of ortho- and para-cresol, S-benzylmercapturic acid, and S-p-toluylmercapturic acid (Angerer et al., 1998; Nakajima and Wang, 1994; Nakajima et al., 1997; Tassaneeyakul et al., 1996).
S C CH S-Benzyl H ippuric acid H2 mercapturic acid COOH
S-p-Toluylmercaptic acid
Figure 1. Proposed pathways for toluene metabolism.*, **
*Proposed enzymes are noted in parentheses. Sources: Angerer et al., 1998; ATSDR, 2000; IARC, 1999; Nakajima and Wang, 1994; Nakajima et al., 1997; Tassaneeyakul et al.,
Studies in both humans and animals have shown that the majority of toluene in the body is eliminated in the urine, mainly as metabolites (Löf et al., 1990, 1993; Turkall et al., 1991; Tardif et al., 1992, 1998). As discussed above, the primary urinary metabolite of toluene is hippuric acid, with additional metabolites (see Figure 1) resulting from minor metabolic pathways. Elimination from the blood is rapid (Sato and Nakajima, 1978; Carlsson, 1982; Löf et al., 1990, 1993) with three-phase elimination half times of 3, 40, and 738 minutes following a single inhalation exposure in humans (Löf et al., 1993). A lesser, but still significant, amount of inhaled toluene is removed in the expired air (Pellizzari et al., 1992; Monster et al., 1993). Elimination of toluene in the expired air is greatest at time points during or immediately after exposure and decreases rapidly thereafter (Benoit et al., 1985). Turkall et al. (1991) estimated that ~22% of a single oral dose is eliminated in the expired air in rats with the remainder being mainly eliminated in the urine.
Kostrzewski and Piotrowski (1991) have shown that initial elimination of toluene from blood upon termination of exposure is rapid, in the range of a few minutes. At an exposure level of 34 ppm, the blood level at 16 hr postexposure was 2% of the maximum blood level reached. Blood levels immediately after exposure reflect time-weighted average (TWA) exposure during the preceding 8 to 10 hr (Foo et al., 1988). Because of the slow release of toluene from adipose tissue (half-life of 80 hrs), blood toluene levels on Monday mornings before work or near the end of the work week were observed to correlate with exposures during the preceding week (Nise et al., 1989). This slow decline in blood toluene has been demonstrated to result in detectable levels in workers who ceased exposure 2 weeks previous to sampling (Nise and Orbaek, 1988).
Urinary hippuric acid levels have generally been used as a biomarker of exposure to toluene. However, because of its short half-life (Lowry, 1987), hippuric acid levels correlate best to acute exposure situations. Blood concentrations of toluene have been reported as the most reliable measure of toluene exposure (Kawai et al., 1993; Brugnone et al., 1995). Mizunuma et al. (1994) found blood toluene to be highly correlated to toluene in air at levels approximating 1 ppm, where hippuric acid measurements as a marker of exposure are no longer useful.
PBPK models are available that describe the kinetics of toluene after inhalation exposure: two for humans (Fisher et al., 1997; Pierce et al., 1996, 1999) and three for rats (DeJongh and Blaauboer, 1996, 1997; Tardif et al., 1993; Van Asperen et al., 2003). These models are modifications of the standard four-compartment PBPK model developed for styrene (Ramsey and Andersen, 1984) in which
• Absorption into the lung blood is assumed to be dependent on the inhaled concentration of toxicant, the concentration of toxicant in alveolar air, blood flow to the lung, blood/air partition coefficient, and alveolar ventilation rates
• Exchange of toxicant between arterial blood and tissue compartments is flow-limited
• Changes in the amount of toxicant in three nonmetabolizing tissue compartments (adipose tissue, slowly perfused tissues, and rapidly perfused tissues) are described by mass transfer differential equations with tissue volume, blood flow through the tissue (i.e., tissue perfusion rate), arterial blood toxicant concentration, and tissue/blood partition coefficients as explanatory variables
• Changes in toxicant amount in the liver (the fourth compartment) are described by similar differential equations that additionally include a Michaelis-Menten term for overall rates of toxicant metabolism
The five-compartment human model for toluene developed by Pierce et al. (1996) includes an additional equation describing mass balance across the lung that has a single Michaelis-Menten metabolic term to represent total toluene metabolism. A five-compartment rat PBPK model developed by DeJongh and Blaauboer (1996) is similar in design to the Tardif et al. (1993) rat PBPK model except that it contains an additional nonmetabolizing compartment representing the brain. The above models have all been partially- or fully-validated using in vivo pharmacokinetic data in the appropriate species. Van Asperen et al. (2003) utilized a five-compartment model that also included a pulmonary blood-alveolar air gas exchange compartment to study the impact of the exposure scenario (constant vs. fluctuating) on the behavior and toxicokinetics of the rat. This analysis utilized high exposure concentrations (27008000 ppm toluene) for short periods of time and found the difference in toxicokinetics after
10
constant or fluctuating exposure at high dose levels to be small but that fluctuating exposure patterns may produce different toxic effects than continuous exposures, even when the external exposure conditions have the same time-weighted average. Another human PBPK model has been developed for volatile organic compounds that models transfer of toxicant via lactation from a mother to a nursing infant, but in vivo pharmacokinetic data for toluene in breast milk were not available to validate this model (Fisher et al., 1997). This model is an adaptation of the Ramsey and Andersen (1984) design with the addition of a fifth compartment, a nonmetabolizing milk compartment with a varying volume. PBPK models for the oral route of exposure and for species other than the rat are not presently available.
4. HAZARD IDENTIFICATION
4.1. STUDIES IN HUMANS
4.1.1. Oral Exposure
Reports of oral exposure to toluene in humans are limited to case reports of accidental acute ingestion. Ameno et al. (1989) reported 15 deaths by accidental oral ingestion of paint thinner containing toluene over the period from 1977 to 1986. A case report of a 51-year-old man who died approximately 30 minutes after he had ingested a large quantity of toluene was presented; the probable cause of death was severe central nervous system depression. Caravati and Bjerk (1997) reported on a case of a 46-year-old man who had ingested approximately one quart of paint thinner containing toluene. The patient presented with severe central nervous system depression, severe abdominal pain, diarrhea, and hemorrhagic gastritis. The patient recovered after 36 hours of supportive care. No reports of chronic oral exposure to toluene in humans were located.
11
4.1.2. Inhalation Exposure
4.1.2.1. Acute and Case Studies
A number of acute studies and case reports following toluene exposure are available in the literature. Many of these studies involve case reports of people who inhaled toluene for its euphoric properties. Toluene abusers who have been exposed for long periods of time exhibit a variety of neurologic manifestations, including ataxia, tremor, anosmia, sensorineural hearing loss, dementia, corticospinal tract dysfunction, abnormal brainstem auditory-evoked potentials, and epileptic seizures (Hormes et al., 1986; Lazar et al., 1983; Sasa et al., 1978; Ron, 1986; Malm and Lying-Tunell, 1980). Abnormal magnetic resonance imaging findings in toluene abusers include generalized cerebral, cerebellar, and brainstem atrophy; atrophy of the corpus callosum; loss of gray-white matter discrimination; multifocal high signal intensity in the cerebral white matter; and hypointensity of the thalami on T2-weighted images (Xiong et al., 1993; Rosenberg et al., 1988a, b). Optic neuropathies with dyschromatopsia, blindness, changes in pattern visual-evoked potentials, pendular nystagmus, ocular flutter, opsoclonus (irregular rapid eye movement), bilateral internuclear ophthalmoplegia, and retinal impairment have been reported in participants who chronically sniffed toluene or toluene-based glue (Hormes et al., 1986; Hunnewell and Miller, 1998; Kiyokawa et al., 1999; Lazar et al., 1983; Poblano et al., 1996; Sasa et al., 1978; Toyonaga et al., 1989; Ehyai and Freemon, 1983). The studies described below do not constitute a complete treatise of the available studies.
Hunnewell and Miller (1998) reported a case study where a 36-year-old chronic toluene abuser exhibited slurred speech, progressive ataxia, blurred vision, and oscillopsia (abnormal jerky eye movement). Examinations showed dysconjugate torsional nystagmus (involuntary eye movement) and bilateral internuclear ophthalmoplegia (ocular motility impairment). Magnetic resonance imaging analysis showed generalized atrophic changes of the brainstem and cerebellum and diffuse atrophy of the corpus callosum.
Kiyokawa et al. (1999) conducted an electrophysiological evaluation of the visual function of patients with toxic neuropathy caused by toluene abuse. Fifteen patients (mean age 25.6 years, eight men and seven women) were diagnosed with bilateral optic neuropathy. Pattern visual evoked cortical potentials (PVECPs) and clinical symptoms were investigated. Evoked potentials reflect the function of the nervous system. Increases in latencies can reflect deficits in
12
nerve conduction and are indicators of neurotoxic effects. Visual acuities at the initial visit were less than 0.1 in 5 cases and 0.1-1.0 in 10 cases. PVECPs were followed up in the 15 cases. At the first recording, PVECP were nonrecordable in both eyes of 11 cases, the P100 peak latency was prolonged in both eyes of 3 cases, and only 1 case showed a normal P100 peak latency. After treatment, visual acuities improved more than 2 lines in 6 cases, 3 of whom showed normal P100 peak latency in the PVECPs. Visual prognosis and PVECP changes were identical in both eyes of all patients. In patients with toluene optic neuropathy, the P100 peak latency of PVECP shortened as visual acuity improved. The authors concluded that PVECP abnormalities in these patients suggest that there is a severe effect on the optic nerve after prolonged exposure to toluene.
Baelum et al. (1985) investigated the effects of acute toluene exposure in 43 printers with long-term occupational exposure to a mixture of solvents, including toluene, and 43 controls with no history of exposure to solvents or other chemicals. The duration of employment for the workers ranged from 9 to 25 years. Each individual was exposed acutely to either 0 or 100 ppm (0 or 377 mg/m3) toluene during a 6.5-hour exposure period, preceded by a 1-hour acclimatization period. These subjects were then subgrouped into printers exposed to toluene (n=20), printers exposed to air (n=23), controls exposed to toluene (n=21), and controls exposed to air (n=22). All subjects carried out a battery of tests for psychometric performance, visual perception, and vigilance evaluation. Both printers and controls complained of nasal and eye irritation, unacceptable air quality, and unacceptable odor level during the toluene exposure. Signs of neurotoxicity, including moderate fatigue, sleepiness, headaches, and a feeling of intoxication, were likewise similarly reported for both groups. A significant decrease in performance was found for the pegboard visual motor function test in the exposed printers but not in the controls exposed to 100 ppm toluene. A decrease in psychometric performance, primarily in visual perception and accuracy, was observed in toluene-exposed individuals. Acute exposure to toluene resulted in a lower performance in 4/10 tests conducted, 3 of the 4 tests in which lower performance was noted evaluated visual perception. The most profound difference between subjects exposed to 100 ppm toluene and those exposed to clean air was observed in the color discrimination test; this difference was seen in both exposed vs. nonexposed printers and exposed vs. nonexposed controls.
In a later study, Baelum et al. (1990) exposed 32 males and 39 females to clean air, 100 ppm (377 mg/m3) toluene, or a varying exposure with a TWA value of 100 ppm which contained peaks of 300 ppm (1131 mg/m3) every 30 minutes for a total of 7 hours. Toluene
13
exposure led to significantly increased complaints about poor air quality, altered noise perception, increased irritation of the nose and lower airways, and a feeling of intoxication, as well as lower scores on a vigilance test. No differences were seen between subjects exposed to the 100 ppm exposure level compared to those who experienced peaks of 300 ppm.
Andersen et al. (1983) exposed 16 young healthy subjects to a single exposure of 0, 10, 40, or 100 ppm of toluene (0, 38, 151, or 377 mg/m3, respectively) for 6 hours under controlled conditions. Toluene exposures did not affect nasal mucus flow or lung function. At 100 ppm, but not at 10 or 40 ppm, subjects reported a subjective irritation of the eyes and nose, as well as headache, dizziness, and feelings of intoxication. In eight tests measuring visual perception, vigilance, psychomotor function, and higher cortical functions, no statistically significant differences were found as a result of toluene exposure.
Nielsen et al. (1985) investigated the renal effects of acute exposure to toluene in 43 male printing trade workers exposed to 382 mg/m3 for 6.5 hours and age-matched with 43 male controls. No significant changes in renal excretion rates of albumin and $-2-microglobulin were apparent during toluene exposure. The results indicate that in this study no causal relationship between moderate exposure to toluene and renal injury exists.
Forty-two college students (21 female and 21 male) were exposed to 0, 74 ppm (279 mg/m3), or 151 ppm (569 mg/m3) toluene for 7 hours over 3 days (Echeverria et al., 1989). Each subject received all three toluene exposure levels on different days. The odor of toluene was masked. A battery of performance tests was administered to each participant prior to starting the exposures and again at 4 and 7 hours during the exposure; the initial test served as a control for those tests performed during the exposure. A 5-10% decrement in performance was considered significant if consistent with a linear trend. Test results for visual perception differed from control values for both exposure levels. Results of a manual dexterity test differed from control values at the higher but not the lower exposure level. Psychomotor test results were unaffected by toluene exposure. Subjective symptomatology increased with exposure, with increasing numbers of complaints of eye irritation, headache, and somnolence.
Muttray et al. (1999) investigated the acute effects of high doses of toluene on color vision. Eight male printshop workers who had been working in the printing industry for 9.8 years (standard deviation [SD] 5.4) were examined before and after cleaning printing containers with pure toluene. After cleaning, concentrations of toluene in blood were between 3.61 and 7.37
14
mg/L. Color vision was tested with the Farnsworth panel D-15 test, the Lanthony desaturated panel D-15 test, and the Standard Pseudoisochromatic Plates part 2. Eight workers of a metal-working factory without any neurotoxic exposure were tested according to the same procedure and served as controls. Acute exposure to toluene did not cause impairment of color vision.
Malm and Lying-Tunell (1980) reported on an 18-year-old girl who had been inhaling pure toluene periodically since the age of twelve. During the last two years, she had increased her abuse to about 1 L in two weeks. She exhibited a loss of appetite, vomiting and weight loss, and, over the last week, found it increasingly difficult to walk and her speech was slurred. A neurological examination in May of 1978 revealed a broad-based ataxic and unsteady gait, decreased coordination between arms and legs, and dysarthria. She had a coarse, spontaneous downbeat nystagmus which increased during stimulation in the horizontal direction. Muscle strength, deep and superficial sensation, and deep tendon reflexes were all normal, but she had a positive Babinski sign bilaterally. Visual loss with a visual acuity of 0.4 in both eyes was also apparent, and the optic discs were pale and her color sense was defective. She was emotionally unstable, with euphoria and a lack of insight into her own condition. During the patients five weeks in the hospital her condition improved; however, when she was discharged from the hospital in July she had a slight dysarthria and an abnormal gait. Reexamination in October revealed clinical deterioration probably due to relapse. Her color sense and visual acuity were still defective. In January, the patients condition improved, with nothing abnormal following physical examination and her visual acuity had improved. The patients clinical condition reflected cerebellar-brain stem involvement, and she showed no definitive evidence of hepatic, renal, or hemopoietic damage of peripheral neuropathy. These signs and symptoms represented more chronic damage, and were not due only to repeated acute intoxications.
4.1.2.2. Pre-chronic and Chronic Studies
A number of subchronic and chronic human studies following toluene exposure are available. The majority of these studies are occupational studies and are described below. Studies with known co-exposure to volatile organic compounds are discussed at the end of this section.
Lee et al. (1988) investigated the prevalence of subjective symptoms of discomfort in shoemakers exposed to toluene with respect to exposure levels. The study population (193
15
women and 65 controls) completed a questionnaire. The exposures were reported as 8-hour TWAs, and workers were grouped in exposure categories of nonexposed, 1-50 ppm, 51-100 ppm, 101-150 ppm, and more than 151 ppm (duration of exposures was not reported). A concentration-dependent increase in prevalence was reported for 25/67 symptoms with increases in complaints over controls occurring at around 100 ppm (377 mg/m3). Similar to the Yin et al. (1987) study described later, reported symptoms included headache, sore throat, and dizziness. No objective measures of toxicity were examined. No NOAEL or LOAEL levels were identified for this study.
Orbaek and Nise (1989) examined 20 Swedish rotogravure printers compared to 72 controls for reported neurologic symptoms and alterations in psychometric test performance. The exposed workers were in two plants, with mean time-weighted exposure levels of 43 mg/m3
(11 ppm; 9 workers) and 157 mg/m3 (42 ppm; 11 workers) toluene. The groups of workers were pooled for analysis. Prior to 1980, the exposure levels had exceeded 300 mg/m3. Employment times ranged from 4 to 43 years, with a median of 29 years. Compared to the controls, the printers complained of most of the neurasthenic symptoms evaluated, including fatigue, memory loss, depression, concentration difficulty, headache, dizziness, and paresthesia. Age-adjusted test comparisons to referent performance showed significantly lower scores for the printers in the Synonyms, Benton (correct and errors), and Digit Symbol tests. However, present toluene exposure level was only weakly associated with the test results. Pooling the workers at differing exposure levels for analysis adds uncertainty as to the appropriate exposure levels associated with the responses, thus no NOAEL or LOAEL values were identified for this study.
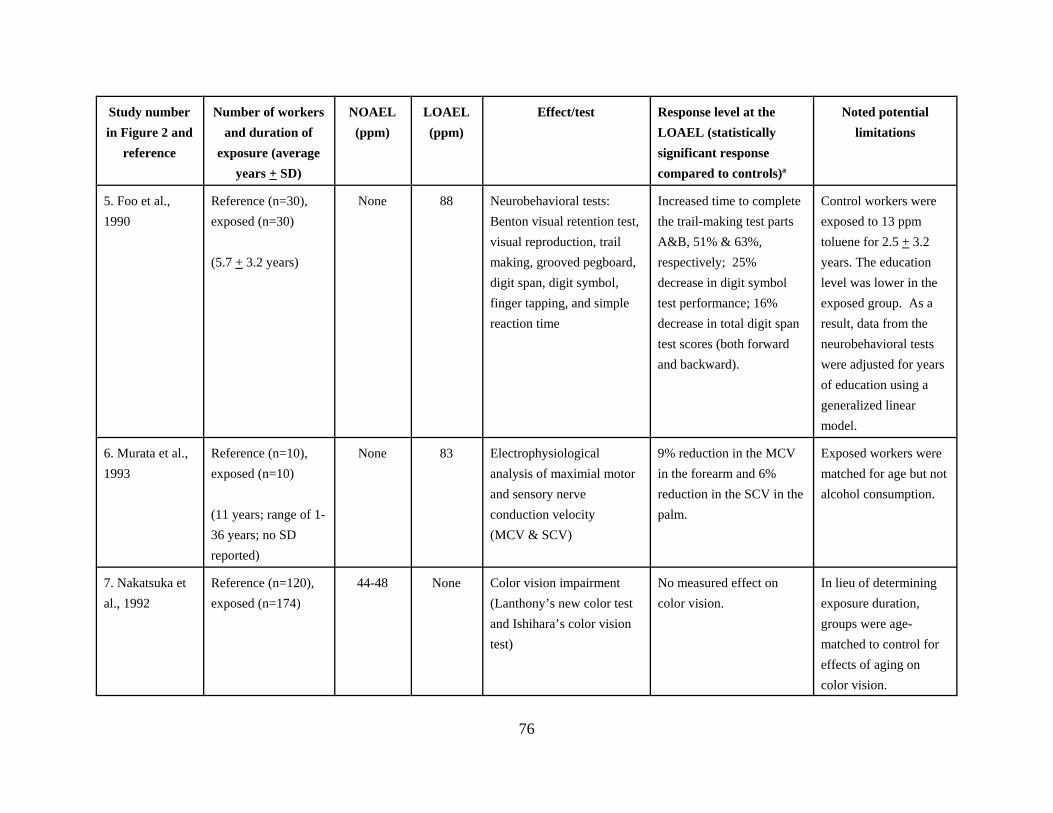
Foo et al. (1990) conducted a cross-sectional study involving 30 exposed female workers employed at an electronic assembly plant where toluene was emitted from glue. Toluene levels reported in the study were acquired using personal sample monitoring and reported as an 8-hour TWA, although the number of samples taken and the actual sampling period were not given. The exposed and control cohorts (n=30) were matched for age, ethnicity, and use of medications. Members of these cohorts did not use alcohol and were nonsmokers. Medical histories were taken to eliminate any histories of central or peripheral nervous system disorders. The average number of years (± SD) worked by the exposed population was 5.7 ± 3.2 and by the controls was 2.5 ± 2.7. Personal air samplers indicated that exposed workers breathed mean toluene air levels of 88 ppm (332 mg/m3) as a TWA and control workers breathed a mean of 13 ppm (49 mg/m3) (TWA). A battery of eight neurobehavioral tests were administered to all exposed and control workers. The tests were performed midweek, before the workers reported to their stations for the
16
day. Group means revealed statistically significant differences in 6/8 tests, including tests measuring manual dexterity (grooved pegboard), visual scanning (trail making, visual reproduction, Benton visual retention and digit symbol), and verbal memory (digit span). When individual test results were linearly regressed against personal exposure concentrations, the slopes of the regression lines were all significantly nonzero, indicating performance was related to toluene exposure. Irritation effects were not evaluated in this study, and clinical signs or symptoms were not reported. This study identified a LOAEL of 88 ppm of toluene for neurobehavioral changes. Control workers were exposed to 13 ppm toluene.
Nakatsuka et al. (1992) investigated color vision impairment in 111 women and 63 men employed in paint production or paint application plants. The reference population included 72 women and 48 men with no known occupational exposure to solvents. Solvent exposure was characterized as being more than 90% toluene with a geometric mean concentration of 44.1 ± 3.35 (mean ± SD) ppm and 47.5 ± 3.93 ppm for men and women, respectively. Exposure duration was not reported but mean age of exposed workers was 31.4 for men and 33.1 for men and women, respectively. Effects on color vision (dyschromatopsia) were examined using Lanthony’s new color test and Ishihara’ color vision test. No statistical significance in the prevalence of color vision impairment in workers was found in comparison to controls. No NOAEL or LOAEL was identified but the low dose (44 ppm) was without effect.
Abbate et al. (1993) conducted examinations of neurologic effects of toluene exposure by brainstem response audiometry on 40 rotogravure printing workers who had been exposed to an average of 97 ppm (366 mg/m3) toluene, measured in the individual work places on the day of testing, for 12-14 years and 40 matched controls. All workers had normal hearing capacity. Examinations taken at random addressing one ear of each subject determined the brainstem auditory evoked potential with 11 and 90 second stimulus repetitions per second. Statistical analysis was performed on the latencies of waves I, III, and V generated. The mean latencies in evoked potentials were significantly higher in the exposed group relative to controls for each latency interval. This study identified a LOAEL of 97 ppm for increased wave latencies for auditory-evoked brain potentials; no NOAEL was identified.
Murata et al. (1993) examined 10 rotogravure printers from Saitama and 10 controls for differences in electrocardiographic R-R intervals (CVRR and C-CVHF), the distribution of nerve conduction velocities (DCV), and the maximal motor and sensory nerve conduction velocities (MCV and SCV) in the median nerve. Toluene exposure was estimated to be 83 ppm (313
17
mg/m3) with a mean exposure duration of 11 years (range of 1-36). Exposed workers were matched for age but not alcohol consumption. Blood samples for toluene analysis were taken before electrophysiological testing during normal working hours, while urine samples for hippuric acid analysis were taken at 5:00 p.m. the day following electrophysiological analysis. CVRR and C-CVHF were significantly reduced in the toluene-exposed workers, as were MCV in the forearm and SCV in the palm. MCV in the palm and SCV in the forearm were not significantly different from controls. The electrophysiological data were not significantly correlated with blood toluene or urinary hippuric acid levels or with exposure duration. This study identified a LOAEL of 83 ppm for alterations in electrophysiological parameters; no NOAEL was identified.
Muttray et al. (1995) investigated whether toluene can cause color vision impairment. The exposed group consisted of 59 male rotogravure workers with a mean age of 36 (17 to 57 years) and a mean rotogravure employment time of 10 years (one month to 36 years). Toluene and ethanol concentrations in worker blood were measured on Monday and Friday immediately prior to the color vision testing. Some subjects possessed blood toluene levels as high as 3 mg/L. Eight subjects had blood ethanol concentrations above 25 mg/L and were excluded from the analysis. The toluene concentrations in the workers increased from Monday to Friday. Color vision testing was done prior to Monday’s shift and after Friday’s shift and used a self-constructed grey box with a daylight lamp. The subjects’ eyes were examined separately, before shift on Monday and after shift on Friday, in the following tests: Farnsworth panel D-15, Lanthony desaturated panel D-15, Velhagen plates, and the Standard Pseudoisochromatic plates part 2. The color confusion indices were slightly lower on Friday than on Monday, and the intraindividual toluene concentrations were not related to the color confusion indices variations. Chronically-exposed workers were not compared to nonexposed controls. From these results, an influence of toluene concentration on the color confusion indices could not be shown.
Vrca et al. (1995, 1996, 1997) examined a group of 49 Croatian rotogravure printing workers relative to 59 controls for alterations in visual-evoked potentials (VEP) (Vrca et al., 1995) and changes in brainstem auditory-evoked potentials (BAEPs) (Vrca et al., 1996, 1997) as measured with a brain imager. Average length of work service for the printers and controls was 21.4 years (range 4-30, SD 7.4) and 20.6 years (range 4-32, SD 7.7), respectively. Exposure concentrations in air were not measured. Toluene in peripheral blood was measured Wednesday morning before entering the work area, while urinary levels of hippuric acid and ortho-cresol were determined both before and after the Wednesday work shift. Parameters of exposure were
18
measured in the morning in the middle of the workweek and are thought to give the best approximation for the whole workweek (WHO, 1985) because, in the case of exposure to low levels of toluene, low body accumulation occurs. The exposure levels were estimated to range from 40 to 60 ppm (151-226 mg/m3) based on the average concentration of hippuric acid in urine after the work shift. Of the three VEP waves examined (N75, N100, and N145), significant increases in amplitude were seen for all three, but no differences in time of wave onset, time of wave offset, total duration of each wave, or total duration of all waves combined were noted between the exposed and control groups (Vrca et al., 1995). Effects on BAEP waves P1 through P5 were also examined and reported in Vrca et al. (1996, 1997). A significant decrease in wave amplitude and prolongation of P1 wave latency and an increased interval of interpeak latencies (P3-P5) was found in exposed workers. There was a statistically significant correlation between latency of the waves and the length of exposure for all waves except the P2 wave (Vrca et al., 1997). Wave latency was significantly longer in exposed subjects, which, according to the authors, could account for the reduced conduction in certain segments of the visual pathway. No correlation between wave amplitude and exposure length was seen. Combined, these studies identify a LOAEL of 40-60 ppm for alterations in visual- and auditory-evoked brain potentials; no NOAEL was identified.
Boey et al. (1997) examined a group of 29 electronics workers from Singapore who were occupationally exposed to toluene for neurobehavioral changes relative to a group of 29 controls. The TWA level of toluene in air was 90.9 ppm (343 mg/m3) as assessed by passive absorption monitors on the day of testing. Mean blood concentrations of toluene at the end of the work shift were 1.25 μg/L (SD = 0.37 μg/L). Occupational exposure in this group was for an average of 4.9 years (range of 1 to 13 years; SD = 3.5 years). The controls were found to have been exposed to 12.2 ppm of toluene (46 mg/m3). Measured tests included logical memory, digit span, visual reproduction, Benton visual retention test, trail making test, symbol digit modality test, grooved pegboard test, and finger tapping tests. Performance of the exposed workers was found to be decreased in a statistically significant manner relative to controls for the digit span, visual reproduction, trail making, symbol digit modality, and grooved pegboard tests. This study identified a LOAEL of 90.9 ppm for neurobehavioral alterations; no NOAEL was identified. Control workers were exposed to 12 ppm toluene.
Morata et al. (1997) examined 124 workers at a rotogravure printing facility in Brazil for changes in hearing. No control subjects were reported. Toluene levels in the air ranged from 0.14 to 919 mg/m3 (0.04 to 243 ppm). Workers were exposed to varying levels of noise and an
19
organic solvent mixture of toluene, ethyl acetate, and ethanol. Exposure times ranged from 1 to 25 years with a mean of 7 years. Hippuric acid in urine was utilized to assess total toluene exposure in 109 of the workers. The workers underwent pure-tone audiometry and immittance audiometry testing. Forty-nine percent of the workers had hearing loss. While a number of other variables were considered, only the age of the subject and hippuric acid content of the urine showed significant correlations with hearing loss. The odds ratio estimates for hearing loss were 1.07 times greater for each increment of 1 year of age (95% confidence interval [95% CI] 1.031.11) and 1.76 times greater for each gram of hippuric acid per gram of creatinine (95% CI 1.002.98). No NOAEL or LOAEL was identified.
Stengel et al. (1998) assessed immunologic and early renal effects of chronic toluene exposure in a longitudinal study of 92 printers and 74 control subjects. Pre- and post-study samples of blood and urine were taken for the following measurements: immunoglobulin E (IgE), antiglomerular basement membrane (anti-GBM), and antilaminin (anti-LAM) antibodies in blood; creatinine and $2-microglobulin in blood and urine; and microalbumin, N-acetyl-$-D-glucosaminidase (NAG), and alanine-aminopeptidase in urine. Creatinine clearance was calculated according to the Cockroft-Gault formula. Eight-hour personal air samples were collected twice to assess present exposure to toluene. The mean exposure concentration was 50 ppm (187 mg/m3; range of 26 to 62 ppm). A job-exposure matrix was developed to estimate past cumulative exposure. The mean duration of exposure was 16.3 years (SD 13.1) and 16.9 years (SD 12.2) for exposed and control workers, respectively. Information about potential confounders was recorded by questionnaire. Multiple regression analysis was performed to study dose-effect relations adjusted for age and smoking. No relationship was observed between the markers studied and present exposure to toluene except that creatinine clearance was higher among the exposed subjects than among the controls. A dose-response relationship for the exposed group was observed between cumulative toluene exposure and both IgE and NAG excretion. No relationship was observed between hypertension and exposure, but the relationship with NAG did not persist when subjects with hypertension were excluded. Toluene exposure at 50 ppm was not related to detectable renal dysfunction. A NOAEL of 50 ppm was identified.
Zavalic et al. (1998a) examined two groups of Croatian workers occupationally exposed to toluene for effects on color vision relative to a group of unexposed controls. One exposure group (group E1) consisted of 46 workers (3 men, 43 women) employed gluing shoe soles, while the second group (group E2) consisted of 37 workers (34 men, 3 women) employed in a
20
rotogravure printing press. Mean exposure times were 16.21 ± 6.1 (mean ± SD) years for group E1 and 18.34 ± 6.03 years for group E2. The control group consisted of 90 workers (61 men, 29 women) who were not occupationally exposed to solvents. For all groups, smoking and alcohol consumption information was collected.
Air samples were collected for both exposure groups with stationary monitors. Median airborne toluene concentrations were 32 ppm (121 mg/m3; range of 11.3-49.3 ppm) for group E1 and 132 ppm (498 mg/m3; range of 66-250 ppm) for group E2. Toluene concentrations of blood samples were determined, and urine samples were analyzed for ortho-cresol and hippuric acid. Analysis of color vision was performed using the Lanthony D-15 desaturated panel. Results are reported as the color confusion index (CCI) or age- and alcohol intake-adjusted color confusion index (AACCI).
In the high-exposure group (group E2), there were statistically significant correlations between concentrations of toluene in the work-space air and toluene in blood, ortho-cresol in urine, and hippuric acid in urine. CCI scores on both Wednesday and Monday were significantly higher in group E2 (1.29 ± 0.10 [mean ± SD] and 1.30 ± 0.11, respectively) relative to both controls (1.15 ± 0.10 and 1.14 ± 0.10, respectively) and to group E1 (1.17 ± 0.08 and 1.18 ± 0.10, respectively). CCI scores for group E1 were not significantly different from controls at any time examined. In all groups, including controls, a statistically significant correlation between CCI and both age and alcohol consumption was reported. CCI scores for those workers who consumed no alcoholic beverages at all were significantly greater for group E1 (1.17 ± 0.08 and 1.17 ± 0.08, respectively) than for nonconsumers in the control group (1.13 ± 0.08 and 1.13 ± 0.09, respectively); however, age-matching of these two subgroups was not reported. Given the dependence on age and alcohol intake, the AACCI scores are considered more relevant indicators of exposure-related color vision impairment than CCI scores.
The AACCI scores were significantly higher (p<0.05) for group E2, but not group E1, compared to controls. AACCI scores for group E2 were significantly correlated with toluene in blood, toluene in air, ortho-cresol in urine, and hippuric acid in urine. Actual data points (or mean ± SD) for AACCI scores were not reported; the results were presented graphically. This study identified a NOAEL of 32 ppm (121 mg/m3; group E1) and a LOAEL of 132 ppm (498 mg/m3; group E2) for alterations in color vision in toluene-exposed workers based on AACCI scores.
21
Further analysis of color vision loss in the same groups of workers described above (Zavalic et al., 1998a) was carried out to compare loss in the blue-yellow and red-green ranges (Zavalic et al., 1996, 1998b,c). Zavalic et al. (1996) evaluated qualitative color vision impairment in the men from the high exposure group (E2) and controls using the Lanthony D-15 desaturated panel according to Bowman’s Method. In the control group, nine (31%) group members were found to have a blue-yellow range impairment and 20 (69%) had normal color vision. In the exposed group, the blue-yellow range was impaired in 15 (37%) group members; one (2%) had a complex impairment, and 26 (63%) had normal color vision. There was no significant difference in the prevalence of impairment in the blue-yellow range between the examined groups, although the impairment in the exposed group was higher than in the control.
Zavalic et al. (1998b) evaluated qualitative color vision impairment in the E2 group and controls using the Lanthony D-15 desaturated panel. Using the Verriest classification, color vision impairment was described as type I, loss in the red-green range; type II, loss in the blue-yellow and red-green ranges; and type III, loss in the blue-yellow range. Subjects were classified as dyschromates if specific acquired loss was determined in at least one eye. Both blue-yellow and red-green color confusion were significantly increased in the exposed group compared to controls, but there was no significant difference in the prevalence of either type of color confusion.
Zavalic et al. (1998c) further evaluated qualitative color vision impairment in groups E1 and E2 and controls. Type III dyschromatopsia (see definition in study description above) was detected in all groups examined: 26.6% of the workers in the nonexposed group, 31.7% of the workers in group E1, and 50% of those in group E2. As many as 15.6% of the workers in group E2, 4.8% of those in group E1, and 1.2% of those in the nonexposed group had type II impairment. A statistically significant difference in the prevalence of total dyschromatopsia (type II + type III) was established among the three groups together (p<0.01), between group E2 and E1 (p<0.05), and between group E2 and the nonexposed group (p<0.005), whereas no significant decrease was found between group E1 and the nonexposed group. Type III impairment was significantly correlated with age in the nonexposed group (p<0.01) and group E1 (p<0.005). In group E2, both type II (p<0.05) and type III impairment correlated with toluene in ambient air and with duration of exposure to toluene (both p<0.005). In group E2, total dyschromatopsia correlated with toluene in ambient air and in blood (both p<0.05) as well as with hippuric acid in urine (p<0.001).
22
Plenge-Bönig and Karmaus (1999) conducted a cross-sectional study of 150 male and 90 female printing industry workers in order to examine human fertility and occupational toluene exposure. The ages of the male subjects were similar to the ages of all the male employees in the participating companies, while the women subjects were younger than their counterparts in the participating companies. Face-to-face interviews were conducted in the employees homes using a modified questionnaire from the European study on infertility and subfecundity, and gathered information pertaining to history of every period that could have ended in pregnancy (this included time to pregnancy (TTP) and periods of unprotected intercourse not leading to pregnancy (PUNPs); together, the two period terms are called time of unprotected intercourse (TUI), data on pelvic inflammatory diseases, work history data, and lifestyle factors. Exposure categories corresponding to low, medium, and high exposures were developed, based on work history and exposure measurements from previous years that were conducted by industrial hygienists of the Employer’s Liability Insurer. The actual level of exposure to toluene or other solvents was not determined. The TUIs for men and women were then assigned to the different exposure categories based on corresponding time windows. In partnerships with men in the study, 256 pregnancies were reported, while the women reported 174 pregnancies. In men, 162 TTPs and seven PUNPs resulted after excluding terminated pregnancies, pregnancies with missing data, and pregnancies due to failed contraception. In women, 100 pregnancies were available after incorporating exclusion criteria. An association between occupational toluene exposure and subfecundity in men and their partners was not apparent but cannot be excluded. However, a significant reduction in the fecundability of female employees in exposed areas during periods of unprotected intercourse was found.
Eller et al. (1999) reported on the neurological effects of 98 male Danish photogravure printers chronically exposed to toluene. The study population consisted of 10 lithographers, 42 typographers, 23 printing workers and 23 employees with other work functions, including blacksmiths, electricians, and executive staff/foremen. Workers were divided into three groups: no exposure to organic solvents (Group 0; n=19); those exposed to <20 ppm toluene for 1-12 years (Group 1; n=30); or those exposed for greater than 12 years (Group 2; n=49). Workers exposed for greater than 12 years may have been exposed to levels exceeding 100 ppm (377 mg/m3) for up to 27 years. Exposure levels were estimated from multiple historical measurements of ambient air, personal air, etc. The workers were examined neuropsychologically using a Cognitive Function Scanner and neurologically by computerized methods measuring coordination ability, tremor, and position stability. For the scores of self-reported symptoms, Group 0 and Group 1 were found to be similar, while Group 2 showed a
23
statistically significantly higher incidence of symptoms relative to controls, even after correction for age and alcohol consumption. In neurological tests, no differences between Group 1 and controls were noted. Group 2 showed a statistically significantly poorer performance relative to the other groups on 1 of 7 neurological tests and 2 of 5 sets of neuropsychological tests. The tests that were significantly altered were left-hand finger tapping, retention times in the number learning test, and total time in the Bourdon-Wiersma test. This study identified a NOAEL of 2532 ppm and a LOAEL of >100 ppm for increases in subjective symptoms and decreased performance in neurologic tests.
Cavalleri et al. (2000) examined a cohort of 33 rubber workers (mean exposure duration, 117 months) and 16 referents for changes in color vision, as evaluated by the Lanthony D-15 desaturated panel. Urine samples were taken at the end of the day and analyzed for unmetabolized toluene. Exposure was estimated as cumulative exposure since no changes in production technology had been introduced into the factory during the past few years and no significant variation in occupational exposure to toluene was expected. An index value was calculated that was representative of the total cumulative exposure to toluene: cumulative exposure = unmetabolized toluene (μg/L) x exposure duration (months). The mean value of unmetabolized toluene was 63 μg/L (SD = 27 μg/L). On the basis of previous data (Ghittori et al., 1987), this value was calculated to correspond to an environmental level of toluene of about 42 ppm. Exposure to other solvents (i.e., n-hexane, xylene, methyl isobutyl ketone, and ethyl acetate) was monitored on several occasions, and levels were well below 1/100 of the occupational threshold limit at the time. Thus, the authors considered exposure to these solvents as nonrelevant. Exposed workers showed significant impairments in color vision, as evidenced by increases in CCI or total confusion index (TOTCI) scores, relative to control workers. However, while the indices of color vision showed linear correlations with the product of the urinary toluene and total exposure duration, airborne levels of toluene cannot be determined from the data presented in the manuscript. This study did not identify exposure levels of toluene, but correlated response with urinary toluene levels. Statistically significant effects on color vision were observed at an estimated exposure level of 42 ppm; no NOAEL was identified.
Neubert et al. (2001) and Gericke et al. (2001) reported on the health effects of toluene exposure in a controlled, multicenter, blinded field trial in German rotagravure workers. Medical examinations (inquiries on subjective symptoms and standard tests of psychophysiological and psychomotor functions) were performed on almost 1500 volunteers of whom 1290 were toluene-exposed (1178 men and 112 women) and about 200 served as controls (157 men and 37 women).
24
Exposure groups were further categorized into experimental groups I-IV based on blood toluene levels. The psychophysiologic and psychomotor tests used included digit span (verbal memory span), digit symbol (visuomotor performance), visual reproduction test (immediate visual memory), scales of self-feeling (self-rating of feeling), Wiener reaction test (auditory and visual vigilance), critical flicker fusion frequency test, and personality dispositions. All volunteers were from the morning shift (6 hours exposure on the day of testing). Both individual ambient air concentrations (TWA) during the work shift as well as blood toluene concentrations after the work shift were measured. For the endpoints evaluated, neither blood toluene levels of 850 to 1700 μg/L (high exposure group) nor ambient air concentrations (between 50 and 100 ppm or 188-375 mg/m3) were associated with alterations in subjective symptoms or performance on medical examinations. A statistically significant reduction in ascending flicker fusion frequency was noted at blood toluene levels approximating 81 ppm toluene exposure. A LOAEL of 81 ppm based on decreases in flicker fusion frequency and a NOAEL of 39 ppm can be identified.
Additional adverse health effects associated with chronic toluene exposure in the above field trial were evaluated by Gericke et al. (2001). Male volunteers (n=1226) were recruited, and information on exposure and medical data was compiled for 1077 men in total. Evaluations included a physical examination, standard tests of psychophysiological and psychomotor performance (identified above), self-reporting of subjective symptoms, and data on a variety of laboratory blood tests. The medical data were correlated with the length of toluene exposure and an estimate of the extent of exposure (i.e., highly exposed printers vs. other workers with negligible exposure). An examination of the influence of duration of exposure found no significant correlation to any effect that did not demonstrate a similar correlation with age, a covariable for length of employment. Volunteers reported a significant increased incidence of insomnia, dry mucus membranes, and allergies when compared to a reference population. Neither the exposure classification nor duration of exposure for the individuals reporting these symptoms were presented.
Chouaniere et al. (2002) conducted a cross-sectional study in two printing plants on 129 workers who were exposed to low levels of toluene. Ambient air sampling indicated toluene concentrations of 1 to 18 ppm in an offset printing plant and from 2 to 27 ppm in a heliogravure plant. Workers answered a self-administered questionnaire on neurotoxic symptoms and performed six psychometric tests on a computer-assisted version of battery studies. After adjustment for confounders, statistically significant changes were found in performance in Digit Span Forwards tests (decrement is 1 digit for 40 ppm; p<0.04) and Digit Span Backwards tests
25
(decrement is 1 digit for 25 ppm; p<0.01). Neurotoxic self-reported symptoms were not statistically significantly correlated with current exposure. Cumulative exposure to toluene was also estimated. No association was found between estimated cumulative exposure and either psychometric performance or neurotoxic symptoms. Statistically significant effects on psychomotor performance were observed for doses that would be equivalent to 25 and 40 ppm (exposure levels not measure but estimated based on test results). No controls were utilized in this study.
Zupanic et al. (2002) studied psychomotor performance and subjective symptoms in 278 male workers from 14 German rotogravure printing plants. The workers were divided into two exposure groups. Printers or print helpers from the rotogravure printing area with moderate exposure formed the exposed group (n=154). Workers with low exposure to toluene from the end processing area of the same plants were considered to be controls (n=124). The mean duration of employment was 15.3 years (SD=9.7; range of 7.5 to 23.3) for the exposed workers and 14.5 years (SD=8.6; range of 7.5 to 19.8) for the controls. Individual exposure to toluene was measured by two variables reflecting long-term and current exposure. Long-term exposure was calculated as lifetime weighted average exposure (LWAE). The calculation was based on individual job exposure matrices that were based on interviews related to job contact with toluene. These data were combined with historical measurements of toluene measurements in the air from five printing plants over the last three decades. The product of the different concentrations of toluene for different jobs (cumulative lifetime exposure) was weighted by the exposure time of a worker’s life (LWAE). The current exposure to toluene was calculated as the mean of two to four measurements during normal working days with active sampling in the breathing zone. A mean LWAE of 45.1 ppm (SD=16.4; range of 34.2 to 57.9) toluene in air for exposed workers with a mean current exposure of 24.7 ppm (SD=17.6; range of 11.1 to 34.5) was found. Likewise, a mean LWAE of 9.3 ppm (SD=7.6; range of 5.8 to 10.6) toluene in air for control workers with a mean current exposure of 3.3 ppm (SD=4.8; range of 1.3 to 2.9) was found.
Psychomotor performance was determined by five subtests of the computer administered test battery motor performance series. The subtests included measures of steadiness, line tracing, aiming, tapping, and pegboard. The tests were performed in sequence to examine dynamic and static elements of psychomotor performance of the upper limbs. Subjective symptoms were measured with the psychological-neurological questionnaire, which includes information on psycho- and neurovegetative lability, neurological symptoms, lack of activation and motivation,
26
excitability, lack of concentration and memory difficulties, and special symptoms that appear in subjects exposed to neurotoxicants (alcohol intolerance and unpleasant taste and smell). No statistically significant differences were found between the two exposure groups. The results indicate no dose-response relationship for psychomotor functions and subjective symptoms among workers exposed to mean current concentrations of toluene of 3.3 and 24.7 ppm in air or mean LWAE concentrations of 9.3 and 45.1 ppm.
Schaper et al. (2003) studied the ototoxicity of occupational exposure to toluene in a longitudinal study over 5 years with four repeated examinations of 333 male workers from rotogravure printing plants. Past LWAE to toluene and noise were determined from individual work histories, and recent individual exposures were measured 10 times during the study by active sampling. The auditory thresholds were measured with pure tone audiometry. The mean LWAE exposures to toluene were 45 ppm (SD 17) for printers (high toluene exposure) and 10 ppm (SD 7.1) for end processors (low toluene exposure). The mean current exposures to toluene during the study were 26 ppm (SD 20) for printers and 3 ppm (SD 3) for end processors. Repeated measurement analyses (grouping factors: toluene intensity, exposure duration, and noise intensity) and logistic regressions did not reveal statistically significant effects of toluene intensity, of exposure duration, and of interactions between toluene intensity and noise intensity. A NOAEL of 45 ppm was identified for LWAE and 26 ppm for current exposure.
Tanaka et al. (2003) examined the health hazard, including dysfunction of the nervous system, of low toluene exposure in factories. A self-administered questionnaire was used to gather information on subjective symptoms and was provided to 20 workers in low toluene exposure factories. Environmental levels of toluene were collected using gas detection tubes and urinary samples were collected to measure hippuric acid levels in the 20 subjects. Urinary samples were collected before the workday began, after the forenoon work period, and following the end of the afternoon work period. The toluene concentration of the ambient air throughout the workday ranged between 15.3 and 31.4 ppm. The urinary hippuric acid concentration correlated with the toluene concentration in the air, and the increase in subjective symptoms and the exposure to toluene were closely associated. The prevalence rate of subjective symptoms during work and off work were 15 and 2.4 times, respectively, higher in the exposed group compared to the nonexposed group. In addition, a group of 19 off-work symptoms, which have been associated with the central nervous and autonomic nervous systems, had a prevalence rate 1.8 times higher in the exposed versus nonexposed group.
27
Seeber et al. (2004) conducted a follow-up study of employees from 14 magazine rotary printing plants to analyze the potential health effects of toluene exposure. A two-factor stratification was used to categorize the 333 workers based on the following factors: high toluene exposure (printing area) and low toluene exposure (end processing) and short vs. long duration of exposure. The initial 333 subjects available were reduced to 216 by the end of the evaluations for various, but not sufficiently different, reasons; however, the proportions between the groups remained stable. From the 216 workers, 192 subjects were available for all examinations and this subsample was analyzed in the repeated measurements evaluation. Toluene exposure measurements (n=2521) were collected two times per year during the workday by individual air sampling within the worker’s breathing zone. An individual LWAE was calculated to provide information on past exposures. The past exposure data was developed using a job exposure matrix with four job classes and four time periods. The high and low exposure groups had a current exposure of 26 ppm and 3 ppm, respectively, and a past exposure of 45 ppm and 9 ppm, respectively. Blood ethanol levels were analyzed; only three samples yielded a concentration with the potential to cause psychological effects. Psychological (attention and memory) and psychomotor effects were analyzed. The symbol digit substitution and switching attention tests (from EURONES) and the simple reaction test (from SPES) were used to test for attention effects. For memory effects, the digit span test (from EURONES) and subtests from a screening test for psycho-organic syndrome (from Syndrom Kurztest) were used. To study psychomotor function, a computer-administered test battery for motor performance (Motorsiche Leistungsserie) with five subset tests (steadiness, line tracing, aiming, tapping, pegboard) was used. The only test that displayed an apparent exposure effect was for line tracing, in which longer error times were experienced for the high exposure group. Overall, there was no evidence of prolonged reaction times, attention deficits or memory deficits attributable to the high exposure groups.
Studies with known co-exposure to volatile organic compounds
Antti-Poika et al. (1985) examined the neurotoxic effects of toluene in 43 male rotogravure printers exposed to toluene. The mean age of workers was 41 years and the mean duration of exposure was 21.7 years (range of 11-40). A control group of 31 male offset printers of the same age with some exposure to aliphatic hydrocarbons (mineral oils and isopropyl alcohol; amounts not identified) was studied for comparison. A neurological examination, tests for autonomic nervous function, electroencephalography, psychological tests, and computerized tomography of the brain were carried out in addition to a standardized interview. Exposure levels
28
were evaluated for each person separately on the basis of his work history and the results of an earlier study on exposure levels at the same printing shops. Besides a thorough history of alcohol consumption, information about the printers’ drinking habits was obtained from the occupational health care centers of the printing shops. The examinations found only slight abnormalities, and there were no statistically significant group differences in the prevalences of abnormalities. No correlations between the abnormalities and the exposure indices were found. This study detected no clinically significant abnormalities attributable to toluene exposure alone among workers exposed to 68-185 ppm (mean 117) of toluene.
Yin et al. (1987) reported on a cohort of over 300 Chinese solvent workers, 94 of whom (38 men, 65 women) were exposed primarily to toluene at a mean concentration of 42.8 ppm (161 mg/m3) relative to 129 controls. Workers were co-exposed to 1.3 ppm benzene. Serum lactate dehydrogenase activity was statistically significantly decreased in males and females, and leucine aminopeptidase activity was statistically significantly decreased in females only relative to controls. Levels of inorganic phosphorus in the serum of exposed male workers, but not female workers, were also significantly lower than controls. In considering the prevalence of subjective symptoms (sore throat, headache, and dizziness), workers were subgrouped into low (6-39 ppm, n=28) and high (40-123 ppm, n=29) exposure categories by the study authors. Although the prevalence of subjective symptoms was significantly higher in the exposed workers compared with the control cohort (p<0.01), a concentration-response relationship was not discernable among the groups. No other treatment-related effects were reported. The study was limited because the exposed and unexposed groups were not matched to controls for confounding effects (e.g., age, smoking, alcohol consumption). This study identified a LOAEL of 43 ppm for increases in subjective symptoms in exposed workers; no NOAEL was identified.
Campagna et al. (2001) examined the relationship between acquired color vision loss and exposure to toluene and total hydrocarbons among 125 male workers in France. Seventy-two toluene-exposed printers were compared with 34 workers from the same photogravure plant with ambient background exposure and with 19 workers from a bookbinding plant located in the same town (nonexposed). Duration of employment was 8 years (range of 1-35), 19 years (range of 2 to 37), and 18 years (range of 1-36) for the control, ambient exposure, and exposed groups, respectively. The mean toluene exposure level at each individual workstation was estimated from 8-hour sampling on two separate occasions. No blood or urine sampling for toluene or metabolites was conducted. The mean toluene exposure was 36 ppm (136 mg/m3; range of 5th
and 95th percentiles of 13 to 79) and 8 ppm (32 mg/m3; range of 5th and 95th percentiles 4 to 20)
29
for the exposed group and ambient exposure group, respectively. Historic exposure data from the last 30 years were used to construct two cumulative exposure indices, one for toluene and one for total hydrocarbons. The exposed and ambient exposure groups had a history of exposure to hydrocarbon compounds in addition to toluene. Although in recent years changes in manufacturing practice resulted in almost exclusive exposure to toluene, when expressed as cumulative exposure (mg/m3 x years of exposure), toluene cumulative exposure accounted for about 72% of the total hydrocarbon exposure for the exposed group but only 56% of the total hydrocarbon exposure of the ambient exposure group (calculated from Table 2 of Campagna et al., 2001). Thus, the ambient exposure group, in particular, had a substantial proportion of their total cumulative exposure from compounds other than toluene.
Campagna et al. (2001) compared CCI values in the three groups of workers. The mean ages of the groups differed somewhat with the mean age of the exposed group being 40 years, the ambient exposure group was 43 years, and that of the nonexposed group was 37 years. CCI values are known to increase with age. The participants in the Campagna et al. (2001) study were all men. The difference of age between the nonexposed and ambient group was a mean of 6 years. The differences observed in CCI scores was a difference of 0.11 CCI, which is approximately half of the difference observed due to age by Iregren et al. (2002) for the relevant 3 and 4 decades. Thus, the differences in CCI values between the ambient exposed and nonexposed groups could perhaps be attributed to the mean age difference between these two groups. A regression analysis was conducted on the combined data sets from all groups that indicated a significant effect of age and a significant effect of toluene exposure when adjusting for age and alcohol consumption. No information was presented as to whether the ambient exposure group was statistically different from the nonexposed group when age was adjusted.
The testing of visual function was performed within the first 3 hours of a day work shift. Color vision was assessed by the Lanthony D-15 desaturated panel. Color vision loss was quantitatively established by the CCI and classified by type of acquired dyschromatopsia according to Verriest’s classification. A higher proportion of participants was affected with acquired dyschromatopsia (type I, II, or III) in the exposed worker group (52% among exposed participants and 56% among the group with an ambient exposure) than in the nonexposed group (21%). CCI was positively related to current airborne toluene levels, and cumulative exposure indices for toluene and total hydrocarbons (0.18 # r # 0.35). The CCI values for the mean (range) of both eyes were 1.08 (1.00-1.36), 1.19 (1.00-1.72), and 1.23 (1.00-1.81). Adjustment for age, daily alcohol consumption, and duration of employment did not modify these
30
relationships. Odds ratios of acquired dyschromatopsia were statistically significant for current airborne toluene and toluene and total hydrocarbon past exposure (1.27 [1.02-1.58], 1.21 [1.04-1.39], 1.15 [1.02-1.31], respectively). Statistically significant effects on color vision were noted at 8 ppm.
4.1.2.3. Cancer Studies
Several occupational studies have been conducted to examine the potential for tumor formation following toluene exposure. These studies, in general, lack information regarding coexposure to other solvents. A representative sample of these studies is presented below.
Svensson et al. (1990) examined the rates of cancer formation in 1020 past and present Swedish rotogravure printers occupationally exposed to toluene for at least 3 months between 1925 and 1985 in one of eight printing establishments. Exposure levels were estimated based on current exposure, past workplace measurements, and interviews with employees. Exposure levels were estimated to range from 350-450 ppm until 1960, after which time they steadily fell, with a median level of ~50 ppm in 1985. Workers were also exposed to benzene prior to 1960. Exposed workers showed no significant increase in general mortality or from dying of malignant disease. Statistically significant increases in tumor incidences were seen in the gastrointestinal tract and stomach, organs that displayed standardized mortality ratios (SMRs) of 2.06 (95% confidence interval [CI] 1.13-3.45) and 2.72 (95% CI 1.09-5.61), respectively, when compared to those of unexposed controls. In addition, taking all cancer incidence into account, there was a marginal excess of respiratory-tract cancers, with an SMR of 1.76 (95% CI 1.03-2.91). However, when the latter subset was limited to those employees with greater than 5 years of potential exposure or greater than 10 years latency, the resulting SMR of 1.26 (95% CI 0.572.38) failed to confirm an association between exposure and response.
Anttila et al. (1998) carried out a retrospective cohort analysis of 5301 Finnish workers (3922 male and 1379 female) monitored for biological markers of occupational exposure to styrene, toluene, or xylene over the period of 1973-1992. Exposure to toluene was monitored from 1978 to 1983 by analysis of toluene levels in the blood. The authors computed the indirectly standardized incidence ratios (SIR) with 95% CI with regard to age-, gender-, and period-specific incidence rates of cancer in the Finnish general population. The overall rate of cancer incidence for the total cohort was similar to that of the general population. The risk for nervous system tumors was increased at 10 years after the first personal measurement (SIR 2.80,
31
95% CI 1.03-6.08). No significantly increased incidence rates of cancer were associated with toluene exposure.
Wiebelt and Becker (1999) examined a cohort of 6830 German men from 11 rotogravure printing plants who were exposed to toluene between 1960 and 1992. Because of an incomplete availability of death certificates, a newly developed method was applied for the calculation of SMRs. Individual exposure measurements were not taken. Of the three main work areas, two had air concentrations generally lower than 30 ppm and one was lower than the exposure limit of 100 ppm (200 ppm before 1985). For the total cohort, only the SMR for mental disorders, primarily alcoholism, was significantly elevated (SMR 3.03, 95% CI 1.84-5.41). No significant increases in cancer mortality or cause-specific cancer mortality were reported for the entire cohort. If the workers from the work areas with the highest exposure are analyzed separately, significant increases in mortality from cancers of the bone (SMR 8.14, 95% CI 1.39-32.43) and connective tissue (SMR 6.31, 95% CI 1.23-25.95) were found.
4.2. PRECHRONIC AND CHRONIC STUDIES AND CANCER BIOASSAYS IN ANIMALS - ORAL AND INHALATION
4.2.1. Oral Exposure
4.2.1.1. Prechronic Studies
The oral toxicity of toluene was investigated in a subchronic gavage study in F-344 rats (NTP, 1990). Groups of 10 rats/sex/group were administered toluene in corn oil at dosage levels of 0, 312, 625, 1250, 2500, or 5000 mg/kg, 5 days/week for 13 weeks. The exposure was for 5 days/week, and therefore the dose is adjusted to a 7-day week (e.g., 312 mg/kg x 5/7 = 223 mg/kg-day) and, therefore, the doses were 0, 223, 446, 893, 1786, or 3571 mg/kg-day, respectively. All animals receiving 3571 mg/kg-day died within the first week and were eliminated from further evaluation. One female and 8 males in the 2500 mg/kg-day group died, but two of these deaths were due to gavage errors. No deaths occurred at lower doses. Several toxic effects were noted at doses greater than or equal to 1786 mg/kg-day, including prostration, hypoactivity, ataxia, piloerection, lacrimation, excessive salivation, and body tremors. A significant decrease (p<0.05) in body weight for males in the 1786 mg/kg-day group was the
32
only significant change. There were no significant changes in hematology or urinalysis for any group of animals. Some biochemical changes, including a significant increase (p<0.05) in serum glutamic oxaloacetic transaminase (SGOT) in 1786 mg/kg-day males and an increase in cholinesterase activity in females receiving 1786 mg/kg-day were noted.
There were several pathologic findings and organ weight changes in the liver, kidney, brain, and urinary bladder. In males, absolute and relative weights of both the liver and kidney were significantly increased (p<0.05) at doses greater than or equal to 446 mg/kg-day. Absolute liver weights (mean ± SE) in males were 10,490 ± 360 (100%), 11,310 ± 300 (108%), 11,850 ± 390 (113%), 14,440 ± 480 (138%), and 14,130 ± 1220 (135%) milligrams for 0, 223, 446, 893, and 1786 mg/kg-day doses, respectively. Relative liver weights (mean ± SE) in males were 33.3 ± 0.81 (100%), 34.5 ± 0.68 (104%), 35.9 ± 0.68 (108%), 45.0 ± 1.69 (135%), and 59.4 ± 3.28 (178%) grams/100 g body weight for 0, 223, 446, 893, and 1786 mg/kg-day doses, respectively. Absolute kidney weights (mean ± SE) in males were 1,084 ± 14 (100%), 1,159 ± 34 (107%), 1,213 ± 39 (112%), 1,292 ± 34 (119%), and 1,227 ± 114 (113%) milligrams for 0, 223, 446, 893, and 1786 mg/kg-day doses, respectively. Relative kidney weights (mean ± SE) in males were 3.5 ± 0.06 (100%), 3.5 ± 0.07 (100%), 3.7 ± 0.06 (106%), 4.0 ± 0.06 (114%), and 5.1 ± 0.32 (146%) grams/100 g body weight for 0, 223, 446, 893, and 1786 mg/kg-day doses, respectively. In females, absolute and relative weights of the liver, kidney, and heart were all significantly increased at doses greater than or equal to 893 mg/kg-day (p<0.01 for all comparisons except p<0.05 for absolute kidney and heart weights at 893 mg/kg-day).
Histopathologic lesions in the liver consisted of hepatocellular hypertrophy, occurring at doses greater than 1786 mg/kg-day. Nephrosis was observed in rats that died, and damage to the tubular epithelia of the kidney occurred in terminally sacrificed rats. Kidney sections were examined in particular for the occurrence of hyaline droplets in the proximal tubules with negative findings. Histopathologic changes were also noted in the brain and urinary bladder (hemorrhages in the two highest dose groups). In the brain, mineralized foci and necrosis of neuronal cells were observed in males and females at 1786 mg/kg-day and males at 893 mg/kgday. In the bladder, hemorrhage of the muscularis was seen in males at 1786 mg/kg-day. The NOAEL in rats for this study is 223 mg/kg-day. The LOAEL is 446 mg/kg-day based on liver and kidney weight changes in male rats.
NTP (1990) also conducted a 13-week gavage study in B6C3F1 mice, following the same regimen described above. All mice receiving 3571 mg/kg-day toluene died and were eliminated
33
from further assessment; 8/20 (4 males, 4 females) receiving 1786 mg/kg-day toluene also died. Clinical signs seen in animals receiving greater than or equal to 1786 mg/kg-day included subconvulsive jerking, prostration, impaired grasping reflex, bradypnea, hypothermia, ataxia, and hypoactivity. By week 13, the mean body weight of males receiving 1786 mg/kg-day was significantly (p<0.05) lower than controls; no significant changes in body weights were seen in female mice. In male mice, absolute kidney weight, but not relative kidney weight, was decreased in the 1786 mg/kg-day group. Relative brain and liver weights were increased and relative right testis weight was decreased in animals exposed to 893 mg/kg-day or greater; the absolute weights for these organs were not significantly different from controls. In female mice, absolute liver weights were increased in the 223 and 1786 mg/kg-day groups, but not in the other treated groups; relative liver weights were increased in all treated groups. No other changes in organ weights were seen in female mice. Several small but statistically significant changes occurred in hematologic parameters, but did not appear to be related to toluene exposure as no dose-response was observed. No histologic changes in the liver, brain, kidneys, or bladder of any group were reported.
Hsieh et al. (1989) exposed groups of male CD-1 mice (five animals/group) to 0, 17, 80, or 405 mg toluene/L of drinking water for 4 weeks. Based on body weight and water consumption data, the authors calculated average daily toluene doses of 0, 5, 22, or 105 mg/kgday, respectively. Animals were weighed once per week, and food and water consumption were monitored continuously. Water toluene concentration was determined daily, and fresh solutions were made every 3 days. After 28 days, the animals were sacrificed, and body, spleen, thymus, liver, and kidney weights were determined. Gross pathological examinations were performed on all mice. Total erythrocytes and leukocytes were determined, and differential leukocyte counts were measured. Splenocyte suspensions were prepared, and the lymphoproliferative responses to the T-cell mitogens phytohemagglutinin (PHA) and concanavalin A (Con A), the B-cell mitogen E. coli lipopolysaccharide (LPS), and the combined mitogen pokeweed mitogen (PWM) were measured. The mixed lymphocyte response (MLR) was assayed by measuring the lymphoproliferative response of splenocytes (responders) from toluene-treated or control mice after coculture with mitomycin C-treated YAC-1 mouse lymphoma cells (stimulators). Separate groups of animals were similarly exposed and were sensitized by intraperitoneal injection of sheep red blood cells (SRBC) 4 days before the end of toluene exposure. Antibody production was measured as anti-SRBC antibody and expressed as a titer. The anti-SRBC antibody in the serum collected was used in the plaque-forming colony (PFC) assay. Interleukin-2 (IL-2) production was determined in splenic lymphocytes from treated and control animals with or
34
without Con A (to stimulate IL-2 production). Supernatants were assayed for IL-2 content by the ability to enhance proliferation of an IL-2-dependent murine T-helper cell line (HT-2 cells).
Toluene exposure did not result in increased mortality or clinical signs of toxicity in any exposed group. No significant changes in food or water consumption were noted, and no gross lesions of the liver, kidney, spleen, heart, thymus, lung, or brain were seen in any treatment group. No changes in body weight (mean ± SE) were seen as a result of toluene exposure. Relative liver weights of toluene-exposed mice were significantly increased (5.67 ± 0.07, 6.09 ± 0.11, 6.32 ± 0.17, and 6.73 ± 0.14 g/100 g body weight for 0, 5, 22, and 105 mg/kg-day treatment groups, respectively) and relative thymus weights (mean ± SE) were significantly decreased (0.19 ± 0.02, 0.18 ± 0.01, 0.18 ± 0.02, and 0.13 ± 0.02 g /100 g body weight for 0, 5, 22, and 105 mg/kg-day treatment groups, respectively) at 105 mg/kg-day compared to controls, but not at lower doses. The changes in organ weights at the highest dose correspond to a 19% increase in relative liver weight and a 32% decrease in relative thymus weight compared to controls. No changes were found in relative spleen and kidney weights at any dose. No significant changes in hematological parameters or spleen cellularity were reported. Splenocyte cultures from animals in all treated groups showed statistically significant reductions in proliferative response, measured by [3H]thymidine ([3H]TdR) uptake, when cultured in the absence of mitogen, or in response to PWM. At the two highest dose levels, the proliferative response was also statistically significantly decreased in response to LPS, PHA, and Con A. At the highest dose the MLR was also decreased. The PFC response (i.e., the number of antibody producing cells measured as both PFC/106 spleen cells and PFC/spleen) to SRBC was statistically significantly reduced (46% and 63% of controls, respectively) as was IL-2 synthesis (45% of controls) following exposure to 105 mg/kg-day toluene. Based on a weight of evidence the 105 mg/kg-day dose group represents a LOAEL for this study for increased relative liver weight, decreased relative thymus weight, and immunological effects (e.g., reduced PFC response [>40%] to SRBC); the NOAEL is 22 mg/kg-day.
In a later study, Hsieh et al. (1990a) exposed groups of male CD-1 mice for 28 days as described above. At the end of the exposure, six discrete brain sections of the animals were tested for endogenous levels of norepinephrine (NE), dopamine (DA), and serotonin (5-HT) as well as their primary metabolites. No changes in body weight or clinical signs were observed. Toluene exposure induced increases in all of the biogenic amines examined at all dose levels, with the response generally peaking in the mid-dose group and decreasing in the high-dose group. Significant increases of norepinephrine and its metabolite, 3-methoxy-4
35
hydroxymandelic acid, were found in the midbrain of all dose groups. Significant increases in serotonin levels, but not its metabolite (5-hydroxyindoleacetic acid), were also seen in the midbrain of all dose groups. This study did not identify a NOAEL or LOAEL.
Hsieh et al. (1990b) exposed CD-1 mice (five/group) for 28 days to 0, 80, or 325 mg/L toluene (purity 99.7%) in a comparison study with benzene immunotoxicity. Based on previous calculations of daily intake rates from this laboratory, the doses are estimated at 0, 22, and 85 mg/kg-day, respectively. No differences were observed in kidney, liver, spleen, thymus, or whole body weights. Erythrocyte, leukocyte, and lymphocyte counts were normal. No effect was observed on the response of lymphocytes to stimulation with Con A, LPS, PHA, and PWM. Both treatment groups demonstrated a significant decrease in the incorporation of [3H]TdR in the MLR assay using mitomycin C-blocked YAC-1 cells as stimulators. Uptake of [3H]TdR was decreased by more than 50% for responder-to-stimulator ratios of 2:1 and 4:1 for both treatment groups. The report was unclear about the effect of toluene on the capacity of cytotoxic T lymphocytes to respond to YAC-1 cells. No difference in the synthesis of IL-2 was observed by measuring the uptake of [3H]TdR in Con A-stimulated T-lymphocytes. The number of PFC produced in response to SRBC was reduced in mice that received the highest dose. This reduction was observed when the results were expressed as the number of PFC per million splenocytes but was not apparent when expressed as the total number of PFC in the spleen. Toluene exposure had no effect on the production of SRBC antibodies. This study identified a LOAEL of 22 mg/kg-day for MLR to YAC-1 cells.
Hsieh et al. (1990c) reported that, under the same experimental conditions as above (Hsieh et al., 1990b), exposure to toluene did not alter tissue weights of whole brains or regional sections. Increased concentrations of biogenic amines NE, DA, 5-HT and their major metabolites (vanillylmandelic acid [VMA], DOPAC, HVA, 5-HIAA) were observed in several regions of the brain following exposure to toluene. The increase in biogenic amines was generally not dose-dependent. The dose-response was biphasic. No LOAEL or NOAEL was established.
Hsieh et al. (1991) exposed groups of male CD-1 mice (five/group) to concentrations of 0, 20, 100, or 500 mg/L toluene (purity 99.7%) for 28 days. The authors calculated the equivalent doses from measured concentrations of toluene and water intake rates to be 0, 5, 22, and 105 mg/kg-day. Increased concentrations of NE and its major metabolite, VMA, were observed in all treatment groups. The highest level of NE was observed at the medium dose (22
36
mg/kg). Concentrations of NE were increased by 35-63% and concentrations of VMA by 66150%. A 2.1- to 3.8-fold increase in the measured amounts of adrenocorticotropic hormone (ACTH) was observed with increasing dose. Corticosterone levels were elevated by more than 100% in the highest dose group at days 14 and 28. The production of IL-2 was measured by the uptake of [3H]TdR in Con A-stimulated T-lymphocytes. Splenocytes from the high dose group exhibited a 25% decrease in IL-2 production. The decreased production of IL-2 in the 105 mg/kg-day dose group represents a LOAEL for this study; the NOAEL was 22 mg/kg-day.
Burns et al. (1994) used toluene as a comparative control in an investigation of the immunotoxicity of mono-nitrotoluenes. B6C3F1 mice (4 females/group) were treated with 0 or 600 mg/kg-day toluene by oral gavage for 14 days. No differences were observed in brain, liver, lung, spleen, thymus or body weights. No gross or histopathological lesions were identified. The mean number of leukocytes was 30% lower in treated animals while the mean number of circulating reticulocytes was almost twice the mean value for the control group. The impact on DNA synthesis in bone marrow cells was inconsistent. In an initial experiment synthesis was elevated by approximately 30%, but the control group value was lower than expected. The experiment was repeated (details not provided), and no increase in bone marrow DNA synthesis was observed. Toluene did not affect the proportion of T cells in the spleen, or the number of IgM antibody forming cells produced in response to SRBC. The number of IgG antibody forming cells produced in response to SRBC was not reported to be significantly different for either number of cells per 106 spleen cells or number of cells per spleen, but in both cases the mean for treated animals was approximately 40% lower than control group mean. There was no effect on the proliferative response of spleen cells to the B cell mitogen LPS or the T cell mitogen Con A. However, an increased proliferative response was observed with 5 μg/mL of the T cell mitogen PHA. The MLR to DBA/2 allogenic cells was not affected by toluene exposure.
The delayed hypersensitivity response to keyhole limpet hemocyanin was not altered by toluene exposure. Serum complement levels, expressed as the number of cells necessary to lyse 50% of target cells (CH50), were depressed by approximately 50%, but the study’s authors questioned the biological significance of this change. No alterations were observed in the differential counts of peritoneal cells. There was no change in the percentage of fluorescent-labeled Covaspheres or chicken erythrocytes that were phagocytized by peritoneal adherent cells or exudate cells, respectively. A similar macrophage enzyme profile was observed in peritoneal cells for both treated and control animals. Toluene treatment did not affect the clearance of
37
sheep erythrocytes by the reticuloendothelial system. Natural killer cell activity was decreased slightly at the smallest effector to target cell ratio (25/1), but this effect was not seen when the mice were stimulated with poly rI:rC. Toluene treatment did not alter the poly rI:rC inducible interferon levels. Host resistance to microbial and tumor challenge was measured by administration of the infectious agent on day 15. Host resistance to challenges with Listeria monocyogenes, Streptococcus pneumoniae, Plasmodium yoelii, or B16F10 melanoma was not affected. A reduced incidence of tumors was observed in mice that were challenged with PYB6 fibrosarcoma. The only dose of toluene used in this study, 600 mg/kg-day, was the LOAEL. A NOAEL was not defined.
4.2.1.2. Chronic Studies
Wolf et al. (1956) administered groups of 10 female Wistar rats gavage doses of 0, 118, 354, or 590 mg/kg toluene dissolved in olive oil. A total of 138 doses were administered over 193 days, resulting in average doses of approximately 0, 84, 253, or 422 mg/kg-day. Hematologic, behavioral, gross, and histopathologic examinations were conducted with no effects reported at any dose. This study did not identify a NOAEL or LOAEL.
Maltoni et al. (1997) conducted carcinogenicity evaluations on a series of gasoline-related chemicals, including toluene. Groups of male and female Sprague-Dawley rats (4050/sex/group) were exposed to 0 or 800 mg/kg by gavage four times per week for 104 weeks. In a separate experiment, animals were similarly exposed to 0 or 500 mg/kg toluene. Duration-adjusted doses were 286 and 457 mg/kg-day for the 500 and 800 mg/kg groups, respectively. Mean daily food and drinking water consumption as well as animal body weights were determined weekly for 13 weeks, and once every 2 weeks thereafter. Animals were permitted to live their entire life spans. Upon death, the animals were examined for gross and histologic carcinogenic organ changes. The 800-mg/kg-exposed animals, but not the 500-mg/kg-exposed animals, showed slightly reduced survival relative to controls. An increase in total tumor-bearing animals was reported but was greater in the 500-mg/kg animals than in the 800-mg/kg animals; malignant tumor frequencies for both sexes combined were 24, 69, and 44% for the 0, 500, and 800 mg/kg groups, respectively. Mammary cancers and lymphomas/leukemias in female rats were elevated in the 500-mg/kg animals but not in the 800-mg/kg animals. A small but significant increase was seen in the incidence of oral cavity tumors in 800-mg/kg male rats only.
38
4.2.2. Inhalation Exposure
4.2.2.1. Prechronic Studies
Fischer 344 rats (10/sex/group) were exposed to toluene vapors at 0, 100, 625, 1250, 2500, and 3000 ppm (0, 377, 2355, 4711, 9422, and 11,307 mg/m3, respectively) 6.5 hours/day, 5 days/week (duration-adjusted to 0, 73, 455, 911, 1823, and 2187 mg/m3, respectively) for 15 weeks (NTP, 1990). Organ weights were measured and histological examinations were performed only on controls, 2500- and 3000-ppm groups, and animals that died before the end of the study. Eight of 10 males exposed to 3000 ppm died, all during the second exposure week. No females died at any exposure level. Compared to the controls, final body weights were 15 and 25% lower in the males and 15 and 14% lower in the females of the 2500- and 3000-ppm groups, respectively. There was a concentration-related increase in the relative liver weight, significant at 1250, 2500, and 3000 ppm in males and at 2500 and 3000 ppm in females. The relative weights of the heart, lung, kidney, and right testis were also significantly elevated in the 2500- and 3000-ppm animals compared to those of the controls, although no histopathology was observed in any exposure group. Concentration-dependent increases in the severity of nephropathy was observed. No evidence was found of an increase in hyaline droplets in the proximal tubules. Other changes that usually accompany an increase in hyaline droplet formation, such as granular casts at the junction of the inner and outer stripe of the outer medulla in short-term studies, were not found. Toxic effects noted in a concurrently conducted gavage study (urinary bladder hemorrhages in the two highest exposure groups) were not noted in this subchronic inhalation study. A subsequent report on the neurologic effects did not indicate any neurobehavioral changes as a result of toluene exposure at these levels (Tilson, 1990), but details of the test results are lacking. This study identified a NOAEL of 625 ppm and a LOAEL of 1250 ppm for changes in relative liver weight in male rats.
Poon et al. (1994) exposed groups of Sprague-Dawley rats of both sexes to 0, 30, or 300 ppm toluene for 6 hours/day, 5 days/week for 4 weeks. Slightly increased relative liver weights, but not absolute liver weights, were seen in 30 ppm males but not in the 300 ppm males or at any concentration in females. Females exposed to 30 ppm, but not to 300 ppm, had a mild reduction in thyroid follicle size. A slight epithelial degeneration in the nasal conchae was noted in 30ppm males but not in the higher-dose males or in either exposure group of female rats. A NOAEL of 300 ppm was identified.
39
Von Euler et al. (2000) exposed 30 male Sprague-Dawley rats to 80 ppm (302 mg/m3) toluene for 6 hours/day, 4 days/week for 4 weeks. Control animals (n=30) were similarly exposed but to air only. Four weeks after the last exposure, the animals were evaluated for neurobehavioral alterations using tests for spatial learning and memory (Morris water maze), open-field activity (open field test), and beam-walk performance. Following the conclusion of the neurobehavioral tests, animals were examined for changes in brain morphology using magnetic resonance imaging (MRI). Animals were sacrificed, and the brains were examined for effects on the dopamine D3 receptor. No effects on body weight were seen as a result of exposure. Exposed rats did not differ significantly from controls in the results of the open field test; however, toluene exposure resulted in significant changes in the water maze test (increased time in the correct quadrant) and significantly reduced performance in the beam walk test. MRI analysis revealed a selective decrease of approximately 6% in the area of the parietal cortex, but whole brain volumes, also assessed by MRI, were not significantly different between exposed and control rats. Autoradiographic analysis revealed a 7-10% decrease of the cerebrocortical area. Autoradiography did not reveal differences in binding to the dopamine D3 receptor as a result of toluene exposure. This study identified a LOAEL of 80 ppm (302 mg/m3) for neurobehavioral alterations 4 weeks after cessation of a 4-week exposure to toluene; no NOAEL was identified.
Pryor et al. (1984) exposed young male Fischer 344 rats to a variety of exposure concentrations and durations. Hearing loss was evaluated by a behavioral technique (avoidance response elicited to an auditory signal) or brainstem auditory-evoked responses (elicited by tone pips of differing loudness and frequency and detected by subdural scalp electrodes). Hearing loss, as measured by both techniques, was observed after as few as 2 weeks of exposure to 1000 ppm toluene for 14 hours/day. Lower concentrations of 700 ppm for 14 hours/day were without effect after 16 weeks of exposure. Intermittent exposure to 3000 ppm for 30 minutes/hour for 8 hours/day caused hearing loss within 2 weeks, whereas a similar exposure schedule for only 4 hours/day was without effect after 9 weeks. Hearing loss was irreversible, as evidenced by a failure to return to normal response after 3 months of recovery. This study identified a LOAEL of 1000 ppm for hearing loss in rats; no NOAEL was identified. It should be noted that later reports indicated the “high-frequency” hearing loss in rats studied by Pryor et al. (1984) was most likely an atypical mid-frequency hearing loss. At the time, the auditory frequency of rats, which can hear higher frequencies than humans, had not been fully characterized (Crofton et al., 1994).
40
McWilliams et al. (2000) exposed groups of eight guinea pigs to 0, 250, 500, or 1000 ppm (0, 943, 1885, or 3770 mg/m3) of toluene for 8 hours/day, 5 days/week for 1 week or 500 ppm (1885 mg/m3) for 4 weeks. At 1 and 4 weeks, animals were examined for changes in hearing by the cubic distortion-product (CDP) otoacoustic emission technique, while, after 4 weeks of exposure, selected animals were examined histologically for changes in the cochlea. After 1 week of exposure, a dose-related decrease in CDP amplitudes was seen, with complete recovery evident after a 3-day rest period. A 4-week exposure to 500 ppm of toluene resulted in more severe disturbances in hearing than were seen after 1 week, but the effects were still reversible. After 4 weeks of exposure, the cochlear cells located near the base (high frequency) showed a loss of succinate dehydrogenase (SDH) staining. This study identified a NOAEL of 250 ppm (943 mg/m3) and a LOAEL of 500 ppm (1885 mg/m3) for diminished startle response and histologic alterations of the cochlea in exposed guinea pigs.
The effects of inhalation exposure to toluene on pulmonary host defenses were evaluated by Aranyi et al. (1985). CD-1 mice were exposed to approximately 0, 1, 2.5, 5, 10, 25, 50, 100, 250, and 500 ppm toluene during a single 3-hour period, and two other groups were exposed to 0 and 1 ppm toluene for 5 consecutive days (3 hours/day) or 20 days (3 hours/day and 5 days/week). Immediately after toluene exposure, mice were challenged either with Streptococcus zooepidemicus in an infectivity assay or with S-labeled Klebsiella pneumoniae in a bactericidal assay. For the infectivity assay, mice were challenged with an aerosol of viable S. zooepidemicus and mortality was recorded over 14 days. For the bactericidal assay, bactericidal activity was recorded after a 3-hour infection period. Mortality in the streptococcus infectivity model was significantly increased at 500, 250, 100, 50, 10, 5, and 2.5 ppm with a similar but nonsignificant increase at 25 ppm. The difference in percent mortality between the toluene exposed group and the controls was 36.1, 23.0, 11.6, 18.6, 19.2, 16.9, 24.1, 13.5, and 2.3% for 500, 250, 100, 50, 25, 10, 5, 2.5, and 1 ppm, respectively. In the bactericidal activity assay, the high dose treatments groups (500, 250, and 100 ppm) were also affected and exhibited a decrease in bactericidal activity. There was no effect on bactericidal activity of a single exposure to toluene at or below 50 ppm. In the repeated dose assays, there was no effect of 5 or 20 days of exposure on S. zooepidemicus-induced mortality. Exposure to 1 ppm toluene for 5 days caused a decrease in bactericidal activity; however, 1 and 20 days of exposure did not. The results suggest a dose response after acute exposure with a NOAEL of 1 ppm and a LOAEL of 2.5 ppm for streptococcus infectivity. The bactericidal results indicate a NOAEL of 50 ppm and a LOAEL of 100 ppm with a single exposure, and the immunological effects of repeated, sub-chronic exposure are difficult to interpret because only a single dose was examined (1 ppm) and
41
it suppressed bactericidal activity after 5 days but had no effect after either 1 or 20 days. The results indicate the immunological effects may be transient, but the interpretation is confounded by the lack of a clear dose-response relationship.
4.2.2.2. Chronic Studies
In a 2-year bioassay, Fischer 344 rats (60/sex/group) were exposed to 0, 600, or 1200 ppm (0, 2261, or 4523 mg/m3, respectively) toluene vapors, 6.5 hours/day, 5 days/week (duration-adjusted to 0, 437, and 875 mg/m3, respectively) for 103 weeks (NTP, 1990; Huff, 2003). To generate toluene vapor, the liquid material was heated, and the vapor was diluted with nitrogen and mixed with the chamber ventilation air. An interim sacrifice was carried out at 15 months on control and 1200 ppm groups (10/sex/group) to conduct hematology and histopathology of the brain, liver, and kidney. Body weights were measured throughout the study. Gross necropsy and micropathology examinations were performed at the end of the study on all major organs, including the nasal passage tissues (three sections), lungs, and mainstem bronchi. Mean body weights in both exposed groups were not different from controls for either sex. Survival rate was similar for all groups. At the interim sacrifice, there was a mild to moderate degeneration in the olfactory and respiratory epithelium of the nasal cavity in 39/40 rats of the 600 and 1200 ppm groups compared with 7/20 controls. At the end of 2 years, there was a significant (p<0.05) increase in the incidence of erosion of the olfactory epithelium (males: 0/50, 3/50, and 8/49; females: 2/49, 11/50, and 10/50 at 0, 600, and 1200 ppm, respectively) and of degeneration of the respiratory epithelium (males: 15/50, 37/50, and 31/49; females: 29/49, 45/50, and 39/50 at 0, 600, and 1200 ppm, respectively) in the exposed animals. The females exposed to 600 and 1200 ppm also exhibited a significant increase in inflammation of the nasal mucosa (27/49, 42/50, and 41/50 at 0, 600, and 1200 ppm, respectively) and respiratory metaplasia of the olfactory epithelium (0/49, 2/50, and 6/50 at 0, 600, and 1200 ppm, respectively). Concentration-dependent increases in the severity of nephropathy were noted. No evidence was found of an increase in hyaline droplets in the proximal tubules. In addition, other changes that usually accompany an increase in hyaline droplets, such as linear mineralization of the medulla in long-term studies, were not found. No other increases in the incidence of nonneoplastic lesions were reported in exposed rats. No neoplasms were noted in male rats, and one nasal, two kidney, and two forestomach neoplasms observed in female rats were considered not to be associated with toluene exposure. A LOAEL of 600 ppm toluene was identified for the concentration-dependent increase in erosion of the olfactory epithelium in male rats and the
42
degeneration of the respiratory epithelium in both sexes. A NOAEL could not be identified from this study.
B6C3F1 mice (60/sex/group) were exposed to 0, 120, 600, or 1200 ppm (0, 452, 2261, or 4523 mg/m3, respectively) toluene 6.5 hours/day, 5 days/week (duration-adjusted to 0, 87, 47, and 875 mg/m3, respectively) for 2 years (NTP, 1990; Huff, 2003). Mean body weights were not significantly different among groups and no treatment-related clinical signs were observed. Deaths (moribund and natural) occurred in all exposure groups but were not related to exposure and were not greater than the control rates. At the 15-month interim sacrifice, minimal hyperplasia in the bronchial epithelium was observed in 4/10 females exposed to 1200 ppm. At the end of the study, there was a concentration-dependent increase in the incidence of splenic pigmentation in the exposed males (9/60, 11/60, and 18/59 at 120, 600, and 1200 ppm, respectively) compared to controls (4/60). In the females, the incidence was 37/50, 33/50, 34/49, and 28/47 at 0, 120, 600, and 1200 ppm, respectively. The occurrence of endometrial hyperplasia was present in 14% of the animals exposed to the highest concentration but only in 4% in the low-exposure groups and controls. No differences were noted between the exposed and control mice of either sex in the incidence of degeneration of either the olfactory or respiratory epithelium. No other changes in the incidences of non-neoplastic or neoplastic lesions were observed in exposed mice.
Fischer 344 rats (120/sex/group) inhaled 0, 30, 100, or 300 ppm (0, 113, 377, or 1130 mg/m3, respectively) toluene (99.9% purity), 6 hours/day, 5 days/week (duration-adjusted to 0, 20, 67, or 202 mg/m3, respectively) for 106 weeks (CIIT, 1980; Gibson and Hardisty, 1983). Vapor, generated by bubbling clean air through toluene, was passed through the air supply duct and mixed with air by turbulent flow to produce the desired concentration. Hematology, blood chemistry, and urinalysis were conducted in all groups at 6 (5/sex), 17 (5/sex), 18 (10-20/sex), and 24 months (10/sex). Histopathology was evaluated only in the control and 300 ppm groups at 6 (5/sex), 12 (5/sex), and 18 months (20/sex). At 24 months, histopathological examinations were conducted in organs of all surviving animals, including the respiratory system and sections through the nasal turbinates (number not indicated). No treatment-related non-neoplastic effects were observed in the exposed animals. Although the male rats exposed to 300 ppm had a significant increase in body weight compared to controls, no concentration-response was evident. At the end of the exposure period, the female rats exposed to 100 or 300 ppm exhibited a slight but significant reduction in hematocrit; an increase in the mean corpuscular hemoglobin concentration was also noted but only in the females exposed to 300 ppm. Gross and
43
microscopic examination of tissues and organs identified no increase in neoplastic tissue or tumor masses among treated rats when compared with controls, though, because the study was conducted at exposure levels below the maximum tolerated dose (MTD), the significance of this finding is less clear. The highest concentration examined in this study, 300 ppm, is designated as a NOAEL for toxicity remote from the respiratory tract in rats. CIIT (1980) reported that the technical and raw data were not audited by their quality assurance group during the study period, although CIIT did later conduct a quality assessment procedure to review the data. The available pathology reports containing these data indicate that at a minimum the lower respiratory tract was examined. Communication with the testing sponsor has provided information indicating that only one section was examined from the nasal cavity of these test animals. It is not clear whether this single section would have been sufficient to elucidate the areas of lesions noted in the NTP (1990) study. The 300 ppm exposure level is identified as a NOAEL for respiratory lesions but it is uncertain whether other respiratory effects may have occurred at lower doses.
4.3. REPRODUCTIVE/DEVELOPMENTAL STUDIES - ORAL AND INHALATION
4.3.1. Studies in Humans
Toluene has been shown to cause congenital defects in infants born to mothers who abused toluene during pregnancy. Exposure levels in the available studies, if reported at all, are very high. A detailed discussion of the high-dose effects of toluene on reproduction and development is beyond the scope of this document. As an example, Hersh et al. (1985) describe clinical and morphometric characteristics common to three children whose mothers had abused toluene (but apparently not alcohol or any other substance) for a period of 4-5 years, including during their pregnancies with the affected children. Clinical findings common to these three children included microcephaly, CNS dysfunction, attention deficits, and developmental delay/mental deficiency. Phenotypic similarities included a small mid face, deep-set eyes, micrognathia (smallness of the jaws), and blunting of the fingertips.
Studies examining the effects of toluene in humans following long-term low-level exposure are less common. Plenge-Bönig and Karmaus (1999) examined the influence of toluene on the fertility of 150 male and 90 female rotogravure printing workers. The men were,
44
in general, exposed to higher concentrations than the women; the women worked exclusively in the stacking and bookbinding areas and received low levels of toluene exposure. Quantitative exposure levels were not reported. After adjustment for age and smoking of the partner, no association between exposure of men to toluene and fertility could be identified. In female workers, however, a significant association between toluene exposure and reduced fertility was found.
4.3.2. Studies in Animals
4.3.2.1. Oral Exposure
Kostas and Hotchin (1981) exposed 48 female Nya:NYLAR mice pre- and postnatally to toluene provided in the drinking water at concentrations of 0, 16, 80, or 400 ppm (estimated at 0, 7.2, 14.4, and 72 mg/kg-day, respectively). In this experiment mice were mated and assigned 12/group to one of the 4 exposure conditions. Exposure was begun on the first hour of the 60hour mating period and continuing throughout pregnancy and lactation. The offspring were maintained on the same drinking water solution from weaning at 21 days of age through behavioral testing. Only six to nine pregnancies/dose group were obtained. Effects were noted in all dosed groups on rotorod (motor coordination) performance, measured at 45 to 55 days of age, but there was an inverse dose-response relationship. No effects of toluene exposure were seen on maternal fluid consumption, offspring mortality rate, development of eye or ear openings, or surface-righting response.
The National Institute of Occupational Safety and Health (NIOSH) (1983) conducted a study to determine the MTD for toluene in adult female CD-1 mice and then used the MTD to determine adverse reproductive effects in timed-pregnant (5-days) mice. Doses of 0, 735, 1470, 2945, 5890, and 8700 mg/kg toluene were administered by gavage to groups of ten female mice once per day for eight consecutive days. Animals were observed for clinical signs of toxicity (including mortality) during the first hour after each dosing, with at least one additional post-dosing observation on the day of dosing. The mice were then observed once daily until the termination of the study. Animals were weighed on the first and last day of dosing, and also on days 4 and 8 post-dosing. Decreases in body weight were less than 10% when compared to controls. All mice in the two highest dose groups (5890 and 8700 mg/kg toluene) died by dosing day 3, while two animals receiving 2945 mg/kg died on dosing day 4. None of the animals in the
45
two lowest groups (735 and 1470 mg/kg) died. The dose selected for the reproductive study was 2350 mg/kg. Toluene (2350 mg/kg) was administered daily to 50 timed-pregnant female mice by gavage between gestation days 7 and 14. Females were weighed on day 18 of gestation and day 3 postpartum. Beginning 18 days after mating, cages containing pregnant females were inspected daily for the presence of a litter. The number of living and dead pups was counted within 12 hours of birth and then 48 hours later. Total litter weights were also measured at these time points. Females that were mated but did not deliver a litter by the twenty-third day after mating were sacrificed and necropsied, and the status of pregnancy was determined during necropsy. During the experiment only one test animal died. There were no statistically significant differences between test and control groups in any of the categories for evaluation of reproductive toxicity. A nonstatistically significant trend towards lower weight gain in pregnancy was noted.
Gospe et al. (1994, 1996) and Gospe and Zhou (1998, 2000) conducted a series of studies examining the effects of oral prenatal toluene exposure on the development of rats. In the first experiment (Gospe et al., 1994), pregnant rats received 520 mg/kg in corn oil by gavage on gestational days 6-19, and offspring were examined on gestational day 19. Toluene exposure did not result in maternal deaths but did result in a significant decrease in weight gain (24% decrease) and a 12% reduction in food consumption, although this difference was not statistically significant. No differences in number of implantations or resorptions were found between control and exposed groups, but fetal body weights, organ weights (liver and kidney), and placenta weights were significantly decreased in toluene-exposed animals. No gross fetal malformations were reported, and histologic examination of the brain revealed no treatment-related changes. In the second experiment (Gospe et al., 1996), pregnant rats received 650 mg toluene/kg in corn oil by gavage on gestation days 6-19; both control (corn oil only) and pair-fed controls were also examined. Fetuses were delivered and examined on day 19 of gestation. Toluene exposure resulted in significantly decreased fetal weight, decreased organ weights (brain, liver, heart, and kidney), and a delay in skeletal ossification. In the third experiment (Gospe and Zhou, 1998), groups of pregnant rats were exposed by gavage to 650 mg toluene/kg in corn oil on gestation days 6-19, and offspring were examined on gestation day 19, or on postnatal days 10 or 21. Toluene exposure did not result in changes in litter size, maternal death, or maternal liver weight. At gestational day 19, fetal body weights, as well as the weights of the heart, liver, kidney, and brain, were significantly reduced in toluene-exposed animals. At postnatal day 10, the body, heart, and kidney weights of prenatally exposed rats remained significantly lower than controls, while by postnatal day 21 no differences between control and
46
treated animals were seen for body or organ weights. While prenatal exposure to 650 mg toluene/kg on gestational days 6-21 did not result in decreased organ or body weights on postnatal day 21, histologic analysis of the brain revealed decreased neuronal packing and alterations in the patterns of staining with bromodeoxyuridine (Gospe and Zhou, 2000), indicating compound-induced alterations in neurogenesis and neuronal migration.
4.3.2.2. Inhalation Exposure
Pregnant Wistar rats and hamsters (group size not indicated) inhaled 0 or 800 mg/m3
(212 ppm) toluene vapors 6 hours/day on gestational days 14-20 (rats) or gestational days 6-11 (hamsters) (DaSilva et al., 1990). In the exposed rats, there was a significant (p<0.05) increase in the number of litters with one or more low birth weight pups (less than 4.9 g), from 10% in the controls to 54% in the exposed dams. A decrease (p<0.05) in the number of live pups at birth was also noted in the litters of exposed dams. No evaluation of malformations or anomalies was performed. The neurobehavioral development of the offspring of the exposed rats was assessed using tests of spontaneous alternation, rim escape, and avoidance responses. The only effect noted in the rats, a shortened first trial latency in choosing one side of a maze, was minimal and its significance unclear. No comparable neurobehavioral deficits occurred in the exposed hamsters. The only effect noted in the neurobehavioral tests of the hamster offspring was an equivocal effect in rotarod performance. No neurobehavioral effect levels were designated from this study, although it appears that the rat developmental processes are more sensitive to toluene than those of the hamster, exhibiting adverse effects at 212 ppm. A NOAEL of 212 ppm was identified for hamsters. A LOAEL of 212 ppm was identified for rats for decreased pup weight.
Thiel and Chahoud (1997) exposed groups of pregnant Wistar rats to 0, 300, 600, 1000, or 1200 ppm (0, 1131, 2262, 3370, or 4524 mg/m3) toluene for 6 hours/day from day 9 to day 21 of pregnancy. At birth, the number of live and dead pups was determined, as well as mean pup weight per litter. Postnatal weight gain was recorded weekly, and signs of physical development, including eruption of incisors, fur development, eye opening, testes descent, and vaginal opening, were monitored. Prior to weaning, offspring were reflex tested. After weaning, offspring were tested for locomotor activity and discrimination learning. Toluene exposure did not result in changes in duration of pregnancy or litter size. At the two highest doses, toluene produced a significant decrease in maternal body weight gain and mean pup weight. High-dose offspring had a significantly increased mortality during the suckling period (postnatal days 221). Postnatal development (time of testes descent or vaginal opening) was accelerated at 600
47
ppm but was delayed at 1000 ppm of toluene or greater. No changes in neurobehavioral parameters of the exposed offspring were noted relative to controls. With the exception of an increased mean fertility in the 600 ppm group, the fertility of the offspring was not different from that of controls. A NOAEL of 600 ppm and a LOAEL of 1000 ppm were identified for decreased pup weight.
Dalgaard et al. (2001) exposed groups of pregnant Wistar rats to airborne concentrations of 0 or 1200 ppm toluene for 6 hours/day on gestational days 7 to 18 and examined male offspring on postnatal day 110 for alterations in semen quality. No effect of toluene exposure on semen quality was seen. In the same study, groups of pregnant rats were exposed to 1800 ppm toluene from gestational days 7 to 20, and the male offspring were examined on postnatal days 11, 21, or 90. Mean body weights in exposed pups were lower than controls on day 11 but were not significantly different on days 21 or 90. Absolute and relative testes weights were decreased in all age groups, but the differences were not statistically significant. Histologic analysis of the testes revealed no effects of toluene exposure in any age group. Microscopic examination of the hippocampus revealed no changes in apoptotic neurodegeneration in any group, whereas toluene induced a statistically significant increase in apoptosis in the cerebellar granule layer on postnatal day 21 but not on day 11 or 90. A NOAEL of 1800 ppm was identified.
In another study with similar exposure conditions, Hougaard et al. (1999) exposed groups of pregnant Wistar rats to airborne levels of 0 or 1800 ppm toluene for 6 hours/day from gestational days 7 to 20. Body weights of exposed offspring were lowered until postnatal day 10, after which no significant differences were noted. Neurobehavioral evaluation of the pups revealed no effects on motor function, activity level, acoustic startle, and prepulse inhibition. Measurement of hearing function revealed small but significant changes in male offspring. Significant effects on cognitive function, assessed by the Morris water maze, were reported for both sexes of offspring but were most pronounced in female offspring. A LOAEL of 1800 ppm was identified for decreases in hearing and cognitive functions. In a later study, Hougaard et al. (2003) exposed pregnant rats to toluene at 1500 ppm for 6 hours a day and/or to scheduled mild chronic stress during the last two weeks of pregnancy. The exposure to toluene resulted in reduced birth weight and lower maternal weight gain, however, the decreased maternal weight gain was enhanced by the mild chronic stress.
A subsequent study by the same investigators (Hass et al., 1999) exposed groups of pregnant Wistar rats to 0 or 1200 ppm toluene for 6 hours/day on gestational days 7 to 18. The
48
exposure did not cause maternal toxicity or decreased offspring viability. As was the case with the previous study, offspring body weights were significantly reduced through postnatal day 10 and were not significantly different thereafter. Alterations in Morris water maze performance were evident in female offspring at 3.5 months of age. No other changes in neurobehavioral parameters were reported. A LOAEL of 1200 ppm was identified for neurological effects.
Ungvary and Tatrai (1985) exposed New Zealand rabbits (8-10/group) to 0, 133, or 265 ppm (0, 500, or 1000 mg/m3) toluene, 24 hours/day, on gestational days 7-20, and CFLP mice (15 females/group) to 0, 133, 265, or 400 ppm (0, 500, 1000, or 1500 mg/m3) toluene, 3 x 4 hours/day, on gestational days 6-15. The control groups consisted of 115 mice and 60 rabbits. All of the female mice that were exposed to 400 ppm toluene died. In the mice exposed to 265 ppm toluene, there was an increase in fetuses with retarded weight (29%, level of retardation not indicated) and in fetuses with skeletal retardation (12%) compared to 7 and 5%, respectively, in the controls. Of the eight pregnant rabbits exposed to 265 ppm toluene, two died, four had spontaneous abortions, and the remaining two had total litter resorption. No deaths occurred in the 10 rabbits exposed to133 ppm toluene, but 1/10 rabbits had a spontaneous abortion (as compared to 0/60 reported for the controls). No effects were seen on fetal development in rabbits exposed to133 ppm toluene. A LOAEL of 133 ppm was identified in rabbits for spontaneous abortion. A NOAEL of 133 ppm and a LOAEL of 265 ppm were identified in mice for decreased pup weight and skeletal retardation.
Pregnant Charles River CD-1 mice (15-16 females/group) inhaled filtered air or 200 or 400 ppm (754 and 1508 mg/m3) toluene 7 hours/day on gestational days 7-16 (Courtney et al., 1986). The relative liver weight in the exposed dams was reported to be significantly lower in the two exposed groups compared to the controls, although no data were presented. A statistically significant increase in lactate dehydrogenase activity in the brain of the dams exposed to 400 ppm was also reported. The exposed pregnant mice did not exhibit any significant differences in the number of implantation sites, number of live fetuses, fetal deaths, or fetal body weight compared to the control values. A statistically significant increase over controls in the incidence (both per litter and per fetus) of enlarged renal pelves was noted in dams exposed to 200 ppm but not to 400 ppm. A statistically significant alteration from controls in the rib profile (percentage of fetuses with one or two additional or fewer ribs) was reported for fetuses from dams exposed to 400 ppm but not to 200 ppm. A NOAEL of 200 ppm and a LOAEL of 400 ppm were identified for changes in the number of ribs in fetuses.
49
Ono et al. (1995) exposed groups of pregnant Sprague-Dawley rats to 0, 600, or 2000 ppm (0, 2262, or 7540 mg/m3) toluene for 6 hours/day from days 7 to 17 of gestation and examined the offspring for malformations and alterations in behavioral parameters. Preweaning tests included surface righting and negative geotaxis, while postweaning tests included an open field test (postnatal week 4), the Biel water maze (postnatal week 6), and rotorod tests (postnatal week 7). At the conclusion of the study, animals were sacrificed and examined histologically. Serum biochemistry and hematologic parameters were also evaluated. No biochemical, teratogenic, or histologic changes attributable to toluene exposure were reported in either parental rats or the offspring in the 600 ppm group. Exposure to 2000 ppm resulted in significant maternal toxicity as well as decreased body weight of offspring, increased fetal mortality, and decreased offspring weight gain. However, no differences in external, internal, or skeletal anomalies were reported for any exposure group. Similarly, no differences were found in the results of preweaning or postweaning behavioral testing at any exposure level. A NOAEL of 600 ppm and a LOAEL of 2000 ppm were identified for maternal toxicity, decreased fetal weight, and increased fetal mortality.
In a later study, Ono et al. (1996) exposed groups of male and female Sprague-Dawley rats to 0, 600, or 2000 ppm (0, 2262, or 7540 mg/m3) toluene for examination of effects on fertility. Females were exposed from 14 days before mating to day 7 of gestation, while males were exposed for 90 days, beginning at 60 days before pairing. In females exposed to 2000 ppm, increased salivation and lacrimation were noted starting 20 days after exposure. No changes were noted in mating behavior or fertility at either exposure level. Fetal mortality and the number of dams with dead fetuses were both increased in the 2000 ppm animals, but these differences were not statistically significant. In males exposed to 2000 ppm for 90 days, increased kidney weight and decreased thymus weights were observed. Additionally, high-dose males showed decreased epididymal weight, though no abnormalities of the testes or epididymis were noted histologically. Sperm counts were significantly reduced in the 2000 ppm animals. The sperm count of the 600 ppm group was slightly decreased but did not attain statistical significance. A NOAEL of 2000 ppm was identified for female rats. A NOAEL of 600 ppm and a LOAEL of 2000 ppm were identified for male rats for decreased sperm count.
A two-generation inhalation reproductive study was conducted in CD-1 rats (10-40 males/group, 20-80 females/group) (API, 1984; Roberts et al., 2003). Animals were exposed by whole-body inhalation to toluene at 0, 100, 500, or 2000 ppm (0, 377, 1885, or 7538 mg/m3, respectively) 6 hours/day, 7 days/week for 80 days and a 15-day mating period. The mated
50
females were then exposed to the same concentrations during days 1-20 of gestation and days 5-20 of lactation. After weaning, the pups in this generation (F1) were exposed for a minimum 80-day pre-mating period. The animals were then randomly mated with members of the same exposure group (2 females/1 male) for 15 days, during which exposure was continued, to produce the second generation (F2). Mean male body weights were slightly reduced (maximum of 10%) in the first 2 weeks of the exposure in the animals exposed to 500 and 2000 ppm, although the size of the reduction was not related to exposure. No differences were observed in male or female fertility indices, length of gestation, mean numbers of viable and nonviable pups at birth, or pup survival indices during lactation in either the F0 or F1 generation. No abnormal histopathology was noted in organs examined. A statistically significant decrease (p<0.05) in weight relative to controls was observed in the first generation offspring during study weeks 19 through 36. The decrease was maintained throughout the lactation period in the F1 pups from F0 dams exposed to the highest exposure and in those from the ancillary group in which F0 females exposed to the 2000 ppm concentration were mated with males having no exposure. No additional data were available in the report about the F2 generation. A NOAEL of 600 ppm and a LOAEL of 2000 ppm were identified for decreased pup weight.
4.4. OTHER STUDIES
4.4.1. Acute Toxicity Data
4.4.1.1. Oral Exposure
Mehta et al. (1998) exposed groups of male and female Sprague-Dawley rats to a single gavage dose of 0, 3, 4.5, or 6 mL toluene/kg (0, 2600, 3900, or 5200 mg/kg, respectively). On days 1 (2-3 hours after exposure), 7, and 14 postexposure, the animal body weights were recorded, and a functional observation battery (FOB) was conducted to detect neurobehavioral changes. A significant, dose-dependent decrease in body weight occurred at day 7 for male rats. Decreases in body weight gain were noted in male rats at 14 days and female rats at 7 days, but the differences were not statistically significant. On day 1, but not on days 7 and 14, toluene-treated rats of both sexes exhibited a dose-dependent increase in abnormal gait. The open-field rearing scores were lower for all groups of both sexes at day 1 only, though only achieved statistical significance in high-dose females. Horizontal motor activities were significantly lower
51
in both sexes at all dose levels on day 1. The values remained lower in all treated female groups and in the 2600 and 3900 mg/kg male rats on day 7 and female rats on day 14. Rats of both sexes showed increased incidences of lacrimation and/or salivation on day 1 only. The effect was more pronounced in females.
Dyer et al. (1988) exposed groups of male Long-Evans rats to a single gavage dose of 0, 250, 500, or 1000 mg toluene/kg in corn oil. Flash-evoked potential (FEP) tests were administered 45 minutes later as a test of the ability of the nervous system to process visual information. Toluene exposure resulted in a significant decrease of the N3 peak of the FEP for all dose groups, though the decrease was not dose-related. In the same study, rats were exposed to 500 mg/kg and FEP was examined at 4, 8, 16, and 30 hours postexposure. Depression of the N3 peak remained at 8 hours postexposure, but by 16 hours recovery appeared complete.
4.4.1.2. Inhalation Exposure
A number of acute animal studies have examined the neurological effects of inhaled toluene; these studies generally reported impaired response in neurologic examinations. For example, Rebert et al. (1989a,b) reported abnormal flash-evoked potentials in rats exposed to a single inhalation exposure of 500-16,000 ppm toluene. Lataye et al. (2003) tested cochlear function in rats and guinea pigs following exposure to 600 ppm toluene for 5 days and reported severe disruption of auditory function and cochlear pathology in rats but no observable effects in guinea pigs. Wood et al. (1983) exposed rats to toluene levels up to 3000 ppm for 4 hours prior to behavioral evaluation and reported that toluene reduced performance in behavioral tests, particularly at the 1780 and 3000 ppm exposure levels. Wood and Colotla (1990) reported a biphasic response in mice exposed to toluene for 1 hour. An increase in activity was seen at concentrations up to 1000 ppm, beyond which decreased activity was seen. Similar results were reported by Wood and Cox (1995), with rats exposed at concentrations up to 1000 ppm showing progressive increases in activity, with decreasing activities at higher concentrations up to and including 3000 ppm.
52
4.4.2. Genotoxicity
Toluene has tested negative for reverse mutation in Salmonella typhimurium, both with and without a liver S-9 activating system (Mortelmans and Riccio, 1980; Nestmann et al., 1980; Bos et al., 1981; Litton Bionetics, Inc., 1981; Connor et al., 1985; NTP, 1990; Huff, 2003). Toluene also tested negative in the umu test in S. typhimurium (Nakamura et al., 1987) and was negative for reverse mutation in E. coli (Fluck et al., 1976). NTP (1990) reported no increase in sister-chromatid exchanges (SCE) or chromosomal aberrations in Chinese hamster ovary cells exposed to toluene. Available studies (Gerner-Smidt and Friedrich, 1978; Richer et al., 1993) have reported no increase in SCE in human lymphocytes exposed in vitro to toluene, even at concentrations that inhibited cellular growth.
Dobrokhotov and Enikeev (1977) exposed male rats (strain not specified) to 610 mg/m3
toluene for 4 hours/day for 4 months, reporting a reversible increase in chromosomal gaps and breaks in isolated bone marrow cells. Mice exposed to toluene at concentrations of 100 or 400 ppm for 6 hours/day, 5 days/week for 8 weeks showed no increase in dominant lethal mutations (measured as pre- or post-implantation embryo loss) relative to controls (API, 1981). BDF1 mice exposed to 500 ppm toluene for 6 hours/day, 5 days/week for up to 8 weeks showed no increase in DNA damage, assessed by starch gel electrophoresis, relative to controls (Plappert et al., 1994).
Tokunaga et al. (2003) used male Wister rats to investigate the effect of toluene inhalation on oxidative damage in rat organs. The rats were exposed to 1500 ppm for four hours a day over 7 days, and oxidative DNA damage, lipid peroxidase, and superoxide dismutase were examined. 8-Hydroxy-2'-deoxyguanosine immunoreactivity, a marker for oxidative DNA damage, increased in the rat lung, kidney, and liver. Superoxide dismutase immunoreactivity increased in the lung, liver, and kidney, however, the amount of lipid peroxidase in the organs did not change.
The majority of studies in toluene-exposed workers (Forni et al., 1971; Funes-Craviota et al., 1977; Maki-Paakkanen et al., 1980) have reported no differences in chromosomal aberrations between control subjects and toluene-exposed workers. Similarly, humans exposed to toluene have not generally demonstrated increases in SCE (Funes-Craviota et al., 1977; Haglund et al., 1980; Maki-Paakkanen et al., 1980; Richer et al., 1993), cell cycle delay (Richer et al., 1993), or DNA damage as indicated by Comet assay (Pitarque et al., 1999). However, a few studies of
53
exposed workers (Bauchinger et al., 1982; Nise et al., 1991; Hammer, 2002) have found increases in chromosomal breaks, exchanges, and/or gaps relative to controls. Pitarque et al. (2002), in a population of shoe factory workers exposed to solvents (including toluene, gasoline, and acetone), found an increase in micronuclei, but not sister chromatid exchanges, in cultured peripheral lymphocytes. However, the chemical exposure responsible for the increase in micronuclei could not be identified with any certainty (Pitarque et al., 2002). Other studies (Schmid et al., 1985; Pelclova et al., 1990) have reported genotoxic changes in toluene-exposed workers, but the changes have either been reversible or they could not be directly attributed to toluene exposure due to confounding factors.
4.5. SYNTHESIS AND EVALUATION OF MAJOR NONCANCER EFFECTS – ORAL AND INHALATION
4.5.1. Oral Exposure
Published toxicity studies of oral exposure to toluene in humans are limited to case reports of acute oral overdoses (Ameno et al., 1989; Caravati and Bjerk, 1997). Clinical effects in these cases have included central nervous system depression, severe abdominal pain, diarrhea, and hemorrhagic gastritis. Chronic toxicity studies of oral toluene exposure in animals are not available. Maltoni et al. (1997) conducted a 2-year gavage study of toluene in rats; however, only carcinogenic endpoints were reported. NTP (1990) conducted a 13-week gavage study of toluene in F-344 rats and B6C3F1 mice. In rats, which were more sensitive to toluene than mice, effects reported were in the kidney and liver, with organ weight changes at the low doses accompanied by nephrosis at higher doses with no evidence of hyaline droplet formation. At higher exposure levels an increased incidence of rats with mineralized foci and necrosis of normal brain cells was also observed; this effect was not noted in mice at any exposure level (NTP, 1990). Hsieh et al. (1990 a,c) exposed CD-1 mice to toluene in drinking water for 28 days, and at 5 mg/kg-day significant changes in brain neurotransmitter levels were reported. Neurotoxicity studies from oral exposure to toluene have not been performed.
The immunotoxicity of toluene has been studied by several laboratories (Hsieh et al., 1989, 1990b, 1991; Burns et al., 1994) for purposes of comparison to benzene and nitrotoluenes (known immunotoxicants). Immunosuppressant effects from toluene exposure have been
54
demonstrated in in vivo and ex vivo assays. Host resistance assays by Burns et al. (1994) indicate a lack of immunotoxic response when animals treated with toluene are challenged. Host resistance to challenges with Listeria monocyogenes, Streptococcus pneumoniae, Plasmodium yoelii, or B16F10 melanoma was not affected at a dose of 600 mg/kg-day for 14 days. In addition, a reduced incidence of tumors was observed in mice that were challenged with PYB6 fibrosarcoma.
4.5.2. Inhalation Exposure
There are numerous occupational studies and case reports from inhalation exposure to toluene available in the literature. Many studies have been published examining neurological endpoints resulting from repeated exposure in occupationally exposed workers. Results from these studies suggest that neurologic effects are the most sensitive endpoint following inhalation exposure to toluene. Two of the most studied endpoints at lower exposure levels include color vision deficits and hearing loss.
The most compelling evidence for the ability of repeated toluene inhalation exposure to produce persistent neurologic effects comes from case reports of toluene abusers, who are generally exposed to concentrations in the range of 1000-10,000 ppm. MRI examinations of the brains of solvent abusers (Filley et al., 1990; Rosenberg et al., 1988a,b) suggest a preferential atrophy in lipid-rich regions of the brain. Rosenberg et al. (1988a,b) found MRI evidence of diffuse central nervous system demyelination in 6 toluene abusers with clinically obvious neurological impairment, whereas Filley et al. (1990) noted that the degree of MRI-detected white matter abnormality in 14 solvent abusers was correlated with neurological impairment. The observed changes in MRI signals may be related to lipid compositional changes in the white matter, since these regions are more lipid-rich than gray matter (Ameno et al., 1992).
There is evidence that exposure to toluene results in both transient and persistent effects on neurologic endpoints. For example, Baelum et al. (1985) reported that the neurologic responses, including altered color vision, of rotogravure printers (average long-term toluene exposure of 9 to 25 years) exposed to a single 6.5-hour exposure of 100 ppm toluene did not differ from a control group that had not been previously exposed to toluene, suggesting that the acute effects of toluene on color vision were transient rather than being dependent on previous exposure history. In contrast, Zavalic et al. (1998b) reported that analysis of color vision scores
55
in toluene-exposed workers on Wednesday did not differ from the scores in the same workers on Monday after at least 48 hours without exposure, suggesting that the effect was persistent. Similarly, McWilliams et al. (2000) reported that guinea pigs exposed to 500 ppm toluene for up to 4 weeks showed a reversible hearing loss, while Pryor et al. (1984) reported that hearing loss in male rats exposed to 1000 ppm toluene or greater for up to 2 weeks was still present after a 3month recovery period.
Animal data have also suggested that respiratory tract irritation, particularly in the nasal cavity, is a sensitive effect of toluene. However, the primary study that reported this effect (NTP, 1990) only examined concentrations of 600 ppm and greater. Lifetime chronic (CIIT, 1980) and 28-day subchronic (Poon et al., 1994) studies have examined exposed rats for changes in the nasal epithelium following exposure to 300 ppm toluene, and both failed to report a treatment-related effect. Available data from acutely exposed humans demonstrates that nasal or ocular irritation is not reported by subjects until the airborne toluene concentration reaches 100 ppm (Echeverria et al., 1989; Andersen et al., 1983), while subtle neurologic changes may be noted at lower concentrations. One study in animals has reported persistent neurobehavioral effects at concentrations known to cause similar effects in humans. Von Euler et al. (2000) reported diminished performance in the water maze test in rats 4 weeks after exposure to 80 ppm toluene. Benignus et al. (1998) address the issue of apparent rat-human sensitivity differences to toluene exposure. After using a PBPK model to estimate blood toluene concentrations at the time of behavioral assessment, their review of the literature showed that behavioral effects in humans are reported at lower blood concentrations than in rats. This might be attributed either to different behavioral assessment techniques used in testing the two species or to a variety of biological factors.
A number of developmental effects, particularly neurodevelopmental changes, have been reported in children of women who abused toluene during pregnancy. Effects reported in children exposed in utero to toluene include microcephaly, CNS dysfunction, attention deficits, developmental delay/mental deficiency, small mid face, deep-set eyes, micrognathia (smallness of the jaws), and blunting of the fingertips (Byrne et al., 1991; Devathasan et al., 1984; Hunnewell and Miller, 1998; King et al., 1981; Maas et al., 1991; Meulenbelt et al., 1990; Miyagi et al., 1999; Ryu et al., 1998; Suzuki et al., 1983). Several studies in rats have reported altered neurobehavioral parameters in offspring following exposure of pregnant dams to high ($800 ppm) concentrations of toluene (DaSilva et al., 1990; Hass et al., 1999; Hougaard et al., 1999). Significant changes in other developmental endpoints have also been reported in animal
56
studies, including increases in spontaneous abortions, resorptions, altered pup body and organ weights, and altered pup development, but generally only at high doses ($1000 ppm) (Dalgaard et al., 2001; Ono et al., 1995, 1996; Thiel and Chahoud, 1997; Ungvary and Tatrai, 1985). A two-generation inhalation reproduction study in rats did not report alterations in any indices of fertility, though decreased pup weight in the F1 generation exposed to 2000 ppm toluene was reported during the first 15 weeks of life, after which weights did not significantly differ from controls (API, 1984; Roberts et al., 2003).
4.5.3. Mode of Action
Understanding of the mechanisms by which toluene may exert its toxic effects is limited. The parent compound, rather than a metabolite, is believed to be responsible for the observed toxicity. Support for the parent compound comes from the observation that pretreatment of rats with phenobarbital, thereby increasing the levels of CYP enzymes, increased the rate of in vivo toluene metabolism and shortened the time of recovery from narcosis from single intraperitoneal doses of toluene (Ikeda and Ohtsuji, 1971). Also, inhibition of toluene metabolism by pretreatment with ethanol resulted in a potentiation of toluene-induced hearing loss in rats (Campo et al., 1998). On the other hand, Mattsson et al. (1989) have reported similar neuroexcitatory effects between toluene and the metabolite o-cresol, suggesting that metabolites might contribute to some of the neuroactive properties of toluene.
On a molecular scale, little is known about the mechanisms by which toluene produces acute or residual central nervous system (CNS) effects but it is reasonable to assume that its toxic effects are due, at least in part, to its general characteristics as a solvent. The Meyer-Overton theory of partitioning of a compound into membrane lipids has been widely accepted for a century (Franks and Lieb, 1985, 1987). Recently, it has been proposed that the presence of solvent molecules in cholesterol-filled interstices between phospholipids and sphingolipids changes membrane fluidity, thereby altering intercellular communication and normal ion movements (Engelke et al., 1996). It is not known if this mechanism is involved in the chronic effects of toluene, but the observed neural demyelinization in toluene abusers (Rosenberg et al., 1988a,b) would be suggestive evidence of such a role. An alternative hypothesis is that toluene partitions into hydrophobic regions of proteins and interacts with them, thereby altering membrane-bound enzyme activity and/or receptor specificity (Balster, 1998). Other evidence suggests that toluene and other volatile organic compunds (VOCs) may act by enhancing γ
57
aminobutyric acid type A (GABAA) receptor function (Mihic et al., 1994), attenuating N-methyl-D-aspartate (NMDA) receptor-stimulated calcium flux (Cruz et al., 1998), activating dopaminergic systems (von Euler, 1994a), and inhibiting voltage-sensitive calcium channels (Tillar et al. 2002). In addition, toluene has been shown to inhibit signal transduction through the stimulation of human muscarinic acetylcholine receptor m2 subtypes in Chinese hamster ovary (CHO) cells (Tsuga et al., 2002). Other neurologic effects may involve a number of neurochemical alterations, including changed whole-brain concentrations of dopamine, norepinephrine, and 5-hydroxytryptamine in rats exposed for 8 hours to 100, 300, or 1000 ppm toluene (Rea et al., 1984); changed dopamine D2 receptor binding in rats exposed to 80 ppm toluene, 6 hours/day, 5 days/week for 4 weeks (von Euler et al., 1993, 1994b); and increased cerebellar concentrations of glial cell protein markers (α-enolase, creatine kinase-B, and β-S100 protein) in rats exposed to 100, 300, or 1000 ppm toluene 8 hours/day for 16 weeks (Huang et al., 1992). The data of Soulage et al. (2004) points toward modifications of 5-hydroxytryptophan and catecholamine biosynthesis rates in several regions of the rat brain after a 16-week, subchronic exposure to 40 ppm for 104 hours per week. However, the persistence of the above effects, which would implicate these mechanisms in the effects of chronic toluene exposure, has not been established. In addition, Yamaguchi et al. (2002) have shown prenatal brain development can be disrupted at low, environmentally-relevant levels of toluene exposure by the inhibition of glial fibrillary acidic protein induction in serum-free mouse embryo cells.
In addition to receptor reactivity, toluene may also cause molecular damage via free radical oxidation. In female rats exposed to 50 and 500 mg/m3 toluene via inhalation for 4 hours a day, 5 days a week for one month, increased glutathione peroxidase activity and the activation of free radical processes were apparent in both brain and ovarian tissue, while the ovarian tissue also showed an increase in catalase activity and protein peroxidation (Burmistrov et al., 2001). Also, toluene metabolites, methylhydroquinone and methylbenzoquinone, may cause oxidative DNA damage that is reproductively toxic due to the relative inability of spermatogenic cells to repair DNA damage (Murata et al., 1999). Nakai et al. (2003) showed increased formation of 8hydroxy-2'-deoxyguanosine, a biological marker for oxidative DNA damage, in the testes after subcutaneous injection of toluene at 50 and 500 mg/kg once a day for ten days. These results suggest that the reproductive toxicity of toluene stems from direct oxidative DNA damage to the spermatazoa.
The mode of action of color vision loss induced by toluene and certain other solvents is not known. Occupation-related color vision impairment, like other acquired dyschromatopsias,
58
usually results in impairment of blue-yellow color discrimination or, less frequently, in a combination of blue-yellow and red-green loss. Congenital dyschromatopsias more frequently result in red-green deficits (Hart, 1987, 1992; Mergler et al., 1987; Gobba and Cavalleri, 2003). According to Koller’s rule, changes in the blue-yellow range of observation suggest a retinal location of the effect (Hart, 1992). One possible mechanism may be related to a direct effect of solvents (or metabolites) on cone function (e.g., membrane metabolism) or to an interference with neurotransmitters (such as dopamine) (see Geller and Hudnell, 1997, for a review).
Toluene causes alterations of the c-wave (a component of the electroretinogram) and the standing potential (the potential which develops between the cornea and retina) (Skoog and Nilsson, 1981) in monkeys, which are due to changes of the potentials of the receptor-pigment epithelial complex (Griff, 1991; Steinberg et al., 1983). The retinal pigment epithelium has three major functions — vitamin A transport, phagocytosis of the upper tenth of the photoreceptor outer segment, and potassium buffering — in addition to transport and metabolism of different substances. However, patients suffering from chronic abuse of toluene and resultant visual disturbances have been shown to have optic neuropathies and changes in the electroretinograms that were different from those observed in the monkeys (Skoog and Nilsson et al., 1981; Toyonaga., 1989). Further research in this area is needed.
The mode of action of renal toxicity following toluene exposure is unknown. Al-Ghamdi et al. (2003a) found decreased cell viability, lactate dehydrogenase release, increased levels of malondialdehyde, increased CYP2E1 activity, but no DNA fragmentation when LLC-PK1 cells (proximal tubule cells) were exposed to 5 mM toluene for 48 hours, suggesting necrosis as the predominant mode of cell death. The results of this study also suggest a pivotal role of CYP2E1 in the induction of oxidative stress and necrosis as the effects were inhibited by co-exposure to disulfuram (an inhibitor of CYP2E1). Al-Ghamdi et. al (2003b) found that both xylene and toluene, individually, reduced cell viability and increased caspase-3 activation. The inhibition of caspase-3, which is a critical apoptosis protein, prevented cell injury in proximal tubular cells, and the activation of which may play a role in toluene-induced proximal tubular cell injury. Some studies have shown that renal failure in toluene abusers was accompanied by myoglobinuria, which might be attributed to rhabdomyolysis and not to primary kidney toxicity (O’Brien et al., 1971; Reisin et al., 1975). Other studies of organic solvents suggest that the mechanism of lesion formation in the kidney may be due to the induction of damage to the alveolar basement membrane, leading to a production of alveolar basement membrane antibodies
59
that cross-react with the glomerular basement membrane and initiate glomerular disease (Carlier et al., 1980).
4.6. WEIGHT-OF-EVIDENCE EVALUATION AND CANCER CHARACTERIZATION
4.6.1. Summary of Overall Weight-of-Evidence
Under the Guidelines for Carcinogen Risk Assessment (U.S. EPA, 2005) there is inadequate information to assess the carcinogenic potential of toluene because studies of humans chronically exposed to toluene and mixtures containing toluene are inconclusive, toluene was not carcinogenic in adequate inhalation cancer bioassays of rats and mice exposed for life (CIIT, 1980; NTP, 1990; Huff, 2003), and increased incidences of mammary cancer and leukemia were reported in a lifetime rat oral bioassay at a dose level of 500 mg/kg-day but not at 800 mg/kg-day (Maltoni et al., 1997). In the NTP (1990) and Huff (2003) studies, no neoplasms were noted in male rats, and one nasal, two kidney, and two forestomach neoplasms observed in female rats were considered not to be associated with toluene exposure. No increase in the incidence of neoplasms was observed in mice. Toluene has generally not been genotoxic in short-term testing protocols. Available animal studies as well as human epidemiological surveys of occupational exposure performed thus far have not clearly demonstrated a carcinogenic effect. The previous IRIS assessment classified toluene as Group D (not classifiable as to human carcinogenicity) under the Guidelines for Carcinogen Risk Assessment (U.S. EPA, 1986c) based on inadequate data on the carcinogenicity of toluene in humans and inadequate evidence of carcinogenicity in animals. Toluene is not included in the 10th Report on Carcinogens (NTP, 2002). The International Agency for Research on Cancer (IARC) has classified toluene as Group 3 (not classifiable as to its carcinogenicity in humans) with a supporting statement that there is inadequate evidence in humans and that available evidence suggest a lack of carcinogenicity of toluene in experimental animals (IARC, 1999).
60
4.6.2. Synthesis of Human, Animal, and Other Supporting Evidence
Available studies in toluene-exposed workers have reported very limited or no evidence of carcinogenic effects of toluene exposure (Antilla et al., 1998; Svennson et al., 1990; Wiebelt and Becker, 1999). A cohort mortality study in toluene-exposed workers (Wiebelt and Becker, 1999) did not report an increase in cancer-specific mortality for the entire cohort. A subcohort of highly-exposed workers demonstrated statistically significant increases in mortality from cancers of the bone and connective tissue, but lack of exposure characterization, co-exposure information, and adjustment for other confounding factors (age, smoking, etc.) within the subcohort precludes drawing conclusions from these results as to the possible association between toluene exposure and cancer risk. Svennson et al. (1990) similarly did not report increased cancer-specific mortality among rotogravure printers. While an increase in tumors of the respiratory tract was reported, this increase was not statistically significant when only subjects with exposure periods of 5 years or more were examined and no dose-response relationships were present for tumor incidence. Antilla et al. (1998) carried out a retrospective cohort analysis of 5301 workers monitored for biological markers of occupational exposure to styrene, toluene, or xylene, but no significantly increased incidence rates of cancer could be associated with toluene exposure. Other studies examining the carcinogenicity of toluene in occupationally exposed humans have failed to adequately account for co-exposure to other compounds.
NTP (1990) has conducted a 2-year inhalation carcinogenicity study in F-344 rats and B6C3F1 mice and found no evidence for carcinogenicity in either sex of either species at exposure levels up to 1200 ppm. Another inhalation carcinogenicity study in F-344 rats (CIIT, 1980; Gibson and Hardisty, 1983) likewise reported no evidence for carcinogenic effects of toluene at exposure levels up to 300 ppm. A lifetime carcinogenicity study in Sprague-Dawley rats by the oral route (Maltoni et al., 1997) was suggestive of potential carcinogenic effects of toluene, but the dose-response relationships were not well defined (i.e., the 500-mg/kg animals had considerably more tumors than those in the 800-mg/kg group) and study details were inadequately reported.
Available studies examining the genotoxic effects of toluene have generally reported negative results. Toluene was found to be nonmutagenic in reverse mutation assays with S. typhimurium (Mortelmans and Riccio, 1980; Nestmann et al., 1980; Bos et al., 1981; Litton Bionetics, Inc., 1981; Snow et al., 1981; Connor et al., 1985; Nakamura et al., 1987; NTP, 1990)
61
and E. coli (Fluck et al., 1976; Mortelmans and Riccio, 1980), with and without metabolic activation. Toluene did not induce mitotic gene conversion (Litton Bionetics, Inc., 1981; Mortelmans and Riccio, 1980) or mitotic crossing over (Mortelmans and Riccio, 1980) in S. cerevisiae. Although Litton Bionetics, Inc. (1981), reported that toluene did not cause increased chromosomal aberrations in bone marrow cells, several Russian studies (Lyapkalo, 1973; Dobrokhotov and Enikeev, 1977) report toluene as effective in causing chromosomal damage in bone marrow cells of rats. There was no evidence of chromosomal aberrations in blood lymphocytes of workers exposed to toluene only (Forni et al., 1971; Maki-Paakkanen et al., 1980); however, Bauchinger et al. (1982) and Hammer (2002) found a cytogenetic effect in workers exposed to toluene, and a slight increase was noted in workers co-exposed to toluene and benzene (Forni et al., 1971; Funes-Craviota et al., 1977; Nise et al., 1991). The findings of Forni et al. (1971) and Maki-Paakkanen et al. (1980) are supported by studies of cultured human lymphocytes exposed to toluene in vitro; no elevation of chromosomal aberrations or sister chromatid exchanges was observed (Gerner-Smidt and Friedrich, 1978). However, oxidative DNA damage was observed in the rat lung and kidney after toluene inhalation (Tokunaga et al., 2003), and the toluene metabolites methylhydroquinone and methylbenzoquinone also caused oxidative DNA damage to human DNA fragments from the p53 tumor suppressor gene in the presence of copper(II) plus NADH (Murata et al., 1999).
4.7. SUSCEPTIBLE POPULATIONS AND LIFE STAGES
4.7.1. Possible Childhood Susceptibility
Only limited data exist that examine the potential differences in susceptibility to toluene between children and adults. Children have been shown to have differences in levels of CYP enzymes and several phase II detoxification enzymes (e.g., N-acetyl transferases, UDPglucuronyl transferases, and sulfotransferases) relative to adults (Leeder and Kearns, 1997; Nakajima et al., 1992; Vieira et al., 1996), as well as other physiological differences (e.g., children have higher brain mass per unit of body weight, higher cerebral blood flow per unit of brain weight, and higher breathing rates per unit of body weight) (Snodgrass, 1992). However, data on the possible contributions of these differences to potential age-related differences with respect to toluene are lacking.
62
Transfer of toluene to nursing infants from breast milk of currently exposed mothers is expected to be a possibility because of the lipophilicity of toluene and the relatively high lipid content of breast milk. Toluene has been detected in human breast milk at a mean (± SD) concentration of 0.76 (± 0.76) μg/kg (Fabietti et al., 2004). Elimination kinetics data for nonpregnant or nonlactating humans and rats following toluene exposure, however, indicate that most absorbed toluene is rapidly eliminated from the body and that a much smaller portion (that which gets into adipose tissues) is slowly eliminated (Leung and Paustenbach, 1988; Löf et al., 1993; Pierce et al., 1996, 1999; Pellizzari et al., 1992; Rees et al., 1985).
Fisher et al. (1997) developed a human PBPK model (See section 3.5 for more details) that predicts transfer of toxicant via lactation from a mother to a nursing infant and used the model to estimate the amount of toluene that an infant would ingest via milk if the mother was occupationally exposed to toluene at the ACGIH (2000) Threshold Limit Value (TLV = 50 ppm) throughout a workday. The model predicted that such an infant would have a daily oral intake of 0.46 mg toluene/day. It should be noted, however, that no human (or animal) studies are available regarding in vivo distribution of toluene into breast milk or elimination kinetics from breast milk, and the Fisher et al. (1997) PBPK model has not been validated with in vivo data.
4.7.2. Possible Gender Differences
Available studies in humans and animals have not definitively demonstrated whether sex-related differences in the toxicity of toluene exist. Human occupational studies have not reported sex-related differences in effects, with the exception of the study of Plenge-Bönig and Karmaus (1999), which reported decreased fertility in occupationally exposed women but not in occupationally exposed men. Co-exposure to other solvents in this study was not ruled out. Exposure to toluene and pregnancy outcome was determined by questionairre. In rats and mice exposed to toluene orally for 13 weeks (NTP, 1990), males of both rats and mice showed toxic effects at lower doses than females. Similarly, in 15-week inhalation studies (NTP, 1990), males were demonstrated to be more sensitive to the effects of toluene than females; however, no differences were apparent between males and females in a 2-year inhalation bioassay (NTP, 1990). Another chronic inhalation study in rats (CIIT, 1980) failed to show significant differences between males and females with regard to toxicity, but females appeared to be more sensitive with regard to changes in hematocrit.
63
4.7.3. Other
Color vision impairment has been shown to increase with age (Ruddock, 1965; Bowman et al., 1984), diabetes (Matyjavri, 1992; Utku and Atmaca, 1992), and alcohol intake (Russell et al, 1980; Mergler et al., 1988). These populations may be more susceptible than the general population to any decrements in color vision from environmental exposure. It is not known if this effect is related to the possible differences in metabolism rates under these conditions or some other inherent property related to age or alcohol consumption.
Toluene is initially metabolized to benzyl alcohol by the microsomal mixed-function oxidase system. Subsequent oxidation to benzaldehyde and then to benzoic acid is carried out by alcohol and aldehyde dehydrogenase, respectively. There are two forms of the dehydrogenases (low Km and high Km). Japanese and possibly other populations of Asian origin and Native Americans have a defective gene for the low Km dehydrogenase. When toluene-exposed Japanese workers (both male and female) were evaluated for the defective gene, it was found that those possessing the defective gene had lower levels of urinary hippuric acid and orthocresol than those with the normal or heterozygous gene (Kawamoto et al., 1994). Thus, these individuals may be at a higher risk of toluene-induced CNS impairment due to a decreased rate of metabolism, assuming that the parent chemical is responsible for adverse effects.
5. DOSE RESPONSE ASSESSMENTS
5.1. ORAL REFERENCE DOSE (RfD)
5.1.1. Choice of Principal Study and Critical Effect
No studies examining the chronic or subchronic effects of oral exposure to toluene in humans are available. A lifetime gavage study in rats (Maltoni et al., 1997) reported only carcinogenic endpoints and is, therefore, not suitable for use as the principal study for derivation of an RfD. One subchronic study (NTP, 1990) examining oral exposure to toluene in rodents (rats and mice) is available and was chosen as the principal study. The critical effect chosen is increased kidney weight. NTP (1990) exposed both sexes of F-344 rats and both sexes of
64
B6C3F1 mice to toluene by gavage for 13 weeks. In male rats, absolute and relative weights of both the liver and kidney were significantly increased (p<0.05) at doses greater than or equal to 446 mg/kg-day. Absolute kidney weights were 100, 107, 112, 119, and 113% of controls; relative kidney weights were 100, 100, 106, 114, and 146% of controls for 0, 223, 446, 900, or 1800 mg/kg-day dose levels. The study in rats established a NOAEL of 223 mg/kg-day for increases in liver and kidney weights of male rats, with a LOAEL of 446 mg/kg-day. Histopathologic lesions in the liver consisted of hepatocellular hypertrophy, occurring at doses greater than 2500 mg/kg-day. Nephrosis was observed in rats that died, and damage to the tubular epithelia of the kidney occurred in terminally sacrificed rats. Kidney sections were examined in particular for the occurrence of hyaline droplets in the proximal tubules with negative findings. A concentration-dependent nephropathy was also seen in chronic inhalation cancer bioassays (NTP, 1990; Huff, 2003). It should be noted that no increase in kidney weight was seen in the parallel study in B6C3F1 mice, indicating a species difference in the response.
The choice of increased kidney weight as the critical effect is supported by several acute oral and inhalation human toxicity studies, indicating renal tubule toxicity. One case report following lethal oral exposure to 625 mg/kg toluene (Ameno et al., 1989) and a nonlethal case report of thinner ingestion (Caravati and Bjerk, 1997) noted acute tubular necrosis and acidosis. Inhalation of high doses of toluene has caused distal renal tubular acidosis (Taher et al., 1974; Fischman and Oster, 1979) among drug users, sometimes with tubular proteinuria (Kamijima et al., 1994). A case of focal segmental glomerulosclerosis was noted for a leather worker exposed to toluene for 40 years (Bosch et al., 1988). Toluene sniffing has been associated with the formation of renal stones (Kroeger et al., 1980), proteinuria (Streicher et al., 1981), and hepatorenal damage (O’Brien et al., 1971). In addition, a case of anti-glomerular basement membrane antibody-mediated glomerulonephritis has also been reported in a woman who sniffed glue for several weeks (Bonzel et al., 1987). It should be noted that several studies involving painters (Askergren, 1982; Franchini et al., 1983) or printers (Gericke et al., 2001) with toluene exposure have reported no effect on renal function. Askergren (1982) and Franchini et al. (1983) found no effect on excretion of $-2-microglobulin, and Gericke et al. (2001) found no effect on serum creatinine levels or glomerular filtration rate. The choice of increased kidney weight as a critical effect is based on the above data and the available animal data indicating an increase in kidney weight in the same studies where overt kidney toxicity was observed at higher doses. The available data on postulated modes of action for toluene-induced kidney toxicity are described in Section 4.5.3.
65
A number of immunotoxicity studies are available (Hsieh et al., 1989, 1990b, 1991; Burns et al., 1994) and were considered for use as the principal study. Changes in thymus weights in the Hsieh et al. (1989) study were not considered an adverse effect since no change was observed in later studies by Hsieh et al. (1990b) and Burns et al. (1994). Additional effects on immunological endpoints were considered as a potential critical effect from toluene exposure. For example, statistically significant and dose-related decreases in antibody response were noted by Hsieh et al. (1989, 1990b, 1991). There is evidence that the PFC assay is among the most predictive tests available for immunotoxicity (Luster et al., 1992) and that suppression of the antibody response is predictive of decreased resistance to challenge with infectious agents or tumor cells (Luster et al., 1993). An important objective of the use of the PFC assay and anti-SRBC ELISA in immunotoxicity testing is to determine the ability of the immune system to respond to an antigenic challenge. As such, it tests the ability of three primary immune system cells (i.e., macrophages [phagocytosis and processing of SRBCs], T lymphocytes [which assist B lymphocytes] and B lymphocytes [production and release of anti-SRBC specific antibody]) to respond to this antigen in a coordinated manner leading to the production of antibodies to SRBC.
However, in the same test that Hsieh et al. (1989, 1990b, 1991) showed suppression of the antibody response (the PFC assay), Burns et al. (1994) did not find immunosuppression. The studies were not entirely parallel; Hsieh and Burns used different mouse strains (CD-1 and B6C3F1, respectively), examined different sexes (males and females, respectively), and utilized different exposure durations (28 vs. 14 days, respectively). Furthermore, the host resistance assays by Burns et al. (1994) indicated a lack of immunotoxicity when animals treated with toluene were challenged. Host resistance to challenges with Listeria monocyogenes, Streptococcus pneumoniae, Plasmodium yoelii, or B16F10 melanoma was not affected at a dose of 600 mg/kg-day for 14 days. In addition, a reduced incidence of tumors was observed in mice that were challenged with PYB6 fibrosarcoma. Štefanovi… et al. (1987) found no significant changes in immunoglobulin levels after toluene treatment of human sera and also showed no changes in the complement activity parameters studied in the toluene treated sera. The conflicting data between the Hsieh and Burns studies and the lack of suppression of host resistance present an unclear picture of toluene immunotoxicity. For these reasons, immunotoxic endpoints alone are not considered critical effects.
Additional studies by Hsieh et al. (1990a,c) found statistically significant increases in a variety of brain neurotransmitter levels at exposure levels as low as 5 mg/kg-day. The study
66
authors measured levels at one time point immediately at the termination of toluene treatment; it cannot be determined if the effects observed were persistent. Neurotoxicity studies from oral exposure to toluene have not been performed; therefore, the changes in neurotransmitter levels have not been correlated with behavioral, neuropsychological, or neuroanatomical changes and were not considered further. Available reproductive studies (Gospe et al., 1994, 1996; Gospe and Zhou, 1998, 2000) were conducted at higher doses than those used in the studies described above with minimal effects on dams and offspring and, as such, were not considered for the choice of principal study.
5.1.2. Methods of Analysis
The RfD was derived by the benchmark dose approach using EPA’s (U.S EPA, 2001) benchmark dose software (BMDS, Version 1.3). The benchmark response (BMR) was defined as the change of one control standard deviation from the control mean (U.S. EPA, 2000). Benchmark analysis was performed for absolute kidney weight changes in male rats (NTP, 1990). Male rat kidney data were chosen for BMD modeling as these data exhibited a greater response than that seen in female rats (see study description in Section 4.2.1.1). A BMDL of 238 mg/kg-day was derived and used as the point of departure. The BMDL corresponds to the lower bound on the dose associated with a 10% increase in individuals having a kidney weight greater than the 98th percentile of kidney weights in the control group (and the SD corresponding to 9% increase in kidney weight from control). Details of the model results are presented in Appendix B-1.
As discussed in Section 5.1.1, the use of immunotoxicity endpoints for the derivation of the RfD is problematic due to conflicting data and a lack of suppression of host resistance in oral in vivo assays. However, for illustrative purposes, selected endpoints which showed a positive result for immunosuppression were chosen for benchmark dose modeling as outlined in Appendix B-2. The endpoints include PFC counts, IL-2 thymidine uptake, IL-2 stimulation index, IL-2 activity, and mixed lymphocyte culture (MLC) responders and stimulators. It is unclear what the appropriate benchmark response (BMR) would be for an in vivo/ex vivo immunotoxicity study given the available redundancy in the immune system. In the absence of biological reasoning for a particular BMR, a benchmark dose (BMD) corresponding to 1 control SD from the control mean could be chosen according to U.S. EPA (2000). Due to the uncertainty in choosing an appropriate BMR for individual immunotoxicity endpoints, BMDs corresponding
67
to 0.5, 1.0, and 2.0 control SDs from the control mean are presented in Tables B-2.2 through B2.4. The corresponding BMDL (lower limit of a one-sided 95% CI for the BMD) values ranged from 2 to 110 mg/kg-day. The percent change in response at each BMD is presented in Table B2.5. Benchmark responses range from a 9% change from control mean for PFCs/million cells to a 90% decrease from controls in IL-2 activity. The literature on potential immunosuppression following toluene exposure via the oral route should not be ignored. The results of the BMD modeling exercise indicate that this endpoint deserves further research. Consideration of immunotoxicity as a critical effect, however, is not warranted at this time.
PBPK models in animals are available that describe the kinetics of toluene after inhalation exposure (Fisher et al., 1997; Pierce et al., 1996, 1999; DeJongh and Blaauboer, 1996, 1997; Tardif et al., 1993). When appropriate human and rat PBPK models are developed for the oral route of exposure, they could be used to estimate human oral exposure levels associated with an appropriate internal dose. Theoretically, the available toluene PBPK models could be utilized to extrapolate the risks of neurotoxic outcomes from inhalation exposure to oral exposure. However, in the case of toluene, unpublished data from the laboratory of Dr. Philip Bushnell (memorandum dated October 29, 2003, from Dr. William Boyes, U.S. EPA, to Dr. Lynn Flowers, U.S. EPA, “Potential use of PBPK modeling to support route-to-route extrapolation or duration adjustments for chronic exposure to toluene”) suggest that behavioral deficits observed in rats exposed to toluene by inhalation exposure are not observed in rats given toluene by oral gavage at doses expected to produce the same concentrations of toluene in the brain. The mechanism for this apparent difference in the effect of toluene by the oral and inhalation routes is not understood at this time.
5.1.3. RfD Derivation - Including Application of Uncertainty Factors
The BMDL of 238 mg/kg-day for increased kidney weight from the NTP (1990) study was utilized as the basis for the calculation of the RfD.
Total UF - 3000
A total uncertainty factor (UF) of 3000 was applied to this effect level: 10 for extrapolation for interspecies differences (UFA; animal to human), 10 for consideration of intraspecies variation (UFH; human variability), 10 for use of a subchronic study to estimate
68
chronic effects (UFS; duration of exposure), and 3 for database insufficiencies and contradictions in the immunotoxicity data (UFD). The total UF = 10 x 10 x 10 x 3 = 3000.
An uncertainty factor of 10 was used to account for laboratory animal-to-human interspecies differences (UFA). No information is available on differences or similarities in the toxicity of toluene between animals and humans.
An uncertainty factor of 10 was used to account for intraspecies differences (UFH) including variability in susceptibility in human populations and life-stages. This UF was not reduced because of the lack of human oral exposure information.
An uncertainty factor of 10 was used to account for extrapolating from a subchronic study to estimate chronic exposure conditions (UFS).
An uncertainty factor was not needed to account for extrapolating from a LOAEL to a NOAEL because BMD modeling was used to identify the point of departure.
An uncertainty factor of 3 was used to account for deficiencies in the toluene database. An oral subchronic study in two species is available. Neurotoxicity has been identified by inhalation studies in humans and animals as a critical endpoint. However, limited neurotoxicity studies by the oral route are available. Several oral exposure high-dose reproductive and developmental toxicity studies are available which indicate toluene does not generally elicit developmental or reproductive effects except at doses that are significantly higher than those causing other systemic effects (see Section 4.3 for details). A two-generation reproductive toxicity study by the oral route of exposure is not available, however, a two-generation reproductive toxicity study by the inhalation route of exposure is available that possibly lends support to the oral database in that effects are noted at high concentrations. Toxicokinetic information indicates that the absorption kinetics of toluene is similar and extensive following both oral and inhalation exposure. For example, Gospe and Al-Bayati (1994) compared oral and inhalation exposures to toluene in the rat and concluded that oral dosing produces blood toluene levels that are similar to those produced by inhalation (see Section 3.1.2). It should be noted, however, that differences in metabolism between exposure routes have not been elucidated, nor has a role for metabolites been ascertained in the toxicity of toluene. Immunotoxicity data are available but the results are conflicting. The data to date are inadequate to draw conclusions
69
regarding whether immunosuppression may be a more sensitive endpoint (i.e., an endpoint that would result in a lower point of departure) than kidney toxicity.
A three-fold uncertainty factor for insufficiencies in the database was used to account for the lack of adequate data on endpoints of potential concern for toluene, including neurotoxicity, two-generation reproductive toxicity and immunotoxicity.
The previous IRIS assessment utilized the NTP (1990) 13-week rat gavage study as the principal study and changes in liver and kidney weights as the critical effect for derivation of the RfD (0.2 mg/kg-day). The NOAEL was identified as 223 mg/kg-day. A composite UF of 1000 was applied to account for interspecies and intraspecies extrapolations, subchronic-to-chronic extrapolation, and limited reproductive and developmental toxicity data.
5.2. INHALATION REFERENCE CONCENTRATION (RfC)
5.2.1. Choice of Principal Study and Critical Effect
A substantial database examining the effects of toluene in subchronic and chronic occupationally-exposed humans exists. The weight of evidence from these studies indicates neurologic effects (i.e., impaired color vision, impaired hearing, decreased performance in neurobehavioral analysis, changes in motor and sensory nerve conduction velocity, headache, dizziness) as the most sensitive endpoint. Numerous case studies in humans exposed to high concentrations of toluene for abusive purposes have also indicated neurological effects in adults as critical effects of concern. Human studies indicating the potential for adverse effects from toluene exposure other than neurological effects are also available. None of these studies
70
indicated effects at doses lower than those observed for neurological effects. Animal studies (NTP, 1990) have also suggested respiratory irritation as a sensitive effect, but this effect in humans appears to occur at higher exposure concentrations than those resulting in neurologic effects.
All of the available occupational studies were considered for the principal study upon which to base the derivation of the RfC. A discussion of available animal studies is presented at the end of this section. Numerous human studies have identified NOAELs in the range of 25-50 ppm toluene for individual neurological effects (Cavalleri et al., 2000; Eller et al., 1999; Nakatsuka et al., 1992; Neubert et al., 2001; Schaper et al., 2003; Zavalic et al., 1998a; Zupanic et al., 2002). These studies were designed to measure effects on subjective symptoms (e.g., headache, dizziness), color vision, neurological and psychomotor functioning, and hearing. Several studies have shown statistically significant effects in workers in the range of 83-132 ppm on at least one of the following neurological effects: color vision, auditory evoked brain potentials, neurobehavioral parameters, and neurological functioning (Abbate et al., 1993; Boey et al., 1997; Eller et al., 1999; Foo et al., 1990; Neubert et al. 2001; Vrca et al., 1995, 1996, 1997; Zavalic et al., 1998a).
As a whole, the available studies present a substantial body of evidence in humans indicating a relationship between neurological effects and toluene exposure at the lowest occupational exposure levels measured. No single study stands out as the best study on which to characterize neurological effects nor to specify a single critical effect. Thus, in lieu of selecting one study as the principal study, a review of the human database indicated ten studies can be considered adequate. The determination of study adequacy was based on the use of accepted testing procedures for neurological endpoints, chronic exposure duration, inclusion of a measure of exposure, comparison to defined control groups, and no known co-exposure to other solvents in the workplace. Figure 2 and Table 1 summarizes this subset of studies. Response levels of the adequate studies are identified in Table 1 and are calculated as the difference between the reported means from the exposure and reference groups for statistically significant outcomes. This subset of studies presents a cluster of NOAELs for neurological effects which are generally below reported LOAELs for all endpoints. A deficit in neurological function was chosen as the critical effect based on this suite of neurological studies due to the overall preponderance of evidence for this endpoint at low doses.
71
Potential limitations associated with the studies that were considered adequate are included in Table 1. For additional discussion of the limitations and uncertainties associated with studies that were considered adequate, see Sections 4.1.2.2, 4.5.3 and Appendix A. Not included in the subset are studies with known co-exposure to other solvents (Antti-Poika et al., 1985; Yin et al., 1987; Campagna et al., 2001), studies lacking adequate exposure information (Antti-Poika et al., 1985; Murata et al., 1993), studies without a reference group (Muttray et al., 1995; Morata et al., 1997; Schaper et al., 2003; Tanaka et al., 2003), and studies where questionnaires were the only assessment of toxicity or exposure (Lee et al., 1988; Zupanic et al., 2002; Seeber et al., 2004). These studies contribute qualitatively to the overall weight of evidence of the choice of critical effect but are given lesser weight due to the inadequacies described. Orbaek and Nise (1989) was not included in the subset of studies due to the low number of workers tested and uncertainty in the exposure levels. Chouaniere et al. (2002) observed effects on psychomotor performance at doses of 25 and 40 ppm but the doses were estimated based on test results precluding the use of this study for quantitative purposes.
72
4
7 8
10
1
2
3
4
5 6 8
9
9
10
4
78
10
1
2
3
4
56 8
9
9
10
0
10
20
30
40
50
60
70
80
90
100
110
120
130
140
Study number (see Table 1 for details)
Tolu
ene
conc
entr
atio
n (p
pm)
NOAEL LOAEL
Point of Departure (34 ppm)
Paired NOAEL and LOAEL
Figure 2. Summary of NOAELs/LOAELs for neurological endpoints for a subset of occupational studies of chronic inhalation exposure to toluene.
73
Table 1. Selected subset of occupational studies of neurological effects from toluene inhalation.
Study number Number of workers NOAEL LOAEL Effect/test Response level at the Noted potential in Figure 2 and and duration of (ppm) (ppm) LOAEL (statistically limitations
reference exposure (average significant response years + SD) compared to controls)a
1. Abbate et al., Reference (n=40), Noneb 97 Brainstem response 28% increase of the latency 1993 exposed (n=40) auditory-evoked potential shift for wave-I during
passage from 11 to 90 (12-14 years; no SD repetitions. reported)
Increased time to complete the grooved pegboard test 7% and 6% for dominant and non-dominant hands
Control workers were exposed to 12 ppm toluene
(4.9 + 3.5 years; range of 1-13 years)
making test, symbol digit modality test, grooved pegboard test, and finger tapping tests
respectively, increase in time to complete trail-making test parts A&B, 31% & 28%, respectively; 15% decrease in backward digit span test; 12% and 10% decrease in symbol digit modality test for written and oral sections, respectively.
74
Study number Number of workers NOAEL LOAEL Effect/test Response level at the Noted potential in Figure 2 and and duration of (ppm) (ppm) LOAEL (statistically limitations
reference exposure (average significant response years + SD) compared to controls)a
3. Cavalleri et Reference (n=16), None 42 Color vision impairment 29% increase in CCI and Exposure measured al., 2000 exposed (n=33) (Lanthony D-15) 49% increase in total from urinary excretion
(9.75 years; no SD confusion index (TOCI) (reported as mean of both
of toluene: on the basis of previous data, air
reported) eyes). concentrations estimated to be 42 ppm.
4. Eller et al., 1999
Reference (n=19), low exposure (n=30), high exposure (n=49)
low exposure (1-12 years; no SD reported) high exposure (>12 years)
20 >100 Neuropsychological examination (Cognitive Function Scanner); verbal and nonverbal learning and memory, visuomotor function, computerized neurological examination (CATSYS, TREMOR, and SWAY), subjective
13% increase in performance time on Bourdon Wiersma Test but no increase in the number of missed or incorrect detections; 33% of exposed population reported concentration difficulties.
The high exposure classification was based on historical exposures which may have exceeded 100 ppm for up to 27 years.
assessment
75
Study number Number of workers NOAEL LOAEL Effect/test Response level at the Noted potential in Figure 2 and and duration of (ppm) (ppm) LOAEL (statistically limitations
reference exposure (average significant response years + SD) compared to controls)a
5. Foo et al., Reference (n=30), None 88 Neurobehavioral tests: Increased time to complete Control workers were 1990 exposed (n=30)
the trail-making test parts A&B, 51% & 63%, respectively; 25%
exposed to 13 ppm toluene for 2.5 + 3.2 years. The education
digit span, digit symbol, decrease in digit symbol level was lower in the finger tapping, and simple test performance; 16% exposed group. As a reaction time decrease in total digit span result, data from the
test scores (both forward neurobehavioral tests and backward). were adjusted for years
of education using a generalized linear model.
6. Murata et al., 1993
Reference (n=10), exposed (n=10)
(11 years; range of 136 years; no SD reported)
None 83 Electrophysiological analysis of maximial motor and sensory nerve conduction velocity (MCV & SCV)
9% reduction in the MCV in the forearm and 6% reduction in the SCV in the palm.
Exposed workers were matched for age but not alcohol consumption.
7. Nakatsuka et al., 1992
Reference (n=120), exposed (n=174)
44-48 None Color vision impairment (Lanthony’s new color test and Ishihara’s color vision test)
No measured effect on color vision.
In lieu of determining exposure duration, groups were age-matched to control for effects of aging on color vision.
76
Study number Number of workers NOAEL LOAEL Effect/test Response level at the Noted potential in Figure 2 and and duration of (ppm) (ppm) LOAEL (statistically limitations
reference exposure (average significant response years + SD) compared to controls)a
8. Neubert et al., 2001
Ref-ex (n=109), refint (n=48), exp gp I (n=316), exp gp II (n=535 ), exp gp III (n=308), exp gp IV (n=65)
39 (exp gp 1)
81 (ex gp IV)
Psychophysiological and psychomotor testing: verbal memory span, visuomotor performance, immediate visual memory, self-rating of feeling, biosensory vigilance, critical flicker fusion frequency test, personality dispositions
5% reduction in ascending flicker fusion frequency.
Exposure was identified as chronic but the duration was not reported.
9. Vrca et al., 1995
Reference (n=59), exposed (n=49)
(21.4 + 7.4 years)
None 40-60 Visual evoked potentials The amplitudes of visual evoked brain potentials were 24, 43, and 55% higher for N75, P100, and N145, respectively.
Exposure levels were estimated based on urinary levels of metabolites and toluene levels in blood.
77
Study number Number of workers NOAEL LOAEL Effect/test Response level at the Noted potential in Figure 2 and and duration of (ppm) (ppm) LOAEL (statistically limitations
reference exposure (average significant response years + SD) compared to controls)a
10. Zavalic et Reference (n=90), 32 132 Color vision impairment 10-14% increase in CCI The results from this al., 1998a low exposure (n=46), (Lanthony D-15) (both eyes). investigation were
high exposure (n=37) reported in several publications (Zavalic et
low exposure (16.21 + 6.1 years)
al., 1998a,b,c); some reporting discrepancies
high exposure (18.34 + 6.03 years)
exist regarding the number of workers in the exposed and control groups and the statistical analyses.
a Not all studies examined all neurotoxicity endpoints. b No NOAEL identified in this study.
78
A number of animal studies have examined the neurological effects of inhaled toluene. These studies were generally carried out at high doses and reported impaired responses in neurologic examinations. Table 2 summarizes the majority of available subchronic and chronic animal studies. For example, Rebert et al. (1989a,b) reported abnormal flash-evoked potentials in rats exposed to a single inhalation exposure of 500-16,000 ppm toluene. Evoked potentials reflect the function of the nervous system. Increases in latencies in evoked potentials can reflect deficits in nerve conduction and are indicators of a potential neurotoxic effect. Wood et al. (1983) exposed rats to toluene levels up to 3000 ppm for 4 hours prior to behavioral evaluation and reported that toluene reduced performance in behavioral tests, particularly at the 1780 and 3000 ppm exposure levels. Von Euler et al. (2000) exposed 30 rats to 80 ppm toluene for 4 weeks and found a selective decrease of approximately 6% in the area of the parietal cortex by magnetic resonance imaging. Autoradiographic analysis revealed a 7-10% decrease of the cerebrocortical area. Inhalation exposure to toluene has also been shown to result in irreversible high-frequency hearing loss in rats. Pryor et al. (1984) evaluated hearing loss by a behavioral technique (avoidance response elicited to an auditory signal) and brainstem auditory-evoked responses (elicited by tone pips of differing loudness and frequency and detected by subdural scalp electrodes). Hearing loss, as measured by both techniques, was observed after as few as 2 weeks of exposure to 1000 ppm toluene for 14 hours/day. Hearing loss was irreversible, as evidenced by a failure to return to normal response after 3 months of recovery.
In addition to neurologic effects in humans, the previous RfC on the IRIS database was based on irritation of the upper respiratory tract, specifically the nasal epithelium, as reported in the chronic NTP (1990) study in rats. However, these effects occurred in rats exposed to high concentrations (600 ppm or greater) of toluene and did not show an appreciable increase with increasing concentration (i.e., the incidence of the lesions was greater at 600 ppm than at 1200 ppm). Support that the nasal lesions are a high-exposure phenomenon also comes from the results of a chronic inhalation study in rats performed by CIIT (1980), which reported no effects on the nasal epithelium of animals exposed to 300 ppm toluene. A 28-day inhalation study in rats (30 and 300 ppm) likewise failed to demonstrate treatment-related lesions in the nasal epithelium (Poon et al., 1994). Acute studies in humans have demonstrated that subjective reports of irritation of the nose and/or eyes occurs at exposure levels of 100 ppm or greater (Baelum et al., 1985, 1990; Echeverria et al., 1989; Andersen et al., 1983) but not at exposures below 100 ppm (Echeverria et al., 1989; Andersen et al., 1983). Because neurologic effects are a
79
Table 2. Summary of subchronic and chronic toluene inhalation studies in animals.
Reference Animals Exposure duration NOAEL (ppm)
LOAEL (ppm) Effect
NTP, 1990 Fischer rats 0, 600, or 1200 ppm None a 600 Degeneration of the olfactory or respiratory (60/sex/group) 103 weeks epithelium
Pryor et al., 1984 Fischer rats various exposure regimens
None 1000 Hearing loss
McWilliams et al., 2000 guinea pigs 0, 250, 500, or 1000 250 500 Diminished startle response and histologic (8/group) ppm for 1 week or 500 alterations of the cochlea
ppm for 4 weeks
Da Silva et al., 1990 Pregnant Wistar rats and hamsters
0 and 212 ppm gdb 14-20 (rats) 6-11 (hamsters)
212 (hamsters
) None (rats)
None (hamsters)
212 (rats)
Decreased pup weight, no neurobehavioral effects
80
Reference Animals Exposure duration NOAEL (ppm)
LOAEL (ppm) Effect
Thiel and Chahoud, 1997 Pregnant Wistar rats 0, 300, 600, 1000, or 1200 ppm gd 9-21
600 1000 Decreased pup weight, increased mortality in dams, changes in postnatal development (testes descent and vaginal opening), no neurobehavioral effects
Dalgaard et al., 2001 Pregnant Wistar rats 0, 1200, or 1800 ppm gd 7-20
1800 None No effect on semen quality or testes histology
Hougaard et al., 1999 Pregnant Wistar rats 0 or 1800 ppm gd 7-20
None 1800 Decrease in cognitive function, decrease in hearing function, no neurobehavioral effects
Hass et al., 1999 Pregnant Wistar rats 0 or 1200 ppm gd 7-18
None 1200 Neurological deficit in Morris maze performance
Ungvary and Tatrai, 1985 Pregnant New Zealand rabbits and CFLP mice
0, 133, or 265 ppm (rabbits) gd 7-20
0, 133, 265, or 400 ppm (mice)
gd 6-15
None (rabbits)
133 (mice)
133 (rabbits)
265 (mice)
Maternal deaths, litter resorptions, and spontaneous abortion in rabbits; decreased pup weight and skeletal resorptions in mice
Courtney et al., 1986 Pregnant CD-1 mice 0, 200, or 400 ppm gd 7-16
200 400 Alteration in rib profile in fetuses
Ono et al., 1995 Pregnant SD rats 0, 600, or 2000 ppm gd 7-17
600 2000 Maternal toxicity, decreased pup weight, increased fetal mortality, no effects on behavioral parameters
81
Reference Animals Exposure duration NOAEL (ppm)
LOAEL (ppm) Effect
Ono et al., 1996 SD rats (M and F)
0, 600, or 2000 ppm Females exposed 14
days prior to mating to gd 7; Males exposed
for 90 days, beginning at 60 days before
mating
2000 (F) 600 (M)
None (F)
2000 (M)
No change in fertility in females, decreased sperm count in males
API, 1984; Roberts et al., 2003
CD rats 0, 100, 500 or 2000 ppm 2-generation
reproductive toxicity study; 80 days
exposure and a 15 day mating period for M and F; mated F then exposed during gd
1-20 and days 5-20 of lactation; F1 pups
exposed for 80 days prior to mating
followed by exposure for 15 days to produce
F2 generation
600 2000 Decreased pup weight
a No NOAEL or LOAEL identified by the study b gd = gestational days
82
more sensitive endpoint for exposed humans, neurological deficits were selected as the critical endpoint in this assessment.
5.2.2. Methods of Analysis
In determining a point of departure, a subset of the highest quality human studies was utilized. The human studies used in the quantitative analysis are described in Table 1 and are represented graphically in Figure 2. The studies were weighted equally since none was clearly a stronger study. The highest NOAEL was identified as 44 ppm (Nakatsuka et al., 1992). The lowest LOAELs were identified as 40-42 ppm (Vrca et al., 1995, 1997; Cavalleri et al., 2000). An arithmetic mean of the NOAEL values in Table 1 was chosen to represent an average point of departure. Thus, the average exposure level of 34 ppm is used as the point of departure for the derivation of the RfC. This value is lower than the LOAELs identified above. The range of NOAELs for the suite of neurological effects is 20 to 48 ppm. The average NOAEL is used as a surrogate given concerns about the use of a particular individual NOAEL based on the discussion in Section 5.2.1. There is some uncertainty in using an average value from a suite of studies with varied endpoints and varied levels of response for the point of departure. However, the uncertainty is expected to be less than that associated with choosing any particular one of the available studies for deriving the point of departure since there were potential limitations associated with many of the available studies and no single study stands out as being of the highest quality. Furthermore, this subset of studies presents a cluster of NOAELs for neurological effects which are generally below reported LOAELs for all endpoints.
PBPK models are available that describe the kinetics of toluene after inhalation exposure (Fisher et al., 1997; Pierce et al., 1996, 1999; DeJongh and Blaauboer, 1996, 1997; Tardif et al., 1993). These models could theoretically be utilized for conducting a dose-based duration adjustment if more information were available. It has been shown that neurotoxic effects of acute exposure to toluene and other volatile organic compounds may be predicted by the momentary target tissue concentration of those compounds (Boyes et al. 2003; see also memorandum dated October 29, 2003, from Dr. William Boyes, U.S. EPA, to Dr. Lynn Flowers, U.S. EPA, “Potential use of PBPK modeling to support route-to-route extrapolation or duration adjustments for chronic exposure to toluene”). However, studies have been limited to the evaluation of functional changes of neurotoxicants other than toluene following acute exposure, which are reversible after termination of exposure, and subsequent clearance of the compound from tissues. A critical part of the acute research is the finding that the peak tissue concentration of trichloroethylene (a volatile organic compound with similar acute neurotoxicity to toluene) predicted momentary changes in neurological function, and that the total amount of exposure
83
(expressed either as air concentration x duration product or area under the curve of the tissue dose level) did not predict the measured effect (on visual function in this case) (Boyes et al., 2003).
In the case of chronic toluene exposure, it is not clear that the peak tissue concentration is the appropriate measure of internal dose to use in estimating the continuous exposure concentration that is associated with the observed neurotoxicity. The default duration and dosimetric adjustment method shown below for occupational studies (U.S. EPA, 1994) is based on the logical premise that the total amount of exposure, rather than the momentary tissue concentration, is the appropriate predictor of chronic toxic effects. At this time data are not available to determine the proper dose metric for the chronic effects of toluene exposure, thus the standard default methodology for duration adjustment was used.
5.2.3. RfC Derivation - Including Application of Uncertainty Factors
The NOAEL (average) of 34 ppm (128 mg/m3) was adjusted from an occupational exposure scenario to continuous exposure conditions as follows:
NOAEL (adj) = NOAEL (average) x VEho/VEh x 5 days/7 days = 128 mg/m3 x 10m3/20m3 x 5 days/7 days = 46 mg/m3
Where:VEho = human occupational default minute volume (10 m3 breathed during the 8 hour workday)VEh = human ambient default minute volume (20 m3 breathed during the entire day)
A total uncertainty factor of 10 was applied to the average NOAEL (i.e., 10 for consideration of intraspecies variation). A 10-fold uncertainty factor for intraspecies differences (UFH) was used to account for potentially susceptible human subpopulations. This 10-fold uncertainty factor includes consideration of the Pelekis et al. (2001) model employing pharmacokinetic information to derive a chemical-specific intraspecies UF for toluene that accounts for childhood exposure only. Their analysis suggests an informed quantitation of adult-to-child variability reported to be in the 3-fold range. The Pelekis model is based on the pharmacokinetic differences between adults and children. However, the differences in human
84
susceptibility may also be due to lifestage (e.g., advanced age) differences among the adult population, genetic polymorphisms, decreased renal clearance in disease states, and unknown pharmacodynamic variations in response to toluene exposure. Since the variability defined in the Pelekis model may not account for these additional differences in pharmacokinetics and pharmacodynamics, a full factor of 10 is used.
An uncertainty factor to account for laboratory animal-to-human interspecies differences (UFA) was not necessary because the point of departure is based on human exposure data.
An uncertainty factor to account for extrapolating from less than chronic results (UFS) was not necessary. Most of the studies used in the analysis were of chronic duration.
An uncertainty factor was not needed to account for extrapolating from a LOAEL to a NOAEL because a surrogate NOAEL, i.e., an average NOAEL from a subset of studies, was used to derive the point of departure.
The database for inhalation exposure to toluene is considered adequate. Numerous human and animal chronic and subchronic studies are available. Animal studies have demonstrated reproductive and developmental effects of toluene at exposure levels higher than those used for the determination of the point of departure. In addition, neurotoxicity studies and a two-generation reproductive toxicity study are available. There is some uncertainty regarding potential immunological effects of toluene via the inhalation route of exposure. These uncertainties arise from the conflicting immunotoxicity data on toluene following oral exposure in animal studies (see Sections 4.2.1.1 and 5.1.1 for study descriptions). Two studies on immunologic effects following inhalation exposure are available. Stengel et al. (1998) assessed several immunological parameters in blood following chronic occupational exposure to 50 ppm toluene but no statistically significant effects were observed. Aranyi et al. (1985) examined the effects of inhalation exposure to toluene on pulmonary host defenses in animals and found transient effects at low doses with a lack of a dose-response relationship. These results indicate additional research may be needed to further evaluate the potential immunological effects of toluene by the inhalation route of exposure but do not warrant an uncertainty factor at this time. A database uncertainty factor is not considered necessary.
85
The RfC for toluene (with rounding to one significant figure) is derived as follows:
The previous IRIS assessment utilized the Foo et al. (1990) occupational study as the principal study and neurological effects as the critical effect for the derivation of the RfC (0.4 mg/m3). The LOAEL was identified as 332 mg/m3 (88 ppm), which was converted to a human equivalent concentration of 119 mg/m3. A composite UF of 300 was used that consisted of a 10-fold UF for intraspecies variability, a 10-fold UF for the use of a LOAEL instead of a NOAEL, and a three-fold UF for database deficiencies, including a lack of animal exposure data evaluating neurotoxicity and respiratory irritation. The current IRIS assessment takes into account a number of newer human studies that are available and incorporates newer methodologies.
5.3. CANCER ASSESSMENT
Under the Guidelines for Carcinogen Risk Assessment (U.S. EPA, 2005), there is inadequate information to assess the carcinogenic potential of toluene because studies of humans chronically exposed to toluene are inconclusive, toluene was not carcinogenic in adequate inhalation cancer bioassays of rats and mice exposed for life (CIIT, 1980; NTP, 1990; Huff, 2003), and increased incidences of mammary cancer and leukemia were reported in a lifetime rat oral bioassay at a dose level of 500 mg/kg-day but not at 800 mg/kg-day (Maltoni et al., 1997). Toluene has generally not been genotoxic in short-term testing protocols. A quantitative assessment of carcinogenic potential was not performed.
86
6. MAJOR CONCLUSIONS IN THE CHARACTERIZATION OF HAZARD AND DOSE RESPONSE
6.1. HUMAN HAZARD POTENTIAL
Toluene (CAS no. 108-88-3) has the chemical formula C7H8 (structural formula C6H5CH3) and a molecular weight of 92.14. At room temperature, toluene is a clear-to-amber colorless liquid with a pungent, benzene-like odor. Toluene has a low vapor pressure that can result in volatilization into the air. It is flammable, with a flash point of 4.4 oC. Toluene is strongly reactive with a number of chemicals, particularly nitrogen-containing compounds, and may react with some plastics. Toluene is used as part of an additive to gasoline mixtures (BTEX) to increase octane ratings, in benzene production, and as a solvent in paints, coatings, inks, adhesives, and cleaners. Additionally, toluene is used in the production of nylon, plastics, and polyurethanes. Toluene was once used as an anthelmintic agent against roundworms and hookworms.
Data on the effects of toluene in humans following oral exposure are limited to case reports of accidental oral ingestions. One subchronic study examining oral exposure to toluene in rodents (rats and mice) is available. NTP (1990) exposed F-344 rats and B6C3F1 mice to toluene by gavage for 13 weeks. In male rats, absolute and relative weights of both the liver and kidney were significantly increased (p<0.05) at doses greater than or equal to 446 mg/kg-day. Histopathologic lesions in the liver consisted of hepatocellular hypertrophy, occurring at doses greater than 2500 mg/kg. Nephrosis was observed in rats that died, and damage to the tubular epithelia of the kidney occurred in terminally sacrificed rats. Kidney sections were examined in particular for the occurrence of hyaline droplets in the proximal tubules with negative findings.
Toluene has been evaluated for immunosuppressive effects primarily in comparison studies with the known immunotoxicants benzene and nitrotoluenes (Hsieh et al., 1989, 1990b, 1991; Burns et al., 1994). For example, statistically significant and dose-related decreases in antibody response were noted by Hsieh et al. (1989, 1990b, 1991). There is evidence that the antibody-forming cell assay (PFC) is among the most predictive tests available for immunotoxicity (Luster et al., 1992) and that suppression of the antibody response may be predictive of decreased resistance to challenge with infectious agents or tumor cells (Luster et
87
al., 1993). However, the host resistance assays by Burns et al. (1994) indicate a lack of immunotoxic response when animals treated with toluene were challenged. Host resistance to challenges with Listeria monocytogenes, Streptococcus pneumoniae, Plasmodium yoelii, or B16F10 melanoma was not affected at a dose of 600 mg/kg-day for 14 days. In addition, a reduced incidence of tumors was observed in mice that were challenged with PYB6 fibrosarcoma.
Additional studies by Hsieh et al. (1990a, c) found statistically significant increases in brain neurotransmitter levels at exposure levels as low as 5 mg/kg-day, but these changes have not been correlated with behavioral, neuropsychological, or neuroanatomical changes. Several reproductive studies (Gospe et al., 1994, 1996; Gospe and Zhou, 1998, 2000) have indicated minimal effects on dams and offspring at the doses tested.
A number of occupational studies have examined the effects of toluene exposure via inhalation. The most sensitive effects observed in humans following inhalation exposure are neurologic effects, including altered color vision, dizziness, fatigue, headache, and decreased performance in neurobehavioral tests. Exposure to higher levels in humans and animals have resulted in respiratory tract irritation. Animal studies have also demonstrated effects on other organ systems at high exposure levels (generally 600 ppm or greater).
In mothers who inhaled very high levels of toluene as an addictive euphoric during pregnancy, the children showed a number of physical (small mid face, deep-set eyes, micrognathia, and blunting of the fingertips) and clinical (microcephaly, CNS dysfunction, attention deficits, and developmental delay/mental deficiency) changes attributed to toluene. Animal studies of toluene inhalation have revealed delayed neurodevelopment and decreased offspring weight at levels that also resulted in maternal toxicity. Gross malformations were not noted at any exposure level.
Under the Guidelines for Carcinogen Risk Assessment (U.S. EPA, 2005), there is inadequate information to assess the carcinogenic potential of toluene. Studies of humans who were chronically exposed to toluene are inconclusive. Toluene was not carcinogenic in inhalation cancer bioassays of rats and mice exposed for life (CIIT, 1980; NTP, 1990; Huff, 2003). Increased incidences of mammary cancer and leukemia were reported in a lifetime rat oral
88
bioassay at a dose level of 500 mg/kg-day but not at 800 mg/kg-day (Maltoni et al., 1997). Toluene has generally not been found to be genotoxic in short-term testing.
6.2. DOSE RESPONSE
6.2.1. Noncancer/Oral
There are no chronic or subchronic oral dose-response data for toluene in humans. A single lifetime gavage study in rats (Maltoni et al., 1997) did not adequately examine noncancer endpoints and was not suitable for use in derivation of an RfD. One subchronic study examining oral exposure to toluene in rodents (rats and mice) is available. This study (NTP, 1990) was chosen as the principal study for the derivation of the RfD. The critical effect is increased kidney weight. NTP (1990) exposed F-344 rats and B6C3F1 mice to toluene by gavage for 13 weeks. In male rats, absolute kidney weights were statistically significantly increased (100, 107, 112, 119, and 113% of controls; relative kidney weights were 100, 100, 106, 114, and 146% of controls for 0, 223, 446, 900, or 1800 mg/kg-day dose levels, respectively). Nephrosis was observed in rats that died, and damage to the tubular epithelia of the kidney occurred in terminally sacrificed rats. Kidney sections were examined in particular for the occurrence of hyaline droplets in the proximal tubules with negative findings. A BMDL of 238 mg/kg-day was derived based on increased kidney weight utilizing a BMR of one control SD from the control mean. This SD corresponds to 9% increase in kidney weight from control. A composite uncertainty factor of 3000 (10 for animal to human extrapolation, 10 for intrahuman variability, 10 for use of a subchronic study, and 3 for database uncertainty) was applied to give a chronic RfD of 0.08 mg/kg-day. Confidence in the principal study is medium. It is an adequate gavage study of subchronic duration. Confidence in the database is rated medium due to the lack of chronic data, neurotoxicity studies, and a two-generation reproductive toxicity study and uncertainty surrounding the immunotoxicity of toluene. An oral subchronic study in two species and several immunotoxicity studies are available. A number of oral and inhalation studies have demonstrated that toluene does not elicit developmental or reproductive effects except at doses that are significantly higher than those causing other systemic effects. The available toxicokinetic data indicate the absorption of toluene is similar and extensive following both oral and inhalation exposure. There is medium confidence in the resulting RfD.
89
6.2.2. Noncancer/Inhalation
A number of studies examining the toxicity of toluene following inhalation exposure in humans exist. The available data indicate that neurological effects are the most sensitive effect of chronic inhalation exposure to toluene. A subset of studies was chosen from which to derive a point of departure for the derivation of the RfC. A value of 34 ppm (128 mg/m3) was chosen as the point of departure. This value is the arithmetic mean of the available NOAELs as identified in Section 5.2.1. This value is lower than the LOAELs identified under human exposure conditions. An RfC of 5 mg/m3 was derived by adjusting the average NOAEL for continuous exposure and application of a 10-fold UF for intrahuman variability. Confidence in the database is high; multiple chronic studies in humans are available that examine neurotoxic effects and numerous animal reproductive and developmental studies, as well as a two-generation reproductive toxicity study, exist. There is high confidence in the resulting RfC.
6.2.3. Cancer/Oral and Inhalation
Under the Guidelines for Carcinogen Risk Assessment (U.S. EPA, 2005), there is inadequate information to assess the carcinogenic potential for toluene. A quantitative assessment of carcinogenic potential was not performed.
90
7. REFERENCES
Abbate, C; Giorgianni, C; Munao, F; et al. (1993) Neurotoxicity induced by exposure to toluene: an electrophysiologic study. Int Arch Occup Environ Health 64:389-392.
ACGIH (American Conference of Governmental Industrial Hygienists). (2000) Threshold limit values for chemical substances and physical agents and biological exposure indices 2000. Cincinnati, OH: American Conference of Governmental Industrial Hygienists.
Aitio, A; Pekari, K; Jarvisalo, J. (1984) Skin absorption as a source of error in biological monitoring. Scand J Work Environ Health 10:317-320.
Al-Ghamdi, SS; Raftery, MJ; Yaqoob, MM. (2003) Acute solvent exposure induced activation of cytochrome P4502E1 causes proximate tubule necrosis by oxidative stress. Toxicology In Vitro 17:335-341.
Ameno, K; Fuke, C; Ameno, S; et al. (1989) A fatal case of oral ingestion of toluene. Forensic Sci Int 41:255-260.
Ameno, K; Kiriu, T; Fuke, C; et al. (1992) Regional brain distribution of toluene in rats and in a human autopsy. Arch Toxicol 66:153-156.
Andersen, I; Lundqvist, GR; Molhave, L; et al. (1983) Human response to controlled levels of toluene in six-hour exposures. Scand J Work Environ Health 9:405-418.
Angerer, J. (1979) Occupational chronic exposure to organic solvents. VII. Metabolism of toluene in man. Int Arch Occup Environ Health 43:63-67.
Angerer, J; Schildbach, M; Kramer, A. (1998) S-p-toluylmercapturic acid in the urine of workers exposed to toluene: a new biomarker for toluene exposure. Arch Toxicol 72:119-123.
Antti-Poika, M; Juntunen, J; Matikainen, E; et al. (1985) Occupational exposure to toluene:neurotoxic effects with special emphasis on drinking habits. Int Arch Occup Environ Health 56:31-40.
Anttila, A; Pukkala, E; Riala, R; et al. (1998) Cancer incidence among Finnish workers exposed to aromatic hydrocarbons. Int Arch Occup Environ Health 71:187-193.
API (American Petroleum Institute). (1981) 26-Week inhalation toxicity study of toluene in the rat. Conducted by Biodynamics Inc. and Institute of Neurotoxicity, Albert Einstein College of Medicine for API, Washington, DC. Submitted under TSCA Section FYI. EPA Document No. FYI-AX-1081-0136. NTIS No. OTS0000136-0.
API. (1984) Two-generation inhalation reproduction/fertility study on a petroleum-derived hydrocarbon. Submitted under TSCA Section FYI. EPA Document No. FYI-AX-0284-0294. NTIS No. OTS0000294-0.
Aranyi, C; O'Shea, WJ; Sherwood, RL; et al. (1985) Effects of toluene inhalation on pulmonary host defenses of mice. Toxicol Lett 25:103-10.
Askergren, A. (1982) Organic solvents and kidney function. Adv Mod Environ Toxicol 2:157-172.
ATSDR (Agency for Toxic Substances and Disease Registry). (2000) Toxicological profile for toluene. Available from ATSDR, Atlanta, GA, and <http://www.atsdr.cdc.gov/toxprofiles/>.
Baelum, J; Andersen, I; Lundqvist, GR; et al. (1985) Response of solvent-exposed printers and unexposed controls to six-hour toluene exposure. Scand J Work Environ Health 11:271-280.
Baelum, J; Dossing, M; Hansen, SH; et al. (1987) Toluene metabolism during exposure to varying concentrations combined with exercise. Int Arch Occup Environ Health 59:281-294.
Baelum, J; Lundqvist, G; Molhave, L; et al. (1990) Human response to varying concentrations of toluene. Int Arch Occup Environ Health 62:65-71.
Baelum, J; Molhave, L; Honore Hansen, S; et al. (1993) Hepatic metabolism of toluene after gastrointestinal uptake in humans. Scand J Work Environ Health 19:55-62.
Balster, RL. (1998) Neural basis of inhalant abuse. Drug Alcohol Dep 512:207-214.
Bauchinger, M; Schmid, E; Dresp, J; et al. (1982) Chromosome change in lymphocytes after occupational exposure to toluene. Mutat Res 102:439-445.
Benignus, VA; Muller, KE; Graham, JA; et al. (1984) Toluene levels in blood and brain of rats as a function of toluene level in inspired air. Environ Res 33:39-46.
Benignus VA; Boyes, WK; Bushnell, PJ. (1998) A dosimetric analysis of behavioral effects of acute toluene exposure in rats and humans. Toxicol Sci 43:186-195.
Benoit, FM; Davidson, WR; Lovett, AM; et al. (1985) Breath analysis by API/MS human exposure to volatile organic solvents. Int Arch Occup Environ Health 55:113-120.
Bergman, K. (1979) Whole-body autoradiography and allied tracer techniques in distribution and elimination studies of some organic solvents: benzene, toluene, xylene, styrene, methylene chloride, chloroform, carbon tetrachloride and trichloroethylene. Scand J Work Environ Health 5(Suppl 1):1-263.
Boey, KW; Foo, SC; Jeyaratnam, J. (1997) Effects of occupational exposure to toluene: a neuropsychological study on workers in Singapore. Ann Acad Med Singapore 26:84-87.
Boman, A; Hagelthorn, G; Magnusson, K. (1995) Percutaneous absorption of organic solvents during intermittent exposure in guinea pigs. Acta Derm Venereol 75:114-119.
Bonzel, KE; Muller-Wiefel, DE; Ruder, H; et al. (1987) Anti-glomerular basement membrane antibody-mediated glomerulonephritis due to glue sniffing. Eur J Pediatr 146:296-300.
Bos, RP; Brouns, RME; van Doorn, R; et al. (1981) Non-mutagenicity of toluene, o-, m-, and p-xylene, o-methylbenzylalcohol and o-methylbenzylsulfate in the Ames assay. Mutat Res 88:273-279.
Bosch, X; Campistol, JM; Montolie, J; et al. (1988) Myelofibrosis and focal segmental glomerularsclerosis associated with toluene poisoning. Human Toxicol 7:357-361.
Bowman, MJ; Collins, MJ; Henry, CJ. (1984) The effect of age on performance on the panel D-15 and desaturated D-15: a quantitative evaluation. In: Verriest G, editor. Colour vision deficiencies, VII. The Hague: Dr. W. Junk Publishers, pp. 227–231.
Boyes, WK; Bercegeay, M; Ali, JS; et al. (2003) Dose-based duration adjustments for the effects of inhaled trichloroethylene on rat visual function. Toxicol Sci 76:121-130.
Brugnone, F; Gobbi, M; Ayyad, K; et al. (1995) Blood toluene as a biological index of environmental toluene exposure in the “normal” population and in occupationally exposed workers immediately after exposure and 16 hours later. Int J Occup Environ Health 66:421-425.
92
Burmistrov, SO; Arutyunyan, AV; Stepanov, MG; et al. (2001)Effect of chronic inhalation of toluene and dioxane on activity of free radical processes in rat ovaries and brain. Bull Exp Biol Med 132:832-836.
Burns, LA; Bradley, SG; White, KL, Jr; et al. (1994) Immunotoxicity of mono-nitrotoluenes in female B6C3F1 mice. I. Para-nitrotoluene. Drug Chem Toxicol 17:317-358.
Byrne, A; Kirby, B; Zibin, T; et al. (1991) Psychiatric and neurological effects of chronic solvent abuse. Can J Psychiatry 36:735-738.
Campagna, D; Stengel, B; Mergler, D; et al. (2001) Color vision and occupational toluene exposure. Neurotoxicol Teratol 23:473-480.
Campo, P; Lataye, R; Cossec, B; et al. (1998) Combined effects of simultaneous exposure to toluene and ethanol on auditory function in rats. Neurotoxicol Teratol 20:321-332.
Caravati, EM; Bjerk, PJ. (1997) Acute toluene ingestion toxicity. Ann Emerg Med 30:838-839.
Carlier, B; Schroeder, E; Mahieu, P. (1980) A rapidly and spontaneously reversible Goodpasture’s syndrome after carbon tetrachloride inhalation. Acta Clin Belg 35:193-198.
Carlsson, A. (1982) Exposure to toluene: uptake, distribution and elimination in man. Scand J Work Environ Health 8:43-55.
Cavalleri, A; Gobba, F; Nicali, E; et al. (2000) Dose-related color vision impairment in toluene-exposed workers. Arch Env Health 55:399-404.
Chouaniere, D; Wild, P; Fontana, JM; et al. (2002) Neurobehavioral disturbances arising from occupational toluene exposure. Am J Ind Med 41:77-88.
CIIT (Chemical Industry Institute of Toxicology). (1980) A twenty-four month inhalation toxicology study in Fischer-344 rats exposed to atmospheric toluene. Conducted by Industrial Bio-Test Laboratories, Inc., Decatur, IL, and Experimental Pathology Laboratories, Inc., Raleigh, NC, for CIIT, Research Triangle Park, NC.
Connor, TH; Theiss, JC; Hanna, HA; et al. (1985) Genotoxicity of organic chemicals frequently found in the air of mobile homes. Toxicol Lett 25:33-40.
Courtney, KD; Andrews, JE; Springer, J; et al. (1986) A perinatal study of toluene in CD-1 mice. Fund Appl Toxicol 6:145-154.
Crofton, KM; Lassiter, TL; Rebert, CS. (1994) Solvent-induced ototoxicity in rats: an atypical selective mid-frequency hearing deficit. Hear Res 80:25-30.
Cruz, SL; Mirshahi, T; Thomas, B; et al. (1998) Effects of the abused solvent toluene on recombinant N-methyl-Daspartate and non-N-methyl-D-aspartate receptors expressed in Xenopus oocytes. J Pharmacol Exp Ther 286:334340.
Dalgaard, M; Hossaini, A; Hougaard, KS; et al. (2001) Developmental toxicity of toluene in male rats: effects on semen quality, testis morphology, and apoptotic neurodegeneration. Arch Toxicol 75:103-109.
DaSilva, VA; Malheiros, LR; Bueno, FMR. (1990) Effects of toluene exposure during gestation on neurobehavioral development of rats and hamsters. Brazil J Med Biol Res 23:533-537.
Dean, JH. (1997) Issues with introducing new immunotoxicology methods into the safety assessment of pharmaceuticals. Toxicology 119:95-101.
93
DeJongh, J; Blaauboer, BJ. (1996) Simulation of toluene kinetics in the rat by a physiologically based pharmacokinetic model with application of biotransformation parameters derived independently in vitro and in vivo. Fund Appl Toxicol 32:260-268.
DeJongh, J; Blaauboer, BJ. (1997) Evaluation of in vitro-based simulations of toluene uptake and metabolism in rats. Toxicol In Vitro 11:485-489.
Devathasan, G; Low, D; Teoh, PC; et al. (1984) Complications of chronic glue (toluene) abuse in adolescents. Aust.NZ J Med 14:39-43.
Dick, F; Semple, S; Chen, R; et al. (2000) Neurological deficits in solvent-exposed painters: a syndrome including impaired colour vision, cognitive defects, tremor and loss of vibration sensation. Q J Med 93:655-661.
Dobrokhotov, VB; Enikeev, MI. (1977) [The mutagenic action of benzene, toluene and a mixture of these hydrocarbons in a chronic test.] Gig Sanit 42:32-34 (in Russian–evaluation based on an English translation).
Dossing, M; Aelum, JB; Hansen, SH; et al. (1983) Urinary hippuric acid and orthocresol excretion in man during experimental exposure to toluene. Br J Ind Med 40:470-473.
Dutkiewicz, T; Tyras, H. (1968) Skin absorption of toluene, styrene and xylene by man. Br J Ind Med 25:243.
Dyer, RS; Bercegeay, MS; Mayo, LM. (1988) Acute exposures to p-xylene and toluene alter visual information processing. Neurotox Teratol 10:147-153.
Echeverria, D; Fine, L; Langolf, G; et al. (1989) Acute neurobehavioral effects of toluene. Br J Ind Med 46:483-495.
Egle, JL, Jr.; Gochberg, BJ. (1976) Respiratory retention of inhaled toluene and benzene in the dog. J Toxicol Environ Health 1:531-538.
Ehyai, A; Freemon, FR. (1983) Progressive optic neuropathy and sensineural hearing loss due to chronic glue sniffing. J Neurol Neurosurg Psychiatry 46:349-51.
Eller, N; Netterstrom, B; Laursen, P. (1999) Risk of chronic effects on the central nervous system at low toluene exposure. Occup Med 49:389-395.
Engelke, M; Tahti, H; Vaalavirta, L. (1996) Perturbation of artificial and biological membranes by organic compounds of aliphatic, alicyclic, and aromatic structure. Toxicol In Vitro 10:111-115.
Fabietti, F; Ambruzzi, A; Delise, M; et al. (2004) Monitoring of the benzene and toluene contents in human milk. Environ Int 30:397-401.
Filley, CM; Heaton, RK; Rosenberg, NL. (1990) White matter dementia in chronic toluene abuse. Neurology 40:532-534.
Fisher, J; Mahle, D; Bankston, L; et al. (1997) Lactational transfer of volatile chemicals in breast milk. American Ind Hyg Assoc J 58:425-431.
Fischman, CM; Oster, JR. (1979) Toxic effects of toluene: a new cause of high anion gap metabolic acidosis. JAMA 241:1713-1715.
Fluck, ER; Poirier, LA; Ruelius, HW. (1976) Evaluation of a DNA polymerase-deficient mutant of E. coli for rapid detection of carcinogens. Chem Biol Interact 15:219-231.
94
Foo, SC; Phoon, WO; Khoo, NY. (1988) Toluene in blood after exposure to toluene. Am Ind Hyg Assoc J 49:255258.
Foo, SC; Jeyaratnam, J; D. Koh, D. (1990) Chronic neurobehavioral effects of toluene. Br J Ind Med 47:480-484.
Forni, A; Pacifico, E; Limonta, A. (1971) Chromosome studies in workers exposed to benzene or toluene or both.Arch Environ Health 22:373-378.
Franchini, I; Cavatorta, A; Falzoi, M; et al. (1983) Early indicators of renal damage in workers exposed to organic solvents. Int Arch Occup Environ Health 52:1-9.
Franks, NP; Lieb, WR. (1985) Mapping of general anaesthetic target sites provides a molecular basis for cutoff effects. Nature 316:349-351.
Franks, NP; Lieb, WR. (1987) Anaesthetics on the mind. Nature 328:113-114.
Funes-Craviota, F; Kolmodin-Hedman, B; Lindsten, J; et al. (1977) Chromosome aberrations and sister-chromatidexchange in workers in chemical laboratories and a rotoprinting factory and in children of women laboratoryworkers. Lancet 2:322-325.
Geller, AM; Hudnell, HK. (1997) Critical issues in the use and analysis of the Lanthony desaturate color vision test.Neurotoxicol Teratol 19:455-465.
Gericke, C; Hanke, B; Beckmann, G; et al. (2001) Multicenter field trial on possible health effects of toluene. III.Evaluation of effects after long-term exposure. Toxicology 168:185-209.
Gerner-Smidt, P; Friedrich, U. (1978) The mutagenic effect of benzene, toluene and xylene studied by the SCEtechnique. Mutat Res 58:313-316.
Ghantous, H; Danielsson, BRG. (1986) Placental transfer and distribution of toluene, xylene and benzene and theirmetabolites during gestation in mice. Biol Res Pregnancy Perinatol 7:98-105.
Ghittori, S; Imbriani, M; Pezzagno, G; et al. (1987) The urinary concentration of solvents as a biological indicator ofexposure: proposal for the biological equivalent exposure limit for nine solvents. Am Ind Hyg Assoc J 48:786-90.
Gibson, JE; Hardisty, JF. (1983) Chronic toxicity and oncogenicity bioassay of inhaled toluene in Fischer-344 rats.Fund Appl Toxicol 3:315-319.
Gobba, F; Righi, E; Fantuzzi, G; et al. (1998) Two-year evolution of perchloroethylene-induced color-vision loss.Arch Environ Health 53:196-8.
Gobba, F. (2000) Color vision: a sensitive indicator of exposure to neurotoxins. Neurotoxicology 21:857-862.
Gobba, F; Cavalleri, A. (2003) Color vision impairment in workers exposed to neurotoxic chemicals.Neurotoxicology 24:693-702.
Gogal, RM; Ahmed, SA; Smith, SA; et a;. (1999) Mandates to develop non-mammalian models for chemicalimmunotoxicity evaluation: are fish a viable alternate to rodents? Toxicol Lett 106:89-92.
Goodwin, TM. (1988) Toluene abuse and renal tubular acidosis in pregnancy. Obstet Gynecol 71:715-718.
Gospe, S; Al-Bayati, M. (1994) Comparison of oral and inhalation exposures to toluene. Int J Toxicol 13:21-32.
95
Gospe, SM, Jr; Zhou, SS. (1998) Toluene abuse embryopathy: longitudinal neurodevelopmental effects of prenatal exposure to toluene in rats. Reprod Toxicol 12:119-126.
Gospe, SM, Jr; Zhou, SS. (2000) Prenatal exposure to toluene results in abnormal neurogenesis and migration in rat somatosensory cortex. Pediatr Res 47:362-368.
Gospe, SM, Jr; Saeed, DB; Zhou, SS; et al. (1994) The effects of high-dose toluene on embryonic development in the rat. Pediatr Res 36:811-815.
Gospe, SM, Jr; Zhou, SS; Saeed, DB; et al. (1996) Development of a rat model of toluene-abuse embryopathy. Pediatr Res 40:82-87.
Griff, ER. (1991) Electroretinographic components arising in the distal retina. In: Heckinlively, JR; Arden, GB, editors. Principles and practice of clinical electrophysiology of vision. St. Louis, MO: Mosby-Year Book, Inc., pp. 91-98.
Haglund, U; Lundberg, I; Zech, L. (1980) Chromosome aberrations and sister chromatid exchanges in Swedish paint industry workers. Scand J Environ Health 6:291-298.
Harabuchi, I; Kishi, R; Ikeda, T; et al. (1993) Circadian variations of acute toxicity and blood and brain concentrations of inhaled toluene in rats. Br J Ind Med 50:280-286.
Hart, WM. (1992) Color vision. In: Hart, W.M., editor. Adler’s physiology of the eye: clinical application. St. Louis, MO: Mosby-Year Book, Inc., pp. 708-727.
Hass, U; Lund, SP; Hougaard, KS; et al. (1999) Developmental neurotoxicity after toluene inhalation exposure in rats. Neurotoxicol Teratol 21:349-357.
Hobara, T; Kobayashi, H; Higashihara, E; et al. (1984) Experimental study on the pulmonary absorption and excretion of toluene. Int Arch Occup Environ Health 53:337-344.
Hougaard, KS; Hass, U; Lund, SP; et al. (1999) Effects of prenatal exposure to toluene on postnatal development and behavior in rats. Pharmacol Toxicol 92:148-152.
Hougaard, KS; Hansen, AM; Hass, U; et al. (2003) Toluene depresses plasm corticosterone in pregnant rats. Neurotoxicol Teratol 21:241-250.
Hsieh, GC; Sharma, RP; Parker, RD. (1989) Immunotoxicological evaluation of toluene exposure via drinking water in mice. Environ Res 49:93-103.
Hsieh, GC; Sharma, RP; Parker, RD; et al. (1990a) Evaluation of toluene exposure via drinking water on levels of regional brain biogenic monoamines and their metabolites in CD-1 mice. Ecotoxicol Environ Saf 20:175-184.
Hsieh, GC; Parker, RDR; Sharma, RP; et al. (1990b) Subclinical effects of ground water contaminants. III. Effects of repeated oral exposure to combinations of benzene and toluene on immunologic responses in mice. Arch Toxicol 64:320-328.
96
Hsieh, GC; Sharma, RP; Parker, RD. (1990c) Subclinical effects of groundwater contaminants. Effects of repeated oral exposure to combinations of benzene and toluene on regional brain monoamine metabolism in mice. Arch Toxicol 64:669-676.
Hsieh, GC; Sharma, RP; Parker, RD. (1991) Hypothalmic-pituitary-adrenocortical axis activity and immune function after oral exposure to benzene and toluene. Immunopharmacol 21:23-31.
Huang, J; Asaeda, N; Takeuchi, Y; et al. (1992) Dose dependent effects of chronic exposure to toluene on neuronal and glial cell marker proteins in the central nervous system of rats. Br J Ind Med 49:282-286.
Huff, J. (2003) Absence of carcinogenic activity in Fischer rats and B6C3F1 mice following 103-week inhalation exposures to toluene. Int J Occup Environ Health 9:138-146.
Hunnewell, J; Miller, NR. (1998) Bilateral internuclear ophthalmoplegia related to chronic toluene abuse. J Neuroophthalmol 18:277-280.
IARC.(International Agency for Research on Cancer). (1999) IARC monographs on the evaluation of carcinogenic risks of chemicals to humans. Vol. 71, Part 2. Re-evaluation of some organic chemicals, hydrazine and hydrogen peroxide. Lyon, France: International Agency for Research on Cancer, pp. 829-864.
Ikeda, M; Ohtsuji, H. (1971) Phenobarbital-induced protection against toxicity of toluene and benzene in the rat. Toxicol Appl Pharmacol 20:30-43.
Ikeda, N; Takahashi, H; Umetsu, K; et al. (1990) The course of respiration and circulation in toluene-sniffing. Forensic Sci Intern 44:151-158.
Inoue, O; Seiji, K; Watanabe, T; et al. (1986) Possible ethnic difference in toluene metabolism: a comparative study among Chinese, Turkish and Japanese solvent workers. Toxicol Lett 34:167-174.
Iregren, A; Andersson, M; Nylen, P. (2002) Color vision and occupational exposures: 1. An overview of tests and effects. Neurotoxicology 23:719-733.
Jonai, H; Sato, M. (1988) Exposure indices for painters exposed to toluene and xylene at low concentrations. Ind Health 26:197-202.
Kamijima, M; Nakazawa, Y; Yamakawa, M; et al. (1994) Metabolic acidosis and renal tubular injury due to pure toluene inhalation. Arch Environ Health 49:410-413.
Kawai, T; Yasugi, T; Mizunuma, K; et al. (1992a) Comparative evaluation of urinalysis and blood analysis as means of detecting exposure to organic solvents at low concentrations. Int Arch Occup Environ Health 64:223-234.
Kawai, T; Yasugi, T; Mizunuma, K; et al. (1992b) Monitoring of workers exposed to a mixture of toluene, styrene and methanol vapours by means of diffusive air sampling, blood analysis and urinalysis. Int Arch Occup Environ Health 63:429-435.
Kawai, T; Yasugi, T; Mizunuma, K; et al. (1993) Comparative evaluation of blood and urine analysis as a tool for biological monitoring of n-hexane and toluene. Int Arch Occup Environ Health 65:S123-S126.
Kawamoto, T; Murata, K; Koga, M; et al. (1994) Distribution of urinary hippuric acid concentrations by ALDH2 genotype. Occup Environ Med 51:817-821.
King, MD; Day, RE; Oliver, JS; et al. (1981) Solvent encephalopathy. Br Med J 283:663-665.
97
Kiyokawa, M; Mizota, A; Takasoh, M; et al. (1999) Pattern visual evoked cortical potentials in patients with toxic optic neuropathy caused by toluene abuse. Jpn J Ophthalmol 43:438-442.
Kostas, J; Hotchin, J. (1981) Behavioral effects of low-level perinatal exposure to toluene in mice. Neurobehav Toxicol Teratol 3:467-469.
Kostrzewski, P; Piotrowski, JK. (1991) Toluene determination in capillary blood as a biological indicator of exposure to low levels of toluene. Pol J Occup Med Environ Health 4:249-259.
Kroeger, RM; Moore, RJ; Lehman, TH; et al. (1980) Recurrent urinary calculi associated with toluene sniffing. J Urol 123:89-91.
Lataye, R; Campo, P; Pouyatos, B; et al. (2003) Solvent ototoxicity in the rat and guinea pig. Neurotoxicol Teratol 25:39-50.
Lazar, RB; Ho, SU; Melen, O; et al. (1983) Multifocal central nervous system damage caused by toluene abuse. Neurology 33:1337-1340.
Lee, B; Lee, S; Lee, K; et al. (1988) Dose-dependent increase in subjective symptom prevalence among toluene-exposed workers. Ind Health 26:11-23.
Leeder, JS; Kearns, GL. (1997) Pharmacogenetics in pediatrics: implications for practice. Pediatr Clin North Am 44:55-77.
Leung, HW; Paustenbach, DJ. (1988) Application of pharmacokinetics to derive biological exposure indexes from threshold limit values. Am Ind Hyg Assoc J 49:445-450.
Litton Bionetics, Inc. (1981) Mutagenicity evaluation of toluene mouse dominant lethal assay [final report]. Submitted to the American Petroleum Institute, Washington, DC. LBI Project No. 21141-05, p. 58.
Löf, A; Wallen, M; Hjelm, EW. (1990) Influence of paracetamol and acetylsalicylic acid on the toxicokinetics of toluene. Pharmacol Toxicol 66:138-141.
Löf, A; Hjelm, EW; Colmsjo, A; et al. (1993) Toxicokinetics of toluene and urinary excretion of hippuric acid after human exposure to 2H8-toluene. Br J Ind Med 50:55-59.
Lowry, LK. (1987) Review of biological monitoring tests for toluene. In: M.H. Ho, MH; Dillon, HK, editors. Biological monitoring of exposure to chemicals. New York, NY: John Wiley & Sons, Inc. pp 99-109.
Luster, MI; Ackermann, MF; Germolec, DR; et al. (1989). Perturbations of the immune system by xenobiotics. Environ Health Perspect 81:157-162.
Luster, MI; Portier, C; Pait, DG; et al. (1992) Risk assessment in immunotoxicolgy. I. Sensitivity and predictability of immune tests. Fund Appl Toxicol 18:200-210.
Luster, MI; Portier, C; Pait, DG; et al. (1993) Risk assessment in immunotoxicolgy. II. Relationships between immune and host resistance tests. Fund Appl Toxicol 21:71-82.
Lyapkalo, AA. (1973) Genetic activity of benzene and toluene. Gig Tr Prof Zabol 17:24-28. (in Russian–evaluation based on an English translation provided by the U.S. EPA.)
Maas, EF; Ashe, J; Spiegel, P; et al. (1991) Acquired pendular nystagmus in toluene addiction. Neurology 41:282-285.
98
Maestri, L; Ghittori, S; Imbriani, M. (1997) Determination of specific mercapturic acids as an index of exposure to environmental benzene, toluene, and styrene. Ind Health 35:489-501.
Maki-Paakkanen, J; Husgafvel-Pursiainen, K; Kalliomaki, PL; et al. (1980) Toluene-exposed workers and chromosome aberrations. J Toxicol Environ Health 6:775-781.
Malm, G; Lying-Tunell, U. (1980) Cerebellar dysfunction related to toluene sniffing. Acta Neurol Scand 62:188190.
Maltoni, C; Ciliberti, A; Pinto, C; et al. (1997) Results of long-term experimental carcinogenicity studies of the effects of gasoline, correlated fuels, and major gasoline aromatics on rats. Ann NY Acad Sci 837:15-52.
Mattsson, JL; Albee, RR; Gorzinski, SJ. (1989) Similarities of toluene and o-cresol neuroexcitation in rats. Neurotoxicol Teratol 11:71-75.
McWilliams, ML; Chen, GD; Fechter, LD. (2000) Low-level toluene disrupts auditory function in guinea pigs. Toxicol Appl Pharmacol 167:18-29.
Mehta, CS; Sun, PN; Zikarge, A; et al. (1998) Acute toxicity of toluene in male and female rats: a single oral dose exposure 2-week study. Toxic Substances Mechanisms 17:43-55.
Mergler, D; Blain, L; Lagace, JP. (1987) Solvent related colour vision loss: an indicator of neural damage? Int Arch Occup Environ Health 59:313-321.
Mergler, D; Blain, L; Lemaire, J; et al. (1988a) Colour vision impairment and alcohol consumption. Neurotoxicol Teratol 10:255-260.
Mergler, D; Belanger, S; De Grosbois, S; et al. (1988b) Chromal focus of acquired chromatic discrimination loss and solvent exposure among printshop workers. Toxicology 49:341-348.
Mergler, D; Huel, G; Belanger, S; et al. (1996) Surveillance of early neurotoxic dysfunction. Neurotoxicology 17:803-812.
Meulenbelt, J; de Groot, G; Savelkoul, TJ. (1990) Two cases of acute toluene intoxication. Br J Ind Med 47:417-420.
Mihic, SJ; McQuilkin, SJ; Eger, EI; et al. (1994) Potentiation of γ-aminobutyric acid type A receptor-mediated chloride currents by novel halogenated compounds correlated with their abilities to induce general anesthesia. Mol Pharmacol 46:851-857.
Mizunuma, K; Horiguchi, S; Kawai, T; et al. (1994) Toluene in blood as a marker of choice for low level exposure to toluene. Int J Occup Environ Health 66:309-315.
Miyagi, Y; Shima, F; Ishido, K; et al. (1999) Tremor induced by toluene misuse successfully treated by a Vim thalamotomy. J Neurosurg Psych 66:794-796.
Monster, AC; Kezic, S; van de Gevel, I; et al. (1993) Evaluation of biological monitoring parameters for occupational exposure to toluene. Int Arch Occup Environ Health 65(Suppl):159-162.
Morata, TC; Fiorini, AC; Fischer, FM; et al. (1997) Toluene-induced hearing loss among rotogravure printing workers. Scand J Work Environ Health 23:289-298.
99
Morgan, DL; Cooper, SW; Carlock, DL; et al. (1991) Dermal absorption of neat and aqueous volatile organic chemicals in the Fischer 344 rat. Environ Res 55:51-63.
Mortelmans, K.E. and E.S. Riccio. (1980) In vitro microbiological genotoxicity assays of toluene. Prepared by SRI International, Menlo Park, CA, under Contract No. 68-02-2947 for the U.S. EPA, Research Triangle Park, NC, p. 25.
Murata, K; Araki, S; Yokoyama, K; et al. (1993) Cardiac autonomic dysfunction in rotogravure printers exposed to toluene in relation to peripheral nerve conduction. Ind Health 31:79-90.
Murata, M; Tsujikawa, M; Kawanishi, S. (1999) Oxidative DNA damage by minor metabolites of toluene may lead to carcinogenesis and reproductive dysfunction. Biochem Biophys Res Commun 261:478-483.
Muttray, A; Wolters, V; Mayer-Popken, O; et al. (1995) Effect of subacute occupational exposure to toluene on color vision. Int J Occup Med Environ Health 8:339-345.
Muttray, A; Wolters, V; Jung, D; et al. (1999) Effects of high doses of toluene on color vision. Neurotox Teratol 21:41-45.
Nakai, N; Murata, M; Nagahama, M.; et al. (2003) Oxidative DNA damage induced by toluene is involved in its male reproductive toxicity. Free Rad Res 37:69-76.
Nakajima, T; Wang, RS. (1994) Induction of cytochrome P450 by toluene. Int J Biochem 26:1333-1340.
Nakajima, T; Wang, RS; Katakura, Y; et al. (1992) Sex-, age- and pregnancy-induced changes in the metabolism of toluene and trichloroethylene in rat liver in relation to the regulation of cytochrome P45011E1 and P45011C11 content. J Pharmacol Exp Ther 261:869-874.
Nakajima, T; Wang, RS; Elovaara, E; et al. (1997) Toluene metabolism by cDNA-expressed human hepatic cytochrome P-450. Biochem Pharmacol 53:271-277.
Nakamura, S; Oda, Y; Shimada, T; et al. (1987) SOS-inducing activity of chemical carcinogens and mutagens in Salmonella typhimurium TA1535/pSK1002: examination with 151 chemicals. Mutat Res 192:239-246.
Nakatsuka, H; Watanabe, T; Takeuchi, Y; et al. (1992) Absence of blue-yellow color vision loss among workers exposed to toluene or tetrachloroethylene, mostly at levels below exposure limits. Int Arch Occup Environ Health 64:113-117.
Nestmann, ER; Lee, EGH; Matula, TI; et al. (1980) Mutagenicity of constituents identified in pulp and paper mill effluents using the Salmonella/mammalian-microsome assay. Mutat Res 79:203-212.
Neubert, D; Gericke, C; Hanke, B; et al. (2001) Multicenter field trial on possible health effects of toluene. II. Cross-sectional evaluation of acute low-level exposure. Toxicology 168:139-183.
Ng, TP; Ong, SG; Lam, WK; et al. (1990) Urinary levels of proteins and metabolites in workers exposed to toluene. Int Arch Occup Environ Health 62:43-46.
Nielsen, HK; Krusell, L; Baelum, J; et al. (1985) Renal effects of acute exposure to toluene. A controlled clinical trial. Acta Med Scand 218:317-321.
NIOSH (National Institute of Occupational Safety and Health). (1974) New publication 74-137. Available from: National Technical Information Service, Springfield, VA.
100
NIOSH (1983) Determination of the reproductive effects in mice of nine selected chemicals. Prepared by Smith, KN, Bioassay Systems Corporation, Woburn, MA. Available from: National Technical Information Service, Springfield, VA; PB84183540.
Nise, G; Orbaek, P. (1988) Toluene in venous blood during and after work in rotogravure printing. Int Arch Occup Environ Health 60:31-35.
Nise, G; Attewell, R; Skerving, S; et al. (1989) Elimination of toluene from venous blood and adipose tissue after occupational exposure. Br J Ind Med 46:407-411.
Nise, G; Hogstedt, B; Bratt, I; et al. (1991) Cytogenetic effects in rotogravure printers exposed to toluene (and benzene). Mutat Res 261:217-223.
NRC (National Research Council). (1983) Risk assessment in the federal government: managing the process. Washington, DC: National Academy Press. Available from: <http://books.nap.edu/books/POD115/html/index.html>.
NTP (National Toxicology Program). (1990) Toxicology and carcinogenesis studies of toluene (CAS No. 108-88-3) in F344/N rats and B5C3F1 mice (inhalation studies). Public Health Service, U.S. Department of Health and Human Services; NTP TR 371. Available from: National Institute of Environmental Health Sciences, Research Triangle Park, NC.
NTP. (2002) 10th report on carcinogens. Public Health Service, U.S. Department of Health and Human Services, Research Triangle Park, NC. Available from: <http://ehp.niehs.nih.gov/roc/toc10.html>.
NTP. (2001) Chemical Health and Safety Data. Online. Public Health Service, U.S. Department of Health and Human Services, Research Triangle Park, NC; <http://ntp-server.niehs.nih.gov/Main_Pages/Chem-HS.html>.
O'Brien, ET; Yeoman, WB; Hobby, JA. (1971) Hepatorenal damage from toluene in a “glue sniffer.” Br Med J 2(752):29-30.
Ono, A; Sekita, K; Ohno, K; et al. (1995) Reproductive and developmental toxicity studies of toluene: I. Teratogenicity study of inhalation exposure in pregnant rats. J Toxicol Sci 20:109-34.
Ono, A; K. Sekita, K; Ogawa, Y; et al. (1996) Reproductive and developmental toxicity studies of toluene: II. Effects of inhalation exposure on fertility in rats. J Environ Pathol Toxicol Oncol 15:9-20.
Orbaek, P; Nise, G. (1989) Neurasthenic complaints and psychometric function of toluene-exposed rotogravure printers. Am J Ind Med 16:67-77.
OSHA (Occupational Safety and Health Administration). (1993) 29 CFR Part 1910. Air contaminants; rule. Fed Regist 58(124):35338-35351.
Palermo-Neto, J; Santos, FA; Guerra, JL; et al. (2001) Glue-solvent inhalation impairs host resistance to Mycobacterium bovis-induced infection in hamsters. Vet Hum Toxicol 43:1-5.
Patel, R; Benjamin, J. (1986) Renal disease associated with toluene inhalation. Clin Toxicol 24:213-223.
Paterson, SC; Sarvesvaran, R. (1983) Plastic bag death: a toluene fatality. Med Sci Law 23:64-66.
Pelclova, D; Rossner, P; Pickova, J. (1990) Chromosome aberrations in rotogravure printing plant workers. Mutat Res 245:299-303.
Pelekis, M; Gephardt, LA; Lerman, SE. (2001) Physiological-model-based derivation of the adult and child pharmacokinetic intraspecies uncertainty factors for volatile compounds. Regul Toxicol Pharmacol 33:12-20.
Pellizzari, ED; Hartwell, TD; Haris, BSH; et al. (1982) Purgeable organic compounds in mother's milk. Bull Environ Contam Toxicol 28:322-328.
Pellizzari, ED; Wallace, LA; Gordon, SM. (1992) Elimination kinetics of volatile organics in humans using breath measurements. J Expo Anal Environ Epidemiol 2:341-355.
Pierce, CH; Dills, RL; Morgan, MS; et al. (1996) Interindividual differences in 2H8-toluene toxicokinetics assessed by semi-empirical physiologically based model. Toxicol Appl Pharmacol 139:49-61.
Pierce, CH; Lewandowski, TA; Dills, RL; et al. (1999) A comparison of 1H8- and 2H8-toluene toxicokinetics in men. Xenobiotica 29:93-108.
Pitarque, M; Vaglenov, A; Nosko, M; et al. (1999) Evaluation of DNA damage by the comet assay in shoe workers exposed to toluene and other organic solvents. Mutat Res 441:115-127.
Plappert, U; Barthel, E; Seidel, HJ. (1994) Reduction of benzene toxicity by toluene. Environ Mol Mutagen 24:283292.
Plenge-Bönig, A; Karmaus, W. (1999) Exposure to toluene in the printing industry is associated with subfecundity in women but not in men. Occup Environ Med 56:443-448.
Poblano, A; Lope Huerta, M; Martinez, JM; et al. (1996) Pattern-visual evoked potential in thinner users. Arch Med Res 27:531-533.
Poon, R; Chu, IH; Bjarnason, S; et al. (1994) Inhalation toxicity study of methanol, toluene, and methanol/toluene mixtures in rats: effects of 28-day exposure. Toxicol Ind Health 10:231-245.
Pryor, GT; Rebert, CS; Dickinson, J; et al. (1984) Factors affecting toluene-induced ototoxicity in rats. Neurobehav.Toxicol Teratol 6:223-238.
Pyykko, K; Tahti, H; Vapaatalo, H. (1977) Toluene concentrations in various tissues of rats after inhalation and oral administration. Arch Toxicol 38:169-176.
Ramsey, JC; Andersen, ME. (1984) A physiologically based description of the inhalation pharmacokinetics of styrene in rats and humans. Toxicol Appl Pharmacol 73:159-175.
Rea, TM; Nash, JF; Zabik, JE; et al. (1984) Effects of toluene inhalation on brain biogenic amines in the rat. Toxicology 31:143-150.
Rebert, CS; Matteucci, MJ; Pryor, GT. (1989a) Acute electrophysiologic effects of inhaled toluene on adult male Long-Evans rats. Pharmacol Biochem Behav 33:157-165.
Rebert, CS; Matteucci, MJ; Pryor, GT. (1989b) Multimodal effects of acute exposure to toluene evidenced by sensory-evoked potentials from Fischer-344 rats. Pharmacol Biochem Behavior 32:757-768.
Rees, DC; Wood, RW; McCormick, JP; et al. (1985) Toxicokinetics of toluene in the rat. Scand J Work Environ Health 11:301-306.
Reisin, E; Teicher, A; Jaffe, R; et al. (1975) Myoglobinuria and renal failure in toluene poisoning. Br J Ind Med 32:163-164.
102
Richer, CL; Chakrabarti, S; Senecal-Quevillon, M; et al. (1993) Cytogenetic effects of low-level exposure to toluene, xylene, and their mixture on human blood lymphocytes. Int Arch Occup Environ Health 64:581-585.
Roberts, LG; Bevans, AC; Schreiner, CA. (2003) Developmental and reproductive toxicity evaluation of toluene vapor in the rat. I. Reproductive toxicity. Reproductive Toxicol 17:649-658.
Ron, MA. (1986) Volatile substance abuse: a review of possible long term neurological, intellectual and psychiatric sequalae. Br J Psychiatry 148:235-246.
Rosenberg, NL; Kleinschmidt-Demasters, BK; Davis, KA; et al. (1988a) Toluene abuse causes diffuse central nervous system white matter changes. Ann Neurol 23:611-614.
Rosenberg, NL; Spitz, MC; Filley, CM; et al. (1988b) Central nervous system effects of chronic toluene abuse-clinical, brainstem evoked response and magnetic resonance imaging studies. Neurotoxicol Teratol 10:489-495.
Ruddock, KH. (1965) The effect of age upon colour vision. I. Response in the receptoral system of the human eye. Vision Res 5:37-45.
Russell, RM; Carney, EA; Feiock, K; et al. (1980) Acute ethanol administration causes transient impairment of blue-yellow color vision. Alcohol Clin Exp Res 4:396-399.
Ryu, YH; Lee, JD; Yoon, PH; et al. (1998) Cerebral perfusion impairment in a patient with toluene abuse. J Nucl Med 34:632-633.
Sasa, M; Igarashi, S; Miyazaki, T; et al. (1978) Equilibrium disorders with diffuse brain atrophy in long term toluene sniffing. Arch Otorhinolaryngol 221:162-169.
Sato, A; Nakajima, T. (1978) Differences following skin or inhalation exposure in the absorption and excretion kinetics of trichlorethylene and toluene. Br J Ind Med 35:43-49.
Schaper, M; Demes, P; Zupanic, M; et al. (2003) Occupational toluene exposure and auditory function: results from a follow-up study. Ann Occup Hyg 47:493-502.
Schmid, E; Bauchinger, M; Hauf, R. (1985) Chromosome changes with time in lymphocytes after occupational exposure to toluene. Mutat Res 142:37-39.
Seeber, A; Schaper, M; Zupanic, M; et al. (2004) Toluene exposure below 50 ppm and cognitive function: a follow-up study with four repeated measurements in rotogravure printing plants. Int Arch Occup Environ Health 77:1-9.
Skoog, KO; Nilsson, SEG. (1981) Changes in the c-wave of the electroretinogram and the standing potential of the eye after small doses of toluene and styrene. Acta Ophthalmol (Copenh.) 59:71-79.
Smith, DA; Schurig, GG; Smith, SA; et al. (1999) Tilapia (Oreochromis niloticus) and rodents exhibit similar patterns of inhibited antibody production following exposure to immunotoxic chemicals. Vet Hum Toxicol 41:36873.
Snodgrass, W.R. (1992) Physiological and biochemical differences between children and adults as determinants of toxic response to environmental pollutants. In: Guzelian, PS; Henry, CJ; Olin, SS, editors. Similarities and differences between children and adults: implications for risk assessment. Washington, DC: International Life Sciences, pp. 35-42.
Snow, L; P. MacNair and B.C. Casto. (1981) Mutagenesis testing of toluene in Salmonella strains TA100 and TA98. Prepared for the U.S. EPA by Northrup Services, Inc., Research Triangle Park, NC.
103
Steinberg, RH; Linsenmeier, RA; Griff, ER. (1983) Three-light evoked responses of the retinal pigment epithelium. Vision Res 23:1315-1323.
Stengel, B; Cenee, S; Limasset, JC; et al. (1998) Immunologic and renal markers among photogravure printers exposed to toluene. Scand J Work Environ Health 24:276-284.
Streicher, HZ; Gabow, PA; Moss, AH; et al. (1981) Syndromes of toluene sniffing in adults. Ann Intern Med 94:758-762.
Sunyer, JO; Boshra, H; Lorenzo, G; et al. (2003) Evolution of complement as an effector system in innate and adaptive immunity. Immunol Res 27:549-564.
Suzuki, T; Kashimura, S; Umetsu, K. (1983) Thinner abuse and aspermia. Med Sci Law 23:199-202.
Svensson, BG; Nise, G; Englander, V; et al. (1990) Deaths and tumors among rotogravure printers exposed to toluene. Br J Ind Med 47:372-379.
Taher, SM; Anderson, RJ; MacCartney, R; et al. (1974) Renal tubular acisdosis associated with toluene “sniffing.” N Engl J Med 290:765-768.
Takeichi, S; Yamada, T; Shikata, I. (1986) Acute toluene poisoning during painting. Forensic Sci Int 32:109-115.
Tanaka, K; Maeda, T; Kobayashi, T; et al. (2003) A survey of urinary hippuric acid and subjective symptoms among occupational low toluene exposed workers. Fukushima J Med Sci 49:129-139.
Tardif, R; Plaa, GL; Brodeur, J. (1992) Influence of various mixtures of inhaled toluene and xylene on the biological monitoring of exposure to these solvents in rats. Can J Physio Pharmacol 70:385-395.
Tardif, R; Lapare, S; Krishnan, K; et al. (1993) Physiologically based modeling of the toxicokinetic interaction between toluene and m-xylene in the rat. Toxicol Appl Pharmacol 120:266-273.
Tardif, R; Truchon, G; Brodeur, J. (1998) Comparison of hippuric acid and o-cresol in urine and unchanged toluene in alveolar air for the biological monitoring of exposure to toluene in human volunteers. Appl Occup Environ Hyg 13:127-132.
Tassaneeyakul, W; Birkett, DJ; Edwards, JW; et al. (1996) Human cytochrome P450 isoform specificity in the regioselective metabolism of toluene and o-, m-, and p-xylene. J Pharmacol Exp Ther 276:101-108.
Thiel, R; Chahoud, I. (1997) Postnatal development and behaviour of Wistar rats after prenatal toluene exposure. Arch Toxicol 71:258-265.
Tilson, HA. (1990) Animal neurobehavioral test battery in NTP assessment. In: Johnson, BL: Anger, WK; Durao, A; et al., editor. Advances in neurobehavioral toxicology: applications in environmental and occupational health. Chelsea, MI: Lewis Publishers, Inc., pp. 403-418.
TN&A, Inc. (1999) Draft Risk Assessment Issue Paper for: Deriving a Provisional Subchronic Inhalation RfC for Toluene Using Physiologically-Based Pharmacokinetic Modeling. 98-031/02-19-99.
Tokunaga, I; Gotohda, T; Ishigama, A; et al. (2003) Toluene inhalation induced 8-hydroxy-2'-deoxyguanosine formation as the peroxidative degeneration in rat organs. Leg Med (Tokyo) 5:34-41.
Toyonaga, N; Adachi-Usami, E; Yamazaki, H. (1989) Clinical and electrophysiological findings in three patients with toluene dependency. Doc Ophthalmol 73:201-207.
104
Tsuruta, H. (1989) Skin absorption of organic solvent vapors in nude mice in vivo. Ind Health 27:37-47.
Turkall, RM; Skowronski, GA; Abdel-Rahman, MS. (1991) Differences in kinetics of pure and soil-adsorbed toluene in orally exposed male rats. Arch Environ Contam Toxicol 20:155-160.
Ungvary, G; Tatrai, E. (1985) On the embryotoxic effects of benzene and its alkyl derivatives in mice, rats, and rabbits. Arch Toxicol Suppl 8:425-430.
Urban, P; Lukas, E. (1990) Visual evoked potentials in rotagravure printers exposed to toluene. Br J Ind Med 47:819-823.
U.S. EPA. (Environmental Protection Agency). (1986) Guidelines for carcinogen risk assessment. Fed Regist 51:33992-34003.
U.S. EPA. (1988) Recommendations for and documentation of biological values for use in risk assessment. Environmental Criteria and Assessment Office, Office of Health and Environmental Assessment, Office of Research and Development, Cincinnati, OH; EPA/600/6-87/008. Available from:National Technical Information Service, Springfield, VA; PB-88179874.
U.S. EPA. (1991) Guidelines for developmental toxicity risk assessment. Fed Regist 56:63798-63826 and <http://www.epa.gov/iris/backgr-d.htm>.
U.S. EPA. (1994a) Interim policy for particle size and limit concentration issues in inhalation toxicity. Fed Regist 59:53799 and <http://www.epa.gov/iris/backgr-d.htm>.
U.S. EPA. (1994b) Methods for derivation of inhalation reference concentrations and application of inhalation dosimetry. EPA/600/8-90/066F. Available from: National Technical Information Service (NTIS), Springfield, VA; PB2000-500023, and <http://www.epa.gov/iris/backgr-d.htm>.
U.S. EPA. (1995) Use of the benchmark dose approach in health risk assessment. U.S. Environmental Protection Agency. EPA/630/R-94/007. Available from: National Technical Information Service (NTIS), Springfield, VA; PB95-213765 and <http://www.epa.gov/iris/backgr-d.htm>.
U.S. EPA. (1996) Guidelines for reproductive toxicity risk assessment. Fed Regist 61:56274-56322 and <http://www.epa.gov/iris/backgr-d.htm>.
U.S. EPA. (1998a) Guidelines for neurotoxicity risk assessment. Fed Regist 63:26926-26954 and <http://www.epa.gov/iris/backgr-d.htm>.
U.S. EPA. (1998b) Science policy council handbook: peer review. Prepared by the Office of Science Policy, Office of Research and Development, Washington, DC. EPA/100/B-98/001. Available from: National Technical Information Service (NTIS), Springfield, VA; PB98-140726, and <http://www.epa.gov/clariton/clhtml/pubtitleOther.html>.
U.S. EPA. (1998c) Health effects test guidelines, OPPTS 870.7800: Immunotoxicity. Office of Prevention, Pesticides and Toxic Substances, Washington, DC; EPA/712/C-98/351. Available from: <http://www.epa.gov/opptsfrs/OPPTS_Harmonized/870_Health_Effects_Test_Guidelines/ Series/870-7800.pdf>.
U.S. EPA. (2000a) Science policy council handbook: peer review. 2nd edition. Prepared by the Office of Science Policy, Office of Research and Development, Washington, DC. EPA/100/B-00/001. Available from: <http://www.epa.gov/iris/backgr-d.htm>.
U.S. EPA. (2000b) Science policy council handbook: risk characterization. Prepared by the Office of Science Policy, Office of Research and Development, Washington, DC. EPA/100/B-00/002. Available from: <http://www.epa.gov/iris/backgr-d.htm>.
U.S. EPA. (2000c) Benchmark dose technical support document [external review draft]. EPA/630/R-00/001. Available from: <http://cfpub.epa.gov/ncea/cfm/recordisplay.cfm?deid=42601>.
U.S. EPA. (2000d) Supplementary guidance for conducting health risk assessment of chemical mixtures. EPA/630/R-00/002. Available from: <http://www.epa.gov/iris/backgr-d.htm>.
U.S. EPA. (2001) Benchmark dose software (BMDS) version 1.3. Available from: <http://www.epa.gov/ncea/bmds.htm> (last modified March 22, 2001).
U.S. EPA. (2002) A review of the reference dose concentration and reference concentration processess. Risk Assessment Forum, Washington, DC; EPA/630/P-02/0002F. Available from: <http://www.epa.gov/iris/backgrd.htm>.
U.S. EPA. (2005) Guidelines for carcinogen risk assessment. Risk Assessment Forum, Washington, DC; EPA/630/P-03/001B. Available from: <http://www.epa.gov/iris/backgr-d.htm>.
Van Asperen, J; Rijcken, WR; Lammers, JH. (2003) Application of physiologically based toxicokinetic modelling to study the impact of the exposure scenario on the toxicokinetics and the behavioural effects of toluene in rats. Toxicol Lett 138(1-2):51-62.
Vieira, I; Sonnier, M; Cresteil, T. (1996) Developmental expression of CYP2E1 in the human liver: hypermethylation control of gene expression during the neonatal period. Eur J Biochem 238:476-483.
Von Euler, G; Ogren, SO; Li, XM; et al. (1993) Persistent effects of subchronic toluene exposure on spatial learning and memory, dopamine-mediated locomotor activity and dopamine D2 agonist binding in the rat. Toxicology 77:223-232.
Von Euler, G. (1994a) Toluene and dopaminergic transmission. In: Isaacson, RL; Jensen, KF, editors. The vulnerable brain and environmental risk, toxins in air and water, Vol. 3. New York, NY: Plenum Press, pp. 301-321.
Von Euler, G; Ogren, SO; Eneroth, P; et al. (1994b) Persistent effects of 80 ppm toluene on dopamine-regulated locomotor activity and prolactin secretion in the male rat. Neurotoxicol 15:621-624.
Von Euler, M; Pham, TM; Hillefors, M; et al. (2000) Inhalation of low concentrations of toluene induces persistent effects on a learning retention task, beam-walk performance, and cerebrocortical size in the rat. Exp Neurol 163:1-8.
Vrca, A; Bozicevic, D; Karacic, V; et al. (1995) Visual evoked potentials in individuals exposed to long-term low concentrations of toluene. Arch Toxicol 69:337-40.
Vrca, A; Karacic, V; Bozicevic, D; et al. (1996) Brainstem auditory evoked potentials in individuals exposed to long-term low concentrations of toluene. Am J Ind Med 30:62-66.
Vrca, A; Bozicevic, D; Bozikov, V; et al. (1997) Brain stem evoked potentials and visual evoked potentials in relation to the length of occupational exposure to low levels of toluene. Acta Medica Croatica. 51:215-219.
Wiebelt, H; Becker, N. (1999) Mortality in a cohort of toluene exposed employees (rotogravure printing plant workers). J Occup Environ Med 41:1134-1139.
WHO (World Health Organization). (1985) Environmental health criteria 52. Toluene. Geneva, Switzerland: World Health Organization. Available from: <http://www.inchem.org/documents/ehc/ehc/ehc52.htm>.
Wolf, MA; Rowe, VK; McCollister, DD; et al. (1956) Toxicological studies of certain alkylated benzenes and benzene. Arch Ind Health 14:387-398.
Wood, RW; Colotla, VA. (1990) Biphasic changes in mouse motor activity during exposure to toluene. Fund Appl Toxicol 14:6-14.
Wood, R; Cox, C. (1995) A repeated measures approach to the detection of the acute behavioral effects of toluene at low concentrations. Regulatory Toxicol Pharmacol 33:12-20.
Wood, RW; Rees, DC; Laties, VG. (1983) Behavioral effects of toluene are modulated by stimulus control. Toxicol Appl Pharmacol 68:462-472.
Xiong, L; Matthes, J; Li, J; et al. (1993) MR imaging of “spray heads”: toluene abuse via aerosol paint inhalation. Am J Neuroradiol 14:1195-1199.
Yamaguchi, H; Kidachi, Y; Ryoyama, K. (2002) Toluene at environmentally relevant low levels disrupts differentiation of astrocyte precursor cells. Arch Environ Health 57:232-238.
Yin, S; Li, G; Hu, Y; et al. (1987) Symptoms and signs of workers exposed to benzene, toluene or the combination. Ind Health 25:113-130.
Zavalic, M; Turk, R; Bogadi-Sare, A; et al. (1996) Colour vision impairment in workers exposed to low concentrations of toluene. Arh Hlg Rada Toksikol 47:167-175.
Zavalic, M; Mandic, Z; Turk, R; et al. (1998a) Quantitative assessment of color vision impairment in workers exposed to toluene. Am J Ind Med 33:297-304.
Zavalic, M; Mandic, Z; Turk, R; et al. (1998b) Assessment of colour vision impairment in male workers exposed to toluene generally above occupational exposure limits. Occup Med 48:175-180.
Zavalic, M; Mandic, Z; Turk, R; et al. (1998c) Qualitative color vision impairment in toluene-exposed workers. Int Arch Occup Environ Health 71:194-200.
Zupanic, M; Demes, P; Seeber, A. (2002) Psychomotor performance and subjective symptoms at low level toluene exposure. Occup Environ Med 59:263-268.
107
Appendix A1. Summary of External Peer Review and Public Comments and Disposition
The Toxicological Review and IRIS Summary of Toluene have undergone internal review by scientists within EPA and two separate external peer reviews in August 2002 and January 2004. The external reviews were conducted in accordance with EPA guidance on peer review (U.S. EPA, 1998b, 2000). Comments made by the internal reviewers were addressed prior to submitting the documents for external review and are not part of this appendix. For each external peer review, the reviewers were tasked with providing written answers to general questions on the overall assessment and on chemical-specific charge questions, addressing areas of scientific controversy or uncertainty. The first peer review (August 2002) was a letter review. The comments concerned issues of a significant nature, thereby necessitating an additional peer review. The second peer review (January 2004) was a panel review. The charge questions, summary of reviewer comments, and EPA’s disposition of the comments are found in Appendix A-1 for the August 2002 review and Appendix A-2 for the January 2004 review. EPA also received comments from the public. A summary of public comments and EPA’s responses are included in each section (A-1 and A-2).
August 2002 Peer Review
Charge to External Reviewers
1) RfD Derivation
a) Principal Study, Section 5.1.1: Two subchronic animal studies are available (NTP, 1990; Hsieh et al., 1989). The current IRIS entry utilizes the 13-week oral gavage study (NTP, 1990) for the derivation of an RfD. The 28-day drinking water study (Hsieh et al., 1989) was not considered. This latter study has now been chosen as the principal study. Is this the correct choice for the principal study?
b) Critical Effect, Section 5.1.1: The critical effect is identified as immunological effects: decreased thymus weight. Is this the correct critical effect and is it adequately described?
c) Methods of Analysis, Section 5.1.2: Is the point of departure determined appropriately (i.e., benchmark dose approach)?
A1-1
d) Uncertainty Factors, Section 5.1.3: Are the appropriate uncertainty factors applied? Is the explanation for each transparent?
2) RfC Derivation
a) Principal Study, Section 5.2.1: Several human epidemiological studies are available. The study used in the previous IRIS assessment (Foo et al., 1990) is not used in the reassessment; the study by Zavalic et al. (1998a) has been chosen as the principal study. Is this the correct choice for the principal study? Are adequate explanations given to explain why this study was chosen over the other available studies? An attempt is made to explain the choice of principal study, critical effect, and NOAEL by examining the entire database. Was this attempt successful?
b) Critical Effect, Section 5.2.1: The critical effect is identified as impaired color vision. Is this the correct critical effect and is it adequately described?
c) Methods of Analysis, Section 5.2.2: Is the point of departure determined appropriately) i.e., NOAEL/LOAEL approach versus benchmark dose approach)?
d) Uncertainty Factors, Section 5.2.3: Are the appropriate uncertainty factors applied? Is the explanation for each transparent?
3) Cancer Weight-of-Evidence Characterization
The weight of evidence and cancer characterization are discussed in Section 4.6. Have appropriate criteria been applied from both the 1986 EPA Guidelines for Carcinogen Risk Assessment ( Federal Register 51 (185):33992-34003) and the 1999 EPA Draft Revised Guidelines for Carcinogen Assessment (Review Draft, NCEA-F-0644, July 1999. Risk Assessment Forum)?
Scientific Comments from External Peer Review
1) RfD Derivation
a) Principal Study, Section 5.1.1: Two subchronic animal studies are available (NTP, 1990; Hsieh et al., 1989). The current IRIS entry utilizes the 13-week oral gavage study (NTP, 1990)
A1-2
for the derivation of an RfD. The 28-day drinking water study (Hsieh et al., 1989) was not considered. This latter study has now been chosen as the principal study in the draft reassessment. Is this the correct choice for the principal study?
Comment: All four reviewers agreed with the choice of principal study.
Response: During the external review period of the draft assessment, it was discovered that several relevant in vivo oral exposure studies were omitted. Please see the summary of public comments below for additional details. Consideration of these studies had a significant impact on the choice of principal study and critical effect for the RfD. After consideration of the additional studies, the principal study was changed to the 13-week gavage study (NTP, 1990) in rats. The critical effect was changed to increased kidney weight. These changes are discussed in Sections 5.1.1 and 5.1.2.
The following oral in vivo studies were added to the Toxicological Review:
• Burns, LA; Bradley, SG; White Jr, KL; et al. (1994) Immunotoxicity of mono-nitrotoluenes in female B6C3F1 mice. I. Para-nitrotoluene. Drug Chem Toxicol 17:317-358.
• Hsieh, GC; Sharma, RP; Parker, RD; et al. (1990a) Evaluation of toluene exposure via drinking water on levels of regional brain biogenic monoamines and their metabolites in CD-1 mice. Ecotoxicol Environ Saf 20: 175-184.
• Hsieh, GC; Parker, RD; Sharma, RP; et al. (1990b) Subclinical effects of ground water contaminants. III. Effects of repeated oral exposure to combinations of benzene and toluene on immunologic responses in mice. Arch Toxicol 64:320-328.
• Hsieh, GC; Sharma, RP; Parker, RD. (1990c) Subclinical effects of groundwater contaminants. Effects of repeated oral exposure to combinations of benzene and toluene on regional brain monoamine metabolism in mice. Arch Toxicol 64:669-676.
• Hsieh, GC; Sharma, RP; Parker, RD. (1991) Hypothalmic-pituitary-adrenocortical axis activity and immune function after oral exposure to benzene and toluene. Immunopharmacol 21:23-31.
A1-3
• Kostas, J; Hotchin, J. (1981) Behavioral effects of low-level perinatal exposure to toluene in mice. Neurobehav Toxicol Teratol 3:467-469.
b) Critical Effect, Section 5.1.1: The critical effect is identified as immunological effects: decreased thymus weight. Is this the correct critical effect and is it adequately described?
Comment: There was general agreement among the reviewers on the use of immunological effects as the critical effect but discrepancies in immunotoxicity study descriptions were noted as well as a concern for the use of thymus weight as the critical endpoint. It was noted that thymus weight is not generally considered a reliable indicator of immunosuppression.
Response: Upon consideration of the additional studies discussed above, the critical effect was changed to increased kidney weight. The rationale for this selection is discussed in Section 5.1.1.
c) Methods of Analysis, Section 5.1.2: Is the point of departure determined appropriately (i.e., benchmark dose approach)?
Comment: Several reviewers agreed with the use of benchmark dose modeling for the derivation of the point of departure. One reviewer questioned the used of benchmark dose modeling for thymus weight changes since effects were seen primarily only at the high doses.
Response: The critical effect has changed to increased kidney weight as described above. Benchmark dose modeling has been used to determine a point of departure for this endpoint and is described in Section 5.1.2.
d) Uncertainty Factors, Section 5.1.3: Are the appropriate uncertainty factors applied? Is the explanation for each transparent?
Comment: Three reviewers agreed with the choice of uncertainty factors. Another reviewerstated that uncertainty factors are subject to scientific judgement and did not comment further.
Response: No response needed.
2) RfC Derivation
A1-4
a) Principal Study, Section 5.2.1: Several human epidemiological studies are available. The study used in the previous IRIS file (Foo et al., 1990) is not used in the reassessment; the study by Zavalic et al. (1998a) has been chosen as the principal study. Is this the correct choice for the principal study? Are adequate explanations given to explain why this study was chosen over the other available studies? An attempt is made to explain the choice of principal study, critical effect, and NOAEL by examining the entire database. Was this attempt successful?
Comment: Three of the four reviewers indicated that the selection of Zavalic et al. (1998a) was the correct choice for the principal study. One reviewer stated that the available data are inadequate to appropriately protect the public’s health and that additional research is needed.
Response: No response required. Note that an updated literature search identified several additional inhalation exposure studies that have been included in Section 4.1.2.
Comment: One reviewer noted specific issues concerning the use of the Zavalic et al. (1998a) study as the principal study, including the following:
• Measurements of toluene exposure were not performed in accordance with modern standards and were not individual exposure measurements.
Response: Zavalic et al. (1998a) referenced standard methods for measuring both ambient air concentrations (NIOSH, 1974) and individual blood toluene levels (Nise and Orbaek, 1988). Sampling tubes were fixed onto the work tables or machines at nose height and air was collected continually throughout the working day. Personal air monitors were not used in this study; however, individual blood samples were taken from all workers. Urine samples were taken from all workers in the high dose group.
• Alcohol consumption, an important risk factor, was not adequately controlled. Alcohol consumption data obtained from questionnaires should not be considered reliable.
Response: Alcohol consumption is considered an important independent risk factor for impaired color vision (Russell et al., 1980). Zavalic et al. (1998a) were cognizant of this fact and utilized self-reported alcohol consumption data to adjust the color confusion index scores. Self-reported alcohol consumption data are generally not considered to be exceptionally accurate, but there is no reason to suspect that the data from the exposed group are any less accurate than the data from the control group. Moreover, when alcohol
A1-5
consumers were excluded from the data set, a significant correlation (p<0.05) was still observed between exposure and CCI scores.
• The effects reported by Zavalic et al. (1998a) were not observed by Nakatsuka et al. (1992), a study that was not included in the Toxicological Review.
Response: The Nakatsuka et al. (1992) study has been added to the Toxicological Review in Sections 4.1.2.2 and 5.2.1. Impaired color vision associated with exposure to toluene has been reported by several investigators (Campagna, et al., 2001, Cavelleri et al., 2000, Muttray, et al., 1999, Zavalic et al., 1998a, 1998b) but was not observed by Nakatsuka et al. (1992). The discrepancy may be due to the method of color vision assessment. For example, Nakatsuka et al. (1992) assessed color vision in a qualitative manner indicated by color vision loss. The other studies measured color confusion indices directly.
• Zavalic et al. (1998a) state that toluene was also used for manually cleaning the rollers. This would result in an unusual exposure that would likely be underestimated by the exposure assessment procedures that were used.
Response: The use of toluene to manually rinse the rollers may have been a significant source of exposure for the printers who were examined by Zavalic et al. (1998a). The authors do not state whether the collected air samples would characterize this exposure scenario.
b) Critical Effect, Section 5.2.1: The critical effect is identified as impaired color vision. Is this the correct critical effect and is it adequately described?
Comment: Two reviewers indicated that impaired color vision was the appropriate selection for a critical effect, but one of these reviewers felt that the documentation of this adverse effect was lacking. This opinion was shared by another reviewer, who questioned the biological significance of this endpoint.
Response: Additional text was added to Section 4.1.2.2 to better describe the Lanthony D-15 color vision test. Additional text was also added to Sections 4.5.3 and 5.2.1 to support the use of impaired color vision as a critical effect.
A1-6
Comment: One reviewer noted the observed prevalence of dyschromatopsia in the control group (43%) would be considered high, leading one to question the validity of the results.
Response: The prevalence of dyschromatopsia in the unexposed study population (28%), which was reported in a separate publication (Zavalic et al., 1998b), is consistent with other studies where the Lanthony D-15 desaturated panel (D-15d) has been employed (Campagna et al., 2001; Geller and Hudnell, 1997). The D-15d is considered a highly sensitive test for detecting mild to moderate dyschromatopsia but can yield false positive results (Geller and Hudnell, 1997). Nevertheless, the D-15d has proven effective in detecting acquired color vision deficits associated with chemical exposure (Geller and Hundell, 1997; Gobba and Cavalleri, 2003).
Comment: One reviewer noted a statistically significant impact on color vision was only observed when the data were adjusted for age and alcohol intake, which leads to questionable results.
Response: The reported mean CCI score for the high exposure population (E2) was significantly different from both the low exposure (E1) and unexposed (NE) populations (p < 0.001). To examine the relationship between CCI scores and exposure measurements, the authors attempted to control for two potential risk factors, age and alcohol, by calculating age and alcohol intake adjusted color confusion index (AACCI) values. The authors state that the AACCI values were obtained using the residuals from a linear regression analysis of the unexposed population, but the actual data points with standard deviations were not provided.
c) Methods of Analysis, Section 5.2.2: Is the point of departure determined appropriately (i.e., NOAEL/LOAEL approach versus benchmark dose approach)?
Comment: Two reviewers stated that the point of departure was appropriately determined using the NOAEL/LOAEL approach. One of these reviewers stated that reports of other neurologic effects at concentrations ranging from 40 to 100 ppm support the use of a NOAEL in this case. Another reviewer was concerned that the low dose group might not provide an adequate basis for the determination of a NOAEL since the biomarker-based measures of exposure were not well correlated with the measured time-weighted-average (TWA) air concentration of toluene for the low dose exposure group (r = 0.47, p = 0.09). This reviewer suggested the TWA air concentrations may not have been an accurate measure of true exposure either because of inaccurate measurement or possibly because of dermal absorption of toluene. This reviewer also
A1-7
stated that the data should lend itself to benchmark dose modeling for the determination of the point of departure if tabular data were available and suggested contacting the authors to obtain the complete quantitative data. The fourth reviewer indicated that the validity of extrapolation from an 8 hour/day exposure to continuous chronic exposure is debatable. The statement was made that large individual variations in inhalation are to be expected during various levels of strenuous activity and that it is doubtful that a 2-day longer exposure period (i.e., the weekend) would change the body burden by 5/7.
Response: The external review draft relied on a NOAEL/LOAEL approach for the determination of the point of departure for the RfC. Individual data points were not available at that time. The standard deviations of the AACCI means have now been obtained which allows for the use of benchmark dose modeling to derive a BMDL as the point of departure. This methodology utilizes the entire data set, which somewhat circumvents the issue surrounding the accuracy of the NOAEL. The NOAEL is no longer relied upon as the point of departure. The point of departure is now 99 ppm (374 mg/m3).
The extrapolation from an 8 hour/day exposure to continuous chronic exposure is a default procedure outlined in the Methods for Derivation of Inhalation Reference Concentrations and Application of Inhalation Dosimetry (U.S. EPA, 1994b). The approach for human exposure scenarios is to adjust the exposure concentration by the default occupational ventilation rate and for the intermittent work week schedule as indicated in Section 5.2.2. PBPK models are available that describe the kinetics of toluene after inhalation exposure (Fisher et al., 1997; Pierce et al., 1996, 1999; DeJongh and Blaauboer, 1996, 1997; Tardif et al., 1993). These models could theoretically be utilized for conducting a dose-based duration adjustment.
In the case of chronic exposure, however, it is not clear that the peak tissue concentration is the appropriate measure of internal dose to use in conducting a dose-based duration adjustment as described in Section 5.2.2. The standard use of the human equivalent concentration multiplied by the 5/7 ratio to adjust for the hours/day and days/week exposure differences is based on the logical premise that the total amount of exposure, rather than the momentary tissue concentration, is the appropriate predictor of chronic toxic effects. At this time data are not available to determine the proper dose metric for the chronic effects of toluene exposure on color vision; thus, the standard default methodology for duration adjustment was used.
A1-8
d) Uncertainty Factors, Section 5.2.3: Are the appropriate uncertainty factors applied? Is the explanation for each transparent?
Comments: Three of the reviewers stated that the appropriate uncertainty factors were applied and that the explanation for each was transparent. The fourth reviewer did not comment on the choice of uncertainty factors for the RfC.
Response: No response required.
e) General Comments on the RfC Derivation
Comment: One reviewer requested inclusion of where the human inhalation studies were conducted in study descriptions.
Response: The country of origin (if known) of the workers in the inhalation studies has been included in Section 4.1.2.2.
3) Cancer Weight-of-Evidence Characterization
The weight of evidence and cancer characterization are discussed in Section 4.6. Have appropriate criteria been applied from both the 1986 EPA Guidelines for Carcinogen Risk Assessment ( Federal Register 51 (185):33992-34003) and the 1999 EPA Draft Revised Guidelines for Carcinogen Assessment (Review Draft, NCEA-F-0644, July 1999. Assessment Forum)?
Comment: Three reviewers agreed with the classification and descriptor used. Another reviewer agreed that data in humans and animals are barely sufficient for a reliable conclusion on the carcinogenic potency of toluene but that more emphasis should be placed on the negative human study by Wiebelt and Becker (1999).
Response: A description of the Wiebelt and Becker (1999) study is included in Section 4.1.2.3. This study is a cohort mortality study in toluene-exposed workers (Wiebelt and Becker, 1999), which reported no change in cancer-specific mortality when the entire cohort was taken into consideration. A subcohort of highly-exposed workers demonstrated statistically significant increases in mortality from cancers of the bone and connective tissue, but lack of exposure
A1-9
characterization, co-exposure information, and adjustment for other confounding factors (age, smoking, etc.) within the subcohort precludes drawing conclusions from these results as to the possible association between toluene exposure and cancer risk. The results of this study are taken into consideration in the weight-of-evidence evaluation and cancer characterization described in Section 4.6.2. A summary of the available human studies, chronic animal bioassays, and genotoxic studies is the primary emphasis of this section. The database as a whole contributes to the cancer evaluation. It should be noted that, since the external peer review, the IRIS Program has implemented sole use of the Draft Revised Guidelines for Carcinogen Assessment (U.S. EPA, 1999) in accordance with Agency practice (Federal Register 66(230):59593-59594). In addition, note that the NTP (1990) cancer bioassy has been published (Huff, 2003) and is included as a citation.
Scientific Comments from the Public
Comment: One reviewer disagreed with the principal study and critical effect identified for the derivation of the RfD. This reviewer recommended the use of the NTP (1990) study used in the assessment currently on the IRIS database. The rationale for not using the proposed study (Hsieh et al., 1989) and critical effect (immunological effects; decreased thymus weight) was several-fold. First, the reviewer stated that the relative differences in thymus weight are small and the significance of this effect is questionable given the lack of information about absolute thymus weights and thymus-to-brain ratios. This reviewer also questioned the reliability and significance of thymus weight differences and the PFC assays from the Hsieh et al. (1989) study given other research by Hsieh et al. (1990b) and Burns et al. (1994) that was not included in the Toxicological Review. Hsieh et al. (1990b) exposed CD-1 male mice to toluene for 28 days in drinking water at doses of 0, 22, and 90 mg/kg-day and found no effects or changes in thymus weights or liver weights at either dose. Hsieh et al. (1990b) also found no effects in the PFC assays except minimal changes in the PFC/106 splenocytes at the high dose. In addition, Burns et al. (1994) exposed B6C3F1 mice to significantly higher doses than the Hsieh (1989, 1990b) studies (i.e., 600 mg/day), and observed no effects on thymus weight and several immune response assays, including several standard host resistance assays.
Response: The reviewer is correct in that several relevant in vivo oral exposure studies were omitted from the external review draft (August 2002). Consideration of these studies had a significant impact on the choice of principal study and critical effect for the RfD. The principal study has been changed to the 13-week gavage study (NTP, 1990) in rats. The critical effect has
A1-10
been changed to increased kidney weight. These changes are discussed in Sections 5.1.1.and 5.1.2 of the Toxicological Review.
The following oral in vivo studies were added to the Toxicological Review:
• Burns, LA; Bradley, SG; White, KL, Jr; et al. (1994) Immunotoxicity of mono-nitrotoluenes in female B6C3F1 mice: I. para-nitrotoluene. Drug Chem Toxicol 17:317-358.
• Hsieh, GC; Sharma, RP; Parker, RD; et al. (1990a) Evaluation of toluene exposure via drinking water on levels of regional brain biogenic monoamines and their metabolites in CD-1 mice. Ecotoxicol Environ Saf 20:175-184.
• Hsieh, GC; Parker, RD; Sharma, RP; et al. (1990b) Subclinical effects of ground water contaminants. III. Effects of repeated oral exposure to combinations of benzene and toluene on immunologic responses in mice. Arch Toxicol 64:320-328.
• Hsieh, GC; Sharma, RP; Parker, RD. (1990c) Subclinical effects of groundwater contaminants. Effects of repeated oral exposure to combinations of benzene and toluene on regional brain monoamine metabolism in mice. Arch Toxicol 64:669-676.
• Hsieh, GC; Sharma, RP; Parker, RD. (1991) Hypothalmic-pituitary-adrenocortical axis activity and immune function after oral exposure to benzene and toluene. Immunopharmacol 21:23-31.
• Kostas, J; Hotchin, J. (1981) Behavioral effects of low-level perinatal exposure to toluene in mice. Neurobehav Toxicol Teratol 3:467-469.
Comment: One reviewer indicated that the selection of Zavalic et al. (1998a) as the principal study for the derivation of the RfC is appropriate. This reviewer stated that the study contains data on atmospheric toluene levels in the workplace and uses an appropriate test for color vision confusion. The reviewer noted that using this study minimizes the needs for extensive use of uncertainty factors since it was performed in humans exposed to toluene for long durations and identifies both a NOAEL and LOAEL.
A1-11
Response: The Zavalic et al. (1998a) study has been retained as the principal study for the derivation of the RfC. However, since the standard deviations of the means of the AACCI color vision scores have become available, the data have now been inserted into benchmark dose modeling software and a BMDL has been derived instead of relying on a single dose level (i.e., a NOAEL) as the point of departure. The uncertainty factors remain the same.
A1-12
Appendix A2. Summary of External Peer Review and Public Comments and Disposition
January 2004 Peer Review
Charge to External Reviewers
1) RfD Derivation
a) Principal Study, Section 5.1.1 The principal study is the subchronic gavage NTP (1990) study. Has the correct principal study been chosen? Is the explanation for the choice of principal study transparent?
b) Critical Effect, Section 5.1.1: The critical effect is identified as increased kidney weight. Is this the correct critical effect and is it adequately described?
c) Methods of Analysis, Section 5.1.2: Benchmark dose modeling has been used to derive the point of departure for determining the RfD. In the absence of information on the level of response to consider adverse, a change in the mean equal to one standard deviation from the control mean was used according to the U.S. EPA Benchmark Dose Technical Document Guidance (U.S. EPA, 2000c). Has the correct benchmark response (one standard deviation from the control mean) been chosen for the continuous data set for increased kidney weight? Have PBPK modeling issues (i.e., route-to-route extrapolation from inhalation data was not conducted) been adequately addressed?
d) Uncertainty Factors, Section 5.1.3: Have the appropriate uncertainty factors been applied? Is the explanation for each transparent? Is there sufficient justification to not include an uncertainty factor for database insufficiencies?
2) RfC Derivation
a) Principal Study, Section 5.2.1: Several human occupational studies are available. The study used in the previous IRIS file (Foo et al., 1990) is not used in the reassessment; the study by Zavalic et al. (1998a) has been chosen as the principal study. Is this the correct choice for the principal study? Are adequate explanations given to explain why this study was chosen over the other available studies?
A2-1
b) Critical Effect, Section 5.2.1: The critical effect is identified as impaired color vision. Is this the correct critical effect and is it adequately described? Is the biological basis for choosing this effect adequately explained?
c) Methods of Analysis, Section 5.2.2: Benchmark dose modeling has been used to derive the point of departure for determining the RfC. In the absence of information on the level of response to consider adverse, a change in the mean equal to one standard deviation from the control mean was used according to the U.S. EPA Benchmark Dose Technical Guidance Document (U.S. EPA, 2000c). Has the correct benchmark response (one standard deviation from the control mean) for the continuous data set for alcohol- and age-adjusted color confusion index (AACCI) been chosen? Have PBPK modeling issues (i.e., a chemical-specific duration adjustment was not conducted) been adequately addressed?
d) Uncertainty Factors, Section 5.2.3: Have the appropriate uncertainty factors been applied? Is the explanation for each transparent?
3) Cancer Weight-of-Evidence Classification The weight of evidence and cancer characterization are discussed in Section 4.6. Have appropriate criteria been applied from the 1999 EPA Draft Revised Guidelines for Carcinogen Assessment (Review Draft, NCEA-F-0644, July 1999. Risk Assessment Forum)? Is the statement that “data are inadequate for an assessment of the human carcinogenic potential” correct?
Specific Comments from External Peer Review
1) RfD Derivation
a) Principal Study, Section 5.1.1: The principal study is the subchronic gavage NTP (1990) study. Has the correct principal study been chosen? Is the explanation for the choice of principal study transparent?
Comment: Four of the seven reviewers agreed on the choice of the NTP (1990) study as the correct principal study. One reviewer indicated a lack of knowledge of nephrotoxicity and immunotoxicity and precluded comment. One reviewer indicated a lack of necessity for an oral RfD and provided no further comment. One of the reviewers disagreed with the decision not to
A2-2
use immunologic endpoints and recommended that the choice of principal study reflect the immunotoxicity of toluene. The reviewer pointed out that, although Hsieh et al. (1989) found decreased thymus weight in male CD-1 mice at the highest dose following toluene exposure and Hsieh et al. (1990a,b) did not, the latter studies used a 20% lower dose indicating these findings may be consistent and dose-related. In addition, the reviewer refuted the significance of the Burns et al. (1994) data, which showed no effect of toluene exposure on host resistance in female B6C3F1 mice, by noting that Burns et al. (1994): (1) used a different strain of mice; (2) used a shorter exposure time (14 days rather than the 28 days used by Hsieh [1989, 1990a,b]); and (3) also found a 40% decrease in IgM response that was not statistically significant at n= 4. The reviewer also cited additional evidence of toluene immunotoxicity from fish studies (Smith et al. 1999; Gogal et al., 1999). The reviewer pointed out that the lack of effect of toluene on host resistance models does not preclude toluene as an immunotoxicant because there is only a 0.78 out of 1.00 predictive value between indicators of immunotoxicity, such as the PFC assay, and host resistance assays (Luster et al., 1992).
Response: The decreased thymus weight found by Hsieh et al. (1989) was at the highest dose of toluene studied (405 mg/L) rather than 325 mg/L from Hsieh et al. (1990a,b). The lack of a response at the lower dose in Hsieh (1990a,b) does not directly contradict the earlier data. However, as is pointed out in Section 5.1.1, decreased thymus weight is generally considered to have limited value as an indicator of immunotoxicity (Luster et al., 1992; Dean, 1997). The lack of immunotoxicity in a range of measures, including host resistance in a different mouse strain in the Burns et al. (1994) study, suggests that the response to toluene seen by Hsieh et al. (1989, 1990c, 1991) is not consistent within species and may reflect the possibility that changes in immune responses measured by in vivo/ex vivo studies are frequently not indicative of responses seen in host resistance assays. The 14-day exposure time utilized in the Burns et al. (1994) study is a commonly used exposure regime for subacute studies and has often been used for subacute immunotoxicology studies in rodents (Luster et al., 1989). However, the 28-day exposure used in Hsieh (1989, 1990c, 1991) has become the preferred duration for assays of immune function, including tests for anti-SRBC serum antibodies or PFC response after SRBC challenge, as evidenced by the 28-day suggested minimum length of exposure in the Immunotoxicity Health Effects Test Guidelines (U.S. EPA, 1998b). The 40% decrease in the PFC response from the Burns et al. (1994) study is not strong support for toluene inhibition of antibody production, because the standard IgM-related PFC response was not suppressed when tested 4 days after primary exposure. The response that is reduced is the IgG-related PFC response tested 5 days after primary exposure. Although IgG does play a role in the primary response to antigen, the
A2-3
major function of IgG in the response to antigen is after the secondary exposure, and this was not assayed in the experiment. Finally, the data from comparative studies in fish, while helpful, does not provide strong support for toluene’s potential immunotoxicity in mammals, in general, or in humans, in particular because of the strong phylogenetic differences in immune function between the two groups (Sunyer et al., 2003). The conflicting immunotoxicity data have been taken into account as described in Sections 5.1.1, 5.1.2, and 5.1.3 of the Toxicological Review. The inconsistencies in the immunotoxicity database are accounted for, among other insufficiencies, by the application of a 3-fold uncertainty factor for an incomplete database.
• Luster, MI; Ackermann, MF; Germolec, DR; et al. (1989). Perturbations of the immune system by xenobiotics. Environ Health Perspect 81:157-162.
• U.S. EPA. (1998c) Health effects test guidelines, OPPTS 870.7800: Immunotoxicity. Office of Prevention, Pesticides and Toxic Substances, Washington, DC; EPA/712/C-98/351. Available from: <http://www.epa.gov/opptsfrs/OPPTS_Harmonized/870_Health_Effects_Test_Guidelines/ Series/870-7800.pdf>.
• Dean, JH. (1997) Issues with introducing new immunotoxicology methods into the safety assessment of pharmaceuticals. Toxicology 119:95-101.
• Sunyer, JO; Boshra, H; Lorenzo, G; et al. (2003) Evolution of complement as an effector system in innate and adaptive immunity. Immunol Res 27:549-564.
Comment: One of the reviewers suggested a more complete explanation of how the high dose group results were handled in the NTP (1990) study.
Response: A more detailed explanation of the effects of deaths in the 5000 mg/kg group has been included in Section 4.2.1.1, and a clear indication that the high dose group was eliminated from further assessment has been added.
Comment: One of the reviewers suggested that the dose levels in the NTP (1990) study be referred to after adjustments for duration.
Response: The dose levels were listed as administered and as adjusted for duration (i.e., 312 mg/kg 5 days/week becomes 223 mg/kg-day) as indicated in Section 4.2.1.1. An explanation of this adjustment was included. All references to dose are to the adjusted dose.
b) Critical Effect, Section 5.1.1: The critical effect is identified as increased kidney weight. Is this the correct critical effect and is it adequately described?
Comment:. Four of the seven reviewers found the choice of kidney weight in the NTP (1990) study as the critical effect to be the best choice from available data. Two reviewers indicated the interspecies variability in the effect of toluene on kidney weight should be discussed. Two reviewers indicated additional text should be included to add more weight to the immunotoxicity studies.
Response: The increase in kidney weight (NTP, 1990) has been retained as the critical effect. Benchmark dose modeling of selected immunotoxicity endpoints has been included in the quantitative analysis (Section 5.1.3). An uncertainty factor of 3 for database insufficiency has been included in the derivation of the RfD to account for, among other deficiencies, potential immunotoxic effects that could occur at a lower dose than the dose used for the point of departure. The text in Sections 5.1.1 and 5.1.2 has been augmented to reflect the species differences in the observed kidney weight changes.
Comment: One reviewer suggested that immunotoxicity would be a better endpoint for the derivation of the RfD because it is present across species (mice, hamsters, and fish), and the depressed antibody response (Hsieh et al., 1989, 1990b) is supported by a similar reduction in the lymphoproliferative response (Hsieh et al., 1989, 1990b), a 30% decrease in circulating leukocytes (Burns et al., 1994), and a 100% increase in corticosterone (Hsieh et al., 1991). A fish study (Palermo-Neto et al., 2001) was cited for inclusion in the Toxicological Review. See also the comment above regarding immunotoxicity as an important potential endpoint for toxicity.
Response: The fish data (as discussed above) involve animals with a highly divergent immune system from mammals, and the Palermo-Neto et al. (2001) study involves a mixture of toluene and n-hexane, not pure toluene. Leukocyte counts are poor predictors of immunotoxic outcome (Luster et al., 1992; Dean, 1997), and the 30% reduction in circulating leukocytes (Burns et al., 1994) is not cited in the original study as an indication of immunotoxicity. Although
A2-5
corticosterone is an immunosuppressor, measuring increased corticosterone in the absence of convincing reductions in other immune assays may not be evidence of immune suppression.
c) Methods of Analysis, Section 5.1.2: Benchmark dose modeling has been used to derive the point of departure for determining the RfD. In the absence of information on the level of response to consider adverse, a change in the mean equal to one standard deviation from the control mean was used according to the U.S. EPA Benchmark Dose Technical Document Guidance (U.S. EPA, 2000c). Has the correct benchmark response (one standard deviation from the control mean) been chosen for the continuous data set for increased kidney weight? Have PBPK modeling issues (i.e., route-to-route extrapolation from inhalation data was not conducted) been adequately addressed?
Comment: Five of the seven reviewers indicated benchmark dose modeling was the appropriate method for quantitation for the RfD, and the correct benchmark response was used if kidney weight change is considered the relevant endpoint of toxicity. All reviewers agreed that PBPK modeling issues have been adequately addressed. One reviewer suggested that a NOAEL/LOAEL approach for quantitation would suffice because of the small potential for relevant exposure.
Response: No comment necessary.
Comment: One reviewer indicated confusion in the description of the benchmark dose modeling approach regarding the P0 (one standard deviation from the mean kidney weight in controls) and the benchmark response level.
Response: The reviewer has identified one issue in EPA’s evolving benchmark dose (BMD) methodology that has not been standardized, which is nomenclature. The P0 referred to was used in one previous IRIS assessment but has not been generalized in guidance yet. However, the benchmark responses (BMRs) that were used for toluene are consistent with current guidance to present BMDs corresponding to a 10% extra risk. That is, for continuous data, a one standard deviation (SD) change in the mean response of an exposed group is approximately equivalent to 10% of that group having responses more extreme than 98% of the control group. A one-SD BMR is directly comparable to the recommended baseline BMR of 10% extra risk for quantal endpoints and is, therefore, a point of standardization for considering quantal and continuous data. Contrast this with a 10% change in a continuous variable, which is too unstable a BMR
A2-6
since the degree of variability in the endpoint (and in a particular study) can have a significant impact on the interpretation of the data. The BMD methodology recognizes that the 98th
percentile of the control group may not always characterize a bright-line for adverse levels of continuous variables, depending on the endpoint being considered. This is why the methodology recommends a one-SD BMR as a point of comparison across chemicals but not necessarily the only benchmark to be considered.
d) Uncertainty Factors, Section 5.1.3: Have the appropriate uncertainty factors been applied? Is the explanation for each transparent? Is there sufficient justification to not include an uncertainty factor for database insufficiencies?
Comment: Five of the seven reviewers found the explanation for applying each uncertainty factor was clear and that sufficient justification for not including a database uncertainty factor was provided. One of the reviewers commented that the use of uncertainty factors was not based on science because no data exist on animal to human extrapolation from oral exposure to toluene.
Response: No response necessary.
Comment: One of the reviewers suggested including Van Asperen et al. (2003) in the discussion of PBPK modeling data related to toluene.
Response: The Van Asperen et al. (2003) reference has been added to the text in Section 3.5 of the Toxicological Review. The results of this high dose study add to the available information regarding the pharmacokinetics of toluene in rats.
2) RfC Derivation
a) Principal Study, Section 5.2.1: Several human occupational studies are available. The study used in the previous IRIS file (Foo et al., 1990) is not used in the reassessment; the study by Zavalic et al. (1998a) has been chosen as the principal study. Is this the correct choice for the principal study? Are adequate explanations given to explain why this study was chosen over the other available studies?
A2-7
Comment: Two reviewers found that the choice of Zavalic et al. (1998a) as the principal study was adequately explained. However, all reviewers found the inconsistent presentation of results in the three papers by Zavalic et al. (1998a,b,c), which purportedly represent the same study population, should be reexamined and the choice of the Zavalic et al. (1998a) study as the principal study should be reconsidered. Specifically, the reviewers pointed out that, within the three publications, data describing the mean alcohol consumption, toluene exposure, and control subject group are significantly different, while the assertion is made that the cohorts are the same. The reviewers pointed out that the Zavalic et al. (1998a,b,c) studies also do not indicate an effect on color vision until confounding factors such as alcohol consumption and age were taken into consideration. Several reviewers suggested revisions to the text regarding the use of Zavalic et al. (1998a) as the principal study for the derivation of the RfC, if this study were to be retained as the principal study, due to the discrepancies noted in the data sets among various studies from the same cohort (Zavalic et al., 1998a,b,c). Five reviewers indicated that the other available occupational studies, in addition to the Zavalic et al. (1998a) study, all contain potential “nonfatal” confounding issues and, as such, should be considered equally for use as the principal study. The reviewers indicated the majority of the available human studies point to a dose range where no effects from toluene exposure were observed. Several reviewers suggested a weight-ofevidence approach would be superior to choosing one study as the principal study for the derivation of the RfC.
Response: Upon further evaluation of the Zavalic et al. (1998a,b,c) studies, it is evident that there are a number of discrepancies within the data sets from the same cohort that are of concern. For example, the reported alcohol consumption and toluene exposure duration differ considerably within descriptions of the same cohort. The rationale for the discrepancies is not readily apparent. The alcohol consumption range is identical for Group E1, but the mean differs (32.29 vs 78.0 grams/week); the upper range is 262 grams/week for both E2 group descriptions, but the lower bound is 42 vs 45 grams/week, and the means also differ (96.1 vs 160 grams/week). Accounting for alcohol consumption in studies of color vision effects is considered a necessary adjustment of the data. The duration of toluene exposure is also different within the same cohort as described by the three papers. For these reasons, the Zavalic et al. (1998a) study is no longer considered the principal study for the derivation of the RfC. Notations in the study descriptions for the Zavalic et al. (1998a,b,c) studies as to potential discrepancies in data reporting have not been made and the comments from reviewers as indicated in this appendix are considered sufficient. Instead of relying on the Zavalic et al (1998a) study as the principal study, a holistic approach has been applied whereby all available human and animal inhalation studies
A2-8
are taken into consideration from a qualitative viewpoint for the determination of a suitable endpoint of toxicity. In addition, a subset of the human studies has been identified for use in the quantitative analysis. Criteria used for defining this subset of studies and a discussion of the approach is described in Sections 5.2.1 and 5.2.2. The information derived from the Zavalic et al. (1998a,b,c) studies is considered valuable and has been taken into consideration along with the other available studies irrespective of potential concerns about the data.
Comment: Three reviewers indicated that a potential difficulty with the Zavalic et al. (1998a,b,c) studies is that the illumination conditions—a major confounding factor in color confusion research—were not standardized or well characterized.
Response: The level of luminance and the color spectrum of the light that is used to illuminate the colored test chips are important factors to control in application of the Lanthony D-15d (Geller and Hudnell, 1997). The number of errors made by observers with normal vision increases at levels of illumination below 500 lx, approximately the brightness of a room in normal daylight. Zavalic et al. (1998a,b) did not control the illumination of the test when administered at different locations but instead used natural daylight. Thus, as the reviewers state, differences in illumination in the testing locations at the different plants could have introduced systematic bias in the CCI scores when compared across different testing locations or different days. For example, differences in ambient lighting could conceivably account for the group effects observed in Figures 1 and 2 of Zavalic et al. (1998b). This problem, however, cannot reasonably explain significant dose-related associations as a function of air or blood toluene concentrations that are observed only within the exposed population and measured at a single location, such as the data presented by Zavalic et al. (1998b). There is no reason to suspect a confounding between test luminance conditions and air or biological concentrations of toluene or its metabolites for measures all collected within one exposed plant. It is also important to consider that numerous other studies have observed increased CCI scores in populations exposed to volatile organic compounds when the testing was conducted under appropriate illumination conditions (e.g., Mergler et al., 1988; Cavalleri et al., 2000; Campagna et al., 2001).
b) Choice of Critical Effect, Section 5.2.1: The critical effect is identified as impaired color vision. Is this the correct critical effect and is it adequately described? Is the biological basis for choosing this effect adequately explained?
A2-9
Comment: Four reviewers indicated color vision impairment was a viable endpoint for toxicity from toluene exposure via inhalation. The reviewers were not uniform with regard to whether or not increased CCI scores on the Lanthony D15-d were considered adverse and, therefore, appropriate for selection as a critical effect. One reviewer accepted the concept that alterations in color perception are to be considered adverse in their own right. On the other hand, this reviewer was not convinced that CCI scores reflected color perception deficits and was concerned that neurobehavioral and cognitive deficits were not considered in the assessment. One reviewer stated that impaired color vision was an undesirable effect rather than a frank toxic effect, apparently implying that the choice of CCI as the critical effect was inappropriate. Several of the reviewers suggested a weight-of-evidence approach involving multiple outcomes, including neurological and performance measurements along with those of color arrangement tests.
Response: The use of color vision impairment as a critical effect from toluene exposure has been reconsidered. A subset of adequate studies were evaluated which indicate neurological effects are the critical effect following toluene exposure. Color vision impairment is now considered one of multiple neurological deficits that are evident from the available data. This approach gives broader coverage of potential adverse outcomes and places less reliance on a single outcome. This approach has the advantage of considering multiple neurotoxicological outcome measures that have been evaluated in various studies.
Comment: Several reviewers, while agreeing with color vision as a potential indicator of toluene toxicity, questioned whether visual impairment is a chronic effect or an acute effect that is temporally associated with ongoing exposure. One reviewer noted that the use of acute measurements (i.e., on a single day) to represent chronic exposure may not capture day-to-day variations in toxicity.
Response: There is no direct evidence as to the reversibility of changes in color perception as a consequence of exposure to toluene. The primary studies of toluene exposure have been conducted on workers currently exposed to toluene. Other organic solvents also are reported to increase CCI values, and there is limited evidence as to the reversibility of these effects. For dry cleaners exposed to perchloroethylene, Gobba et al. (1998) observed that populations with increased levels of exposure showed increased CCI scores, whereas those with decreased exposure levels showed no significant recovery in CCI scores 2 years after the first evaluation. In contrast, Mergler et al. (1996) found in a 2-year follow-up that workers exposed to styrene in
A2-10
exposure scenarios with improved exposure conditions over time also showed improvements in CCI scores. The results of these studies indicate if the CCI deficits from organic solvents are reversible, they appear to do so slowly. Section 4.5.2 discusses the available information regarding endpoints of toluene toxicity following long-term exposure to toluene with respect to reversibility of effects.
Comment: One reviewer indicated the high prevalence of spontaneous color vision impairment to be a confounding factor for the relevance of toluene-associated impairment of color vision as an adverse condition.
Response: The concept that performance on the Lanthony D15-d color arrangement test could be influenced by factors other than deficits in color perception is technically correct. The Lanthony D15-d is a screening procedure that ideally should be used to identify potential candidates for more extensive follow-up evaluations, in order to determine if the deficits observed are in fact related to impaired color perception or to some other factor. Unfortunately, extensive follow-up testing is rarely done in field studies of occupationally exposed workers due to limitations of logistics, time, and resources. In the absence of more definitive evaluations, it may be best to make the most reasonable conclusions based on the evidence that is available. In general, the task performance demands of the Lanthony D15-d are relatively minor. It is an easy task to perform and is administered without a time limit. The performance on the task is known to be influenced by numerous parameters that alter the physical parameters of the stimulus, such as the intensity and color spectrum of the illuminant, the pupil size, and the relative clarity of the lens (reviewed in Geller and Hudnell, 1997). If the potentially confounding factors are well-controlled across experimental groups, then it is reasonable to conclude that systematic group differences related to exposure may be due to color perception deficits.
c) Methods of Analysis, Section 5.2.2: Benchmark dose modeling has been used to derive the point of departure for determining the RfC. In the absence of information on the level of response to consider adverse, a change in the mean equal to one standard deviation from the control mean was used according to the U.S. EPA Benchmark Dose Technical Guidance Document (U.S. EPA, 2000c). Has the correct benchmark response (one standard deviation from the control mean) for the continuous data set for alcohol- and age-adjusted color confusion index (AACCI) been chosen? Have PBPK modeling issues (i.e., a chemical-specific duration adjustment was not conducted) been adequately addressed?
A2-11
Comment: A majority of the reviewers commented on the use of benchmark dose modeling for the derivation of the RfC. There was general agreement that this method of determining the point of departure from the available data (i.e., Zavalic et al.,1998a) was acceptable but that the use of this data set should be reconsidered (see above comments). Several reviewers commented that PBPK modeling issues were adequately addressed and that the available PBPK models were inadequate for use in deriving a human equivalent concentration. One reviewer presented an adaptation of the available PBPK models for consideration for use in converting discontinuous occupational exposures to continuous exposures (TN&A, Inc., 1999). The adapted model was designed for the Foo et al. (1990) study and utilizes an internal averaged concentration of toluene in the brain. The reviewer stated that the most appropriate bioequivalent internal dose metric would be the average concentration of toluene in the brain, calculated with a PBPK model for t >0 by dividing the area under the curve for toluene concentration in the brain by time.
Response: Although use of an average concentration of toluene in the brain as an internal dose metric is a reasonable assumption for the appropriate bioequivalent dose, no data are available for demonstrating that this is the critical dose metric for the chronic effects of toluene exposure. The use of alternative data-derived dose metrics, such as peak concentrations, the time above threshold, or total cumulative dose, would all provide a different extrapolation for duration adjustments. Without knowledge of the internal dose metric, PBPK-based approaches are likely to be no more scientifically justified than the standard default approach to duration adjustments (i.e., 5 days/7 days or 6 hours/24 hours).
d) Uncertainty Factors, Section 5.2.3: Have the appropriate uncertainty factors been applied? Is the explanation for each transparent?
Comment: Four of the seven reviewers indicated the appropriate uncertainty factors had been applied and that the explanation for applying a single uncertainty factor for intraspecies susceptibility was clear and sufficient. Other comments on the choice of uncertainty factors suggested that uncertainty factors are subject to scientific judgement.
Response: No response necessary.
3) Cancer Weight-of-Evidence Classification: The weight of evidence and cancer characterization are discussed in Section 4.6. Have appropriate criteria been applied from the 1999 EPA Draft Revised Guidelines for Carcinogen Assessment (Review Draft, NCEA-F-0644,
A2-12
July 1999. Risk Assessment Forum)? Is the statement that “data are inadequate for an assessment of the human carcinogenic potential” correct?
Comment: Six of the seven reviewers agreed that the appropriate criteria have been applied and the correct conclusion drawn that the data are inadequate for an assessment of human carcinogenic potential for toluene. One reviewer suggested the use of the term “insufficient” rather than “inadequate” to describe the human carcinogenic potential of toluene and the additional description that “all animal studies as well as human epidemiological surveys performed so far have not clearly demonstrated a carcinogenic effect.”
Response: The characterization that data are inadequate for assessment of the human carcinogenic potential of toluene has been retained according to the available weight-of-evidence characterizations outlined in the 1999 Draft Revised Guidelines for Carcinogen Risk Assessment (U.S. EPA, 1999). The recommended additions to the text, however, have been added to Section 4.6.1 of the Toxicological Review. Note: Following the release of the 2005 Guidelines for Carcinogen Risk Assessment, the reference was updated to U.S. EPA (2005).
Scientific Comments from the Public
(Note that a number of comments from the public were similar to the comments from external peer reviewers. A summary of the comments with responses is included below; however, please refer to the above comments and responses to the external peer reviewers for more detailed responses.)
Comment: One reviewer stated that the available health endpoints (e.g., immunotoxicity and kidney toxicity endpoints) considered for the derivation of the RfD are questionable as the available science does not substantiate a plausible mechanism of toxicity.
Response: Kidney toxicity, specifically an increase in kidney weight, has been retained as the critical effect for the derivation of a chronic oral RfD. Animals exposed at high doses exhibited frank kidney toxicity. In addition, case reports of human exposure to toluene at abusive doses indicate renal toxicity. Information indicating potential modes of action of renal toxicity are discussed in Section 4.5.3 of the Toxicological Review. Potential immunotoxic effects are noted based on several studies at doses lower than those used for the point of departure. An uncertainty factor of 3 for database insufficiency has been applied to the point of departure, in part, due to
A2-13
the uncertainty surrounding immunotoxic effects and the possibility that a more complete study of these effects would yield a lower RfD as discussed in Sections 5.1.1, 5.1.2, and 5.1.3 of the Toxicological Review.
Comment: One reviewer indicated the use of the Zavalic et al. (1998a) study as the principal study for the derivation of the RfC was not the most sensitive study available and provided examples of several studies showing effects at lower doses. In addition, this reviewer indicated the proposed RfC lacks congruency with the ACGIH TLV of 50 ppm for worker exposure. Another reviewer stated that the Zavalic et al. (1998a) study contained incidences of inconsistent data reporting and, as such, should not be relied upon for the derivation of the RfC. In addition, it was stated that the use of the color confusion index as a critical effect is questionable as no plausible linkage exists between the endpoint and an adverse health effect in humans. This reviewer suggested a weight-of-evidence approach that would likely reduce the uncertainty factors applicable to the point of departure. This reviewer also suggested that the uncertainty factor for human variability would only be necessary if there was a reliance on a single study for the derivation of the RfC.
Response: The Zavalic et al. (1998a) study is no longer used as the principal study for the derivation of the RfC. An argument can be made against choosing any of the available human studies as a single principal study due to potentially equal confounding factors in all of the studies. A more holistic approach is now used to determine the critical effect and point of departure. This approach is plausible for determining a chronic reference value for toluene as a number of available occupational studies are low dose studies with NOAELs and LOAELs that fall within a somewhat defined range of exposure doses for each (i.e., NOAELs and LOAELs). The use of this approach, as used for toluene, may not be scientifically defensible for all chemical health assessments. The critical effect has been changed from alterations in color vision to neurological effects to better reflect the database. Alterations in color vision constitute one of the effects noted within this database.
After adjustments for human exposure conditions, the point of departure for the RfC has changed to 46 mg/m3. Application of an uncertainty factor of 10 yields an RfC of 5 mg/m3 with rounding to one significant figure. This value is considerably less than the value derived previously and represents the data set available for human exposure to toluene as a whole. An uncertainty factor of 10 to account for human variability has been retained. No data are available
A2-14
concerning human variability, and the approach is based solely on occupational studies. Refer to Sections 5.2.1, 5.2.2, and 5.2.3 of the Toxicological Review for more detailed information.
Comment: One reviewer indicated the proposed RfC for toluene may not be protective of children’s health. The reviewer specifically cited disagreement with the Pelekis et al. (2001) paper, indicating that the use of an uncertainty factor of 10 will adequately protect children.
Response: The text in Section 5.2.3 of the Toxicological Review cites the Pelekis et al. (2001) study in reference to the use of a 10-fold uncertainty factor for intraspecies uncertainty. It is stated in the text that the Pelekis model is based solely on the pharmakokinetic differences between adults and children. Statements are made that the model does not address variations in the adult population or potential pharmacodynamic differences. Discussion of this model is included for completeness. A full 10-fold uncertainty factor is retained for intraspecies variation.
A2-15
Appendix B1. Benchmark Dose Modeling Results for the Derivation of the RfD (NTP, 1990)
Benchmark dose (BMD) modeling was performed to determine the point of departure for the derivation of the RfD for toluene. The modeling was conducted according to draft EPA guidelines (U.S. EPA, 2000) using Benchmark Dose Software (BMDS, Version 1.3) available from the U.S. EPA (2001). The BMD modeling results are summarized in Table B-1, and the model outputs are attached. A brief discussion of the modeling results is presented below.
Changes in rat kidney weight were modeled from the NTP (1990) study. Male rat kidney data were chosen for BMD modeling as these data exhibited a greater response than that seen in female rats. Data from the high dose group (2500 mg/kg) were eliminated since only 2/10 rats survived. Absolute kidney weights were used because the maximum tolerated dose was exceeded at the high dose. The endpoint selected is a continuous variable; therefore, the continuous models available with the BMDS software (linear, polynomial [including quadratic], power, and Hill) were used. The Hybrid model software in BMDS is still undergoing beta-testing, and was not used because it was not considered sufficiently validated for use in quantitative dose-response assessment. (Note: The hybrid modeling approach defines the benchmark response [BMR] in terms of change in the mean.) The modeling was conducted for a BMR defined as a 1.0 standard deviation (SD) change in the control mean. This BMR definition was selected in the absence of clear biological rationale for selecting an alternative response level (U.S EPA, 2000).
The BMDL estimates for the endpoint of increased kidney weight are presented for the linear, quadratic, and power models in Table B-1. The Hill model failed to give adequate goodness-of-fit p-values for the model fits and did not provide any adequate BMDL estimates. The goodness-of-fit p-values varied widely for the other models. The only values that were adequate (using a value of p=0.1) were for the models with the restrictions of rho=0. An analysis of the model fit (lowest maximum chi-square-residual) in the low dose region (region of the BMDLs) indicated that some models better fit the data in this region. The Akaike Information Criterion (AIC) was similar for the models.
The model selected for this endpoint was the quadratic model with rho=0, over the linear and power models with rho=0. The linear model with rho=0 has a larger chi-square-residual (0.333) than the quadratic model with rho=0 (0.084) and the power model with rho=0 (0.019), and, subsequently, does not fit the data at the low dose range as well as the quadratic and power
B1-1
models. The AIC value for the quadratic model with rho=0 (410.5) is higher than that for the linear model with rho=0 (409.1) and lower than the power model with rho=0 (412.5), but these differences are not significant. Of the three models discussed, the linear model with rho=0 does not fit the data as well as the other two models at the low dose range, and the power model with rho=0 has the highest AIC value. Therefore, the quadratic model with rho=0 is the most useful model for the kidney weight data and provides an estimated point of departure at 238 mg/kg-day at one standard deviation. This corresponds to the lower bound on the dose associated with a 10% increase in individuals having a kidney weight greater than the 98th percentile of kidney weights in the control group. This SD corresponds to 9% increase in kidney weight from control.
Dependent variable = MEAN Independent variable = Dose rho is set to 0 Signs of the polynomial coefficients are not restricted A constant variance model is fit
Total number of dose groups = 5 Total number of records with missing values = 1 Maximum number of iterations = 1000 Relative Function Convergence has been set to: 1e-008 Parameter Convergence has been set to: 1e-008
fitted -202.250763 3 410.501527 R -212.606673 2 429.213345
Test 1: Does response and/or variances differ among doselevels
(A2 vs. R) Test 2: Are Variances Homogeneous (A1 vs A2) Test 3: Does the Model for the Mean Fit (A1 vs. fitted)
Tests of Interest
Test -2*log(Likelihood Ratio) Test df p-value
Test 1 30.2173 6 <.0001 Test 2 9.49329 3 0.0234 Test 3 0.0121647 1 0.9122
The p-value for Test 1 is less than .05. There appearsto be adifference between response and/or variances among thedose levels.It seems appropriate to model the data
The p-value for Test 2 is less than .05. Considerrunning a non-homogeneous variance model
The p-value for Test 3 is greater than .05. The modelchosen appears to adequately describe the data
Benchmark Dose ComputationSpecified effect = 1
Risk Type = Estimated standard deviations from the control mean
Dependent variable = MEAN Independent variable = Dose Signs of the polynomial coefficients are not restricted The variance is to be modeled as Var(i) = alpha*mean(i)^rho
Total number of dose groups = 5 Total number of records with missing values = 1 Maximum number of iterations = 1000 Relative Function Convergence has been set to: 1e-008 Parameter Convergence has been set to: 1e-008
fitted -201.467874 4 410.935749 R -212.606673 2 429.213345
Explanation of Tests
Test 1: Does response and/or variances differ among Doselevels?
(A2 vs. R) Test 2: Are Variances Homogeneous? (A1 vs A2) Test 3: Are variances adequately modeled? (A2 vs. A3) Test 4: Does the Model for the Mean Fit? (A3 vs. fitted)
Tests of Interest
Test -2*log(Likelihood Ratio) Test df p-value
Test 1 30.2173 6 <.0001 Test 2 9.49329 3 0.0234 Test 3 1190.25 2 <.0001 Test 4 -1182.31 2 <.0001
The p-value for Test 1 is less than .05. There appearsto be adifference between response and/or variances among thedose levelsIt seems appropriate to model the data
The p-value for Test 2 is less than .05. Anon-homogeneous variance model appears to be appropriate
The p-value for Test 3 is less than .05. You may wantto consider a different variance model
The p-value for Test 4 is less than .05. You may wantto try a different model
B1-8
Benchmark Dose ComputationSpecified effect = 1
Risk Type = Estimated standard deviations from the control mean
Confidence level = 0.95
BMD = 464.141
BMDL = 320.11
BMDL computation failed for one or more point on the BMDL curve.
Dependent variable = MEAN Independent variable = Dose rho is set to 0 The polynomial coefficients are restricted to be positive A constant variance model is fit
Total number of dose groups = 5 Total number of records with missing values = 1 Maximum number of iterations = 1000 Relative Function Convergence has been set to: 1e-008 Parameter Convergence has been set to: 1e-008
fitted -202.554337 2 409.108675 R -212.606673 2 429.213345
Test 1: Does response and/or variances differ among doselevels
(A2 vs. R) Test 2: Are Variances Homogeneous (A1 vs A2) Test 3: Does the Model for the Mean Fit (A1 vs. fitted)
Tests of Interest
Test -2*log(Likelihood Ratio) Test df p-value
Test 1 30.2173 6 <.0001 Test 2 9.49329 3 0.0234 Test 3 0.619313 2 0.7337
The p-value for Test 1 is less than .05. There appearsto be adifference between response and/or variances among thedose levels.It seems appropriate to model the data
The p-value for Test 2 is less than .05. Considerrunning a non-homogeneous variance model
The p-value for Test 3 is greater than .05. The modelchosen appears to adequately describe the data
Benchmark Dose ComputationSpecified effect = 1
Risk Type = Estimated standard deviations from the control mean
Dependent variable = MEAN Independent variable = Dose Signs of the polynomial coefficients are not restricted The variance is to be modeled as Var(i) = alpha*mean(i)^rho
Total number of dose groups = 5 Total number of records with missing values = 1 Maximum number of iterations = 1000 Relative Function Convergence has been set to: 1e-008 Parameter Convergence has been set to: 1e-008
fitted -201.467856 5 412.935712 R -212.606673 2 429.213345
Explanation of Tests
Test 1: Does response and/or variances differ among Doselevels?
(A2 vs. R) Test 2: Are Variances Homogeneous? (A1 vs A2) Test 3: Are variances adequately modeled? (A2 vs. A3) Test 4: Does the Model for the Mean Fit? (A3 vs. fitted)
Tests of Interest
Test -2*log(Likelihood Ratio) Test df p-value
Test 1 30.2173 6 <.0001 Test 2 9.49329 3 0.0234 Test 3 1190.25 2 <.0001 Test 4 -1182.31 1 <.0001
The p-value for Test 1 is less than .05. There appearsto be adifference between response and/or variances among thedose levelsIt seems appropriate to model the data
The p-value for Test 2 is less than .05. Anon-homogeneous variance model appears to be appropriate
The p-value for Test 3 is less than .05. You may wantto consider a different variance model
The p-value for Test 4 is less than .05. You may wantto try a different model
Benchmark Dose ComputationSpecified effect = 1
Risk Type = Estimated standard deviations from the control mean
Confidence level = 0.95
BMD = 464.11
BMDL = 320.109
BMDL computation failed for one or more point on the BMDL curve.
Male kidney power model std dev =1 free parms ~~~~~~~~~~~~~~~~~~~~~~~~~~~~~~~~~~~~~~~~~~~~~~~~~~~~~~~~~~~~~~~~~~~~~
The form of the response function is:
Y[dose] = control + slope * dose^power
Dependent variable = MEAN Independent variable = Dose The power is not restricted The variance is to be modeled as Var(i) = alpha*mean(i)^rho
Total number of dose groups = 5 Total number of records with missing values = 1 Maximum number of iterations = 1000 Relative Function Convergence has been set to: 1e-008 Parameter Convergence has been set to: 1e-008
fitted -199.320949 5 408.641898 R -212.606673 2 429.213345
Explanation of Tests
Test 1: Does response and/or variances differ among Dose levels? (A2 vs. R)
Test 2: Are Variances Homogeneous? (A1 vs A2) Test 3: Are variances adequately modeled? (A2 vs. A3) Test 4: Does the Model for the Mean Fit? (A3 vs. fitted)
Tests of Interest
Test -2*log(Likelihood Ratio) d.f p-value
Test 1 30.2173 6 3.574e-005 Test 2 9.49329 3 0.0234 Test 3 38.8958 2 <.00001 Test 4 -35.25 1 <.00001
The p-value for Test 1 is less than .05. There appears to be adifference between response and/or variances among the dose levelsIt seems appropriate to model the data
The p-value for Test 2 is less than .05. A non-homogeneous variance model appears to be appropriate
The p-value for Test 3 is less than .05. You may want to consider a different variance model
The p-value for Test 4 is less than .05. You may want to try a different model
Benchmark Dose ComputationSpecified effect = 1
B1-18
Risk Type = Estimated standard deviations from the control mean
Confidence level = 0.95
BMD = 47.7706
Warning: optimum may not have been found. Bad completion code in Optimizationroutine.Warning: optimum may not have been found. Bad completion code in Optimizationroutine.
BMDL computation failed.
B1-19
1050
1100
1150
1200
1250
1300
1350
1400
Mea
n R
espo
nse
BMD
Power
Power Model
0 200 400 600 800 1000 1200
dose23:38 09/02 2003
B1-20
==================================================================== Power Model. $Revision: 2.1 $ $Date: 2000/10/11 20:57:36 $ Input Data File: C:\DOCUMENTS AND SETTINGS\AMARCUS\MY
DOCUMENTS\IRIS\TOLUENE\TOLUENE_NTP_TABLE4.(d) Gnuplot Plotting File: C:\DOCUMENTS AND SETTINGS\AMARCUS\MY
Male kidney power model std dev =1 parms rho==0 ~~~~~~~~~~~~~~~~~~~~~~~~~~~~~~~~~~~~~~~~~~~~~~~~~~~~~~~~~~~~~~~~~~~~~
The form of the response function is:
Y[dose] = control + slope * dose^power
Dependent variable = MEAN Independent variable = Dose rho is set to 0 The power is not restricted A constant variance model is fit
Total number of dose groups = 5 Total number of records with missing values = 1 Maximum number of iterations = 1000 Relative Function Convergence has been set to: 1e-008 Parameter Convergence has been set to: 1e-008
fitted -202.249668 4 412.499336 R -212.606673 2 429.213345
Test 1: Does response and/or variances differ among dose levels (A2 vs. R)
Test 2: Are Variances Homogeneous (A1 vs A2) Test 3: Does the Model for the Mean Fit (A1 vs. fitted)
Tests of Interest
Test -2*log(Likelihood Ratio) df p-value
Test 1 30.2173 6 <.00001 Test 2 9.49329 3 0.0234 Test 3 0.00997428 1 0.9204
The p-value for Test 1 is less than .05. There appears to be adifference between response and/or variances among the dose levels.It seems appropriate to model the data
The p-value for Test 2 is less than .05. Consider running a non-homogeneous variance model
The p-value for Test 3 is greater than .05. The model chosen appears to adequately describe the data
Benchmark Dose ComputationSpecified effect = 1
Risk Type = Estimated standard deviations from the control mean
Confidence level = 0.95
BMD = 418.374
BMDL = 107.032
B1-22
Appendix B2. Benchmark Dose Modeling Results for the Derivation of the RfD (Selected Immunotoxicity Studies)
Modeling Strategy Data on a number of immunotoxicity indicators in four papers cited in this document
(Hsieh et al., 1989, 1990b, 1991; Burns et al., 1994) were determined to be suitable for BMD analyses. The endpoints were continuous measurements, so the continuous model features in the BMDS version 1.3 software (U.S. EPA, 2001) were appropriate for estimating the BMD and BMD lower 95% confidence limits (BMDL). In the absence of information on the level of immunotoxic response to consider adverse, a change in the mean equal to one standard deviation from the control mean was used to determine potential BMRs according to the U.S. EPA Benchmark Dose Technical Document Guidance (U.S. EPA, 2000c). For comparison purposes, BMDL values for a change in the mean of 0.5 and two standard deviations are also presented. Four dose-response functions are offered in BMDS version 1.3.2:
1. Polynomial 2. Linear (a special case of polynomial) 3. Power 4. Hill
The Hill function has up to four parameters (unknown constants) to be estimated from the data, so it is necessary to have at least four distinct dose groups, usually the control group and three or more groups with positive exposure levels. The endpoints described below met this requirement.
The BMDS software also assumes a specific formula for the variance (square of the standard deviation) of the within-dose-group variance of the endpoints (Eq B-2.1),
variance within dose group = alpha * (mean within dose group) rho
(Equation B-2.1)
where alpha and rho are additional parameters to be estimated from the data, apart from the parameters of the dose-response model. Although it is commonly assumed that the variance is the same within each dose group (rho = 0), this hypothesis failed statistical hypothesis tests in many of the analyses reported here. More detailed examination of the data found that the
B2-1
coefficient of variation, defined by
coefficient of variation within dose group = (standard deviation within dose group)/(mean within dose group) (Equation B-2.2)
was often nearly constant at all dose levels and all levels of mean response within an endpoint. A constant coefficient of variation in Eq B-2.2 is equivalent to rho = 2 in Eq B-2.1. This would occur if the endpoints had a log-normal distribution within a dose group, with a constant geometric standard deviation across all dose groups. The within-group sample size N is too small, N = 5 in Hsieh et al. (1989, 1990b, 1991) to evaluate this hypothesis definitively. We therefore conducted sensitivity analyses in all of the models with the following alternatives:
• Rho estimated from the data • Rho = 0 for the same variability across responses within each dose level of the endpoint • Rho = 2 for the same variability across the logarithm of the responses within each dose • Level of the endpoint (i.e., the same coefficient of variation)
These alternatives had an effect, sometimes substantial, on the goodness of fit of the model to the data and on the magnitude of the BMDL estimate that reflects data variability.
In all cases evaluated here, the estimates of rho were substantially larger than zero, even when they were not statistically different from zero. The typical range was rho = 1.5 to 3.0.
Initial runs using the four BMDS dose-response functions found that the best estimate of the power or exponent n in the power function and Hill models was often much less than one, typically in the range 0.5 to 0.7. We therefore also conducted sensitivity analyses using n = 0.5 or in some cases n = 0.7 to evaluate the effect of assuming a sub-linear dose-response.
The best-fitting models were judged according to criteria in the BMDS guidance:
• Convergent estimate for BMDL • Acceptable p-value for overall goodness of fit of mean values (hypothesis H4) • Lowest Akaike Information Criterion (AIC) • Smallest chi-squared residuals for deviations, especially near the BMDL
B2-2
• Adequate model for variances (hypothesis H3)
Results for Hsieh et al. (1989)
The basic suite of models evaluated for all endpoints is given in Table B2-1. The endpoints given in the different papers do not all lend themselves to BMD analyses. Almost all of the endpoints in Hsieh et al. (1989) present results (mean response ± standard error) at toluene doses of 0, 5, 22, and 105 mg/kg-day, corresponding to actual TWA concentrations of 0, 17, 80, and 405 mg/L from nominal design concentrations of 0, 20, 100, and 500 mg/L, respectively. This is the number of dose levels required to fit all of the models with enough degrees of freedom left to provide statistical tests of the goodness of fit of the model to the data, except for the Hill model with all four parameters estimated from the data. The results are shown in Tables B2-2 and B2-3 for the endpoints of greatest relevance to assessing immunotoxicity:
• Mixed lymphocyte response (MLR) (Figure 1 from Hsieh et al., 1989) - Responders indicating thymidine incorporation into splenic cells alone - Responders and stimulators indicating thymidine incorporation into splenic cells when splenocytes were cocultured with mitomycin C-treated YAC-1 cells
• Antibody plaque-forming cell (PFC) responses (Table 4 from Hsieh et al., 1989) - PFC per million splenocytes - PFC per total splenic cells
• Interleukin-2 (IL-2) assays (Table 5 from Hsieh et al., 1989) - Thymidine uptake - Stimulation index - IL-2 activity
The simplest models usually provided acceptable p-values for model goodness-of-fit (H4).
Combining Data from Hsieh et al. (1989, 1990b, 1991)
The same team of investigators published results from two additional studies with many of the same endpoints as described in the 1989 paper. However, the additional studies were done to assess the effects of toluene and benzene jointly and separately, using only a single concentration for each chemical. Hsieh et al. (1990b) exposed male CD-1 mice to 325 mgL toluene (actual
B2-3
TWA concentration from design concentration of 400 mg/L), either alone or with co-exposure to 166 mg/L benzene. In Hsieh et al. (1991), the toluene concentration was 80 mg/L from a design concentration of 100 mg/L. Each experiment had an independent control study. However, no information was provided giving the estimated dose on a mg/kg-day basis. No BMDL estimates similar to those reported above for the 1989 paper could be derived. The published results were assessed to see if they were sufficiently similar across common endpoints in the three studies to allow the data to be combined into an eight-group five-dose data set for BMDS analyses: three control means, one at 17 mg/L, two at 80 mg/L, and one each at 325 and 405 mg/L.
The first step was to derive a calibration of the dose-to-concentration relationship for the Hsieh et al. (1989) paper. There was a virtually perfect linear relationship, which was estimated from the data in Hsieh et al. (1989), using several different linear regression approaches:
• Simple linear regression, with or without intercepts • Inverse-variance weighted linear regression • Log dose vs. log concentration linear regression
All of these methods gave virtually identical estimates of a dose of about 84.5 mg/kg-day for an actual concentration of 325 mg/L in Hsieh et al. (1990b) and a dose of 22 mg/kg-day for an actual concentration of 80 mg/L in Hsieh et al. (1991).
The estimated effects of most of the endpoints showed considerable heterogeneity across these experiments, and their combined analyses are not shown here. Two endpoints with a reasonable degree of similarity across the experiments were IL-2 thymidine uptake and IL-2 stimulation. The results for the eight-group analyses combining IL-2 data from Hsieh et al. (1989,1990b) are shown in Table B2-4, along with the four-group analyses in Tables B2-2 and B2-3. Benchmark responses (percent of control mean) were calculated for each endpoint as shown in Table B2-5.
B2-4
Table B2-1. Results of BMDS analyses from Hsieh et al. (1989) study with maximum p for hypothesis 4, goodness of fit of means
Endpoint Model n Rho P for H4 AIC
BMDL, mg/kg-day
BMR, control standard deviations
0.5 1.0 2.0
MLC responders Linear 1 2 0.9863 54.95 73
MLC responders & stimulators
Quadratic 1 2 0.5328 58.58 3.23 6.60 13.8
PFC / million splenocytes
Linear 0.5 0 0.5977 233.3 1.62 7.04 26
PFC per total spleen cells
Linear a 1 2 0.2533 467.6 26 a 69 a 105 a
IL2 thymidine uptake
Linear 0.5 2 0.9803 75.17 6.76 27 108
IL-2 Stimulation Linear 0.5 2 0.9790 82.82 6.75 27 108
IL-2 Activity Quadratic 1 2 0.9898 -16.05 17.2
a BMDL estimated from power function with exponent = 1.
B2-5
Table B2-2. Results of BMDS analyses from Hsieh et al. (1989) study with minimum AIC for hypothesis 4 goodness of fit
a BMDL estimated from power function model with exponent = 1.
B2-6
Table B2-3. Results of BMDS analyses from Hsieh et al. (1989, 1990b) study with maximum p for hypothesis 4, goodness of fit of means
Endpoint Model n Rho P for H4 AIC Max. Resid. At
BMD mg/kg
day BMDL
Results from Hsieh et al. (1989) with four dose groups
IL-2 thymidine uptake
Linear 0.5 2 0.9803 75.17 0.273 22 53 27
IL-2 stimulation
Linear 0.5 2 0.9790 82.82 0.277 22 53 27
Results from Hsieh et al. (1990b) eight groups, five dose levels
IL-2 thymidine uptake
Linear 1 0 0.9642 143.2 0.773 0 66 45
IL-2 stimulation
Linear 0.5 0 0.9625 160.6 -0.733 0 43 19.5
B2-7
Table B2-4. Benchmark responses for the endpoints reported in Hsieh et al. (1989)
Endpoint Control mean Control
standard deviation
BMR (percent of control mean)
0.5 SD 1.0 SDa 2.0 SD
PFC per million splenocytes
1184 201.25 8.5 17.0 34.0
PFC per spleen 238545 83694 17.5 35.1 70.1
IL-2 thymidine uptake
12.95 4.43 17.1 34.2 68.4
IL-2 stimulation index
15.7 5.34 17.0 34.0 68.0
IL-2 activity 1.08 0.49 22.7 45.4 90.8
MLC responders 2:1 R:S
5.37 2.35 21.8 43.7 87.4
MLC responders & stimulators 2:1 R:S
28.9 10.4 18.0 36.0 72.0
a Control coefficient of variation = 100 times control standard deviation (SD) divided by control mean. Most endpoints had nearly constant coefficient of variation at all dose levels for that endpoint.
B2-8
Table B2-5. Basic sensitivity analyses for BMDS results
Model Dose Metric Exponent n Rho
Linear Dosea 1 estimated, 2, 0
Square root of doseb 0.5 estimated, 2, 0
Quadratic Dose 1 estimated, 2, 0
Square root of dose 0.5 estimated, 2, 0
Power Dose estimated estimated, 2, 0
1a estimated, 2, 0
0.5b estimated, 2, 0
Hill Dose estimated estimated, 2, 0
1 estimated, 2, 0
0.5 estimated, 2, 0 a Same model with exponent n = 1. b Same model with exponent n = 0.5.