24
Tom Kompas Crawford of Economics and Government Australian National University

Tom KompasCrawford of Economics and Government
Australian National University

The Global Problem in WildThe Global Problem in Wild--Capture Capture FisheriesFisheries
• Overfishing and overcapacity, or ‘too many boats chasing too few fish’.
• Many fish stocks under threat.• Industry profitability is low, with often a danger
of industry collapse.

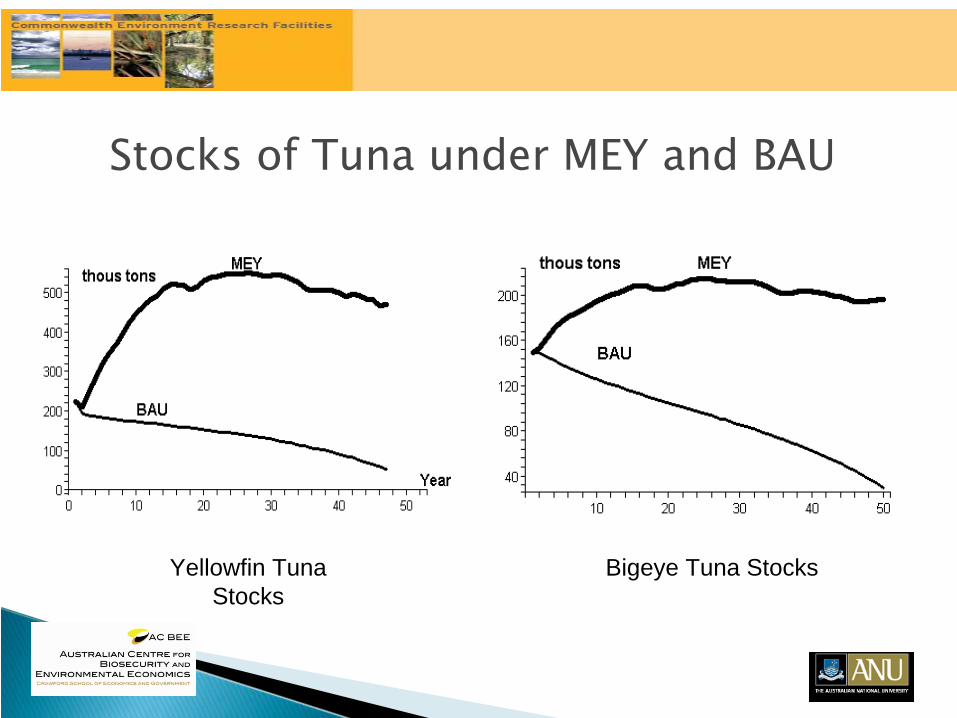
The Right Target: Maximum Economic Yield (MEY)
• MSY: A sustainable harvest level that maximizes revenue from fishing, or generates the largest value of sustainable catch in numbers of kilograms.
• MEY: A sustainable catch or effort level that creates the largest difference between (discounted) total revenues and the total costs of fishing. • For profits to be maximized it must also be the case that the fishery
applies a level of capital and other resources in combinations that minimize the costs of harvesting at the MEY catch level.

Why MEY as a target?• Maximizes fishery profits, regardless of changes in the price
of fish or cost of fishing. • Improves international competitiveness.• Resilience to economic shocks.
• ‘Conservationist’: in most cases stock size is larger than that associated with MSY.
• Provides added resilience and other environmental benefits.
• Generates a ‘win-win’ stock-effect• Lower harvests rebuild stocks, lower the costs of fishing,
and increase profitability.

Western & Central Pacific Tuna• Four key species (skipjack, yellowfin, bigeye and albacore)
and multiple fleets.• One of world’s biggest fisheries — 2.2 million metric
tonnes harvest/year with gross value of production of some $US 3 billion.
• Clear evidence of biological overfishing of bigeye and yellowfin tuna
• Growing evidence that fishery is being mismanaged with economic overfishing of bigeye and yellowfin tuna.

Net Present Value BMEY and BAU (WCPO)
Year
MEY
U$ Million
BAU
0
150
200
50
05030
300
250
100
402010

Results: Rent Drain in the WCPO• BMEY would generate a net present value of $5.4
billion (50 years at 5% discount rate) — at least $3.4 billion more than Business as Usual.
• Business as usual will cost WCPO tuna fisheries billions of dollars and will jeopardise the sustainability of yellowfin and bigeye tuna stocks.

Context and Problem
• Marine reserves as a management tool are receiving increasing attention in response to growth, recruitment and economic over-harvesting and mismanagement of marine resources.
• Despite potential benefits (population persistence, biodiversity and habitat protection, age structure & spillovers), many fishers oppose reserves and claim they do not generate an economic payoff (rather, losses in GVP and profits).

Research Results• Reserves have positive economic value under
environmental uncertainty (i.e., increase profitability), even if harvesting is optimal and probability and occurrence of negative shocks known in advance.
• Payoff arises from spillovers that increase harvest immediately after a shock and reduced recovery time: a ‘resilience effect’.
• Resource rents (compared to no reserve case) are increasing in size and frequency of negative shocks.

The Problem• Close proximity, international trade and tourism increases
the probability of an incursion and the spread of exotic diseases and pests; ones that can do great harm, and in some cases be potentially devastating to local industry, animal and human health, and the environment.
• CERF project examples: Papua Fruit Fly in Queensland, Red Imported Fire Ants in Brisbane (and beyond) and Crazy Ants on Christmas Island and in Northern Queensland (and beyond).

Traditional Measures• Pre-border measures and border quarantine (i.e.,
preventing a potential incursion at the border). • Limits on imports• Airport inspections, and inspections of shipping
containers and contents • Local surveillance programs (preventing spread in
the local environment). • Surveillance traps• Blood screening and visual inspection• Containment and eradication programs

The Puzzle• Quarantine and surveillance programs (although essential)
have been largely ad hoc and uncoordinated, and they also impose costs (border quarantine and surveillance expenditures), along with the costs of disease and pest management and eradication.
• The Puzzle: How much should be spent on border quarantine and surveillance activities to protect plant and animal health and the environment, and how to allocate resources across various threats?
• Spend $0?• Spend all of GDP?• How to allocate resources across various threats?

Research Design: Optimal Surveillance• Benefit: Surveillance ensures ‘early detection’, lowering economic and
environmental losses and pest/disease management costs.
• Tradeoff: The more early the detection the more expensive the surveillance measure.
• Objective: Find optimal surveillance expenditures to minimize:• Economic losses (e.g., plant and animal losses, damage to the
environment, recreational losses, trade bans, etc.)• Eradication and management costs of any pest/disease
incursion• Surveillance expenditures (e.g. monitoring, the cost of setting
and monitoring traps, etc.)
• Method: Stochastic Bioeconomic Model with a Jump-Diffusion Process.

Infected Animals/Area
(N)
Time
Surveillance Expenditures S(N)
Earliest Detection Earliest Detection
Earliest DetectionEarliest Detection
S(N)
E(N)Optimal Early Detection
Natural DetectionNatural Detection
Natural DetectionNatural Detection
S(N)
Local Surveillance Measures
N

Example: Papaya Fruit Fly in Australia• PPF attacks fruit and habitat, and in early stages is difficult
to detect by inspection (boarder quarantine is limited and ineffective).
• Largest risk of entry: via the Torres Strait Islands and at ports of entry.
• ‘Current’ surveillance grid: 1 trap for every 6,200 km2, 1,878 traps in total, Current Expenditures = $1,380,000 (including the program’s fixed costs).
• 1995 outbreak in QLD: $43m in eradication and management costs over a 13 month period.
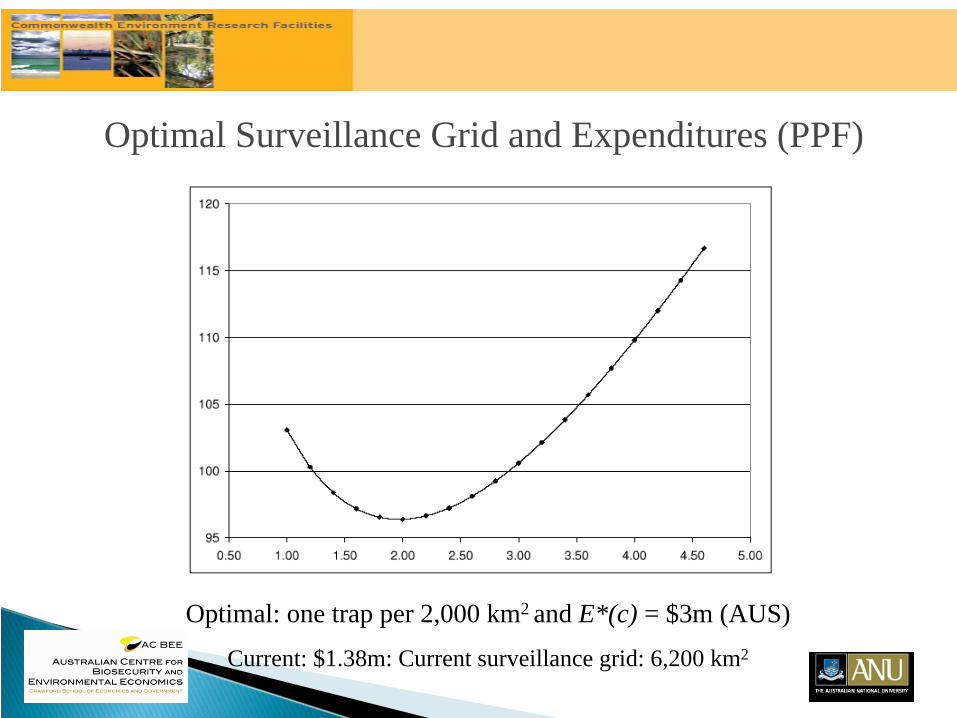
Optimal Surveillance Grid and Expenditures (PPF)
Optimal: one trap per 2,000 km2 and E*(c) = $3m (AUS)
Current: $1.38m: Current surveillance grid: 6,200 km2