19
Tom Potiowsky Office of Economic Analysis Oregon’s Economic Outlook Hotel Murano Tacoma, Washington May 15, 2008 Pacific Northwest Regional Economic Conference...since 1967
| Date post: | 15-Dec-2015 |
| Category: |
Documents |
| Upload: | shawn-fear |
| View: | 217 times |
| Download: | 0 times |
Tom Potiowsky
Office of Economic Analysis
Oregon’s Economic Outlook
Hotel Murano Tacoma, Washington
May 15, 2008
Pacific Northwest Regional Economic Conference...since 1967

Look at Oregon Economy...
Office of Economic Analysis
Recent Oregon Economy Facts … 5.7% unemployment rate for March 2008 – 10th
highest for the states. New release: March 2008 at 5.6% unemployment rate with April 2008 at 5.5%.
26th fastest job growth at 0.6% for all states for March 2008 over March 2007.
5.7% unemployment rate for March 2008 is up from the latest lowest rate of 5.0% in April 2007.
Total nonfarm employment grew 0.9% year-over-year for the 1st quarter of 2008 (preliminary data). Job losses (S.A.) for both April and March 2008.
5.8% personal income growth for 4th quarter of 2007 over 4th quarter of 2006. Annualized 4th quarter 2007 growth at 5.0%.
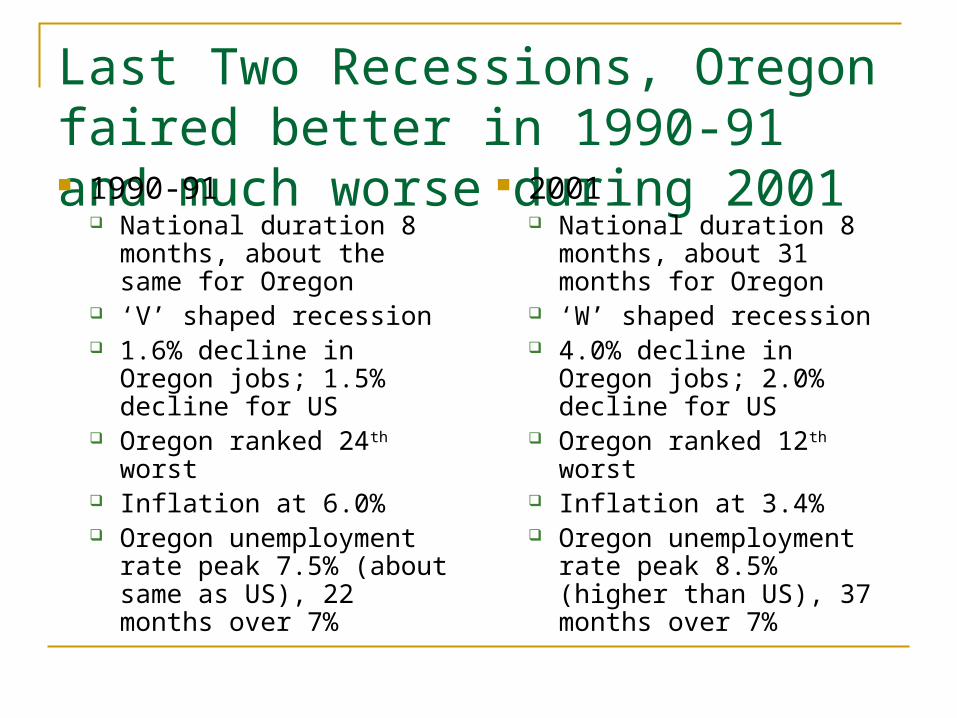
Last Two Recessions, Oregon faired better in 1990-91 and much worse during 2001 1990-91
National duration 8 months, about the same for Oregon
‘V’ shaped recession 1.6% decline in Oregon
jobs; 1.5% decline for US Oregon ranked 24th worst Inflation at 6.0% Oregon unemployment
rate peak 7.5% (about same as US), 22 months over 7%
2001 National duration 8
months, about 31 months for Oregon
‘W’ shaped recession 4.0% decline in Oregon
jobs; 2.0% decline for US Oregon ranked 12th worst Inflation at 3.4% Oregon unemployment
rate peak 8.5% (higher than US), 37 months over 7%
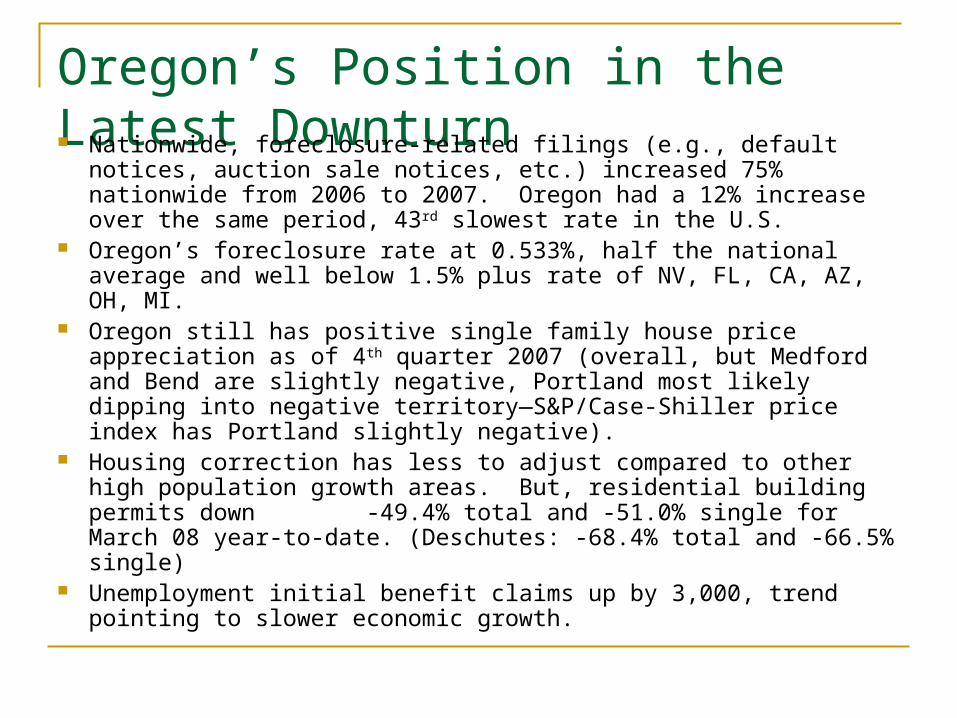
Oregon’s Position in the Latest Downturn Nationwide, foreclosure-related filings (e.g., default notices, auction
sale notices, etc.) increased 75% nationwide from 2006 to 2007. Oregon had a 12% increase over the same period, 43rd slowest rate in the U.S.
Oregon’s foreclosure rate at 0.533%, half the national average and well below 1.5% plus rate of NV, FL, CA, AZ, OH, MI.
Oregon still has positive single family house price appreciation as of 4th quarter 2007 (overall, but Medford and Bend are slightly negative, Portland most likely dipping into negative territory—S&P/Case-Shiller price index has Portland slightly negative).
Housing correction has less to adjust compared to other high population growth areas. But, residential building permits down -49.4% total and -51.0% single for March 08 year-to-date. (Deschutes: -68.4% total and -66.5% single)
Unemployment initial benefit claims up by 3,000, trend pointing to slower economic growth.
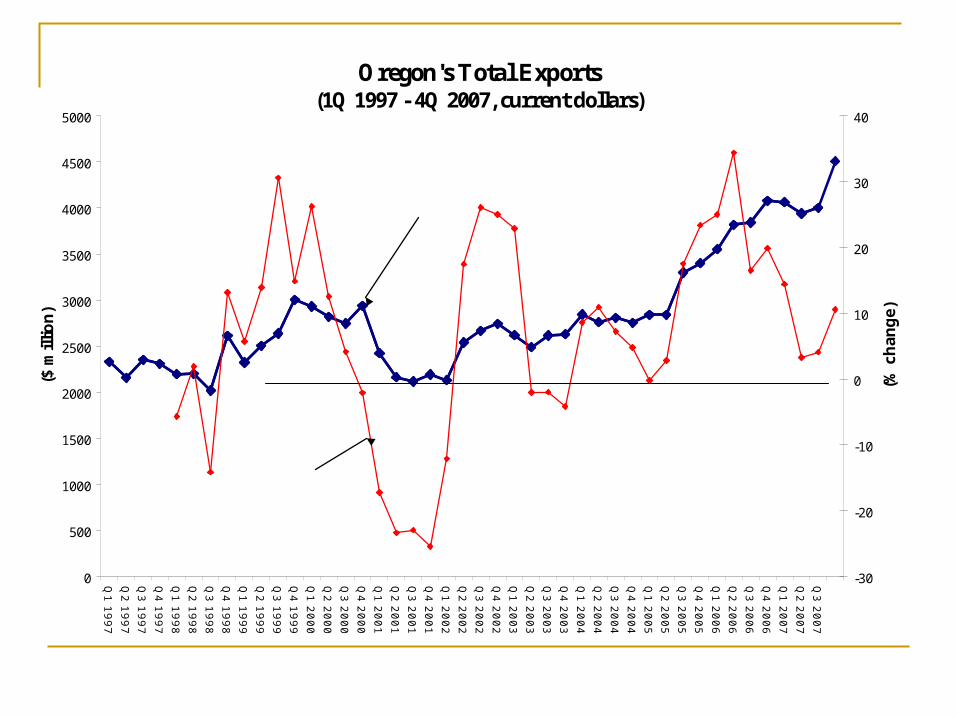
Oregon's Total Exports (1Q 1997 - 4Q 2007, current dollars)
0
500
1000
1500
2000
2500
3000
3500
4000
4500
5000
Q1
19
97
Q2
19
97
Q3
19
97
Q4
19
97
Q1
19
98
Q2
19
98
Q3
19
98
Q4
19
98
Q1
19
99
Q2
19
99
Q3
19
99
Q4
19
99
Q1
20
00
Q2
20
00
Q3
20
00
Q4
20
00
Q1
20
01
Q2
20
01
Q3
20
01
Q4
20
01
Q1
20
02
Q2
20
02
Q3
20
02
Q4
20
02
Q1
20
03
Q2
20
03
Q3
20
03
Q4
20
03
Q1
20
04
Q2
20
04
Q3
20
04
Q4
20
04
Q1
20
05
Q2
20
05
Q3
20
05
Q4
20
05
Q1
20
06
Q2
20
06
Q3
20
06
Q4
20
06
Q1
20
07
Q2
20
07
Q3
20
07
($ m
illi
on
)
-30
-20
-10
0
10
20
30
40
(% c
ha
ng
e)
Year-over-year percent change(right scale)
Total Exports(left scale)
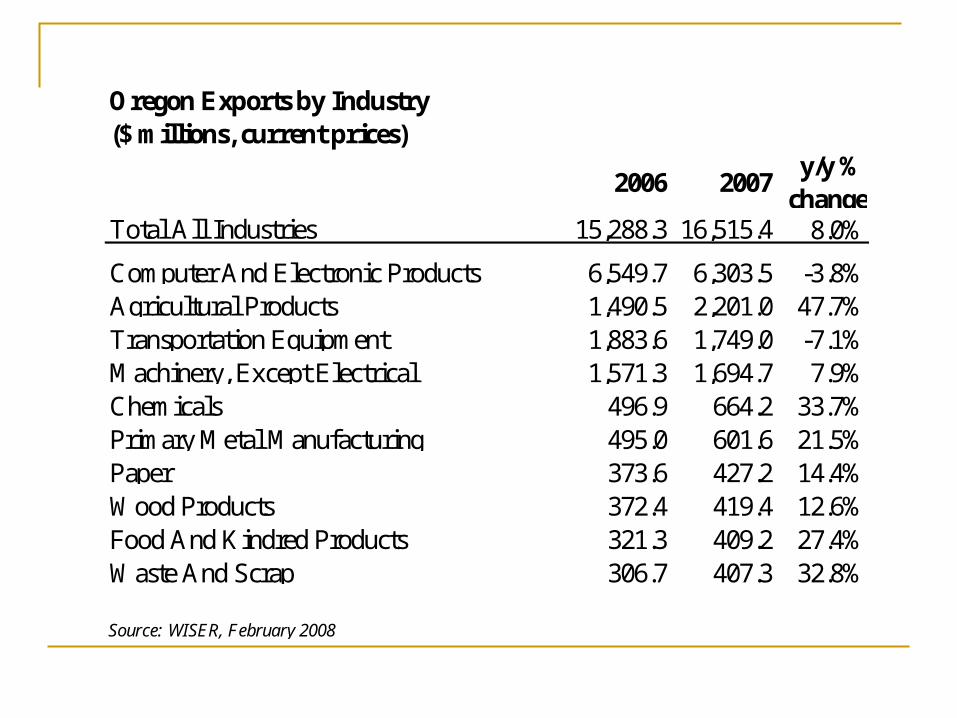
Oregon Exports by Industry($ millions, current prices)
2006 2007y/y %
changeTotal All Industries 15,288.3 16,515.4 8.0%
Computer And Electronic Products 6,549.7 6,303.5 -3.8%Agricultural Products 1,490.5 2,201.0 47.7%Transportation Equipment 1,883.6 1,749.0 -7.1%Machinery, Except Electrical 1,571.3 1,694.7 7.9%Chemicals 496.9 664.2 33.7%Primary Metal Manufacturing 495.0 601.6 21.5%Paper 373.6 427.2 14.4%Wood Products 372.4 419.4 12.6%Food And Kindred Products 321.3 409.2 27.4%Waste And Scrap 306.7 407.3 32.8%
Source: WISER, February 2008
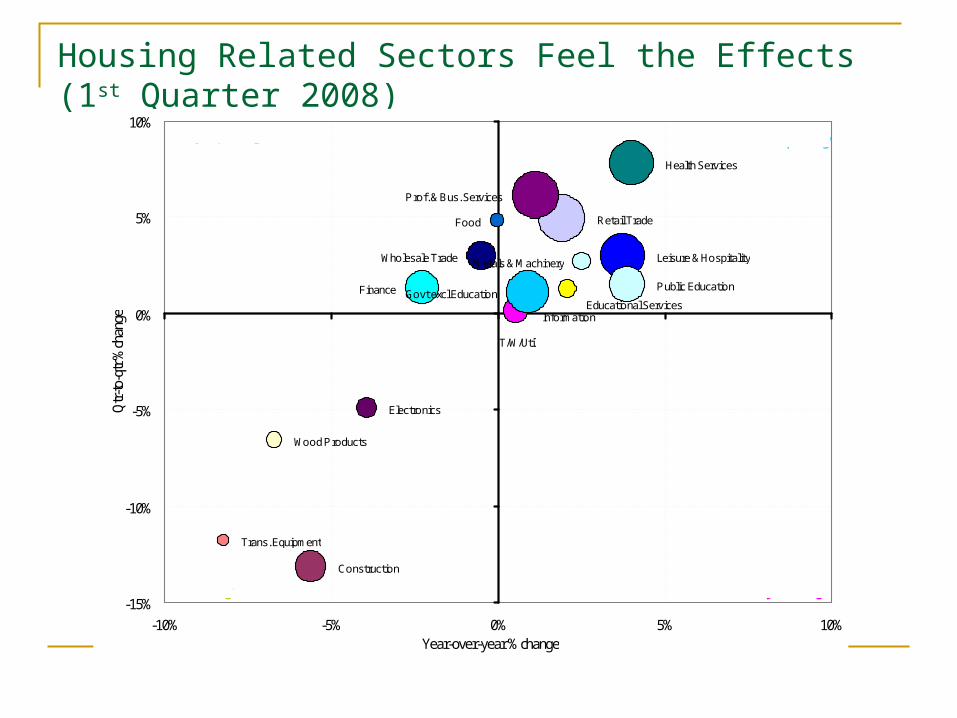
Housing Related Sectors Feel the Effects (1st Quarter 2008)
Construction
Wood Products
Metals & Machinery
Food
Wholesale Trade
T/W/Util
Information
Finance
Prof. & Bus. Services
Educational Services
Health Services
Leisure & Hospitality
Govt excl EducationPublic Education
Electronics
Trans. Equipment
Retail Trade
-15%
-10%
-5%
0%
5%
10%
-10% -5% 0% 5% 10%Year-over-year %change
Qtr-
to-q
tr %
chan
ge
Contracting Newly Slowing
Newly Expanding Expanding
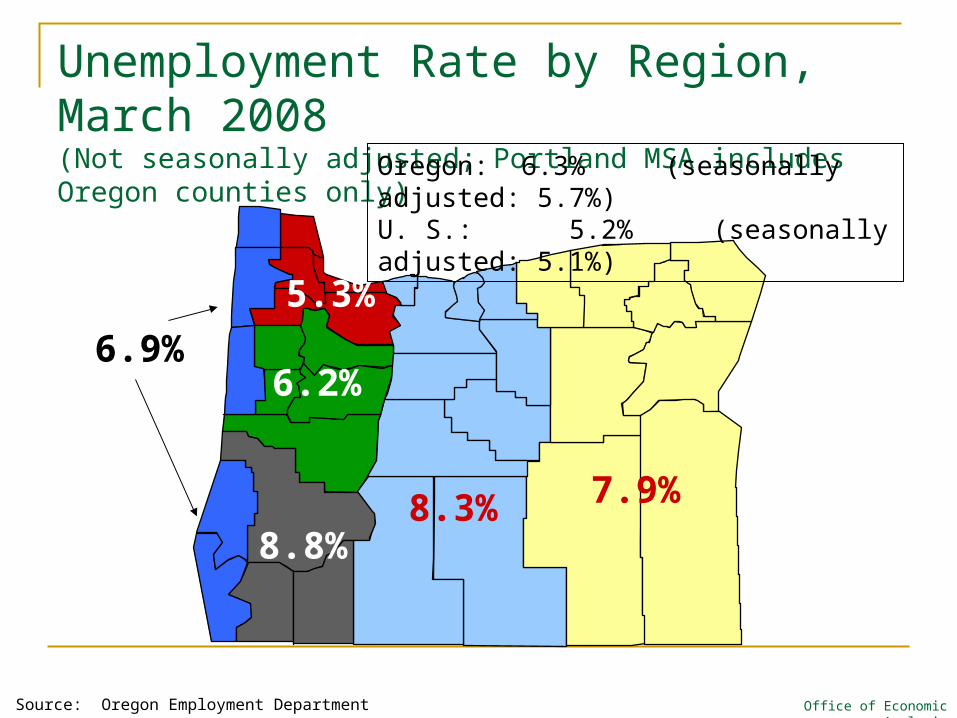
Unemployment Rate by Region, March 2008(Not seasonally adjusted; Portland MSA includes Oregon counties only)
Source: Oregon Employment Department Office of Economic Analysis
5.3%
6.2%6.9%
8.8%8.3% 7.9%
Oregon: 6.3% (seasonally adjusted: 5.7%)U. S.: 5.2% (seasonally adjusted: 5.1%)
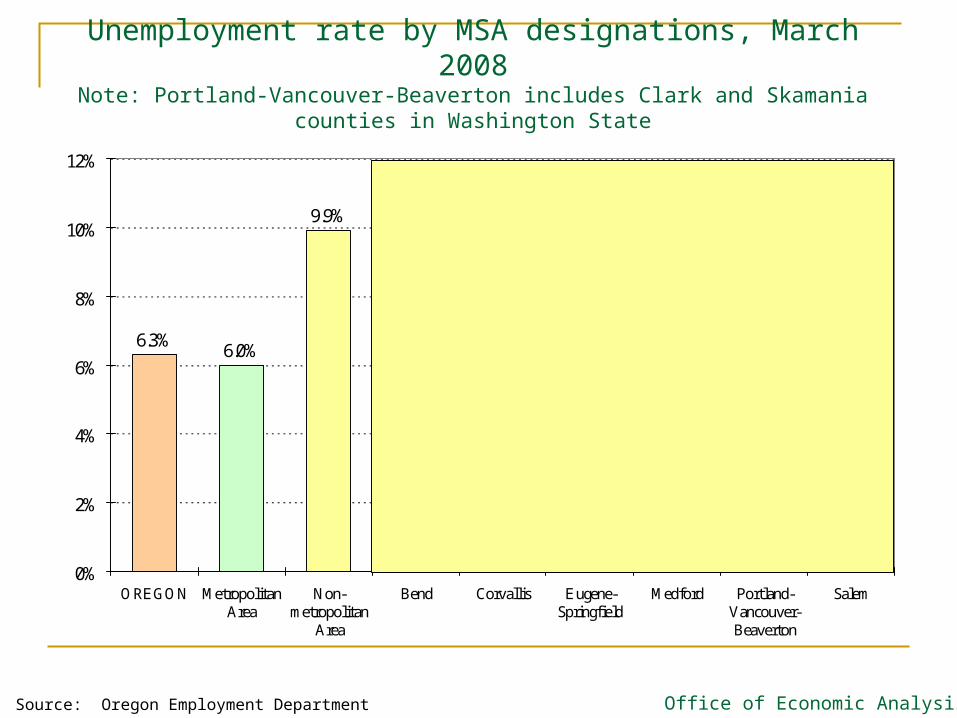
Unemployment rate by MSA designations, March 2008Note: Portland-Vancouver-Beaverton includes Clark and Skamania counties in Washington State
6.3% 6.0%
9.9%
7.9%
4.5%
6.2%
7.9%
5.6%
6.4%
0%
2%
4%
6%
8%
10%
12%
OREGON MetropolitanArea
Non-metropolitan
Area
Bend Corvallis Eugene-Springfield
Medford Portland-Vancouver-Beaverton
Salem
Metropolitan Statistical Areas
Office of Economic AnalysisSource: Oregon Employment Department
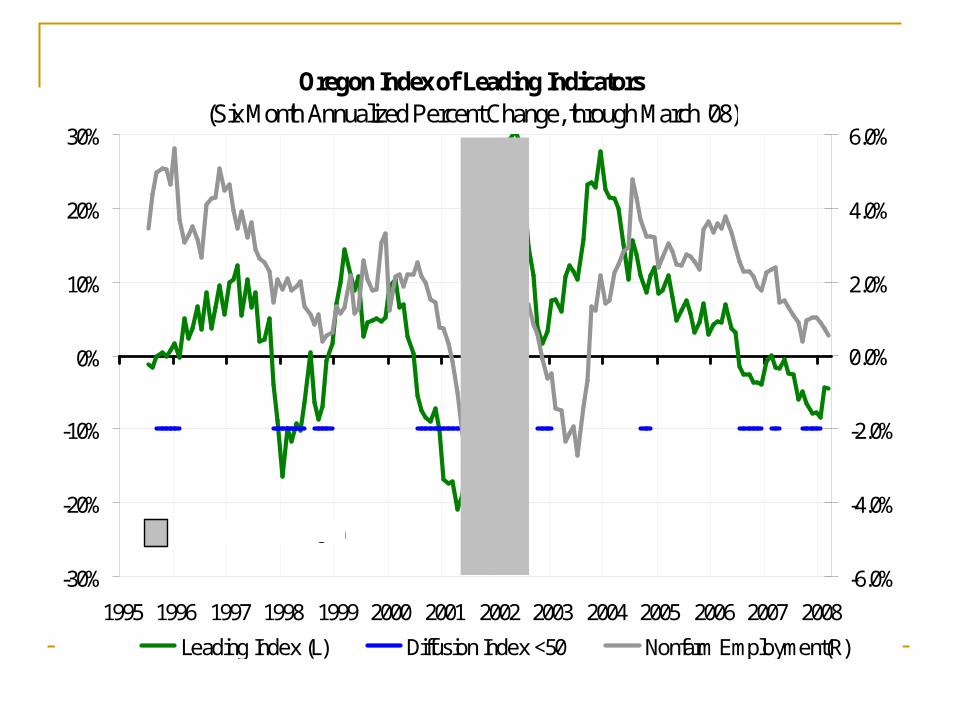
Oregon Index of Leading Indicators(Six Month Annualized Percent Change, through March '08)
-30%
-20%
-10%
0%
10%
20%
30%
1995 1996 1997 1998 1999 2000 2001 2002 2003 2004 2005 2006 2007 2008-6.0%
-4.0%
-2.0%
0.0%
2.0%
4.0%
6.0%
Leading Index (L) Diffusion Index <50 Nonfarm Employment(R)
Recession in Oregon
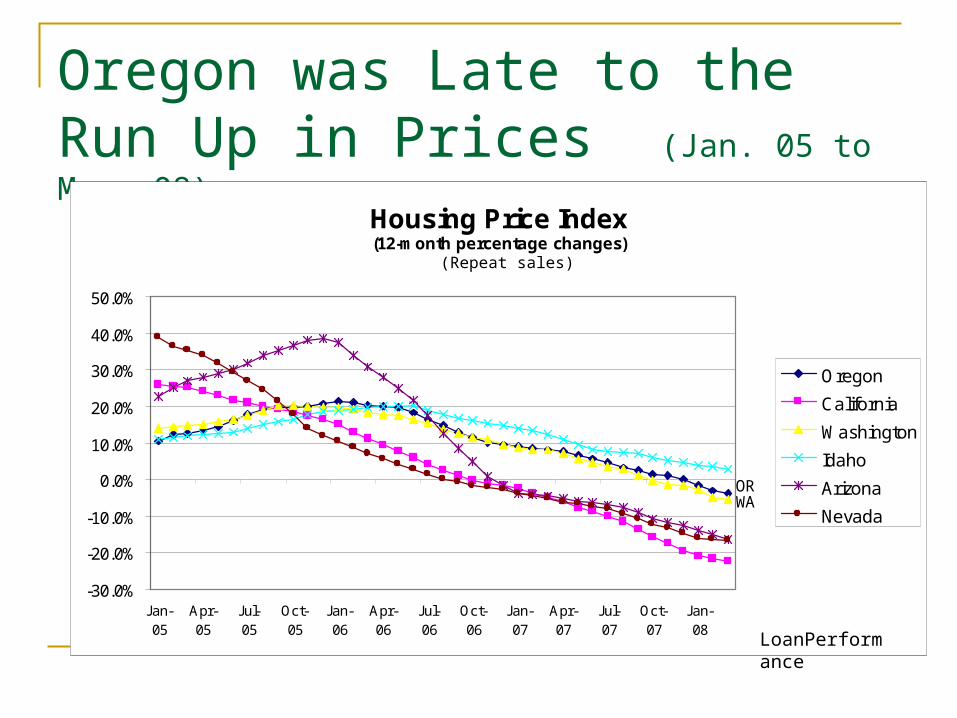
Oregon was Late to the Run Up in Prices (Jan. 05 to Mar. 08)
Housing Price Index(12-month percentage changes)
-30.0%
-20.0%
-10.0%
0.0%
10.0%
20.0%
30.0%
40.0%
50.0%
Jan-05
Apr-05
Jul-05
Oct-05
Jan-06
Apr-06
Jul-06
Oct-06
Jan-07
Apr-07
Jul-07
Oct-07
Jan-08
Oregon
California
Washington
Idaho
Arizona
Nevada
CA
NV
ID
AZ
LoanPerformance
ORWA
(Repeat sales)
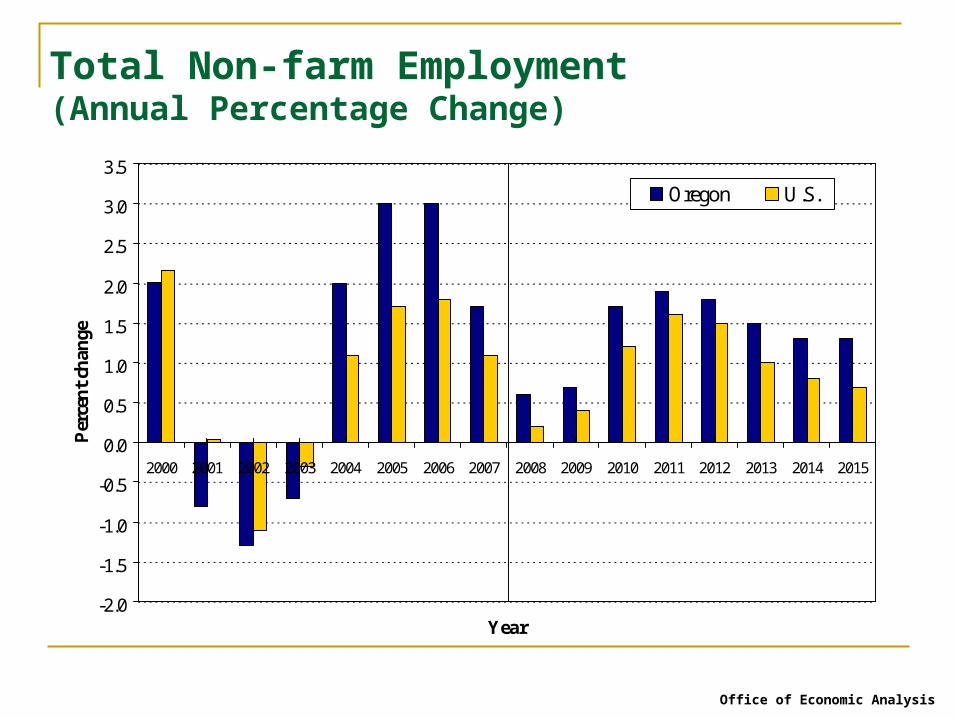
Total Non-farm Employment(Annual Percentage Change)
-2.0
-1.5
-1.0
-0.5
0.0
0.5
1.0
1.5
2.0
2.5
3.0
3.5
2000 2001 2002 2003 2004 2005 2006 2007 2008 2009 2010 2011 2012 2013 2014 2015
Year
Per
cen
t ch
ange
Oregon U.S.
Office of Economic Analysis
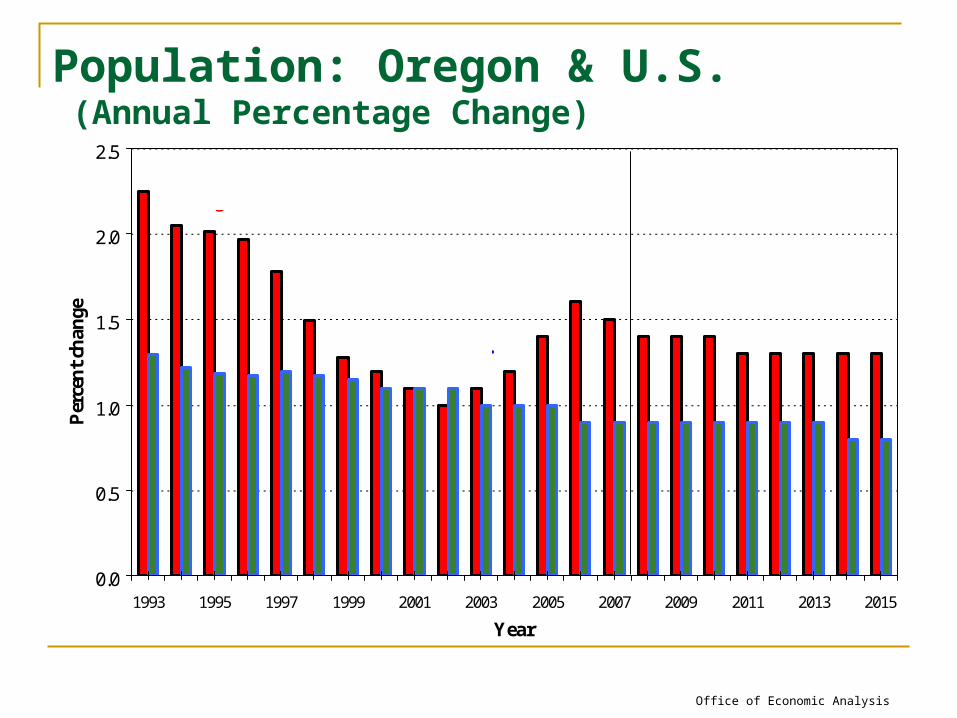
Population: Oregon & U.S. (Annual Percentage Change)
0.0
0.5
1.0
1.5
2.0
2.5
1993 1995 1997 1999 2001 2003 2005 2007 2009 2011 2013 2015
Year
Per
cen
t ch
ange
Oregon
U. S.
Office of Economic Analysis
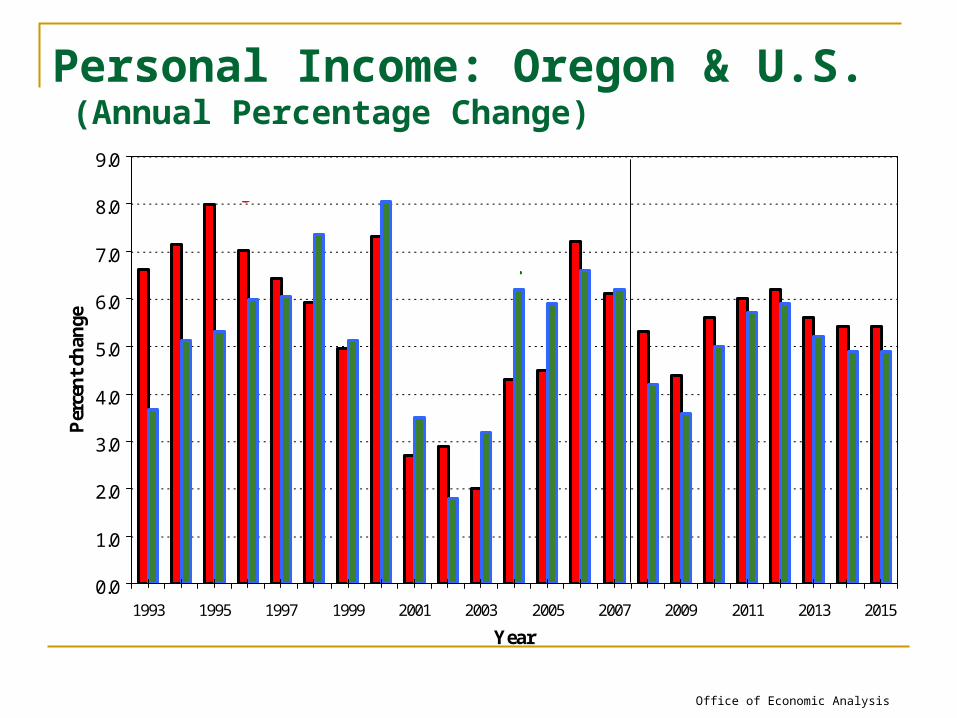
Personal Income: Oregon & U.S. (Annual Percentage Change)
0.0
1.0
2.0
3.0
4.0
5.0
6.0
7.0
8.0
9.0
1993 1995 1997 1999 2001 2003 2005 2007 2009 2011 2013 2015
Year
Per
cen
t ch
ange
Oregon
U. S.
Office of Economic Analysis
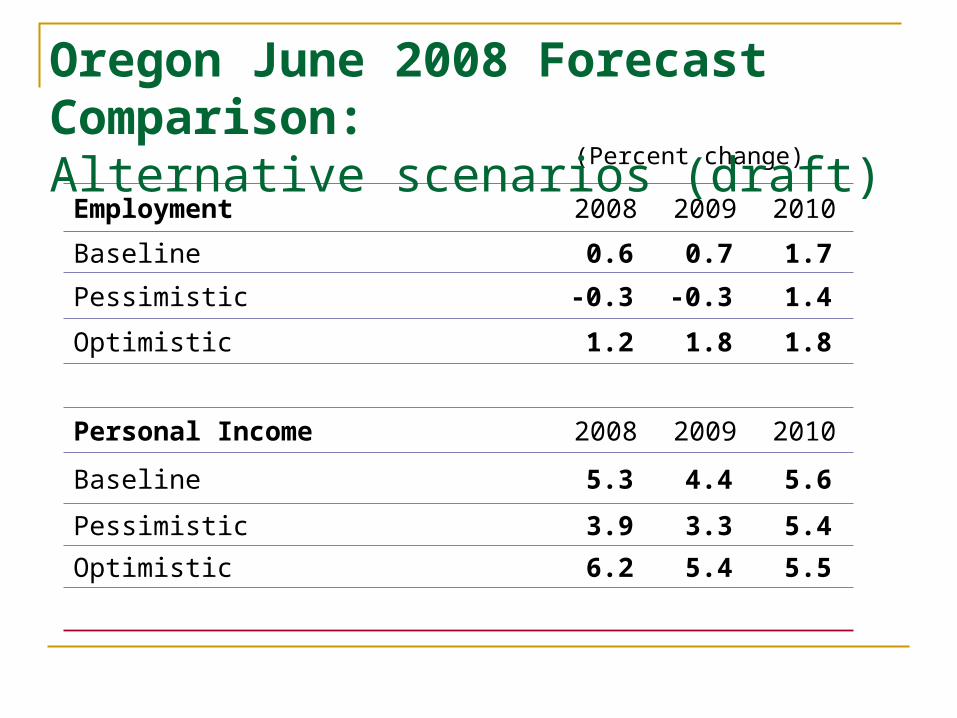
(Percent change)
Employment 2008 2009 2010
Baseline 0.6 0.7 1.7
Pessimistic -0.3 -0.3 1.4
Optimistic 1.2 1.8 1.8
Personal Income 2008 2009 2010
Baseline 5.3 4.4 5.6
Pessimistic 3.9 3.3 5.4
Optimistic 6.2 5.4 5.5
Oregon June 2008 Forecast Comparison: Alternative scenarios (draft)

Oregon Economic Assessment Going Forward … Wood Products is in terrible shape, slight help from exports, but
very depressed. Exports a sign of relief for agriculture, manufacturing, and service
sectors with overseas business. Housing starts will continue to drop this year, correction and mild
growth in 2009. House price appreciation may go negative (state-wide) but
adjustment should be quick. The drop in home prices will not be as dramatice as other “hot” markets. Expect bottom fishing of positive and negative price changes into 2009.
Job losses are possible in 2008, but may look more like 1990-91 rather than 2001.
Strong Federal Reserve cuts in rates and Fiscal Stimulus Package likely out in May will lessen the downturn.
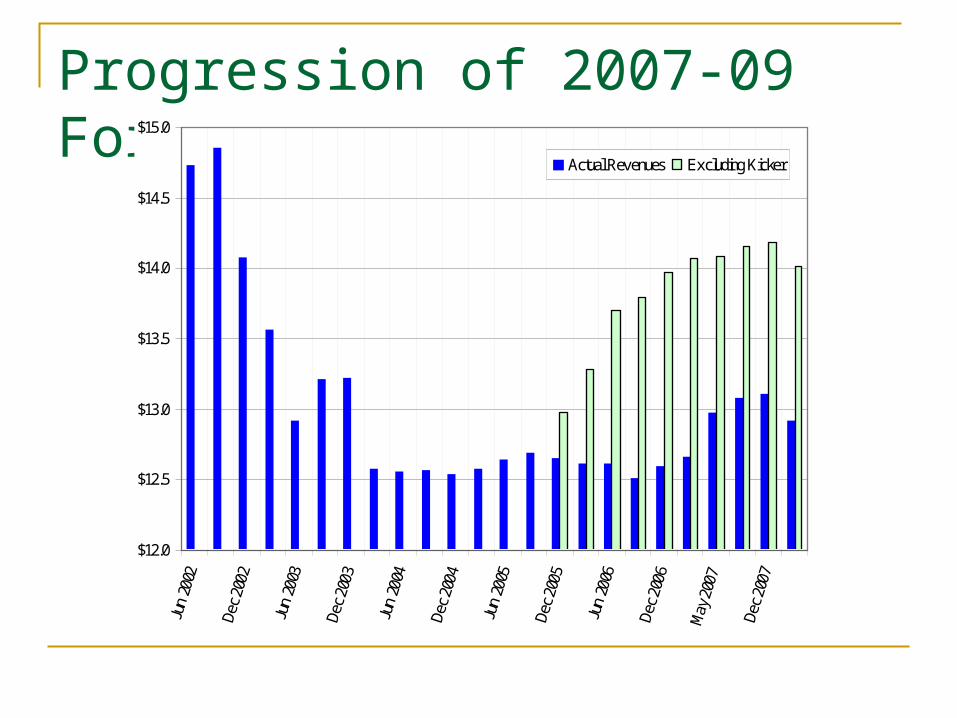
Progression of 2007-09 Forecasts ($Bil.)
$12.0
$12.5
$13.0
$13.5
$14.0
$14.5
$15.0
Jun
2002
Dec 2
002
Jun
2003
Dec 2
003
Jun
2004
Dec 2
004
Jun
2005
Dec 2
005
Jun
2006
Dec 2
006
May
200
7
Dec 2
007
Actual Revenues Excluding Kicker

Office of Economic Analysis155 Cottage Street NE, U20Salem, OR 97301-3966
(503) 378-3405
email: [email protected]://www.oea.das.state.or.us
For more information…
Office of Economic Analysis


