TOMAHAWK HYDROELECTRIC PROJECT (FERC No. 1940) FISH ENTRAINMENT MORTALITY STUDY Prepared for: WISCONSIN PUBLIC SERVICE CORPORATION Green Bay, Wisconsin Prepared by: HDR ENGINEERING, INC. Portland, Maine JULY 22, 2014
Transcript
TOMAHAWK HYDROELECTRIC PROJECT (FERC No. 1940)
FISH ENTRAINMENT MORTALITY STUDY
Prepared for: WISCONSIN PUBLIC SERVICE CORPORATION
Green Bay, Wisconsin
Prepared by: HDR ENGINEERING, INC.
Portland, Maine
JULY 22, 2014
Tomahawk Project (FERC No. 1940) Fish Entrainment Mortality Study Report i
TOMAHAWK HYDROELECTRIC PROJECT (FERC No. 1940) FISH ENTRAINMENT MORTALITY STUDY
4.1 Methodology Overview ....................................................................................... 4-1 4.2 Description of Factors Affecting Entrainment, Impingement, and Survival ....... 4-1 4.3 Intake Velocities, Trashrack Exclusion, and Impingement ................................. 4-1 4.4 Entrainment and Turbine Survival Estimation .................................................... 4-2
4.4.1 Fish Species Composition ........................................................................ 4-2 4.4.2 Empirical Entrainment Rate Data ............................................................ 4-5 4.4.3 Project Hydrology and Generation .......................................................... 4-7 4.4.4 Turbine Specifications and Fish Survival ................................................ 4-9 4.4.5 Monthly Entrainment and Survival Estimation ..................................... 4-11
5 RESULTS AND DISCUSSION ...................................................................................... 5-1
5.1 Description of Factors Affecting Entrainment, Impingement, and Survival ....... 5-1 5.2 Intake Velocities, Trashrack Exclusion, and Impingement ................................. 5-3 5.3 Entrainment and Turbine Survival Estimation .................................................... 5-6
5.3.1 Empirical Entrainment Rate Data and Fish Composition ........................ 5-6 5.3.2 Tomahawk Generation and Entrainment Estimates ............................... 5-10
Tomahawk Project (FERC No. 1940) Fish Entrainment Mortality Study Report ii
APPENDICES
APPENDIX A - FISH SPECIES COLLECTED IN THE UPPER REACH OF THE WISCONSIN RIVER
APPENDIX B - SWIM SPEED DATA
APPENDIX C - SPAWNING AND EARLY LIFE STAGE PERIODICITIES
APPENDIX D - FORTY-THREE HYDROELECTRIC PROJECTS USED IN THE ENTRAINMENT ASSESSMENT (EPRI 1997A)
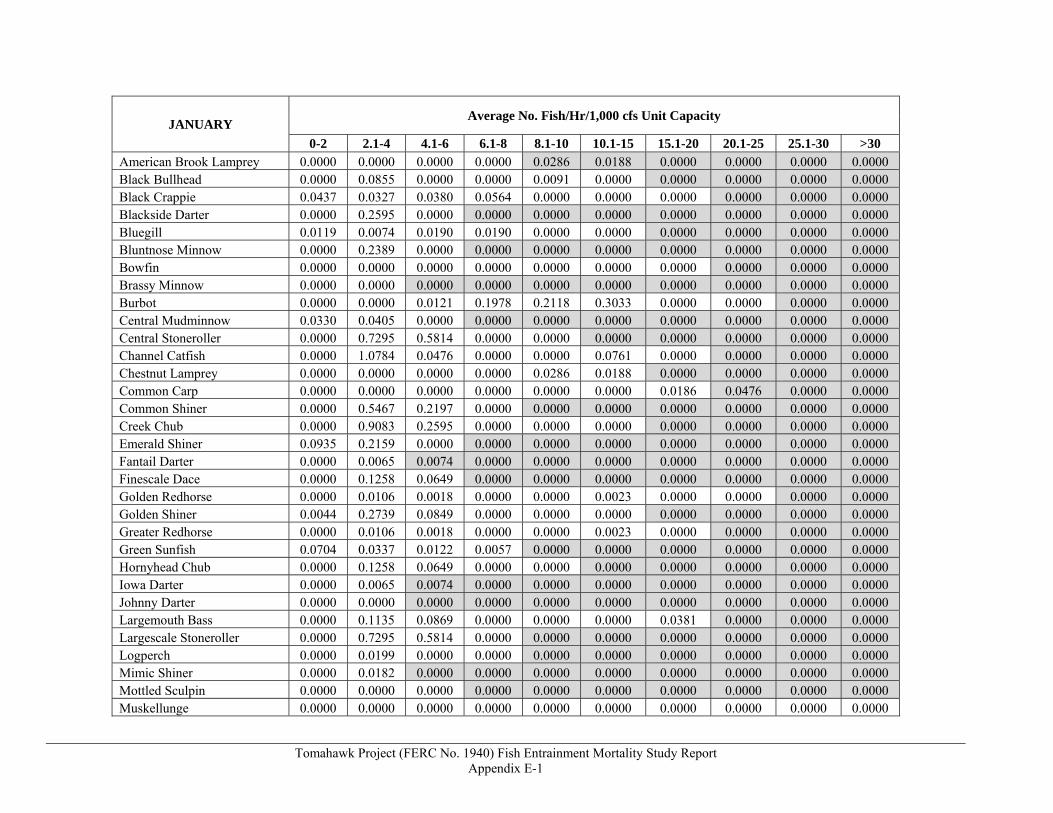
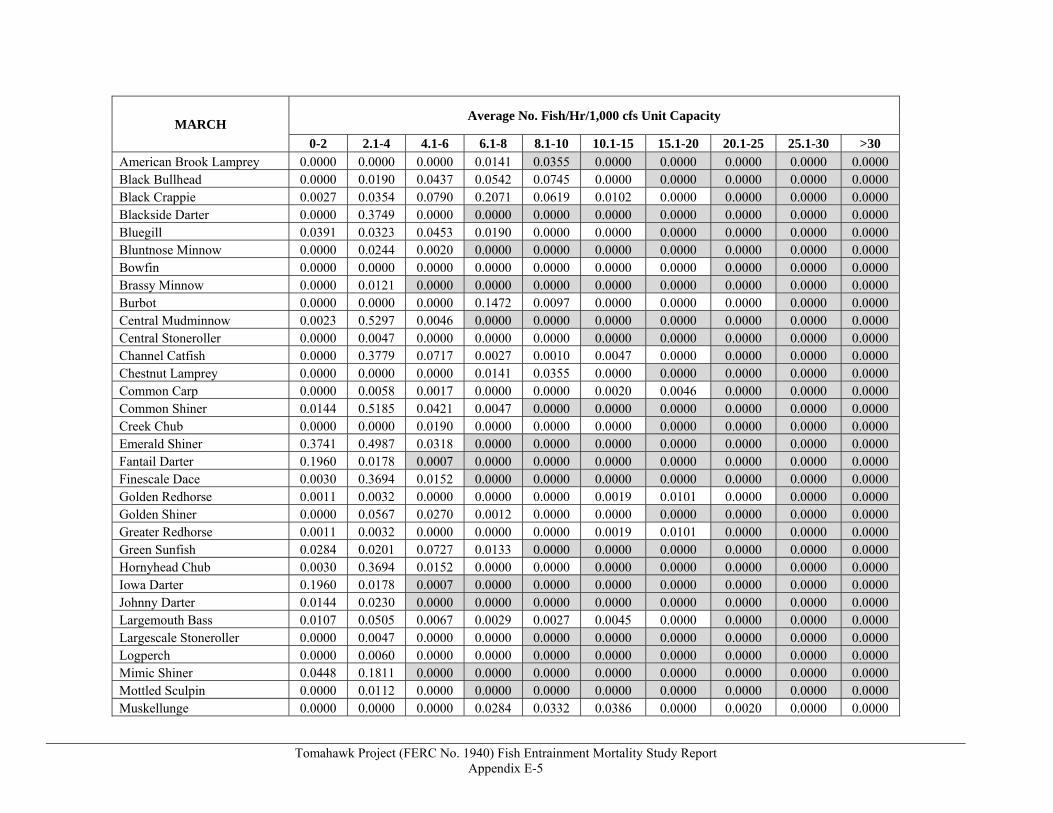
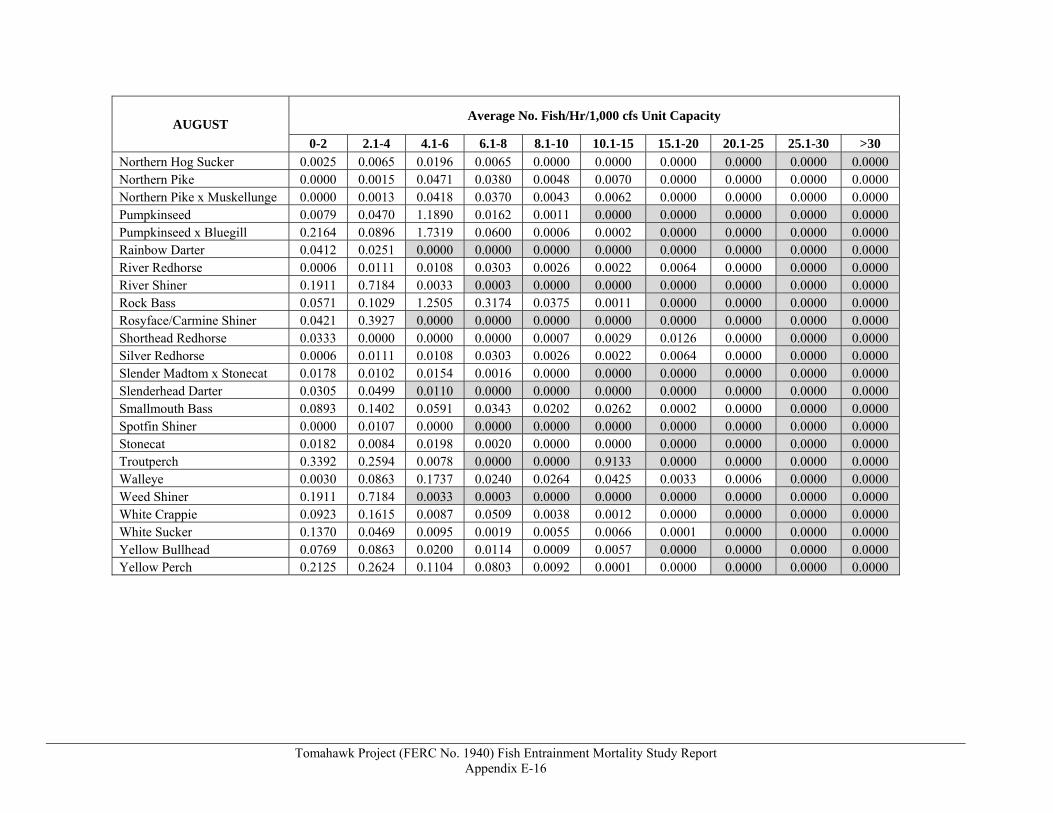
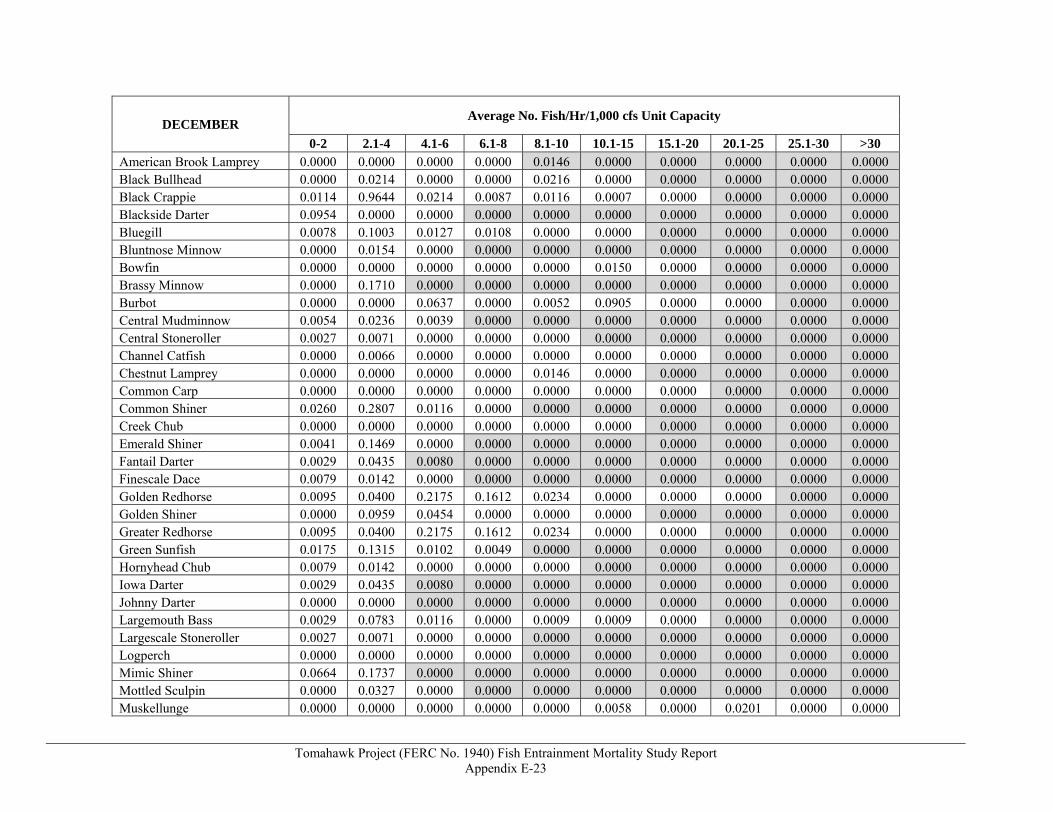
APPENDIX E - MONTHLY AVERAGE ENTRAINMENT RATES (EPRI 1997A)
APPENDIX F - FLOW ROUTING AND GENERATION AMOUNTS
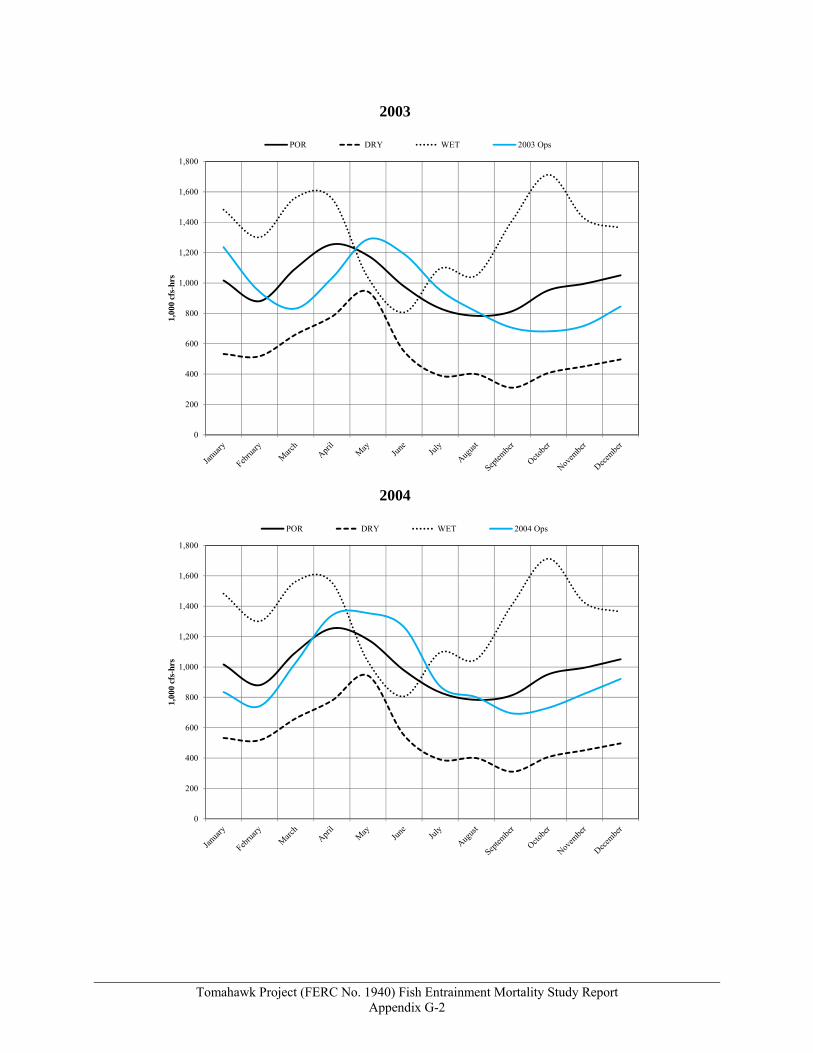
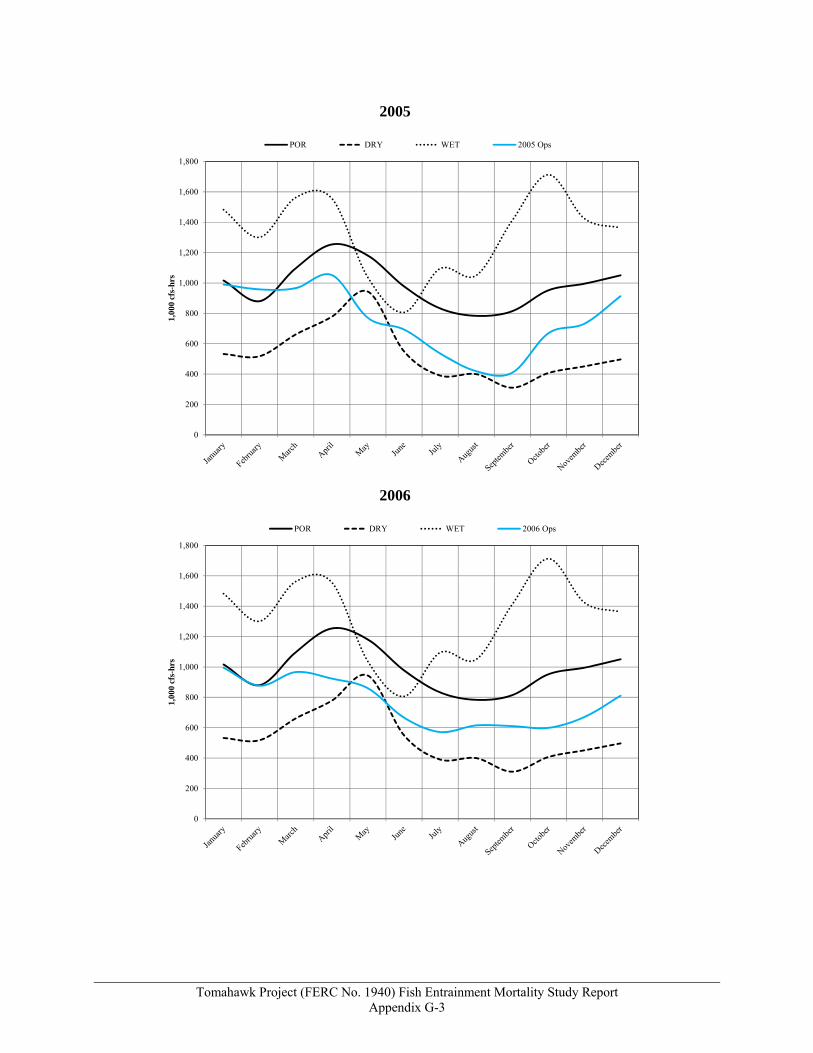
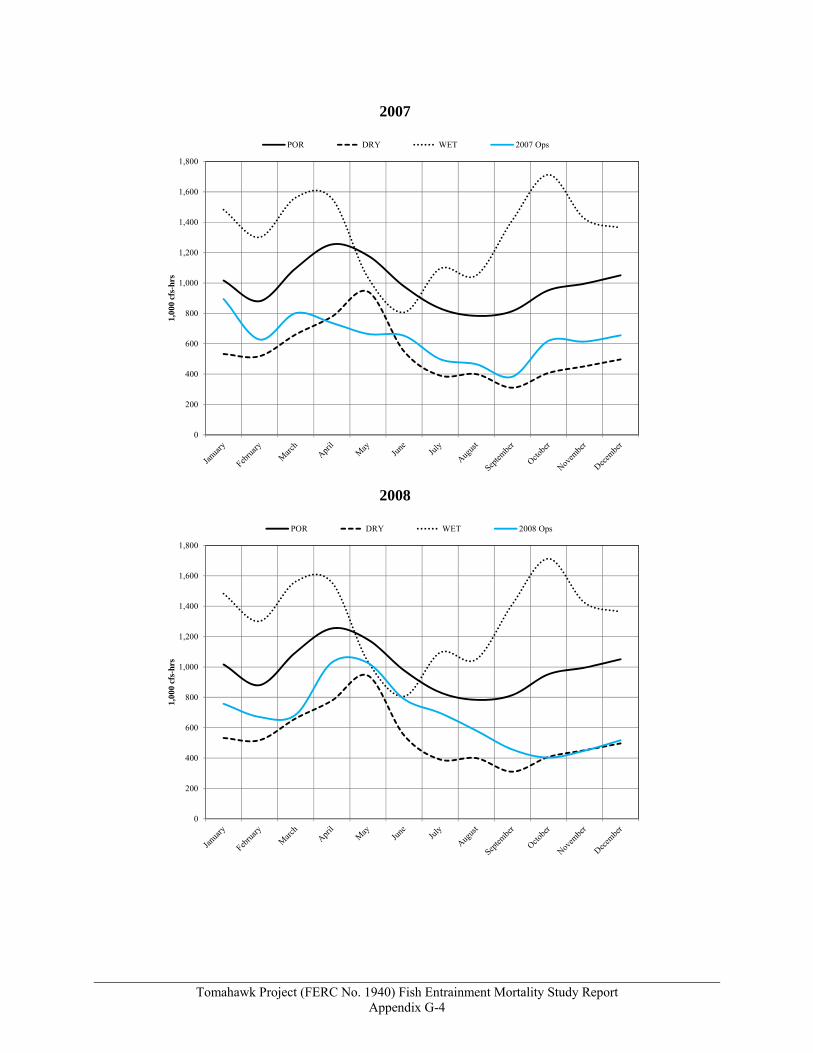
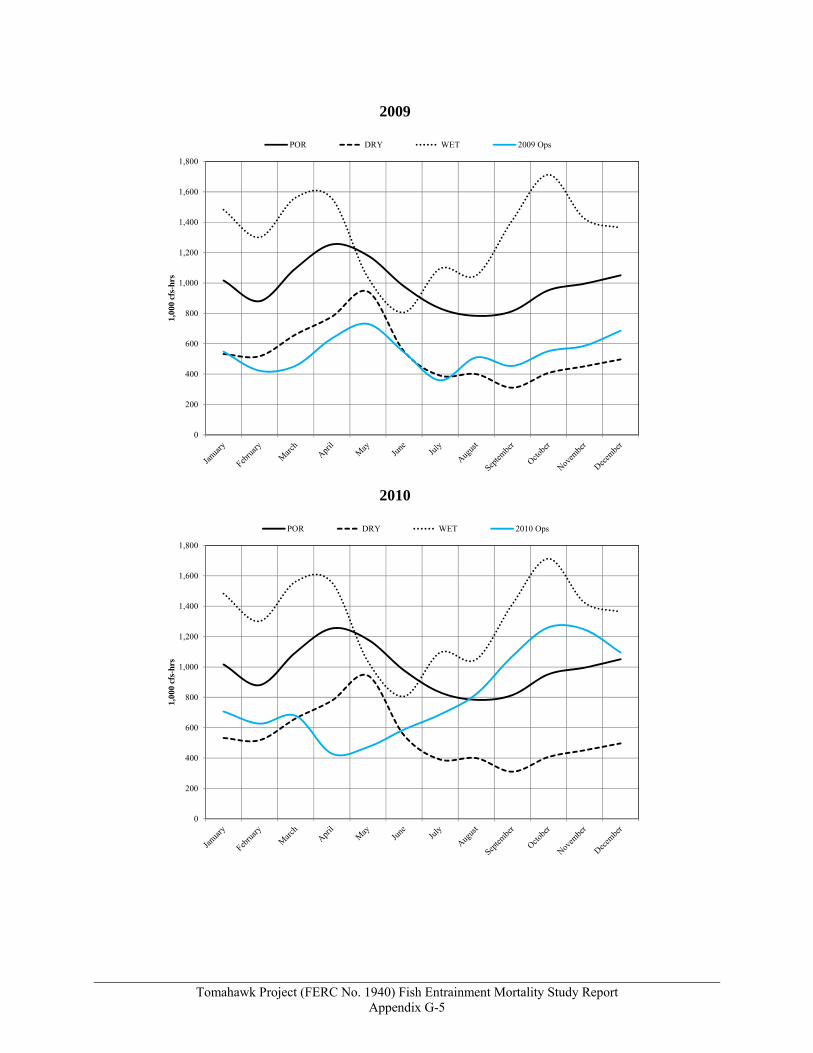
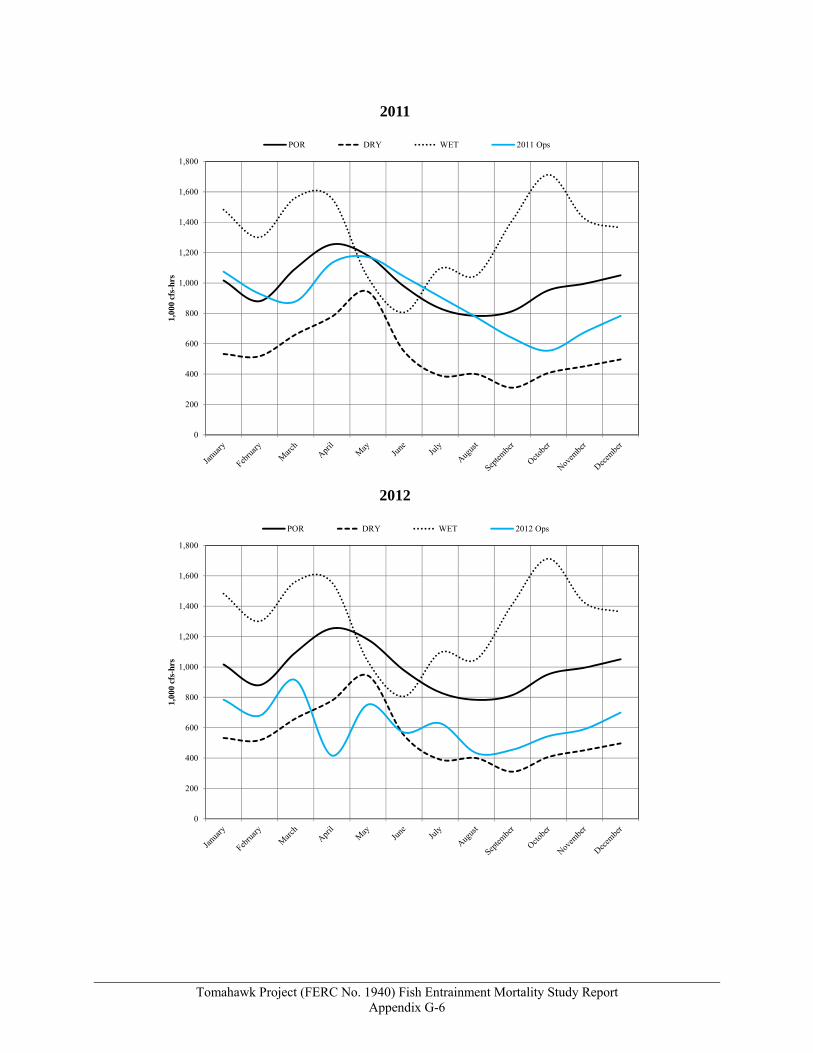
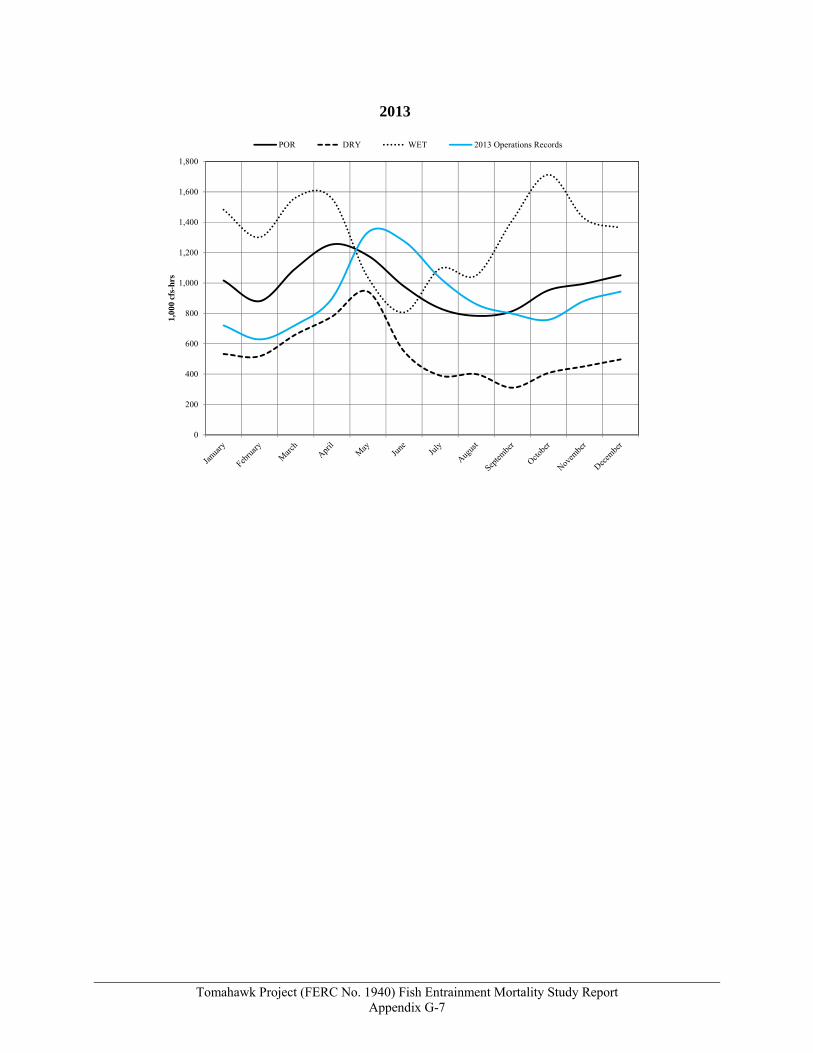
APPENDIX G - ESTIMATED GENERATION FOR THE POR, DRY, AND WET WATER YEARS AND TOMAHAWK OPERATIONS RECORDS FROM 2001-2013
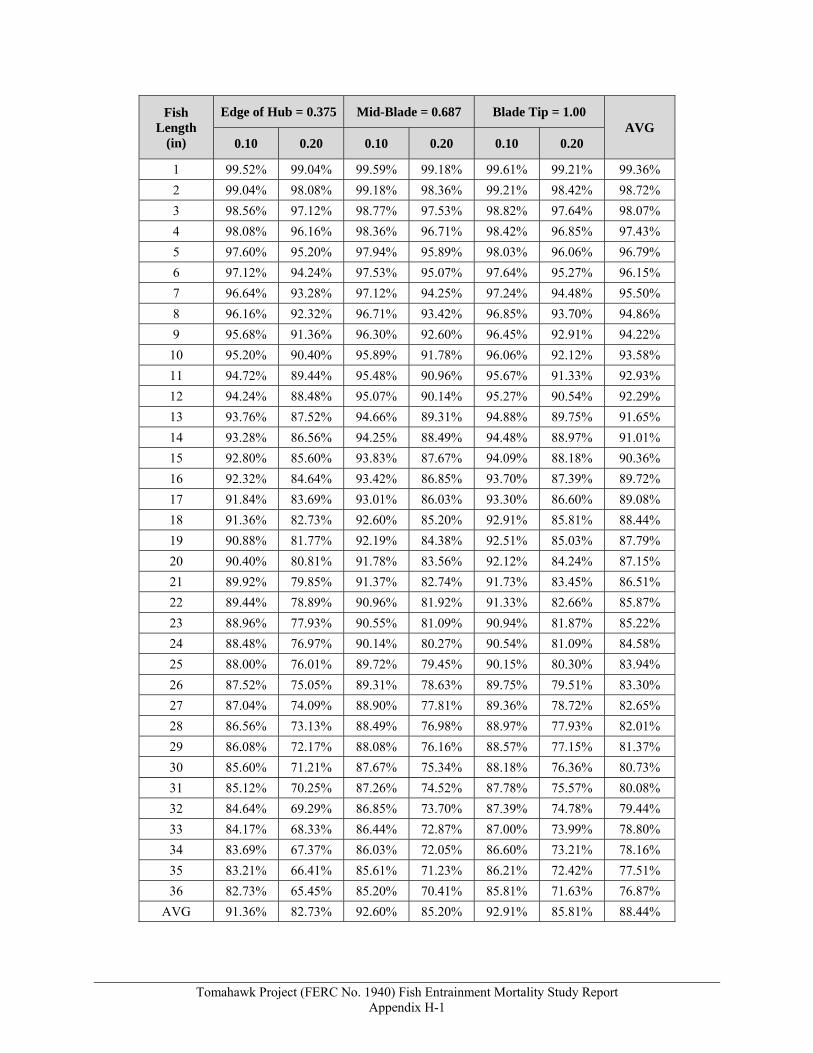
APPENDIX H - BLADE STRIKE RESULTS
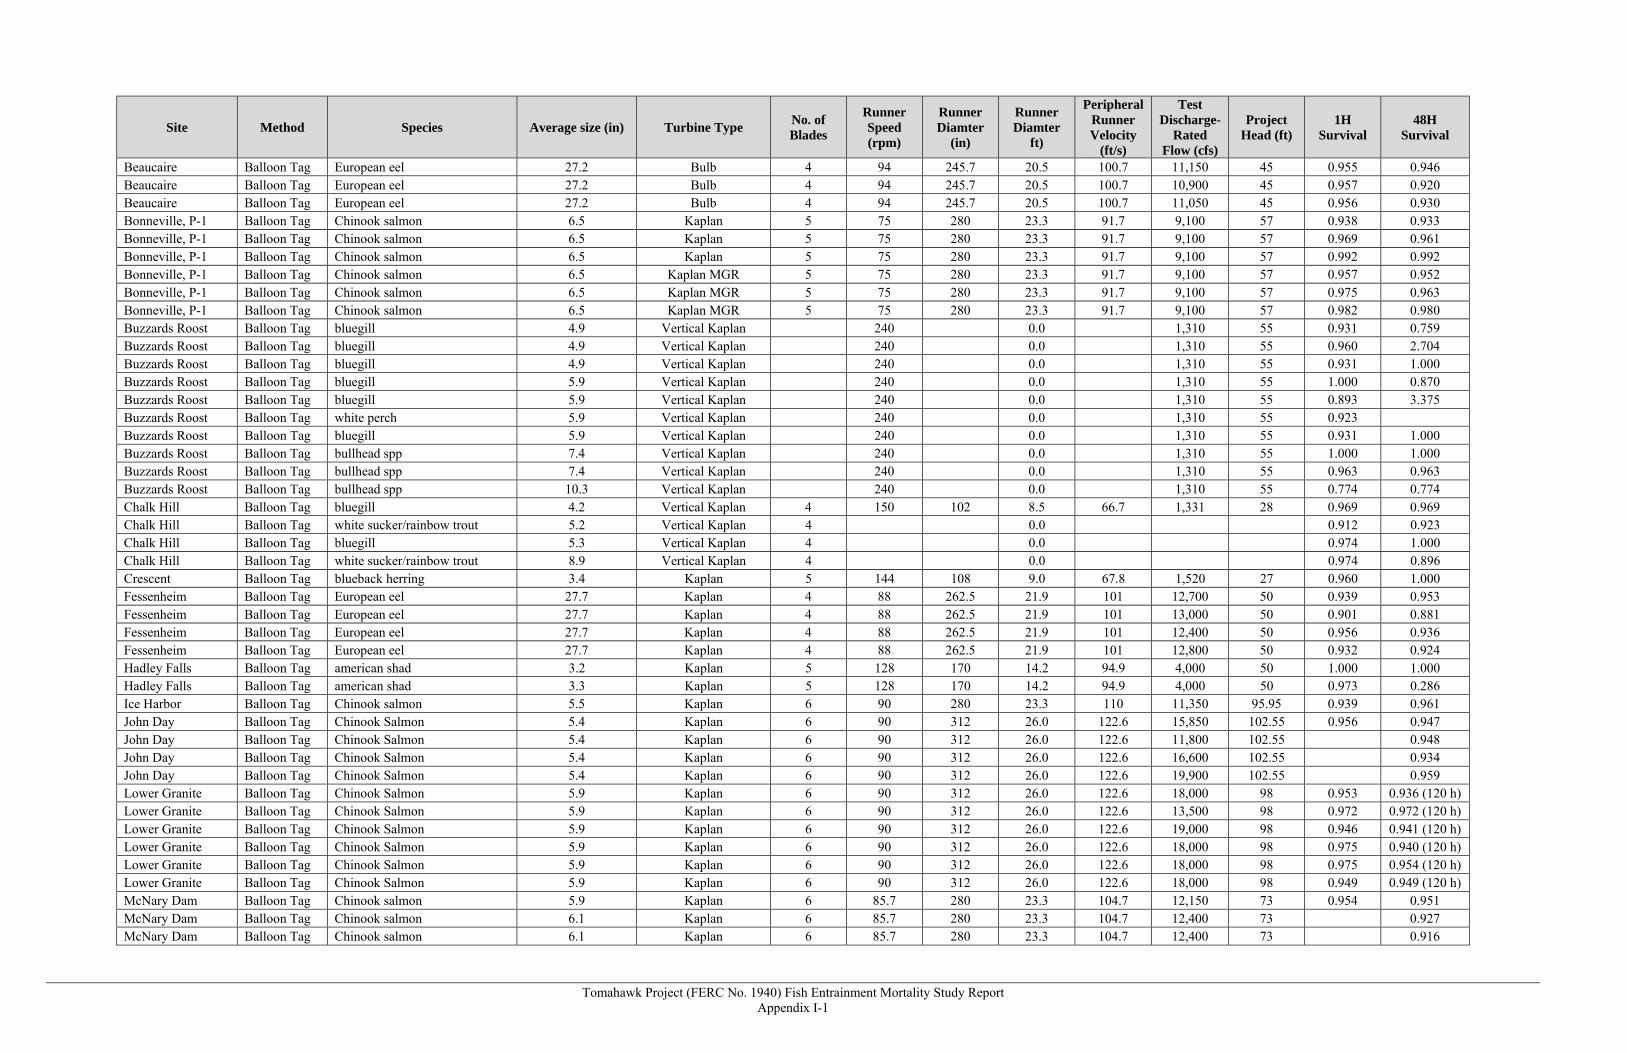
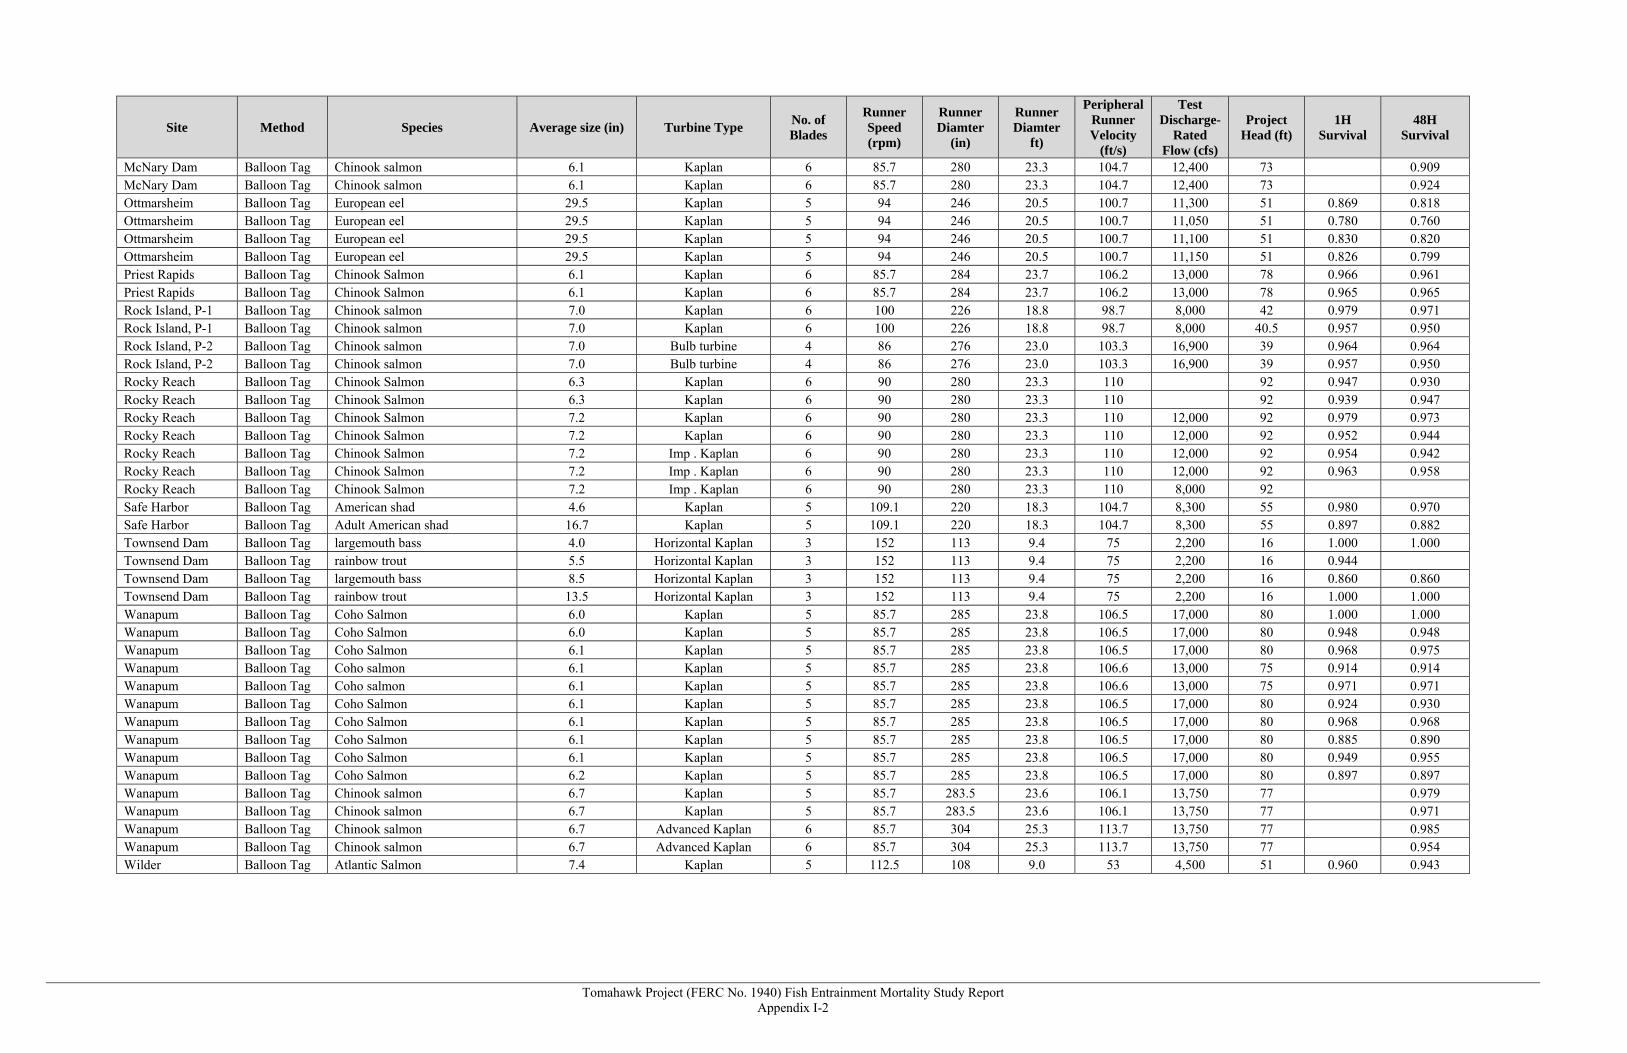
APPENDIX I - EMPIRICAL SURVIVAL RESULTS AT 21 PROJECTS AND 85 FIELD TRIALS WITH KAPLAN-TYPE TURBINES
Tomahawk Project (FERC No. 1940) Fish Entrainment Mortality Study Report iii
TOMAHAWK HYDROELECTRIC PROJECT (FERC No. 1940) FISH ENTRAINMENT MORTALITY STUDY
LIST OF FIGURES
Figure Title Page No. 2-1 FIVE REACHES OF THE WISCONSIN RIVER AS DEFINED BY LYONS (2005),
RELEVANT DAMS, AND THE TOMAHAWK PROJECT LOCATION .................... 2-4
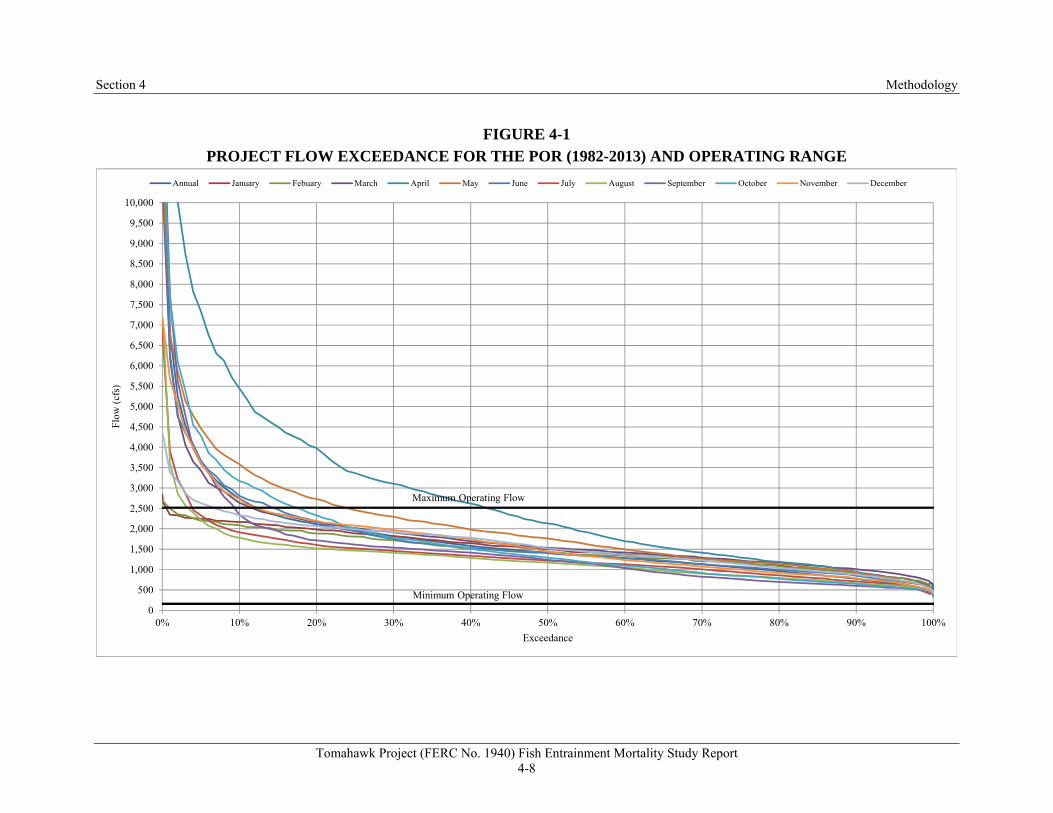
4-1 PROJECT FLOW EXCEEDANCE FOR THE POR (1982-2013) AND OPERATING RANGE ............................................................................................................................ 4-8
5-1 MEAN PERCENT (STANDARD DEVIATION) COMPOSITION OF ENTRAINMENT SAMPLES BY FISH SIZE CLASS................................................... 5-8
5-2 AVERAGE AND MAXIMUM FISH FAMILY PERCENT COMPOSITION FROM THE EPRI (1997A) PROJECTS, AND FISH FAMILY COMPOSITIONS FROM SAMPLING CONDUCTED IN LAKE MOHAWKSIN, THE UPPER REACH OF THE WISCONSIN RIVER, AND THE SUB-REACH FROM GRANDMOTHER FLOWAGE TO THE HEADWATERS OF RAINBOW FLOWAGE............................ 5-9
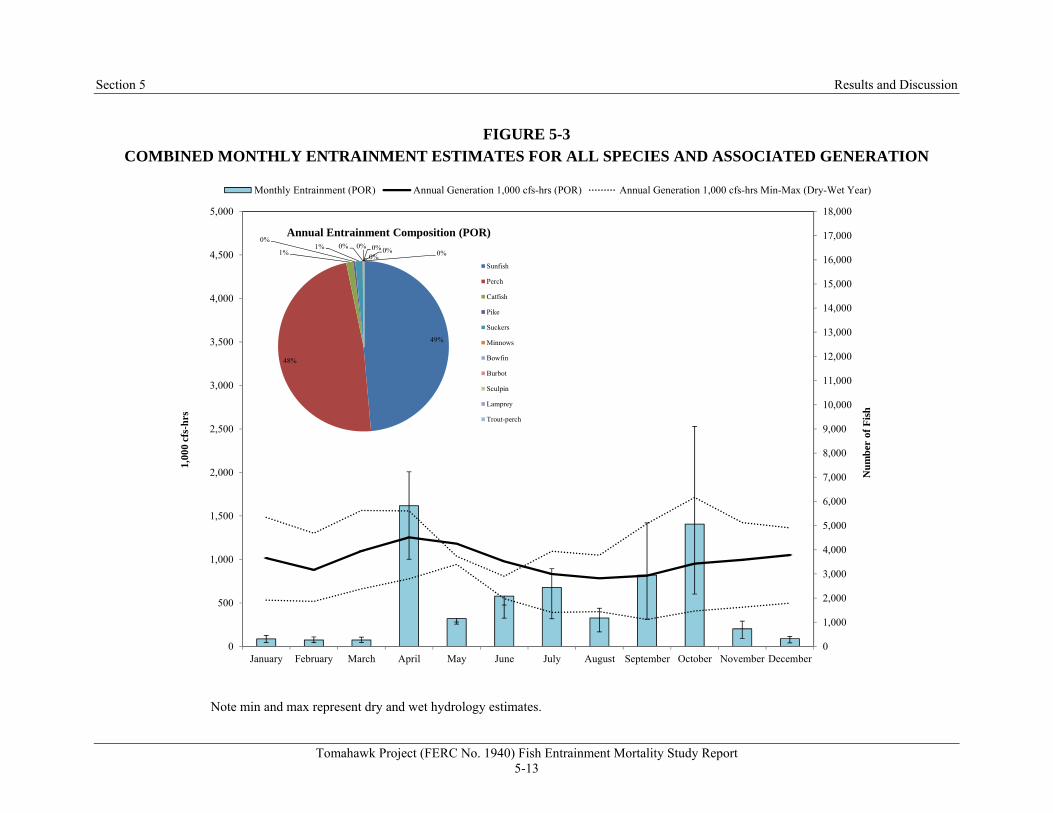
5-3 COMBINED MONTHLY ENTRAINMENT ESTIMATES FOR ALL SPECIES AND ASSOCIATED GENERATION .......................................................................... 5-13
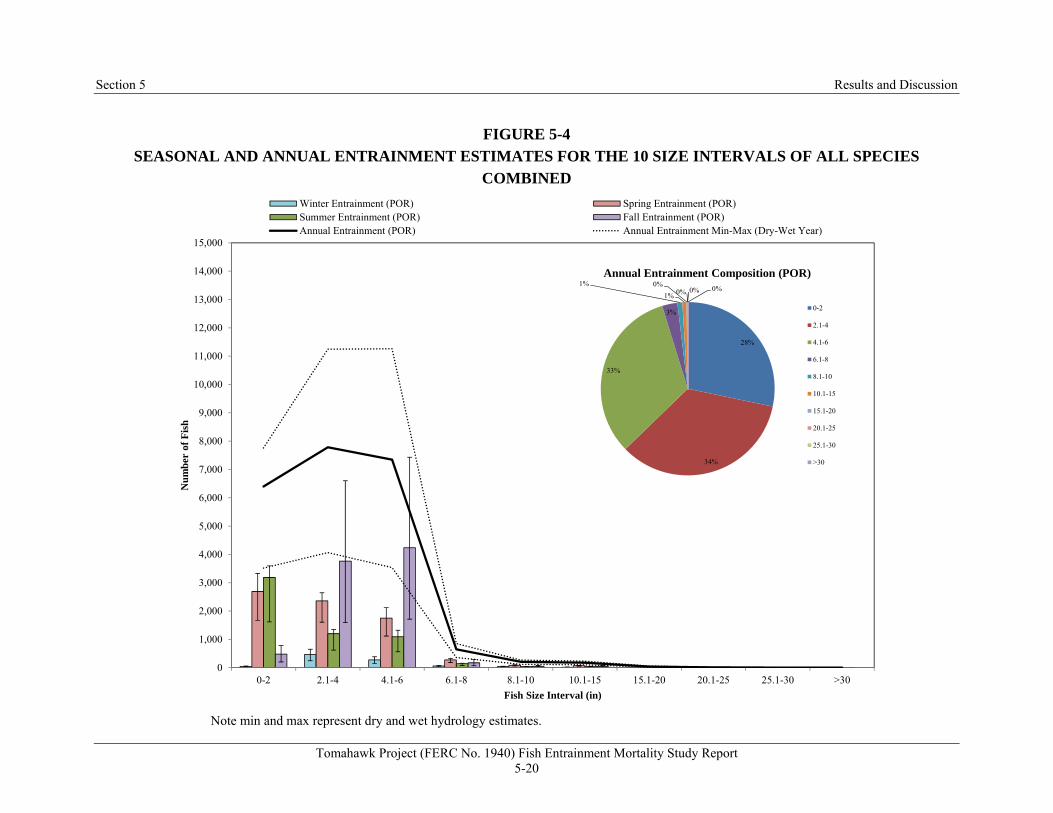
5-4 SEASONAL AND ANNUAL ENTRAINMENT ESTIMATES FOR THE 10 SIZE INTERVALS OF ALL SPECIES COMBINED ........................................................... 5-20
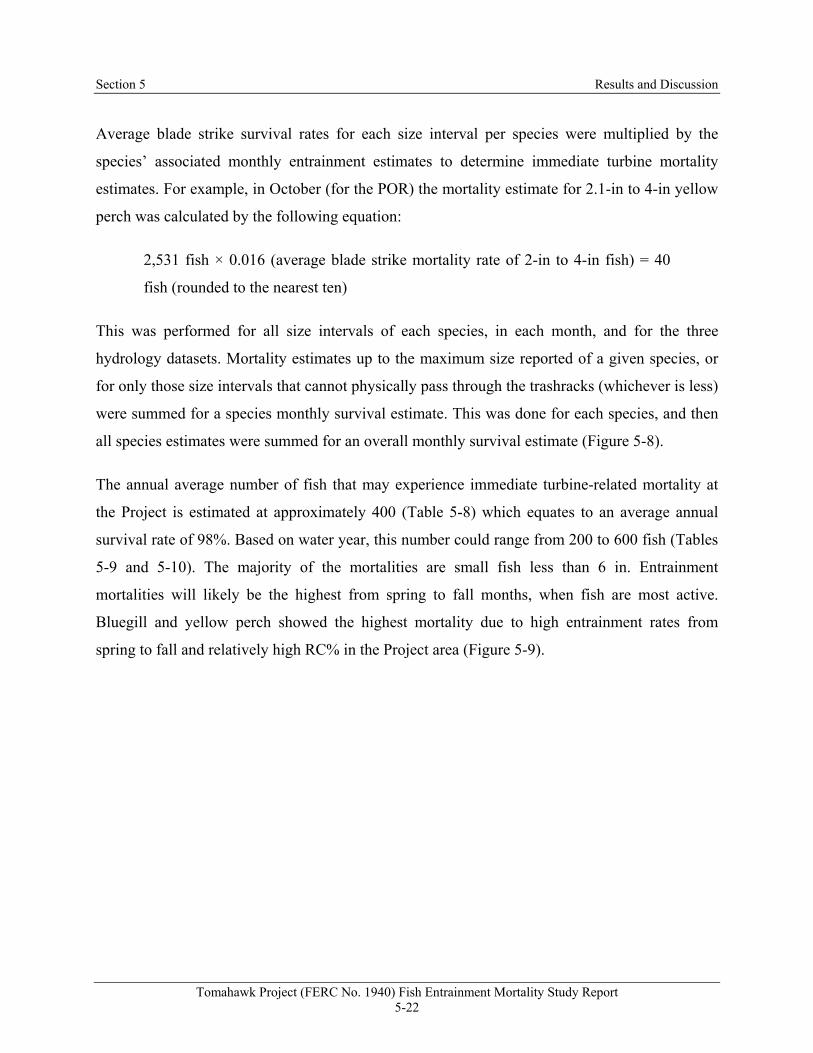
5-5 MEAN (RANGE) IMMEDIATE TURBINE SURVIVAL RATES DERIVED FROM BLADE STRIKE MODEL RUNS FOR THE 10 SIZE INTERVALS ......................... 5-23
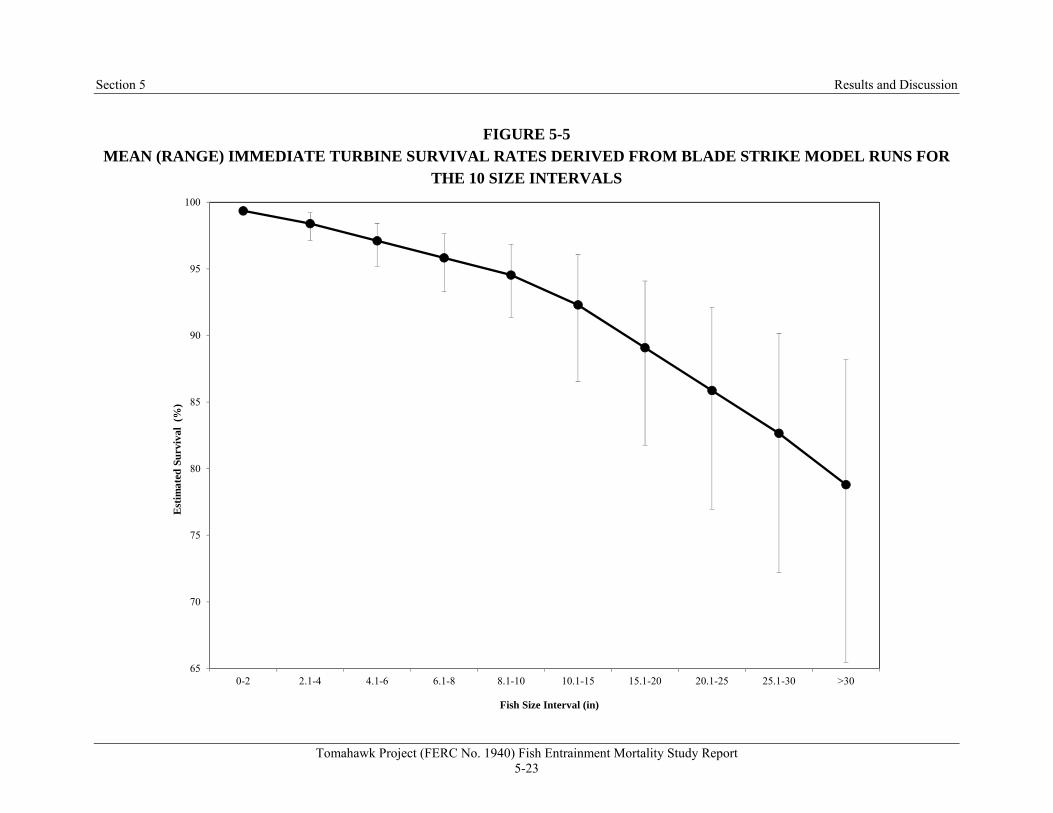
5-6 IMMEDIATE KAPLAN TURBINE SURVIVAL RATES DERIVED FROM EMPIRICAL BALLOON TAG STUDIES FROM VARIOUS SOURCES1 AND MEAN BLADE STRIKE SURVIVAL AT THE PROJECT; FISH SIZES RANGE FROM 3 TO 29 IN LONG FOR BOTH ........................................................................ 5-24
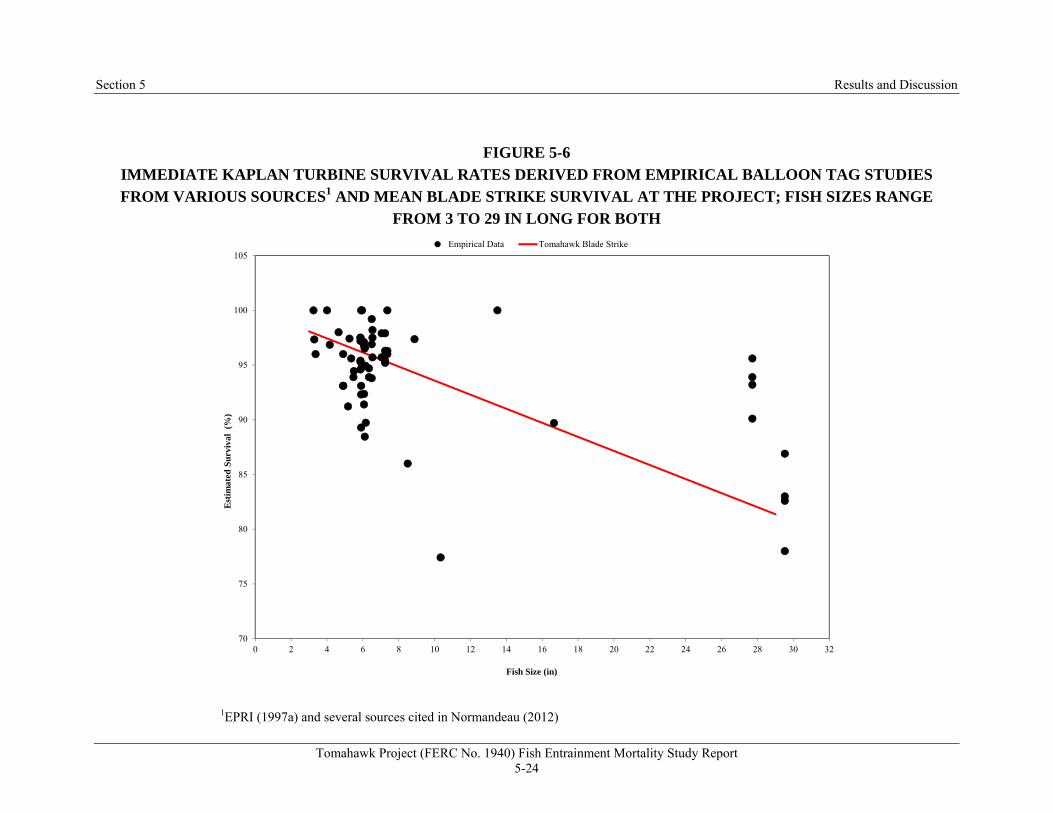
5-7 IMMEDIATE KAPLAN TURBINE SURVIVAL RATES DERIVED FROM EMPIRICAL BALLOON TAG STUDIES FROM VARIOUS SOURCES1 AND BLADE STRIKE SURVIVAL RANGE AT THE PROJECT COMPARED WITH ASSOCIATED PROJECT SPECIFICATIONS; FISH SIZES RANGE FROM 3 TO 29 IN LONG FOR BOTH.............................................................................................. 5-25
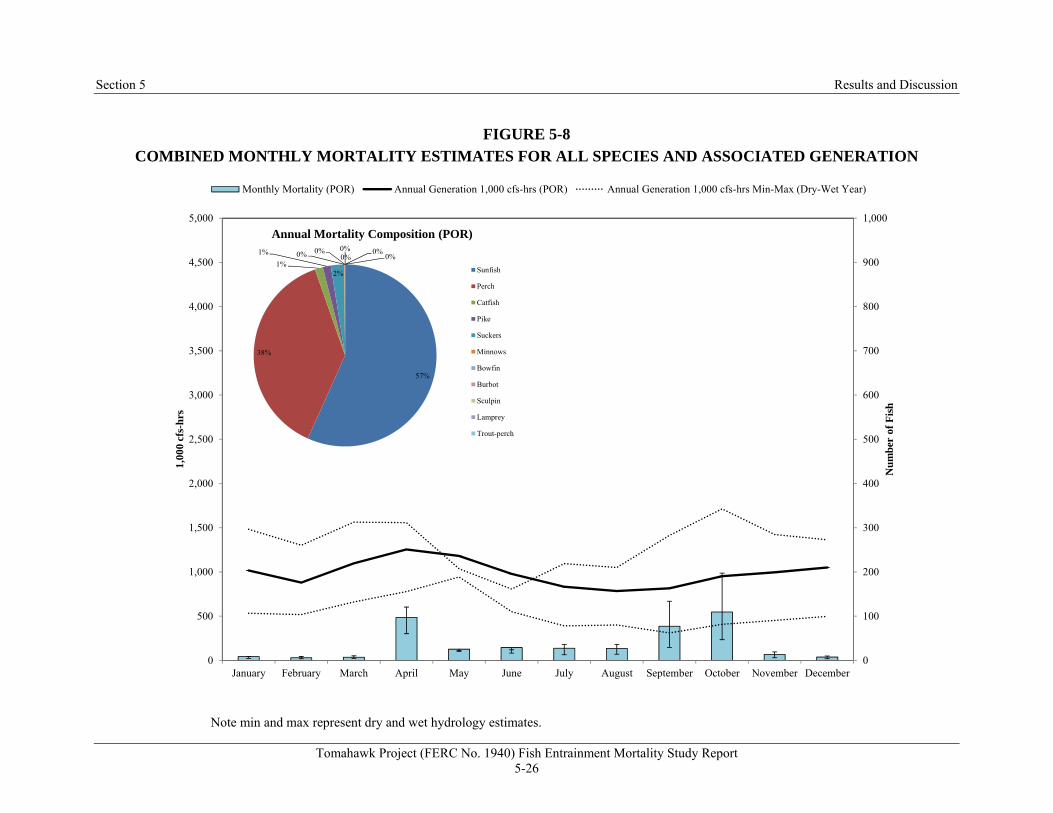
5-8 COMBINED MONTHLY MORTALITY ESTIMATES FOR ALL SPECIES AND ASSOCIATED GENERATION .................................................................................... 5-26
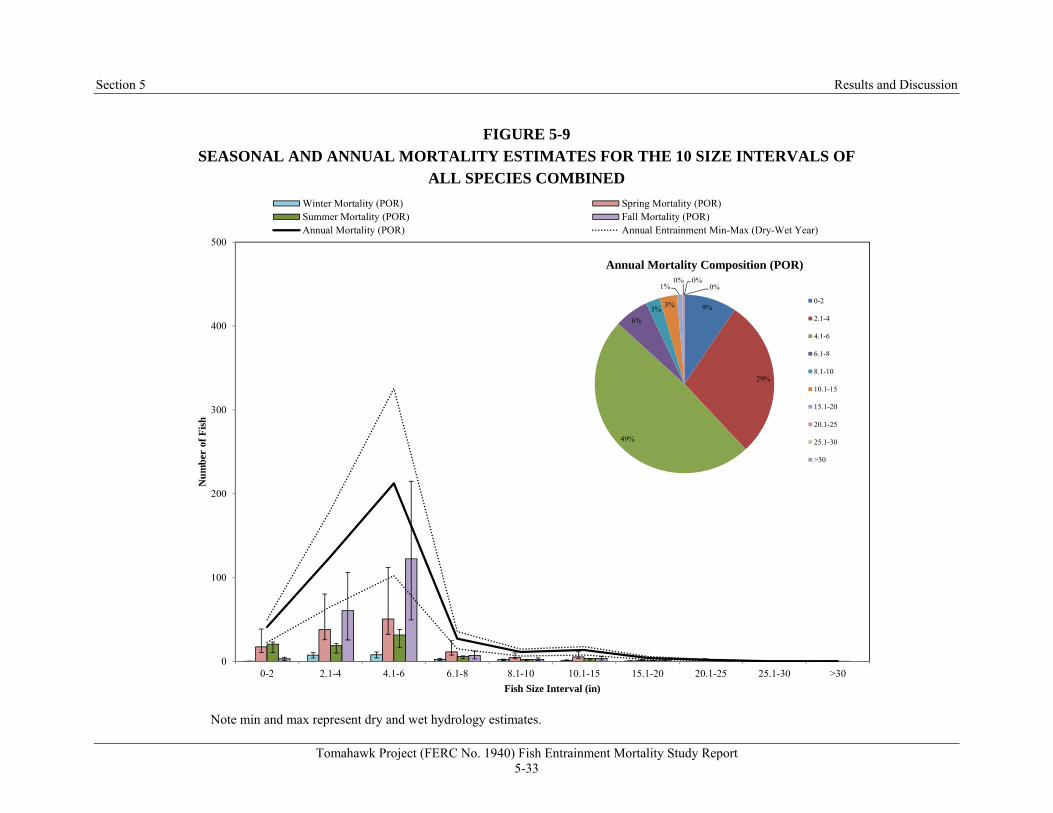
5-9 SEASONAL AND ANNUAL MORTALITY ESTIMATES FOR THE 10 SIZE INTERVALS OF ALL SPECIES COMBINED ........................................................... 5-33
Tomahawk Project (FERC No. 1940) Fish Entrainment Mortality Study Report iv
TOMAHAWK HYDROELECTRIC PROJECT (FERC No. 1940) FISH ENTRAINMENT MORTALITY STUDY
LIST OF TABLES
Table Title Page No. 4-1 FISH SPECIES COLLECTED IN THE UPPER REACH OF THE MAINSTEM
WISCONSIN RIVER FROM 2000 TO PRESENT (WDNR FISH MAPPING APPLICATION 2014) ..................................................................................................... 4-3
5-1 FACTORS INFLUENCING FISH ENTRAINMENT AND SURVIVAL ..................... 5-2
5-2 BURST SWIMMING SPEEDS OF FISH IN PROJECT AREA .................................... 5-4
5-3 ESTIMATED MINIMUM LENGTHS OF EACH SPECIES EXCLUDED OR IMPINGED ON PROJECT TRASHRACKS (2.70-IN CLEAR SPACING) ................. 5-5
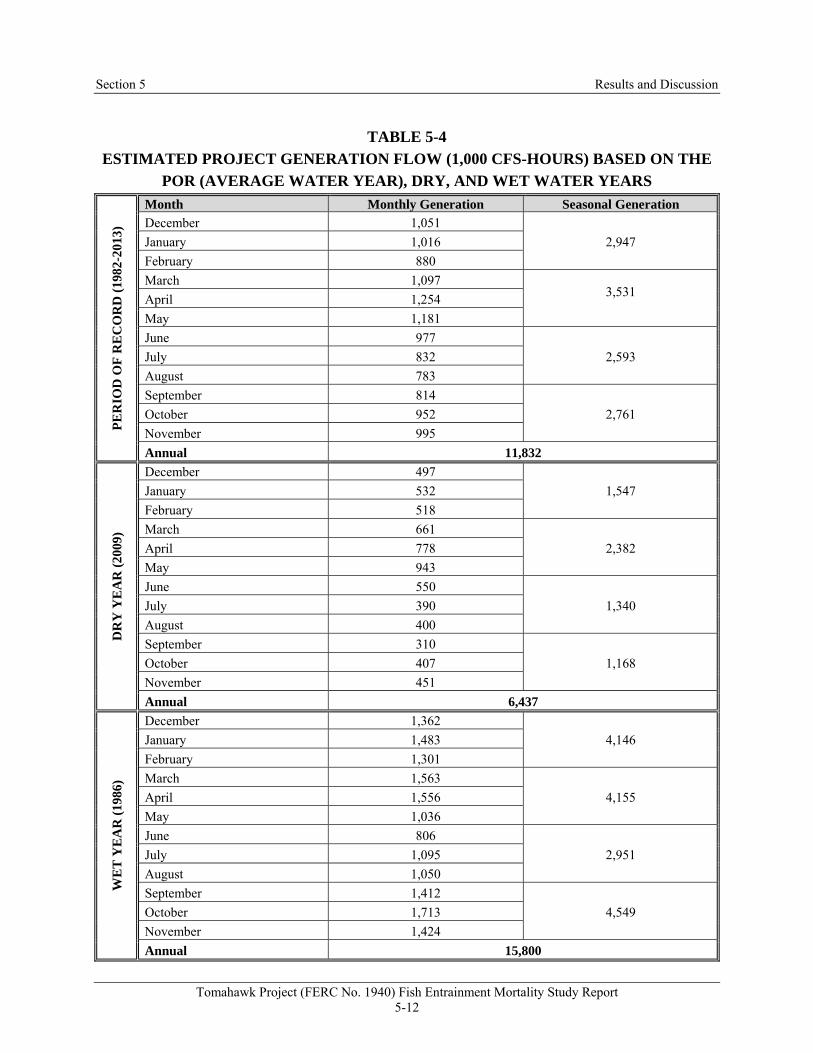
5-4 ESTIMATED PROJECT GENERATION FLOW (1,000 CFS-HOURS) BASED ON THE POR (AVERAGE WATER YEAR), DRY, AND WET WATER YEARS ......... 5-12
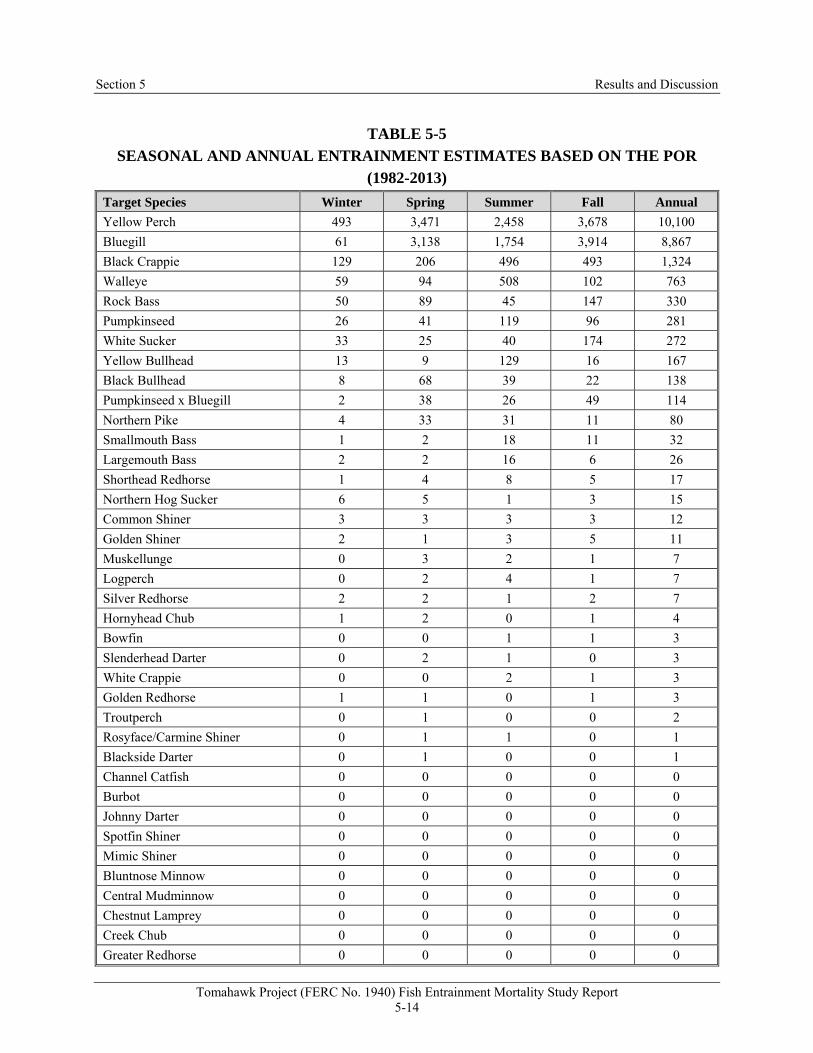
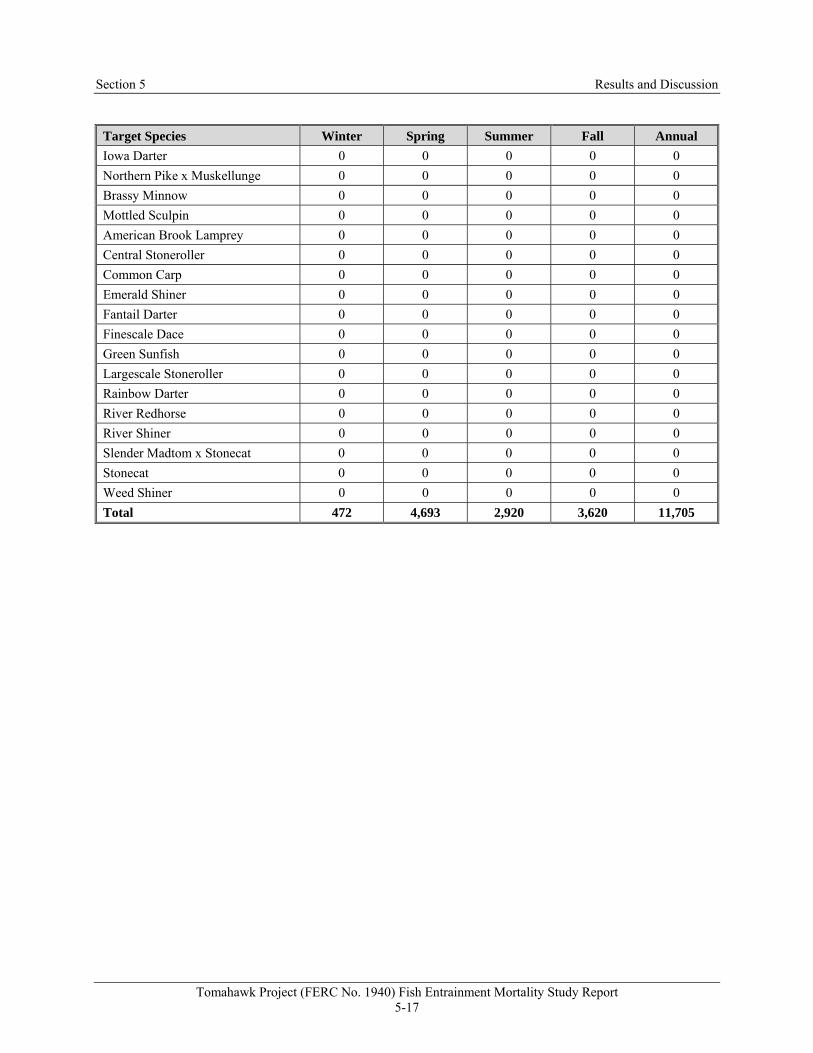
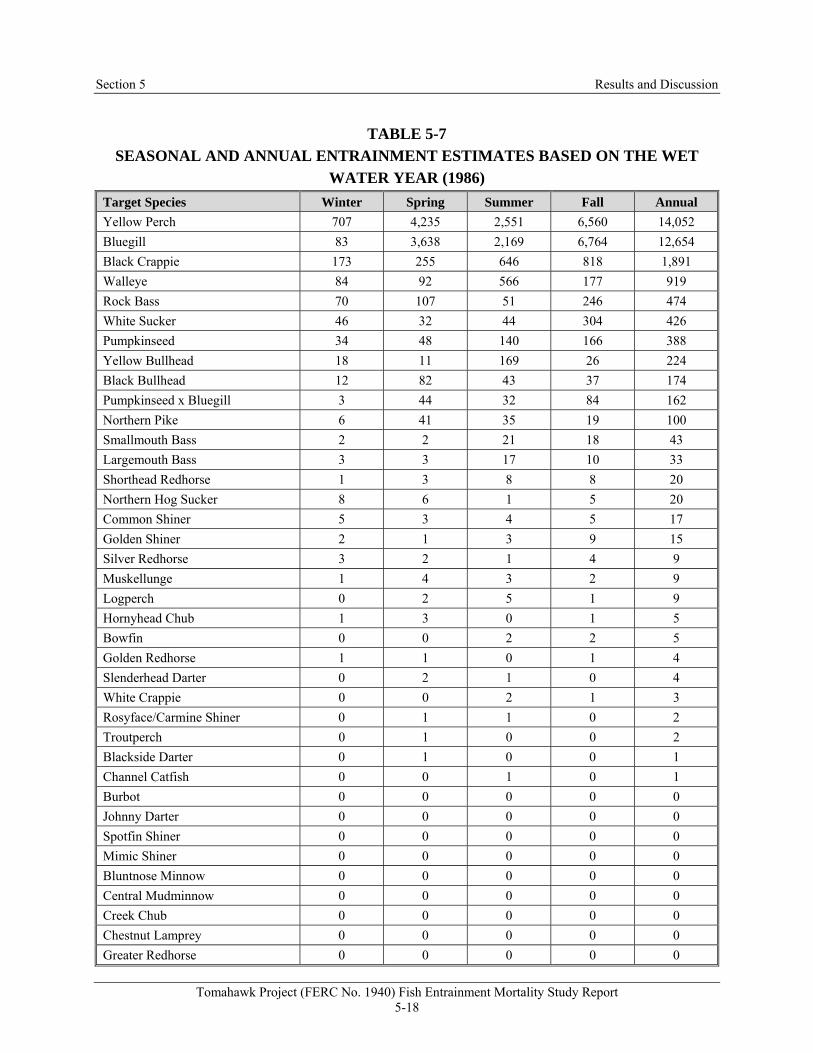
5-5 SEASONAL AND ANNUAL ENTRAINMENT ESTIMATES BASED ON THE POR (1982-2013) ........................................................................................................... 5-14
5-6 SEASONAL AND ANNUAL ENTRAINMENT ESTIMATES BASED ON THE DRY WATER YEAR (2009) ........................................................................................ 5-16
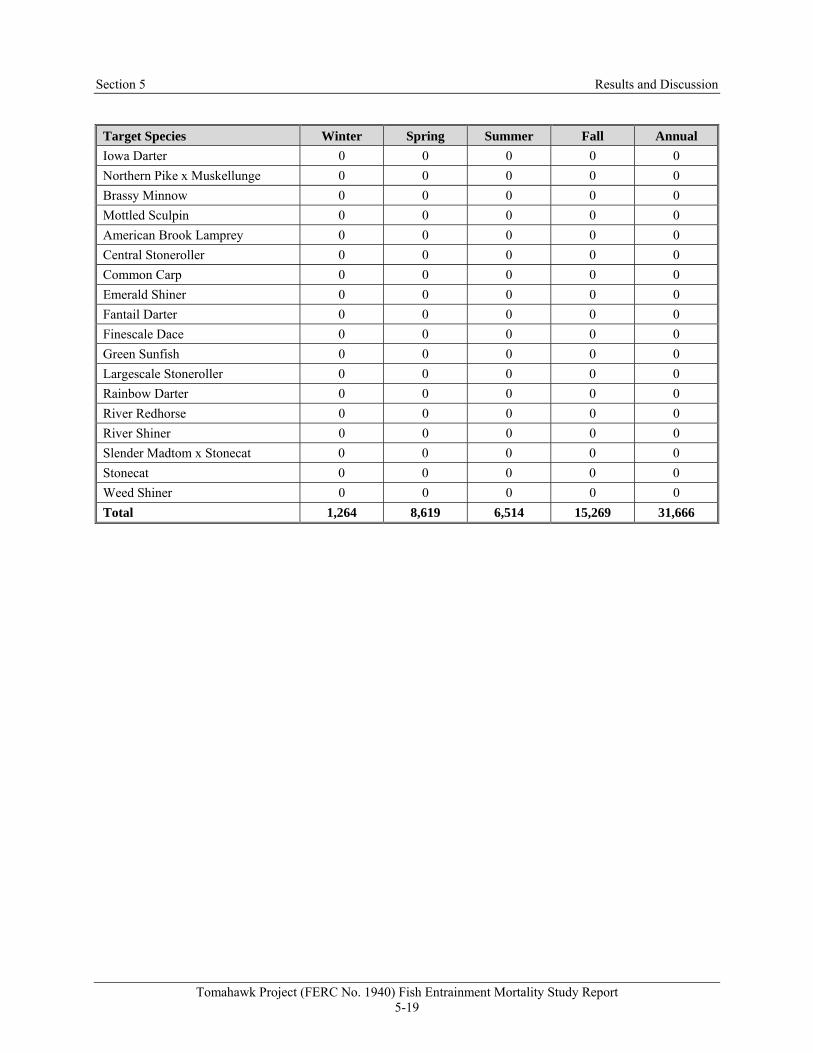
5-7 SEASONAL AND ANNUAL ENTRAINMENT ESTIMATES BASED ON THE WET WATER YEAR (1986) ........................................................................................ 5-18
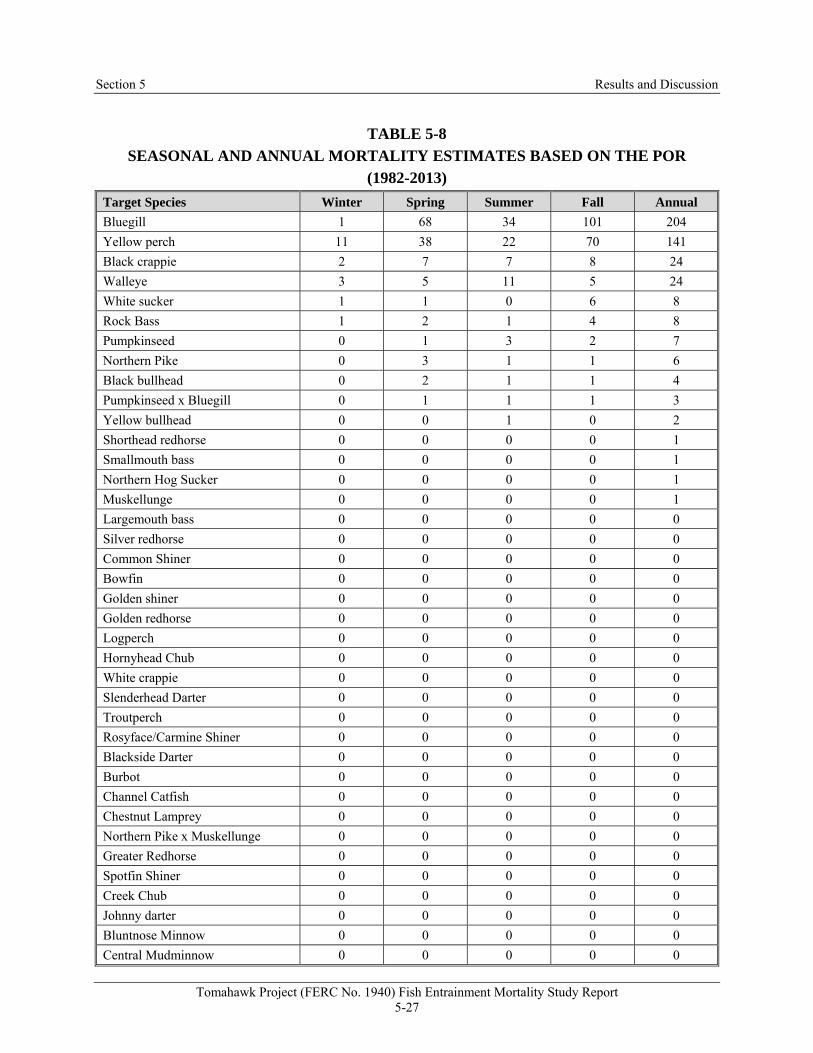
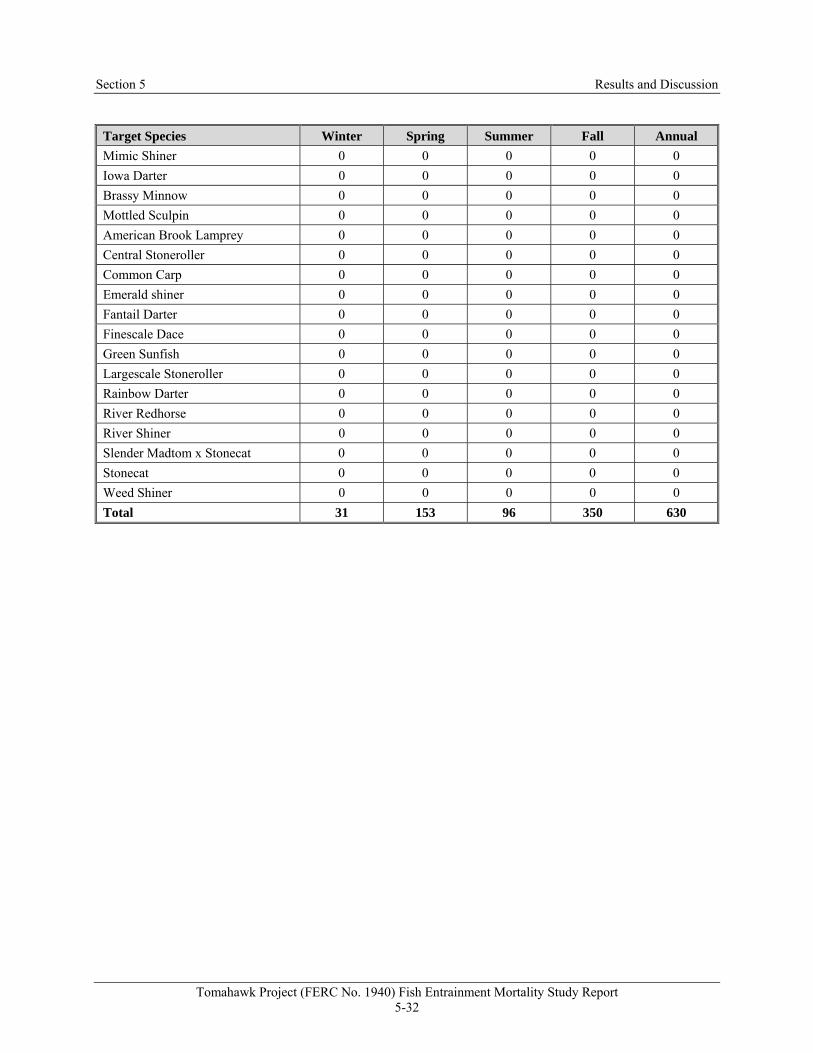
5-8 SEASONAL AND ANNUAL MORTALITY ESTIMATES BASED ON THE POR (1982-2013).................................................................................................................... 5-27
5-9 SEASONAL AND ANNUAL MORTALITY ESTIMATES BASED ON THE DRY WATER YEAR (2009) .................................................................................................. 5-29
5-10 SEASONAL AND ANNUAL MORTALITY ESTIMATES BASED ON THE WET WATER YEAR (1986) .................................................................................................. 5-31
Tomahawk Project (FERC No. 1940) Fish Entrainment Mortality Study Report 1-1
Section 1
Executive Summary
Wisconsin Public Service Corporation (WPS) has initiated the process for renewing the Federal
Energy Regulatory Commission (FERC) license of the Tomahawk Hydroelectric Project (FERC
Project No. 1940) (Project), which is scheduled to expire in 2018. As part of the relicensing
process, fish entrainment and turbine mortality have been identified as issues that need to be
studied in more detail to determine potential impacts of Project operations on local fish
populations. Consequently, WPS retained HDR Engineering, Inc. (HDR) to conduct a desktop
analysis of entrainment and mortality using available data from field studies conducted at other
hydropower projects. Estimating annual entrainment losses will allow WPS and resource
agencies to determine potential impacts to resource management activities and goals, and
whether mitigation is warranted.
Operation of the Project requires passing water through the powerhouse, creating the potential
for fish to be impinged on trashracks and/or entrained and passed through the turbines.
Impingement refers to the potential for fish to become trapped against the intake trashracks due
to velocity conditions at the intake. Entrainment refers to the passage of fish into the powerhouse
intakes and through the turbine units. Fish subjected to impingement or entrainment can be at
risk for injury or mortality.
The Project may be expected to create some degree of entrainment that will vary with river flow,
fish species, season, and fish size/life stage. The majority of entrained fish species will likely be
sunfish and perch, and young life stages of all species, including eggs, fry, juveniles, and some
young adults incapable of intake avoidance or exclusion by the trash racks. Seasonal quantitative
entrainment estimates were derived for a list of species occurring in the Upper Reach of the
Wisconsin River, including Lake Mohawksin. This study incorporated hydrology, operations,
empirical entrainment rate data collected at various hydroelectric projects, and species’ average
relative composition (RC%) in the Upper Reach of the Wisconsin River from Grandmother
Flowage upstream to the headwaters of Rainbow Falls.
The annual average number of fish that may become entrained at the Project is estimated at
approximately 22,600. Based on water year, this number could range from 11,700 to 31,700 fish.
Section 1 Executive Summary
Tomahawk Project (FERC No. 1940) Fish Entrainment Mortality Study Report 1-2
These estimates are based on species lists and relative composition data from the Upper Reach of
the mainstem Wisconsin River, empirically derived entrainment rates, 31-year USGS hydrology,
and the Project’s hydraulic capacity and operational specifications. The majority of the
entrainment estimates are small fish less than 6 inches in length. Bluegill and yellow perch
represent a large majority of entrainment, and overall entrainment numbers generally increase
from spring to fall, which is suggestive of increased activity and presence/dispersal of juveniles.
Entrainment netting studies at the Wisconsin River Division and Centralia projects on the
mainstem Wisconsin River (Middle Reach) documented high numbers of catfish and sunfish in
entrainment collections, but low numbers of perch species. Based on available fish community
data, catfish are rare or absent in the Upper Reach of the Wisconsin River, and yellow perch
make up a much larger percentage than in the Middle Reach.
The estimated annual average number of fish to experience immediate turbine-related mortality
at the Project is approximately 400 fish (98% survival rate), with a range of 200 to 600 fish
depending on water year. Turbine mortality estimates were derived using size specific blade
strike model survival rates, multiplied by the entrainment estimates for each size interval. The
survival rates obtained using the blade strike model compare well with empirically derived
survival study findings at several projects with similar specifications. Because latent mortality is
difficult to quantify, no measure could be incorporated into the mortality estimates at the Project.
Research in this area has primarily focused on endangered salmonids, where a 5% latent
mortality rate has generally been accepted. Including latent mortality, overall turbine survival for
those species and size classes estimated to become entrained could approximate 93%. These
estimates are fairly high due to the high immediate survival rates of fish less than 6 in, which
represent the majority of entrainment compositions.
Tomahawk Project (FERC No. 1940) Fish Entrainment Mortality Study Report 2-1
Section 2
Introduction
2.1 Background
Wisconsin Public Service Corporation (WPS) has initiated the process for renewing the Federal
Energy Regulatory Commission (FERC) license of the Tomahawk Hydroelectric Project (FERC
Project No. 1940) (Project), which is scheduled to expire in 2018. As part of the relicensing
process, fish entrainment and turbine mortality have been identified as issues that need to be
studied in more detail to determine potential impacts of Project operations on local fish
populations. Consequently, WPS retained HDR Engineering, Inc. (HDR) to conduct a desktop
analysis of entrainment and mortality using available data from field studies conducted at other
hydropower projects. Estimating annual entrainment losses will allow WPS and resource
agencies to determine potential impacts to resource management activities and goals, and
whether mitigation is warranted.
2.2 Turbine Entrainment and Mortality
Operation of the Project requires passing water through the powerhouse, creating the potential
for fish to be impinged on trashracks and/or entrained and passed through the turbines.
Impingement refers to the potential for fish to become trapped against the intake trashracks due
to velocity conditions at the intake. Entrainment refers to the passage of fish into the powerhouse
intakes and through the turbine units. Fish subjected to impingement or entrainment can be at
risk for injury or mortality.
The potential for fish to become entrained or impinged at a hydroelectric facility is dependent on
a variety of factors such as fish life history, size, swimming ability, reservoir stratification,
operating regimes, inflow, and intake/turbine configurations (Cada et al. 1997). A gradient of
potential exists both temporally and spatially, where smaller-sized fish may be in higher
abundances during certain portions of the year, thus increasing their potential for entrainment. In
addition, diurnal and seasonal movements of both small and large fish may bring them in close
proximity to intake structures. Physical and operational characteristics of a given project,
including trashrack bar spacing, intake velocities, intake depth, stratification, and intake
proximity to feeding and rearing habitats also affect the potential for a fish to become entrained.
Section 2 Introduction
Tomahawk Project (FERC No. 1940) Fish Entrainment Mortality Study Report 2-2
These and several other factors are used to make general assessments of entrainment and
impingement potential at hydroelectric projects using a desktop study approach.
The size of trashrack bar spacing is often a concern when designing intake structures for
operating efficiency and successful exclusion of woody debris and other objects that could
damage turbines. Findings from FERC (1995a) and Winchell et al. (2000) suggest that the
majority of fish size classes entrained at hydroelectric projects is much smaller than the
minimum length of fish physically excluded by a certain clear spacing, and that length
frequencies of entrainment compositions are similar among sites with differing trashrack bar
spacing. It has been suggested that larger fish collected in entrainment samples may have been in
the draft tubes prior to tailrace net deployment and/or they may have entered through gaps in the
nets once they were deployed (EPRI 1992, 1997b). Such findings indicate that the lack of larger
fish in entrainment compositions may be related to their increased swimming performance and
ability to avoid intake velocities as they approach a dam. However, entrainment may occur
regardless of their swimming performance if the intake openings and resulting intake velocities
are the only available attractant flow for downstream migrating fish, particularly in riverine
environments (FERC 1995a; EPRI 1997b).
Fish may experience immediate or latent mortality during entrainment through a hydropower
plant. This could be caused by a number of factors related to mechanical injuries, shear stress,
pressure changes, cavitation, and/or turbulence (Odeh 1999; Cada et al. 1997). Immediate
mortalities typically occur from mechanical injuries, where blade strikes can completely sever
fish or cause blunt force trauma. Other physical injuries such as grinding, abrasions, and cuts
may make fish more susceptible to disease and predation, thus causing latent mortality. Fish with
open wounds and abrasions are more susceptible to bacterial and viral infections and diseases
due to loss of their skin’s mucous layer, while physical injuries may limit fish mobility and
predator avoidance.
Pressure changes, particularly in those fish with closed swim bladders (physoclistous), may often
cause latent mortality. Shear stress, or parallel surface pressure, can also lead to latent or
immediate mortalities. Injuries sustained from shear stress could include the removal of skin
mucous and loss of eyeballs and mouth parts (Cada et al. 1997). Turbulence occurs at different
Section 2 Introduction
Tomahawk Project (FERC No. 1940) Fish Entrainment Mortality Study Report 2-3
scales while a hydroelectric turbine is operating, often leading to pressure and shear stress-
related injuries. However, turbulence may also disorient fish after passage, potentially creating
higher predation potential. Cavitation, or the formation of gas bubbles in areas of low pressure
(i.e., downstream of a turbine blade), is another form of injury that can cause both latent and
immediate mortality. These types of pressure-related injuries, however, most often occur at dams
with greater than 100 feet (ft) of head. It has been suggested that the majority of
injuries/mortalities occurring at hydropower projects with less than 100 ft of head are caused by
blade strike (Franke et al. 1997).
During the past 20 years, owners of hydroelectric facilities have conducted numerous field
studies to assess impingement, entrainment, and turbine survival at many small- to medium-sized
projects. Over 50 site-specific studies of resident fish entrainment and mortality at hydroelectric
sites in the United States have been performed and reported on to date (EPRI 1997a). Projects
studied vary by location, size, operation regimes, fish presence, impoundment characteristics,
and intake features such as trashrack bar spacing and intake velocities. Similarly, these studies
contain extensive turbine survival data for a range of turbine types and physical characteristics.
This comprehensive empirical database has been successfully used to conduct desktop
assessments of fish impingement, entrainment, and turbine survival at many projects throughout
the country.
2.3 Tomahawk Project Description
The Project is located in Lincoln County, Wisconsin, on the Wisconsin River (Figure 2-1). The
Project’s impoundment (Lake Mohawksin) spans 2,773 acres with 35 miles of shoreline.
Residence time (i.e., the amount of time water is retained in the reservoir) is approximately 6
days (Lyons 2005). The lake is classified as eutrophic, and is generally shallow with an average
and maximum depth of 9 ft and 25 ft, respectively, although 20 percent of the lake area is less
than 3 ft deep. Deeper water habitats are scarce, with less than 1 percent of the lake area
containing depths in excess of 20 ft. Substrate in the lake is dominated by sand and silt.
Section 2 Introduction
Tomahawk Project (FERC No. 1940) Fish Entrainment Mortality Study Report 2-4
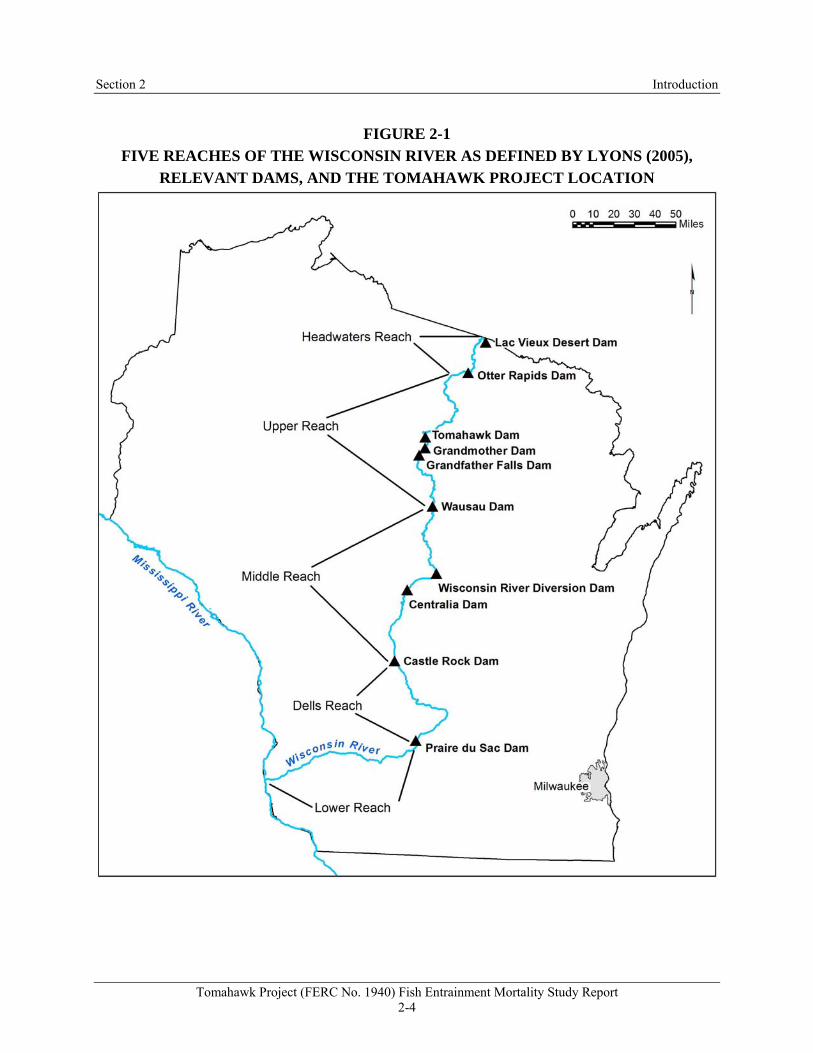
FIGURE 2-1 FIVE REACHES OF THE WISCONSIN RIVER AS DEFINED BY LYONS (2005),
RELEVANT DAMS, AND THE TOMAHAWK PROJECT LOCATION
Section 2 Introduction
Tomahawk Project (FERC No. 1940) Fish Entrainment Mortality Study Report 2-5
The Project powerhouse has two 1.3 MW vertical Kaplan turbines with a combined hydraulic
capacity of 2,520 cfs and head of 14.5 ft. The average annual energy generation of the Project is
12,370 MWh. The powerhouse trashracks extend to the full depth of the intake and have 2.70-in
clear spacing. The Project dam is about 3,400 ft long and has a maximum height of about 27 ft.
The dam includes a 9 ft wide sluice gate section, a 267 ft long radial gate section, a 160 ft long
slab and buttress section, a 67 ft powerhouse section, a 60 ft long northwest abutment section,
and earthen dikes. Under normal operations, the impoundment elevation fluctuates between
1,434.7 ft and 1,435.5 ft, and the tailwater is typically at elevation 1,419.5 ft. The water elevation
in the tailrace is typically influenced by the impoundment of the next project downstream
(Grandmother).
2.4 Fish Community
The Wisconsin River is classified as a warm, lowland river and is the longest and largest in the
state of Wisconsin (Lyons 2005). Over 100 native fish species have been documented in the
river, which meanders approximately 400 miles from the outlet of Lac Vieux Desert on the
Wisconsin-Michigan border to the confluence with the Mississippi River. Lyons (2005)
described fish community characteristics within five Wisconsin River reaches based on
longitudinal change, and natural and manmade characteristics (Figure 2-1). The Project occurs in
the “Upper Reach” as defined from the Wausau Dam upstream to the Otter Rapids Dam. The
river widens and increases in gradient in the Upper Reach, with greater disturbances than the
“Headwater Reach,” including a higher frequency of impoundments and history of industrial
pollution. According to Lyons (2005), fish diversity decreases in the upstream direction in the
Wisconsin River, with 49 species known to occur in the Upper Reach. No federally threatened or
endangered fish species occur in the Wisconsin River, although 20 Wisconsin state-endangered,
threatened, or “special concern” fish occur throughout the basin. According to Lyons (2005), the
most common and abundant species in the Upper Reach are shorthead redhorse, bluegill,
smallmouth bass, yellow perch, and logperch.
Review of an extensive fish collection database (WDNR Fish Mapping Application 2014)
suggests occurrence of 64 fish species and three hybrids in the Upper Reach of the mainstem
Wisconsin River (Appendix A). Data collected from 2000 to present with multiple gear types
Section 2 Introduction
Tomahawk Project (FERC No. 1940) Fish Entrainment Mortality Study Report 2-6
were compiled, resulting in 19 different sub-reaches or sample sites within the Upper Reach,
including Lake Mohawksin. Twenty different sample events from 2003 to 2010 in Lake
Mohawksin are included in the database, from which 22 species and one hybrid were collected
using boat electrofishing and fyke netting methods. The most abundant species collected was
yellow perch (28 percent composition of all collections combined), followed by bluegill (26
percent), walleye (14 percent), and black crappie (11 percent). According to the Project’s Pre-
Application Document (PAD), at least 20 species of fish are known to occur in Lake
Mohawksin, with the majority (75 percent) classified as warm water species in Wisconsin
(WPSP 2012). The remaining 25 percent are transitional species, which may be found in either
cold or warm water fish assemblages. No cold water species were present in available data sets,
which is not unexpected as the shallow lake provides little summertime thermal refuge for cold
water obligates (WPSP 2012). Due to the scarcity of deep, cool/cold water habitat and dissolved
oxygen levels below cold water standards, Lake Mohawksin is not suitable for cold water fish
species.
Tomahawk Project (FERC No. 1940) Fish Entrainment Mortality Study Report 3-1
Section 3
Study Goals and Objectives
The goal of this entrainment mortality study is to develop reasonable estimates of the number of
fish that are killed annually as a result of passing through the turbines at the Project. To achieve
this goal, the following objectives have been developed for the study:
1. Characterize the potential magnitude, size composition, species composition, and
seasonal distribution of annual fish entrainment at the Project using existing
entrainment data collected during field studies at similar sites;
2. Develop estimates of turbine passage survival for species and size ranges entrained at
the Project using existing data from field studies conducted at sites with similar
turbine designs; and
3. Develop estimates of annual entrainment and mortality for the Project by applying
relevant entrainment and turbine survival data to fish species and size ranges that are
likely entrained.
Tomahawk Project (FERC No. 1940) Fish Entrainment Mortality Study Report 4-1
Section 4
Methodology
4.1 Methodology Overview
The most current fish community data, historical hydrology, operational and structural
specifications, empirical entrainment rates, intake velocity calculations, and blade strike
probabilities were analyzed for a comprehensive review of fish entrainment and mortality at the
Project. The following independent assessments or study phases were made to address study
goals and objectives:
1. Description of factors affecting entrainment, impingement, and survival;
2. Intake velocities, trashrack exclusion, and impingement; and
3. Entrainment and turbine survival estimation.
4.2 Description of Factors Affecting Entrainment, Impingement, and
Survival
A general, qualitative assessment was made of factors influencing entrainment and mortality, and
their occurrence at the Project. Various structural, operational, and biological (biotic and abiotic)
factors generally known to influence entrainment and turbine mortality probability were
identified for the Project, and are presented below. These included intake proximity to littoral
zone habitats, littoral zone species abundance, and turbine type, to name a few.
4.3 Intake Velocities, Trashrack Exclusion, and Impingement
Fish impingement and intake avoidance were determined utilizing intake velocity calculations,
fish burst swim speeds, and trashrack spacing for a general qualitative assessment. Average
approach velocity was calculated using trashrack drawings (clear spacing) and the Project’s
maximum hydraulic capacity. Although not used in the entrainment estimation, available fish
swim speed data in scientific literature (Appendix B) were compared with calculated intake
velocities at the Project. Both approach and through-screen velocities were calculated by
dividing the Project’s hydraulic capacity by the total gross and clear areas of the intake,
respectively (EPRI 2000). Approach velocities are considered to be the average water velocity
Section 4 Methodology
Tomahawk Project (FERC No. 1940) Fish Entrainment Mortality Study Report 4-2
measured a few inches in front of the intake screen, taken in the same direction as the general
flow (EPRI 2000). Through-screen velocity is measured between the structural elements of the
intake screen as water passes through. Approach velocities are typically considered more critical
when assessing potential for impingement/entrainment; however, through-screen velocities may
indicate the degree of difficulty for an impinged fish to escape from the screen (EPRI 2000).
The exclusion assessment also involved estimating minimum fish lengths for the target fish
species that would be excluded or impinged by the 2.70-in trashrack bar spacing at the Project. A
scaling factor relating fish body width to total length was used for the impingement assessment
phase to determine minimum sizes of the target fish species that would be physically excluded or
impinged on the trashracks (Smith 1985). Entrainment rates for these species-specific sizes that
cannot physically pass through the trashracks were not considered in the entrainment estimation,
but instead are considered to either become impinged or excluded (escape) by the trashracks.
4.4 Entrainment and Turbine Survival Estimation
The entrainment and turbine mortality estimation is a quantitative assessment that utilized a
combination of the best available data sources, including: (1) species lists and relative
composition data from the Upper Reach of the mainstem Wisconsin River (WDNR Fish
Mapping Application 2014); (2) EPRI (1997a) empirical entrainment rates; (3) United States
Geological Survey (USGS) 31-year (1982-2013) period of record (POR) hydrology; (4) Project
operational and mechanical specifications; and (5) blade strike probabilities (Franke et al. 1997).
The result is a monthly, seasonal, and annual estimate (number of fish) of potential entrainment
and mortality for species occurring in the Upper Reach of the Wisconsin River. Trashrack
exclusion findings are the only data from the other independent assessments utilized in the
entrainment estimation.
4.4.1 Fish Species Composition
Fish collection data from the WDNR Fish Mapping Application (2014) were used to compile a
list of those species occurring in the Upper Reach of the mainstem Wisconsin River, including
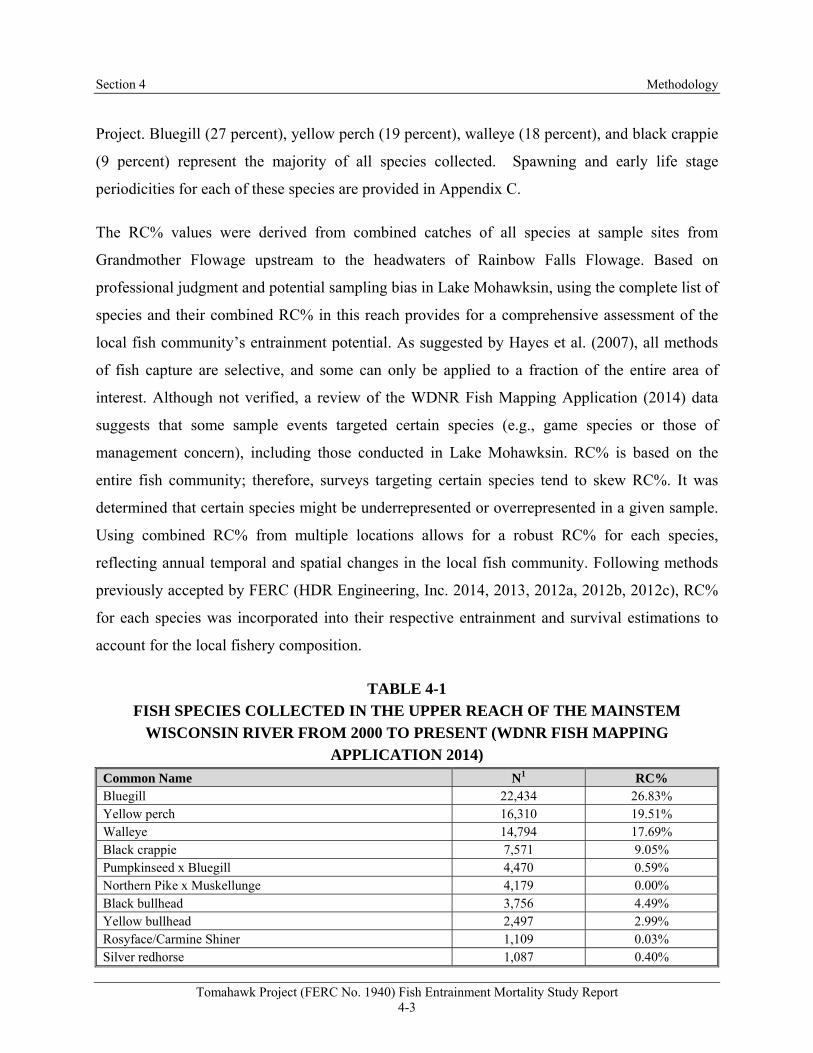
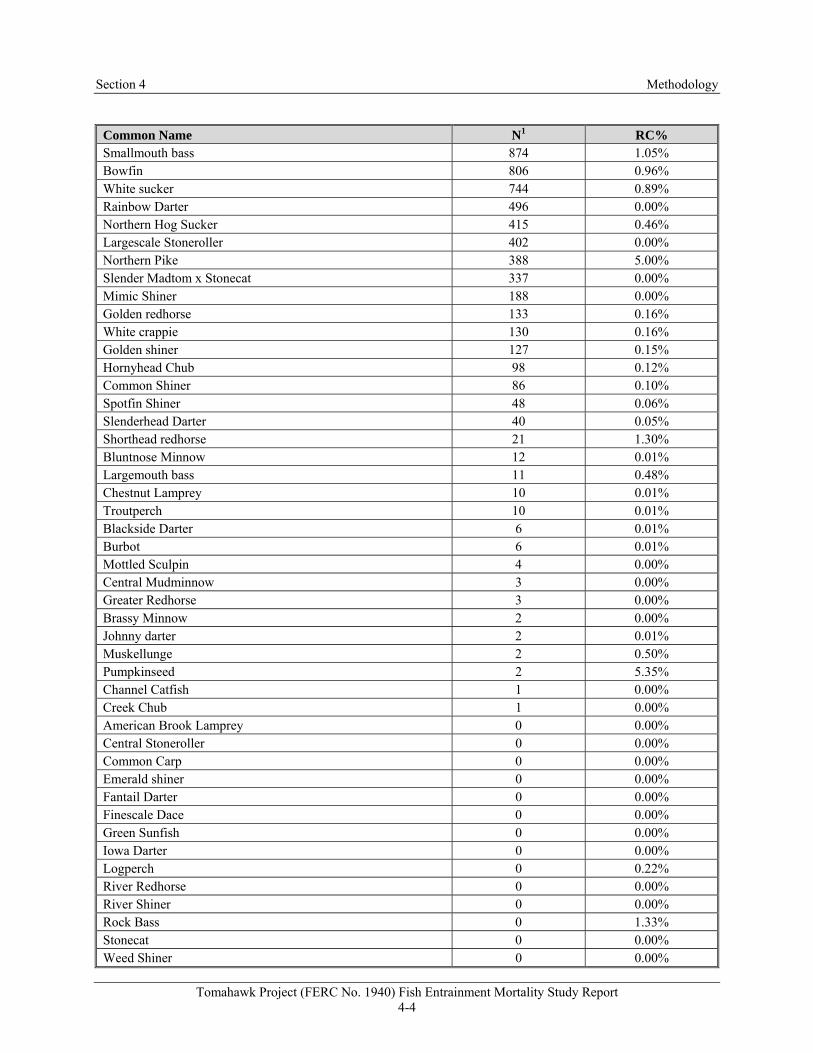
Lake Mohawksin (Appendix A). Table 4-1 provides the fish species and relative percent
composition (RC%) used to represent those communities vulnerable to entrainment at the
Section 4 Methodology
Tomahawk Project (FERC No. 1940) Fish Entrainment Mortality Study Report 4-3
Project. Bluegill (27 percent), yellow perch (19 percent), walleye (18 percent), and black crappie
(9 percent) represent the majority of all species collected. Spawning and early life stage
periodicities for each of these species are provided in Appendix C.
The RC% values were derived from combined catches of all species at sample sites from
Grandmother Flowage upstream to the headwaters of Rainbow Falls Flowage. Based on
professional judgment and potential sampling bias in Lake Mohawksin, using the complete list of
species and their combined RC% in this reach provides for a comprehensive assessment of the
local fish community’s entrainment potential. As suggested by Hayes et al. (2007), all methods
of fish capture are selective, and some can only be applied to a fraction of the entire area of
interest. Although not verified, a review of the WDNR Fish Mapping Application (2014) data
suggests that some sample events targeted certain species (e.g., game species or those of
management concern), including those conducted in Lake Mohawksin. RC% is based on the
entire fish community; therefore, surveys targeting certain species tend to skew RC%. It was
determined that certain species might be underrepresented or overrepresented in a given sample.
Using combined RC% from multiple locations allows for a robust RC% for each species,
reflecting annual temporal and spatial changes in the local fish community. Following methods
previously accepted by FERC (HDR Engineering, Inc. 2014, 2013, 2012a, 2012b, 2012c), RC%
for each species was incorporated into their respective entrainment and survival estimations to
account for the local fishery composition.
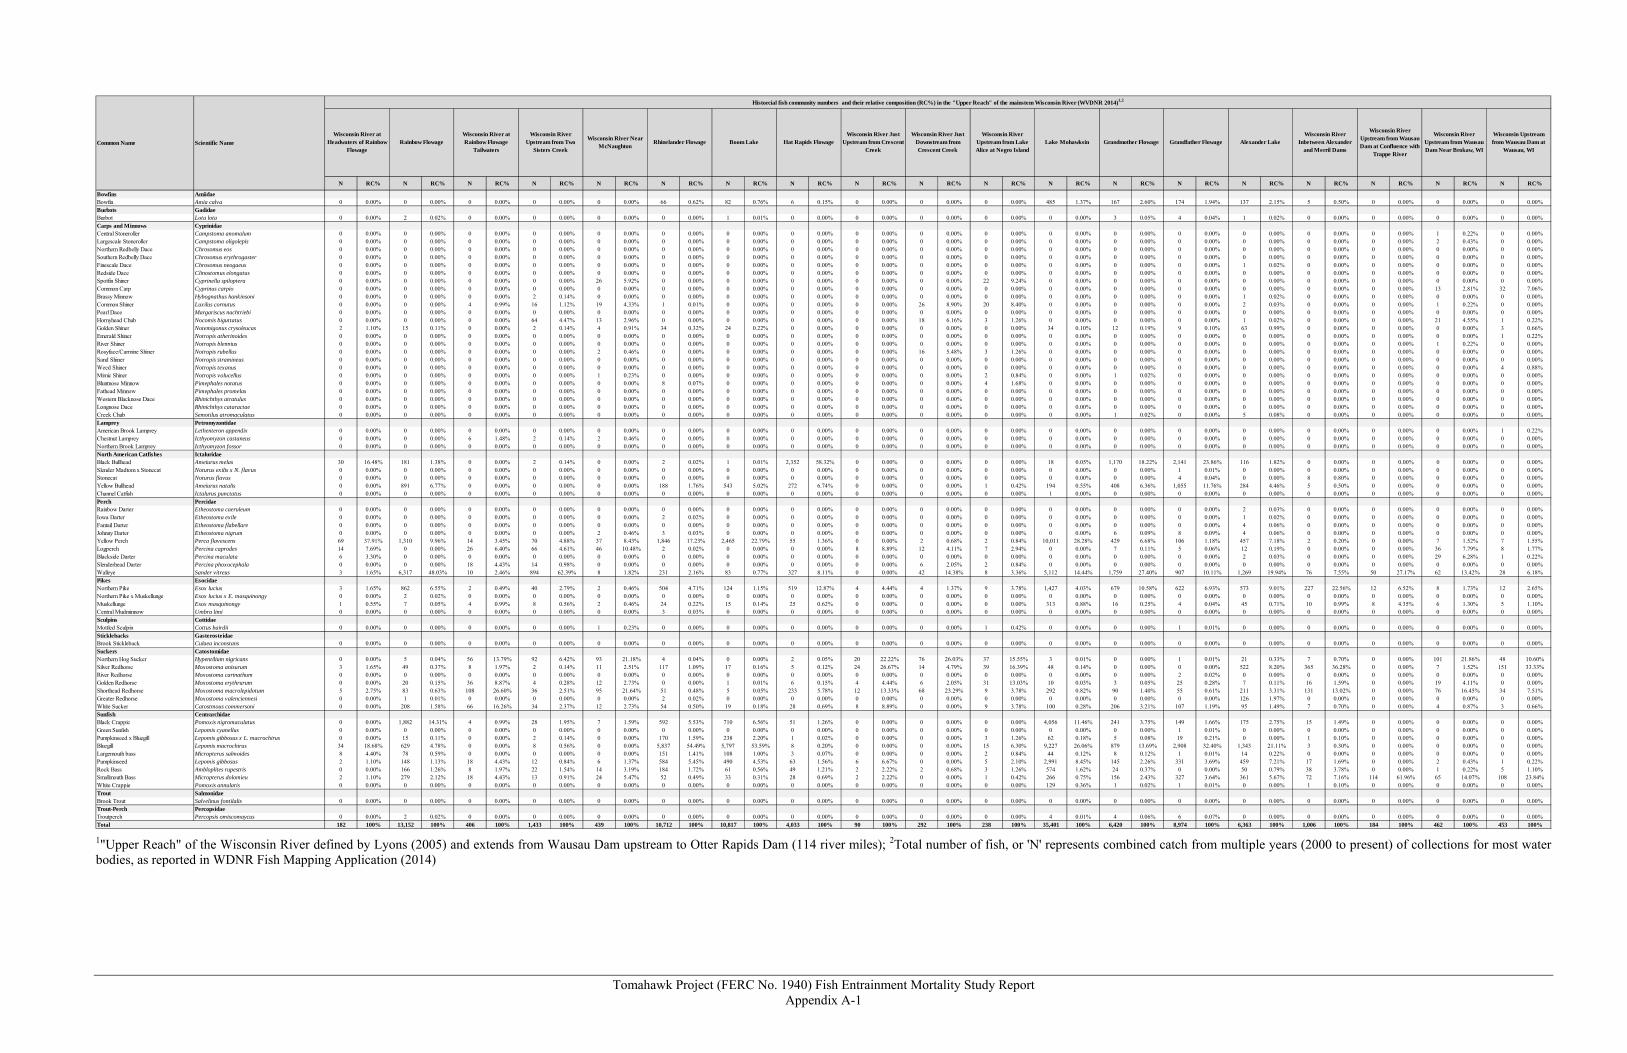
TABLE 4-1 FISH SPECIES COLLECTED IN THE UPPER REACH OF THE MAINSTEM
WISCONSIN RIVER FROM 2000 TO PRESENT (WDNR FISH MAPPING APPLICATION 2014)
Common Name N1 RC% Bluegill 22,434 26.83% Yellow perch 16,310 19.51% Walleye 14,794 17.69% Black crappie 7,571 9.05% Pumpkinseed x Bluegill 4,470 0.59% Northern Pike x Muskellunge 4,179 0.00% Black bullhead 3,756 4.49% Yellow bullhead 2,497 2.99% Rosyface/Carmine Shiner 1,109 0.03% Silver redhorse 1,087 0.40%
Section 4 Methodology
Tomahawk Project (FERC No. 1940) Fish Entrainment Mortality Study Report 4-4
Tomahawk Project (FERC No. 1940) Fish Entrainment Mortality Study Report 4-5
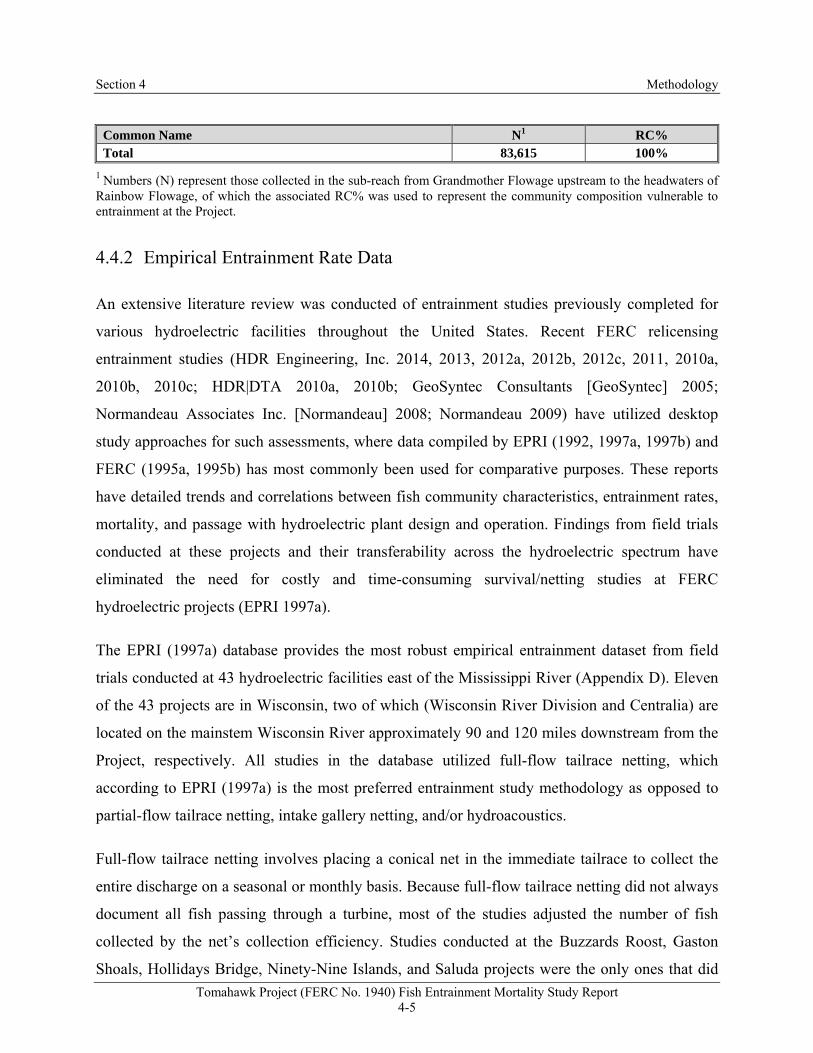
Common Name N1 RC% Total 83,615 100%
1 Numbers (N) represent those collected in the sub-reach from Grandmother Flowage upstream to the headwaters of Rainbow Flowage, of which the associated RC% was used to represent the community composition vulnerable to entrainment at the Project.
4.4.2 Empirical Entrainment Rate Data
An extensive literature review was conducted of entrainment studies previously completed for
various hydroelectric facilities throughout the United States. Recent FERC relicensing
Model predictions were made for 1-in fish length increments up to 36 in, which is the maximum
length of the target species (muskellunge) that could physically pass through the 2.70-in
trashrack bar spacing at the Project powerhouse based on the impingement/exclusion assessment.
A correlation factor (lambda) was added to each equation to account for the fact that a fish may
not always lie in a plane of revolution, as well as the fact that the strike severity may vary with
strike location on the fish. Von Raben (cited by Bell 1981) incorporated the correlation factor to
adjust the predictive turbine strike results to more closely match empirical results. Franke et al.
(1997) suggested correlation factors of 0.1 and 0.2 (i.e., 10% and 20% of strikes are lethal),
based on test results using Pacific salmonids. Survival is also dependent on the location of entry
into the runner for Kaplan turbines. Depending on turbine design, survival is typically lower
closer to the hub due to smaller spacings. To account for this, blade strike probabilities were
calculated for passage near the hub (0.4 or 40% of the hub diameter/runner diameter ratio), mid-
blade (0.7 or 70% of the hub diameter/runner diameter ratio), and blade tip (1 or 100% of the hub
diameter/runner diameter ratio).
Blade strike probabilities were calculated for each correlation factor with the associated model
input parameters, including entry location. Because the turbine units in the Project powerhouse
are identical, only one set of results is provided and the survival rates would apply to both.
Survival was calculated by subtracting the predicted strike estimate from 100. Average survival
Section 4 Methodology
Tomahawk Project (FERC No. 1940) Fish Entrainment Mortality Study Report 4-10
rates could then be calculated from all correlation values for each of the 10 size intervals
available in the EPRI (1997a) database.
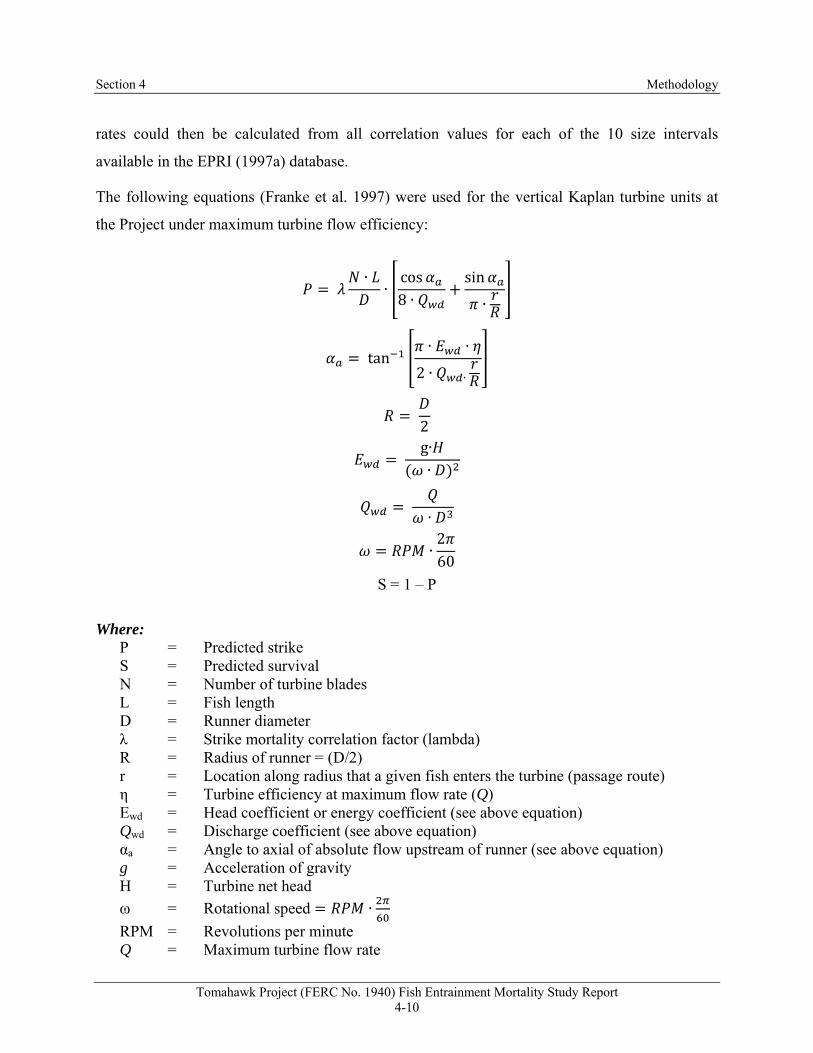
The following equations (Franke et al. 1997) were used for the vertical Kaplan turbine units at
the Project under maximum turbine flow efficiency:
∙∙cos8 ∙
sin
∙
tan∙ ∙
2 ∙ ∙
2
g∙∙
∙
∙260
S = 1 – P
Where:
P = Predicted strike S = Predicted survival N = Number of turbine blades L = Fish length D = Runner diameter λ = Strike mortality correlation factor (lambda) R = Radius of runner = (D/2) r = Location along radius that a given fish enters the turbine (passage route) η = Turbine efficiency at maximum flow rate (Q) Ewd = Head coefficient or energy coefficient (see above equation) Qwd = Discharge coefficient (see above equation) αa = Angle to axial of absolute flow upstream of runner (see above equation) g = Acceleration of gravity H = Turbine net head
ω = Rotational speed ∙
RPM = Revolutions per minute Q = Maximum turbine flow rate
Section 4 Methodology
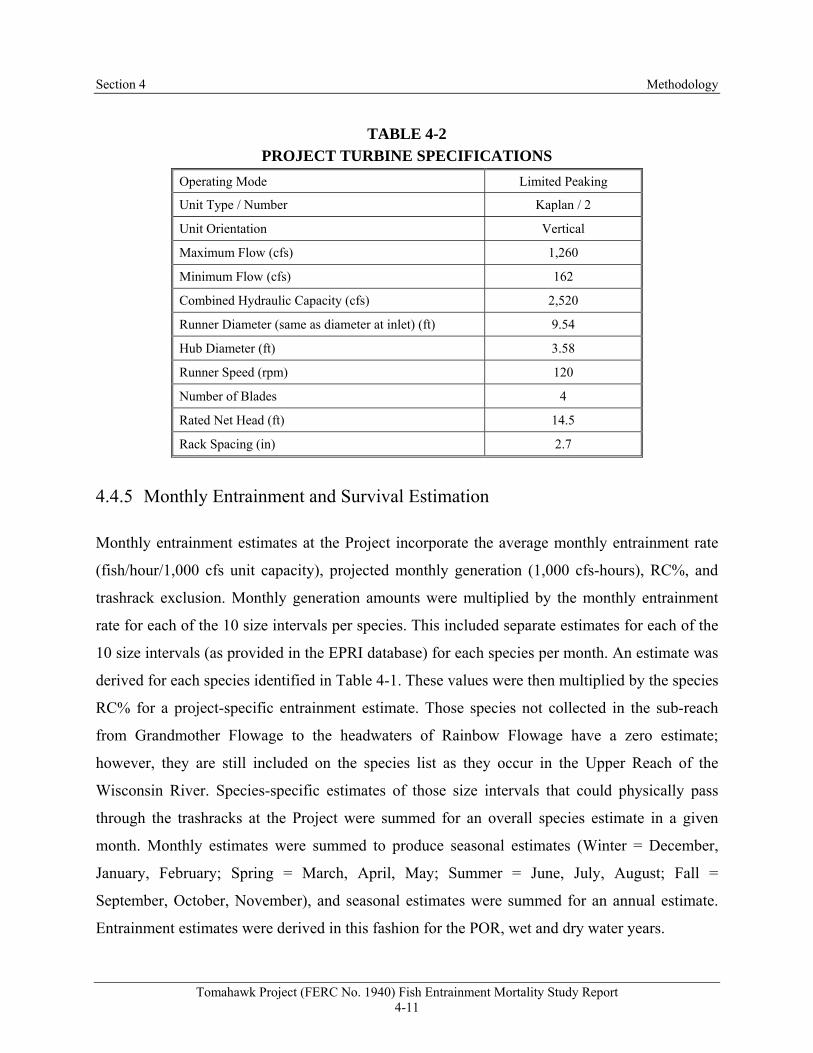
Tomahawk Project (FERC No. 1940) Fish Entrainment Mortality Study Report 4-11
TABLE 4-2 PROJECT TURBINE SPECIFICATIONS
Operating Mode Limited Peaking
Unit Type / Number Kaplan / 2
Unit Orientation Vertical
Maximum Flow (cfs) 1,260
Minimum Flow (cfs) 162
Combined Hydraulic Capacity (cfs) 2,520
Runner Diameter (same as diameter at inlet) (ft) 9.54
Hub Diameter (ft) 3.58
Runner Speed (rpm) 120
Number of Blades 4
Rated Net Head (ft) 14.5
Rack Spacing (in) 2.7
4.4.5 Monthly Entrainment and Survival Estimation
Monthly entrainment estimates at the Project incorporate the average monthly entrainment rate
(fish/hour/1,000 cfs unit capacity), projected monthly generation (1,000 cfs-hours), RC%, and
trashrack exclusion. Monthly generation amounts were multiplied by the monthly entrainment
rate for each of the 10 size intervals per species. This included separate estimates for each of the
10 size intervals (as provided in the EPRI database) for each species per month. An estimate was
derived for each species identified in Table 4-1. These values were then multiplied by the species
RC% for a project-specific entrainment estimate. Those species not collected in the sub-reach
from Grandmother Flowage to the headwaters of Rainbow Flowage have a zero estimate;
however, they are still included on the species list as they occur in the Upper Reach of the
Wisconsin River. Species-specific estimates of those size intervals that could physically pass
through the trashracks at the Project were summed for an overall species estimate in a given
month. Monthly estimates were summed to produce seasonal estimates (Winter = December,
January, February; Spring = March, April, May; Summer = June, July, August; Fall =
September, October, November), and seasonal estimates were summed for an annual estimate.
Entrainment estimates were derived in this fashion for the POR, wet and dry water years.
Section 4 Methodology
Tomahawk Project (FERC No. 1940) Fish Entrainment Mortality Study Report 4-12
Blade strike survival results were used to estimate immediate mortality during passage through
the Project’s turbines. This included multiplying the average blade strike survival rate of a given
size interval by each species entrainment estimate for that size interval. Survival estimates of
those size intervals per species that could physically pass through the trashracks were summed
for an overall species estimate in a given month. Monthly estimates were summed to produce
seasonal estimates, and seasonal estimates were summed for an annual estimate. Survival
estimates were derived using this method for the POR, wet, and dry water years.
Tomahawk Project (FERC No. 1940) Fish Entrainment Mortality Study Report 5-1
Section 5
Results and Discussion
5.1 Description of Factors Affecting Entrainment, Impingement, and
Survival
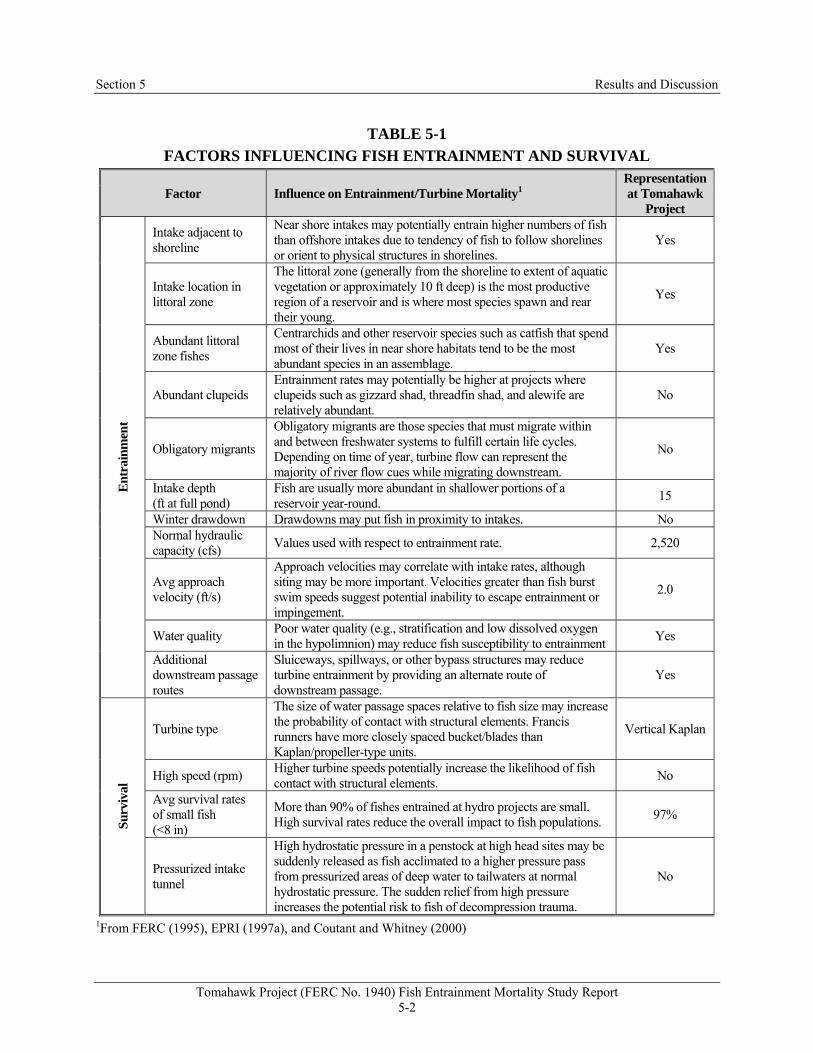
Table 5-1 provides a description of factors known to increase the risk of entrainment and turbine
survival, and their representation at the Project. The open water intake is adjacent the right
embankment, where relatively shallow depths (10-15 ft) occur in the immediate forebay. This
suggests that shallow water species, such as sunfish, may be more susceptible to entrainment.
Centrarchid species composition and abundance is high in Lake Mohawksin, and no clupeids are
present. There are no obligatory migrants or diadromous fish species in the Wisconsin River that
could be susceptible to entrainment. Several species may exhibit long-distance movements
during spawning seasons, but these are restricted to freshwaters (potadromy) and are generally in
the upstream direction away from the intakes (University of Wisconsin Sea Grant Institute 2014).
As presented in this section and documented during entrainment studies at other projects in the
Wisconsin River (EPRI 1997a), fish less than 8 in long typically constitute the majority of
entrainment. As discussed below, on average, these size groups have an immediate survival rate
of 97% through the Project’s Kaplan turbines.
Some studies suggest that a strongly stratified reservoir with an anoxic hypolimnion and deep
intake may decrease entrainment risk. Fish will not inhabit these anoxic conditions, and thus will
not be in proximity to the intakes. Likewise, fish concentrated in the epilimnion of a stratified
reservoir with an upper level intake may increase entrainment risk. Dissolved oxygen and
temperature data collected by the Citizen Lake Monitoring Network during 2008 indicate that the
lake stratifies during the summer and aquatic life would generally be supported in the higher
elevations of the waterbody.
Section 5 Results and Discussion
Tomahawk Project (FERC No. 1940) Fish Entrainment Mortality Study Report 5-2
TABLE 5-1 FACTORS INFLUENCING FISH ENTRAINMENT AND SURVIVAL
Factor Influence on Entrainment/Turbine Mortality1 Representation at Tomahawk
Project
Ent
rain
men
t
Intake adjacent to shoreline
Near shore intakes may potentially entrain higher numbers of fish than offshore intakes due to tendency of fish to follow shorelines or orient to physical structures in shorelines.
Yes
Intake location in littoral zone
The littoral zone (generally from the shoreline to extent of aquatic vegetation or approximately 10 ft deep) is the most productive region of a reservoir and is where most species spawn and rear their young.
Yes
Abundant littoral zone fishes
Centrarchids and other reservoir species such as catfish that spend most of their lives in near shore habitats tend to be the most abundant species in an assemblage.
Yes
Abundant clupeids Entrainment rates may potentially be higher at projects where clupeids such as gizzard shad, threadfin shad, and alewife are relatively abundant.
No
Obligatory migrants
Obligatory migrants are those species that must migrate within and between freshwater systems to fulfill certain life cycles. Depending on time of year, turbine flow can represent the majority of river flow cues while migrating downstream.
No
Intake depth (ft at full pond)
Fish are usually more abundant in shallower portions of a reservoir year-round.
15
Winter drawdown Drawdowns may put fish in proximity to intakes. No Normal hydraulic capacity (cfs)
Values used with respect to entrainment rate. 2,520
Avg approach velocity (ft/s)
Approach velocities may correlate with intake rates, although siting may be more important. Velocities greater than fish burst swim speeds suggest potential inability to escape entrainment or impingement.
2.0
Water quality Poor water quality (e.g., stratification and low dissolved oxygen in the hypolimnion) may reduce fish susceptibility to entrainment
Yes
Additional downstream passage routes
Sluiceways, spillways, or other bypass structures may reduce turbine entrainment by providing an alternate route of downstream passage.
Yes
Surv
ival
Turbine type
The size of water passage spaces relative to fish size may increase the probability of contact with structural elements. Francis runners have more closely spaced bucket/blades than Kaplan/propeller-type units.
Vertical Kaplan
High speed (rpm) Higher turbine speeds potentially increase the likelihood of fish contact with structural elements.
No
Avg survival rates of small fish (<8 in)
More than 90% of fishes entrained at hydro projects are small. High survival rates reduce the overall impact to fish populations.
97%
Pressurized intake tunnel
High hydrostatic pressure in a penstock at high head sites may be suddenly released as fish acclimated to a higher pressure pass from pressurized areas of deep water to tailwaters at normal hydrostatic pressure. The sudden relief from high pressure increases the potential risk to fish of decompression trauma.
No
1From FERC (1995), EPRI (1997a), and Coutant and Whitney (2000)
Section 5 Results and Discussion
Tomahawk Project (FERC No. 1940) Fish Entrainment Mortality Study Report 5-3
5.2 Intake Velocities, Trashrack Exclusion, and Impingement
The mean intake approach velocity at the Project was calculated by dividing the total hydraulic
capacity of the units (2,520 cfs) by the total gross area of the trash rack (1,260.0 square-feet).
This resulted in a velocity of 2.0 feet per second (ft/s). The mean through-screen velocity at the
Project was calculated by dividing the total hydraulic capacity of the units (2,520 cfs) by the total
clear area of the trash rack (1,073.5 square-feet). This resulted in a velocity of 2.3 feet per second
(ft/s). Bluegill, one of the most abundant species in the Project area, have burst swim speeds
ranging from 1.8 ft/s to 4.3 ft/s depending on life stage (Table 5-2). This suggests that larger
bluegill would likely be able to avoid impingement and entrainment. Not all of the species
identified in Table 4-1 have swim speed data available in the scientific literature researched for
this study. Those available for important game, rough, and forage species are provided in
Appendix B and Table 5-2. Although the majority of available burst swim speeds suggest
avoidance capability, fish behavior in front of an intake structure can be variable and
unpredictable (Odeh 2000; Bell 1981). Individuals may volitionally follow the intake flow
through the trashracks, swim against the current and hold in the forebay, actively swim in front
of the intake without being entrained or impinged, dart away from the intake, and/or
inadvertently become entrained/impinged due to the inability to escape.
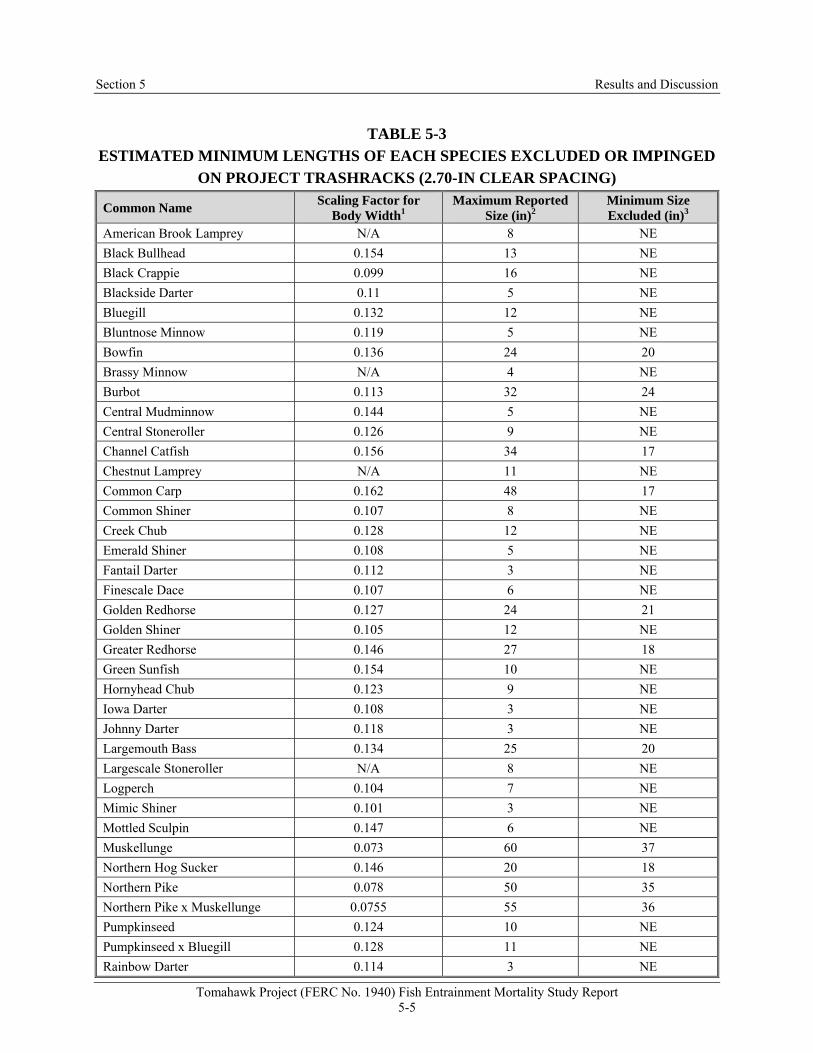
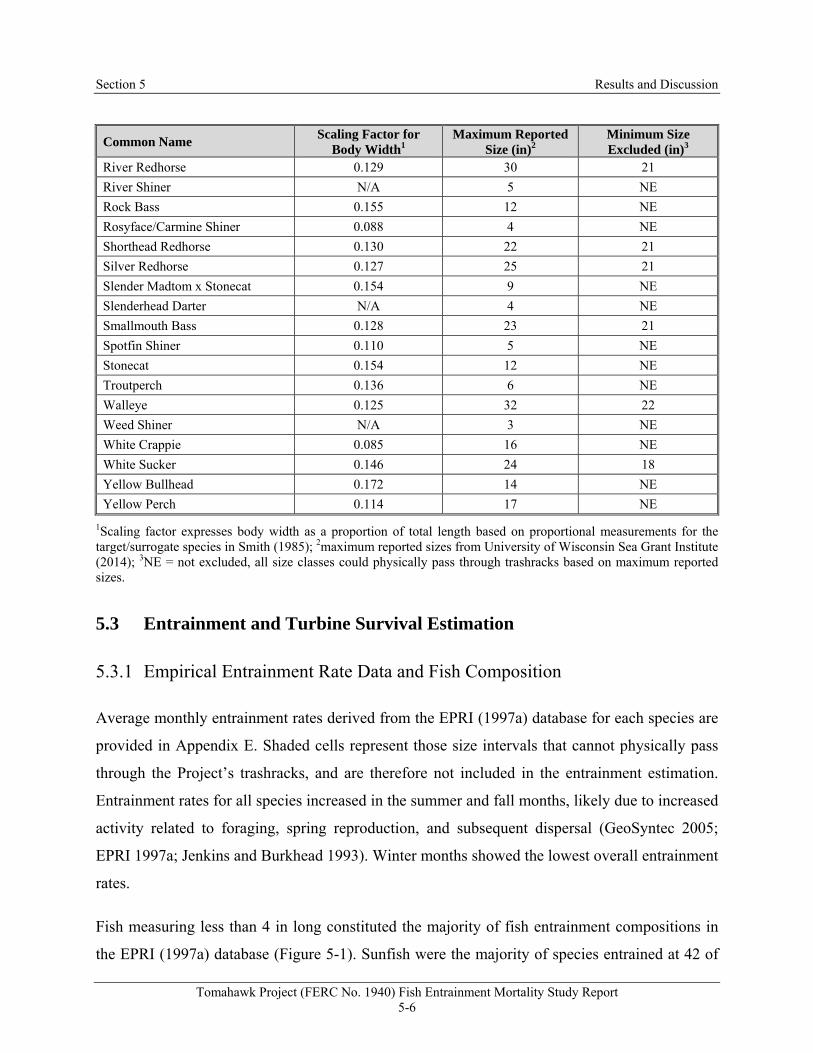
Proportional estimates of body width to total length (scaling factor) for all species in this study
are provided in Table 5-3. This proportional measurement was used to determine the minimum
length of each species excluded or impinged on the trashracks. Surrogates or groups/guilds of
fish were used to represent certain target species if data were not available in Smith (1985).
Maximum reported sizes for each species are also included in Table 5-3.
Based on this assessment, the largest sized target species that could physically pass through the
trashracks at the Project is a 36-in muskellunge. A fish this large would likely be capable of
avoiding entrainment unless volitional movement occurred through the intake. Only those fish
with sizes greater than the minimum reported size excluded are at risk of impingement (e.g.,
largemouth bass 20-in or greater could become impinged on the trashracks). The majority of
species would not be excluded (NE) or impinged on the trashracks because their maximum
reported sizes are smaller than the minimum estimated exclusion size (Table 5-3). Entrainment
Section 5 Results and Discussion
Tomahawk Project (FERC No. 1940) Fish Entrainment Mortality Study Report 5-4
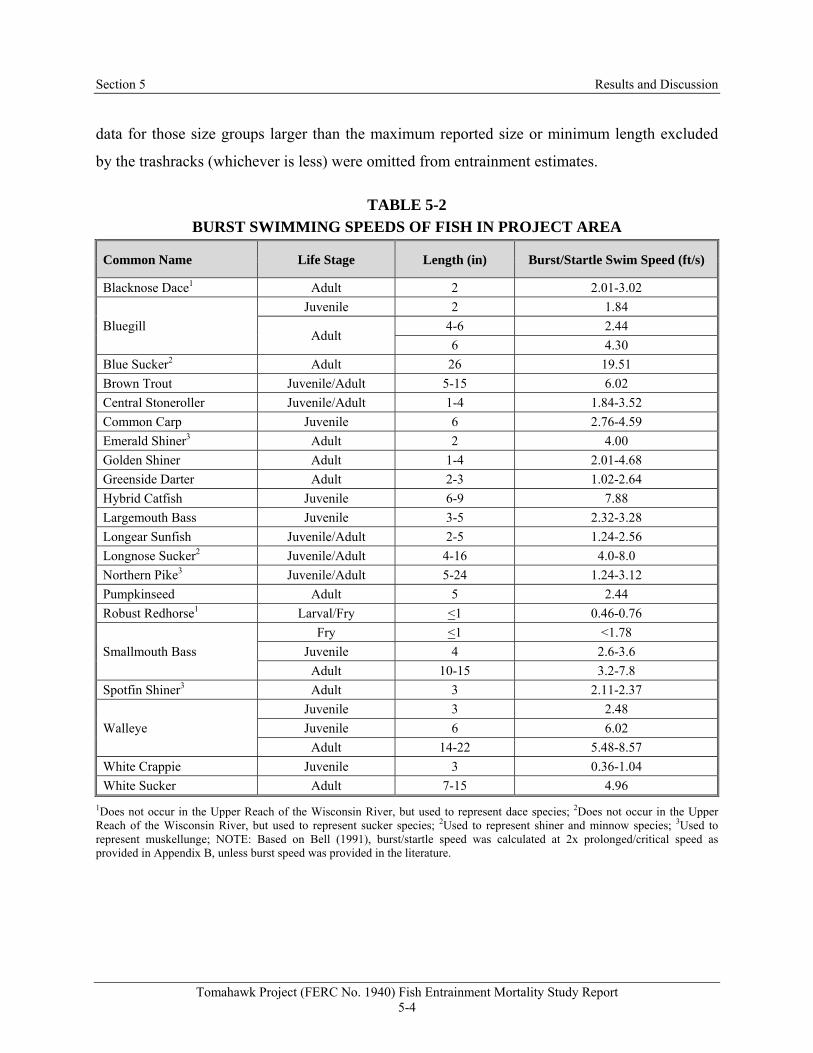
data for those size groups larger than the maximum reported size or minimum length excluded
by the trashracks (whichever is less) were omitted from entrainment estimates.
TABLE 5-2 BURST SWIMMING SPEEDS OF FISH IN PROJECT AREA
Common Name Life Stage Length (in) Burst/Startle Swim Speed (ft/s)
Blacknose Dace1 Adult 2 2.01-3.02
Bluegill
Juvenile 2 1.84
Adult 4-6 2.44
6 4.30
Blue Sucker2 Adult 26 19.51
Brown Trout Juvenile/Adult 5-15 6.02
Central Stoneroller Juvenile/Adult 1-4 1.84-3.52
Common Carp Juvenile 6 2.76-4.59
Emerald Shiner3 Adult 2 4.00
Golden Shiner Adult 1-4 2.01-4.68
Greenside Darter Adult 2-3 1.02-2.64
Hybrid Catfish Juvenile 6-9 7.88
Largemouth Bass Juvenile 3-5 2.32-3.28
Longear Sunfish Juvenile/Adult 2-5 1.24-2.56
Longnose Sucker2 Juvenile/Adult 4-16 4.0-8.0
Northern Pike3 Juvenile/Adult 5-24 1.24-3.12
Pumpkinseed Adult 5 2.44
Robust Redhorse1 Larval/Fry <1 0.46-0.76
Smallmouth Bass
Fry <1 <1.78
Juvenile 4 2.6-3.6
Adult 10-15 3.2-7.8
Spotfin Shiner3 Adult 3 2.11-2.37
Walleye
Juvenile 3 2.48
Juvenile 6 6.02
Adult 14-22 5.48-8.57
White Crappie Juvenile 3 0.36-1.04
White Sucker Adult 7-15 4.96
1Does not occur in the Upper Reach of the Wisconsin River, but used to represent dace species; 2Does not occur in the Upper Reach of the Wisconsin River, but used to represent sucker species; 2Used to represent shiner and minnow species; 3Used to represent muskellunge; NOTE: Based on Bell (1991), burst/startle speed was calculated at 2x prolonged/critical speed as provided in Appendix B, unless burst speed was provided in the literature.
Section 5 Results and Discussion
Tomahawk Project (FERC No. 1940) Fish Entrainment Mortality Study Report 5-5
TABLE 5-3 ESTIMATED MINIMUM LENGTHS OF EACH SPECIES EXCLUDED OR IMPINGED
ON PROJECT TRASHRACKS (2.70-IN CLEAR SPACING)
Common Name Scaling Factor for
Body Width1 Maximum Reported
Size (in)2 Minimum Size Excluded (in)3
American Brook Lamprey N/A 8 NE
Black Bullhead 0.154 13 NE
Black Crappie 0.099 16 NE
Blackside Darter 0.11 5 NE
Bluegill 0.132 12 NE
Bluntnose Minnow 0.119 5 NE
Bowfin 0.136 24 20
Brassy Minnow N/A 4 NE
Burbot 0.113 32 24
Central Mudminnow 0.144 5 NE
Central Stoneroller 0.126 9 NE
Channel Catfish 0.156 34 17
Chestnut Lamprey N/A 11 NE
Common Carp 0.162 48 17
Common Shiner 0.107 8 NE
Creek Chub 0.128 12 NE
Emerald Shiner 0.108 5 NE
Fantail Darter 0.112 3 NE
Finescale Dace 0.107 6 NE
Golden Redhorse 0.127 24 21
Golden Shiner 0.105 12 NE
Greater Redhorse 0.146 27 18
Green Sunfish 0.154 10 NE
Hornyhead Chub 0.123 9 NE
Iowa Darter 0.108 3 NE
Johnny Darter 0.118 3 NE
Largemouth Bass 0.134 25 20
Largescale Stoneroller N/A 8 NE
Logperch 0.104 7 NE
Mimic Shiner 0.101 3 NE
Mottled Sculpin 0.147 6 NE
Muskellunge 0.073 60 37
Northern Hog Sucker 0.146 20 18
Northern Pike 0.078 50 35
Northern Pike x Muskellunge 0.0755 55 36
Pumpkinseed 0.124 10 NE
Pumpkinseed x Bluegill 0.128 11 NE
Rainbow Darter 0.114 3 NE
Section 5 Results and Discussion
Tomahawk Project (FERC No. 1940) Fish Entrainment Mortality Study Report 5-6
Common Name Scaling Factor for
Body Width1 Maximum Reported
Size (in)2 Minimum Size Excluded (in)3
River Redhorse 0.129 30 21
River Shiner N/A 5 NE
Rock Bass 0.155 12 NE
Rosyface/Carmine Shiner 0.088 4 NE
Shorthead Redhorse 0.130 22 21
Silver Redhorse 0.127 25 21
Slender Madtom x Stonecat 0.154 9 NE
Slenderhead Darter N/A 4 NE
Smallmouth Bass 0.128 23 21
Spotfin Shiner 0.110 5 NE
Stonecat 0.154 12 NE
Troutperch 0.136 6 NE
Walleye 0.125 32 22
Weed Shiner N/A 3 NE
White Crappie 0.085 16 NE
White Sucker 0.146 24 18
Yellow Bullhead 0.172 14 NE
Yellow Perch 0.114 17 NE
1Scaling factor expresses body width as a proportion of total length based on proportional measurements for the target/surrogate species in Smith (1985); 2maximum reported sizes from University of Wisconsin Sea Grant Institute (2014); 3NE = not excluded, all size classes could physically pass through trashracks based on maximum reported sizes.
5.3 Entrainment and Turbine Survival Estimation
5.3.1 Empirical Entrainment Rate Data and Fish Composition
Average monthly entrainment rates derived from the EPRI (1997a) database for each species are
provided in Appendix E. Shaded cells represent those size intervals that cannot physically pass
through the Project’s trashracks, and are therefore not included in the entrainment estimation.
Entrainment rates for all species increased in the summer and fall months, likely due to increased
activity related to foraging, spring reproduction, and subsequent dispersal (GeoSyntec 2005;
EPRI 1997a; Jenkins and Burkhead 1993). Winter months showed the lowest overall entrainment
rates.
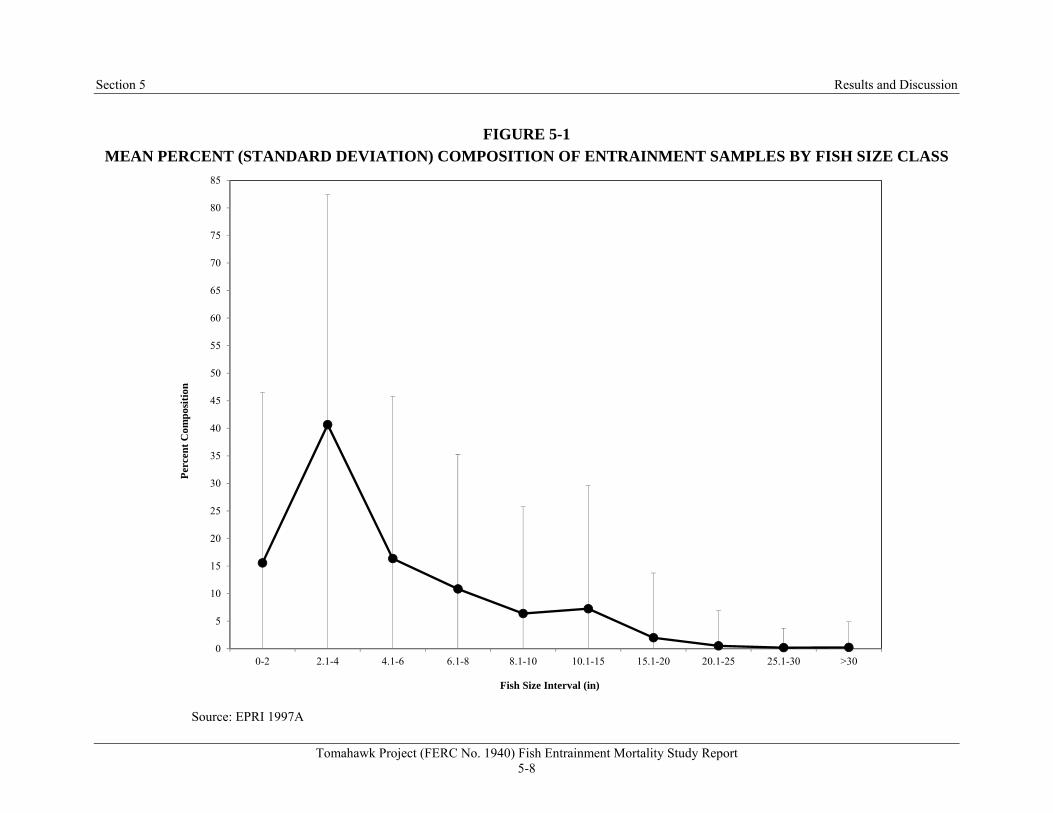
Fish measuring less than 4 in long constituted the majority of fish entrainment compositions in
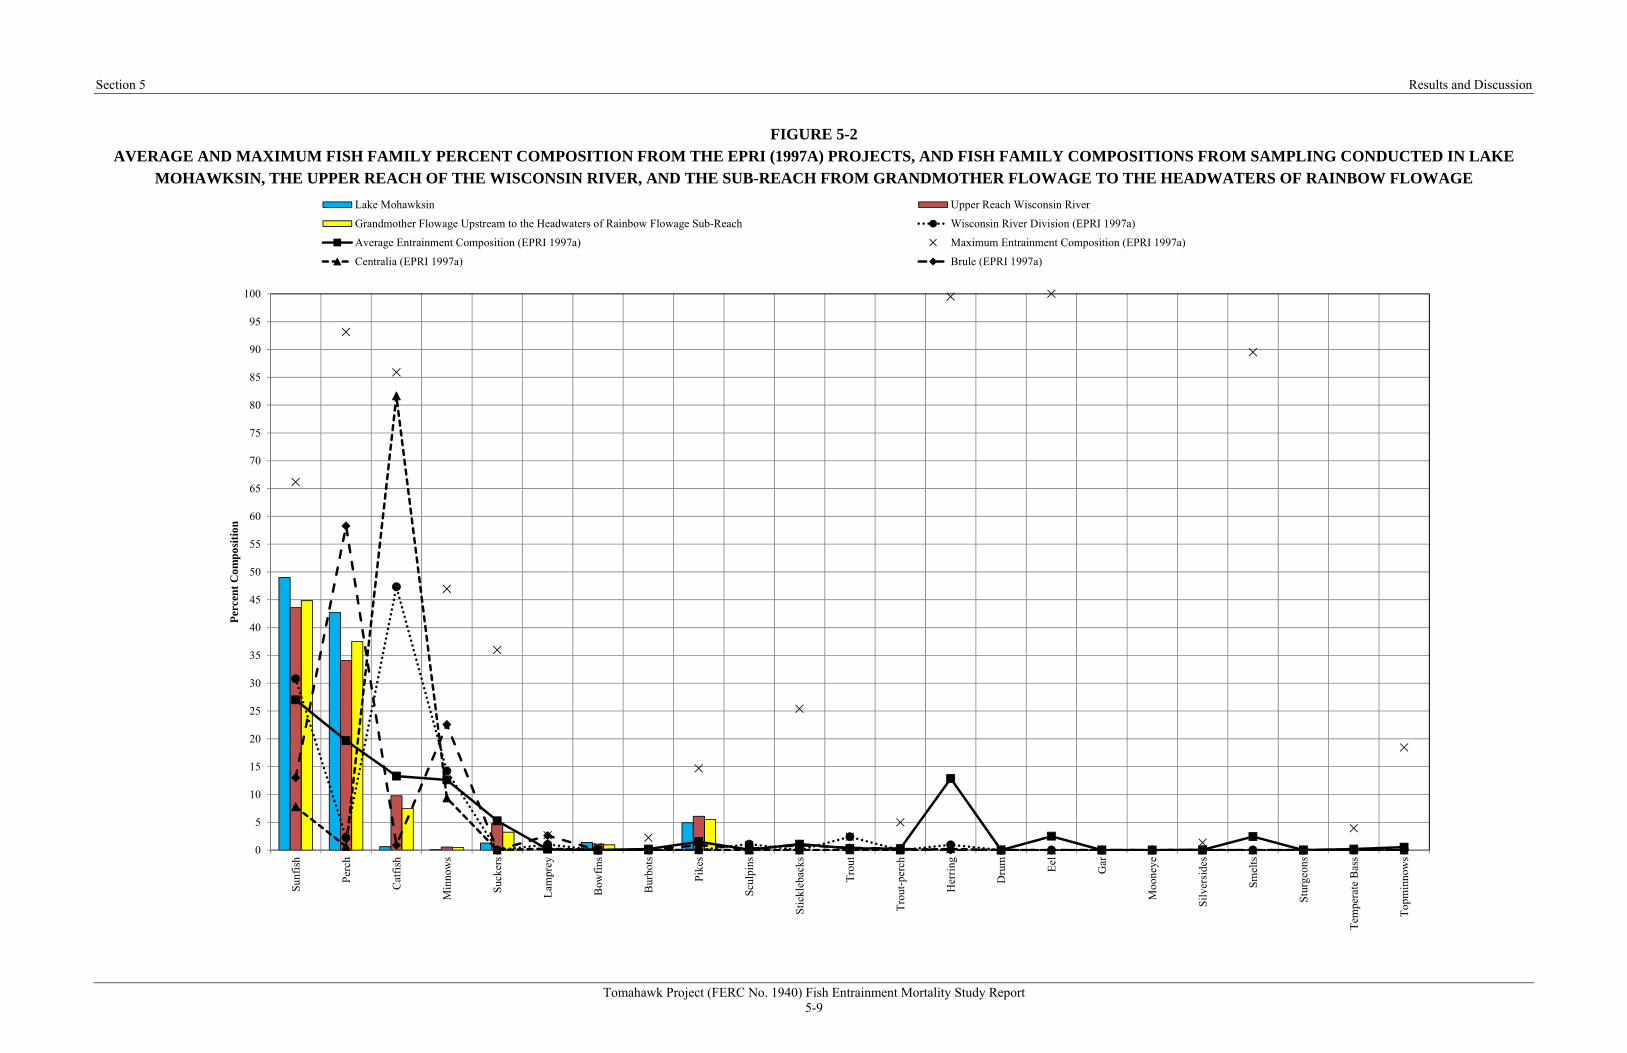
the EPRI (1997a) database (Figure 5-1). Sunfish were the majority of species entrained at 42 of
Section 5 Results and Discussion
Tomahawk Project (FERC No. 1940) Fish Entrainment Mortality Study Report 5-7
the 43 developments included in the database, representing on average 30% of the netted species
compositions (Figure 5-2). Sunfish are also common in Lake Mohawksin and the Upper Reach
of the Wisconsin River and, along with the perch family, comprise the majority of the fish
community (Figure 5-2). For those species occurring in the Project area, bluegill, yellow perch,
rock bass and white sucker entrainment rates are the highest in the database. Family
compositional data from the Wisconsin River Division, Centralia, and Brule projects are also
included in Figure 5-2. Studies at the mainstem Wisconsin River projects found high entrainment
rates of catfish; however, catfish are rare to absent in the Upper Reach of the Wisconsin River
(Lyons 2005).
Section 5 Results and Discussion
Tomahawk Project (FERC No. 1940) Fish Entrainment Mortality Study Report 5-8
FIGURE 5-1 MEAN PERCENT (STANDARD DEVIATION) COMPOSITION OF ENTRAINMENT SAMPLES BY FISH SIZE CLASS
Tomahawk Project (FERC No. 1940) Fish Entrainment Mortality Study Report 5-9
FIGURE 5-2 AVERAGE AND MAXIMUM FISH FAMILY PERCENT COMPOSITION FROM THE EPRI (1997A) PROJECTS, AND FISH FAMILY COMPOSITIONS FROM SAMPLING CONDUCTED IN LAKE
MOHAWKSIN, THE UPPER REACH OF THE WISCONSIN RIVER, AND THE SUB-REACH FROM GRANDMOTHER FLOWAGE TO THE HEADWATERS OF RAINBOW FLOWAGE
0
5
10
15
20
25
30
35
40
45
50
55
60
65
70
75
80
85
90
95
100S
unfi
sh
Per
ch
Cat
fish
Min
now
s
Suc
kers
Lam
prey
Bow
fins
Bur
bots
Pike
s
Scu
lpin
s
Sti
ckle
back
s
Tro
ut
Tro
ut-p
erch
Her
ring
Dru
m
Eel
Gar
Moo
neye
Sil
vers
ides
Sm
elts
Stu
rgeo
ns
Tem
pera
te B
ass
Top
min
now
s
Per
cen
t C
omp
osit
ion
Lake Mohawksin Upper Reach Wisconsin River
Grandmother Flowage Upstream to the Headwaters of Rainbow Flowage Sub-Reach Wisconsin River Division (EPRI 1997a)
Average Entrainment Composition (EPRI 1997a) Maximum Entrainment Composition (EPRI 1997a)
Centralia (EPRI 1997a) Brule (EPRI 1997a)
Section 5 Results and Discussion
Tomahawk Project (FERC No. 1940) Fish Entrainment Mortality Study Report 5-10
5.3.2 Tomahawk Generation and Entrainment Estimates
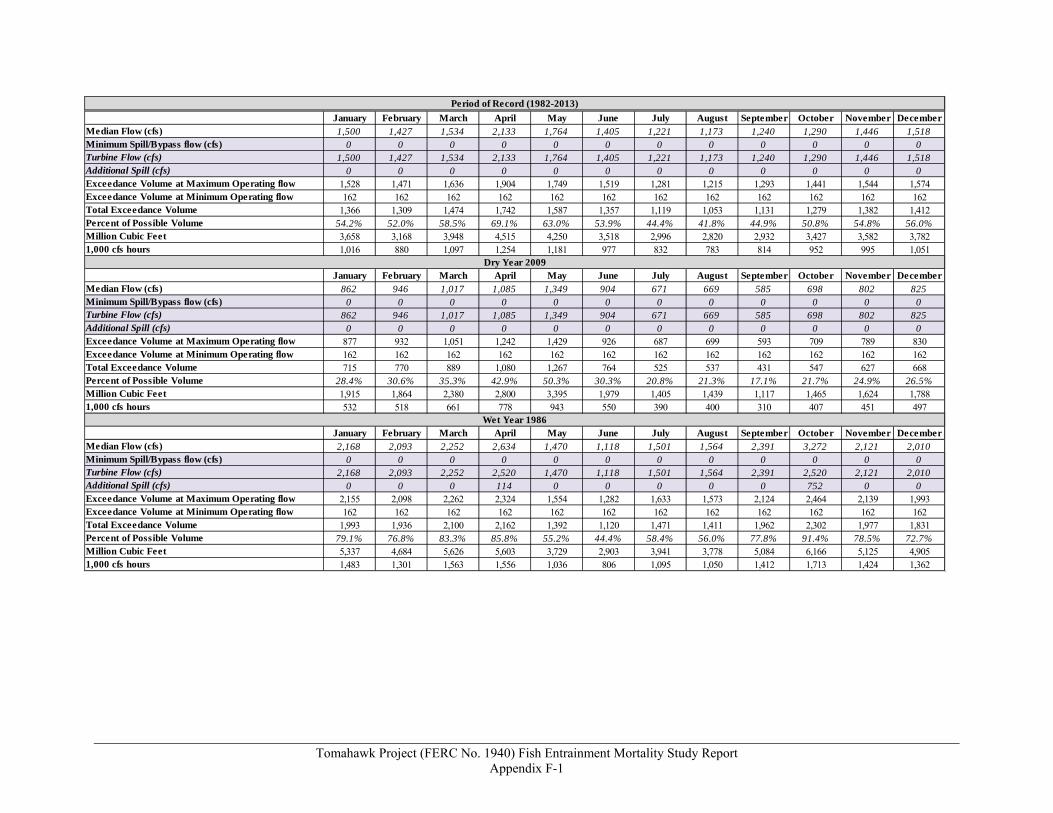
Analysis of the 31-year hydrology dataset and Project operations resulted in monthly generation
amounts (1,000 cfs-hrs) for the POR (1982-2013), including the driest (2009) and wettest (1986)
water years on record (Table 5-4). The annual average river flow for the dry (825 cfs) and wet
(2,078 cfs) water year is exceeded approximately 87% and 21% of the time, respectively. The
total, annual generation estimated at the Project for an average water year (POR) was 11,832
(1,000 cfs-hrs) with a range of 6,437 to 15,800 based on the dry and wet years, respectively
(Table 5-4). This equates to 42,596 million cubic feet (mcf) of water, with a range of 23,172 to
56,880 mcf (Appendix F). It should be noted that the Project is a limited peaking facility and this
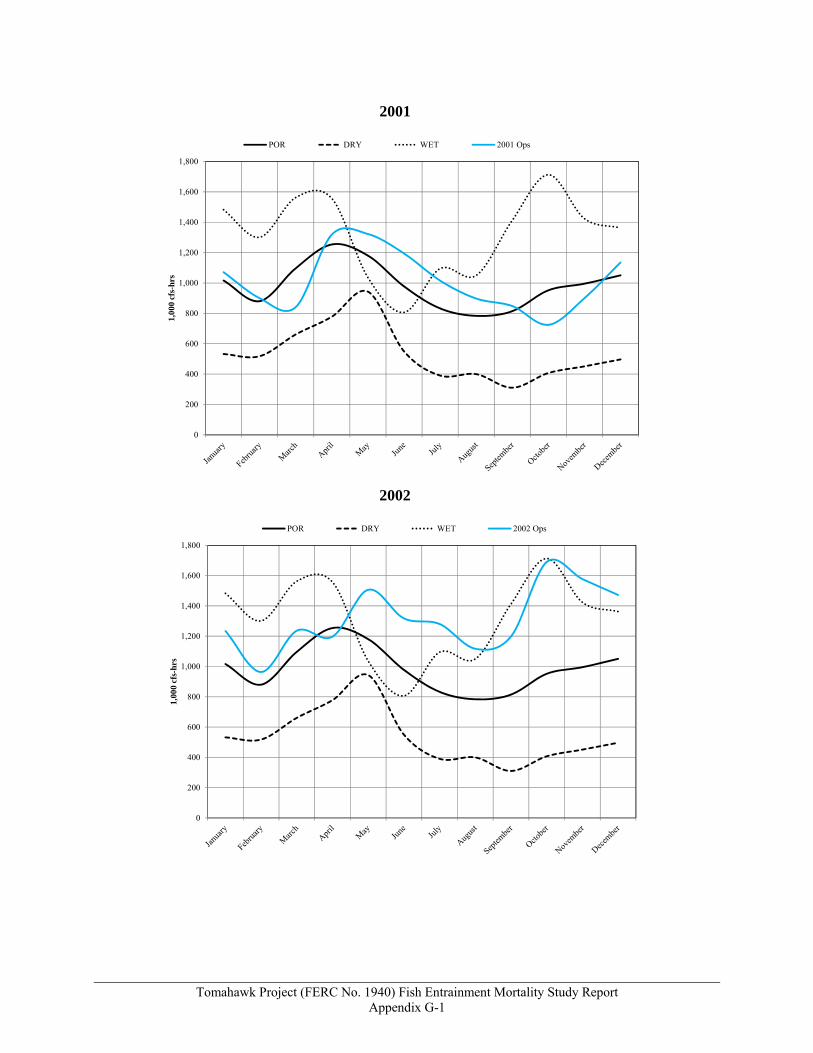
assessment assumes 24-hour operation of the turbines as inflow allows. Comparisons with
operation records obtained from 2001 to 2013 suggest the range of generation estimated using
the POR, dry, and wet water years captures actual operating ranges, with slight variations from
year to year (Appendix G).
Monthly generation amounts were multiplied by monthly entrainment rates for each target
species and size interval, and the species’ associated RC% in Table 4-1, resulting in project-
specific monthly estimates of entrainment. For example, in October (for the POR) the
entrainment estimate for 2.1-in to 4-in yellow perch was calculated by the following equation:
Tomahawk Project (FERC No. 1940) Fish Entrainment Mortality Study Report 5-24
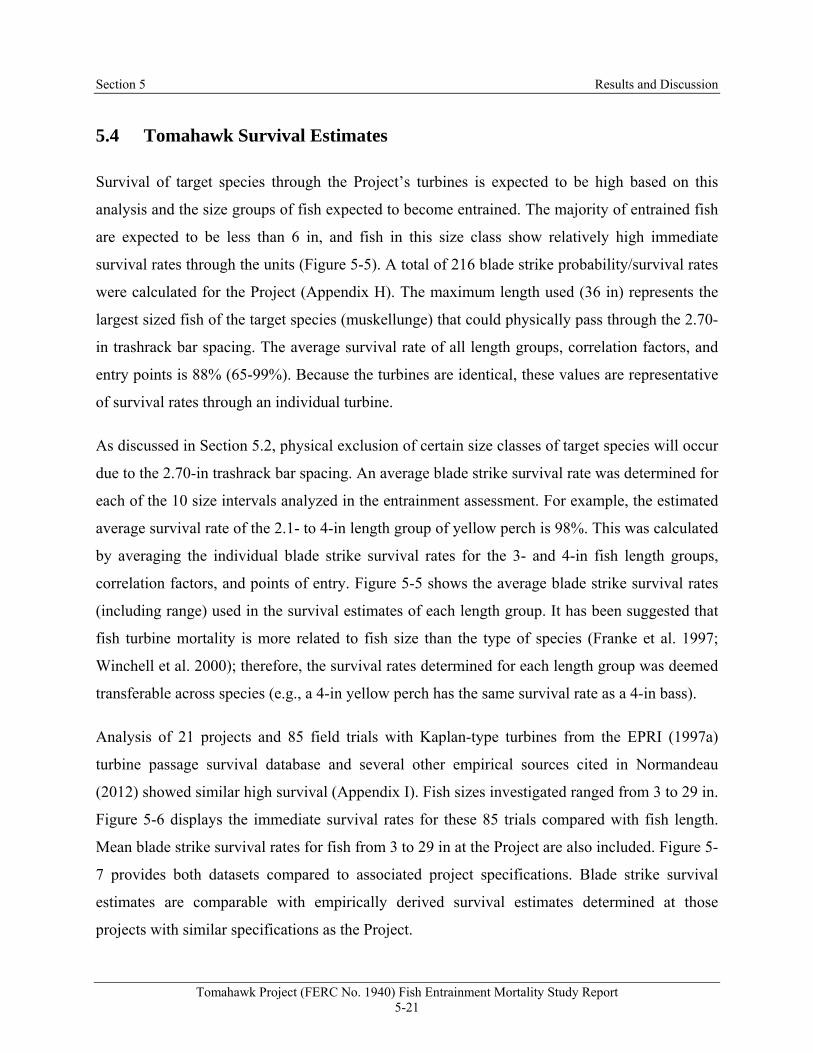
FIGURE 5-6 IMMEDIATE KAPLAN TURBINE SURVIVAL RATES DERIVED FROM EMPIRICAL BALLOON TAG STUDIES FROM VARIOUS SOURCES1 AND MEAN BLADE STRIKE SURVIVAL AT THE PROJECT; FISH SIZES RANGE
FROM 3 TO 29 IN LONG FOR BOTH
1EPRI (1997a) and several sources cited in Normandeau (2012)
70
75
80
85
90
95
100
105
0 2 4 6 8 10 12 14 16 18 20 22 24 26 28 30 32
Est
imat
ed S
urvi
val
(%)
Fish Size (in)
Empirical Data Tomahawk Blade Strike
Section 5 Results and Discussion
Tomahawk Project (FERC No. 1940) Fish Entrainment Mortality Study Report 5-25
FIGURE 5-7 IMMEDIATE KAPLAN TURBINE SURVIVAL RATES DERIVED FROM EMPIRICAL BALLOON TAG STUDIES FROM VARIOUS SOURCES1 AND BLADE STRIKE SURVIVAL RANGE AT THE PROJECT COMPARED WITH
ASSOCIATED PROJECT SPECIFICATIONS; FISH SIZES RANGE FROM 3 TO 29 IN LONG FOR BOTH
1EPRI (1997a) and several sources cited in Normandeau (2012)
Est
imat
edS
urv
ival
(%
)
70
75
80
85
90
95
100
105
2 4 6 8 10 12 14 16 18 20 22 24 26 28 30
Runner Diameter (ft)
Empirical Data Tomahawk Blade Strike
70
75
80
85
90
95
100
105
0 4,000 8,000 12,000 16,000 20,000
Rated Flow (cfs)
Empirical Data Tomahawk Blade Strike
70
75
80
85
90
95
100
105
10 20 30 40 50 60 70 80 90 100 110
Rated Head (ft)
Empirical Data Tomahawk Blade Strike
70
75
80
85
90
95
100
105
50 75 100 125 150 175 200 225 250
Rated Speed (rpm)
Empirical Data Tomahawk Blade Strike
Section 5 Results and Discussion
Tomahawk Project (FERC No. 1940) Fish Entrainment Mortality Study Report 5-26
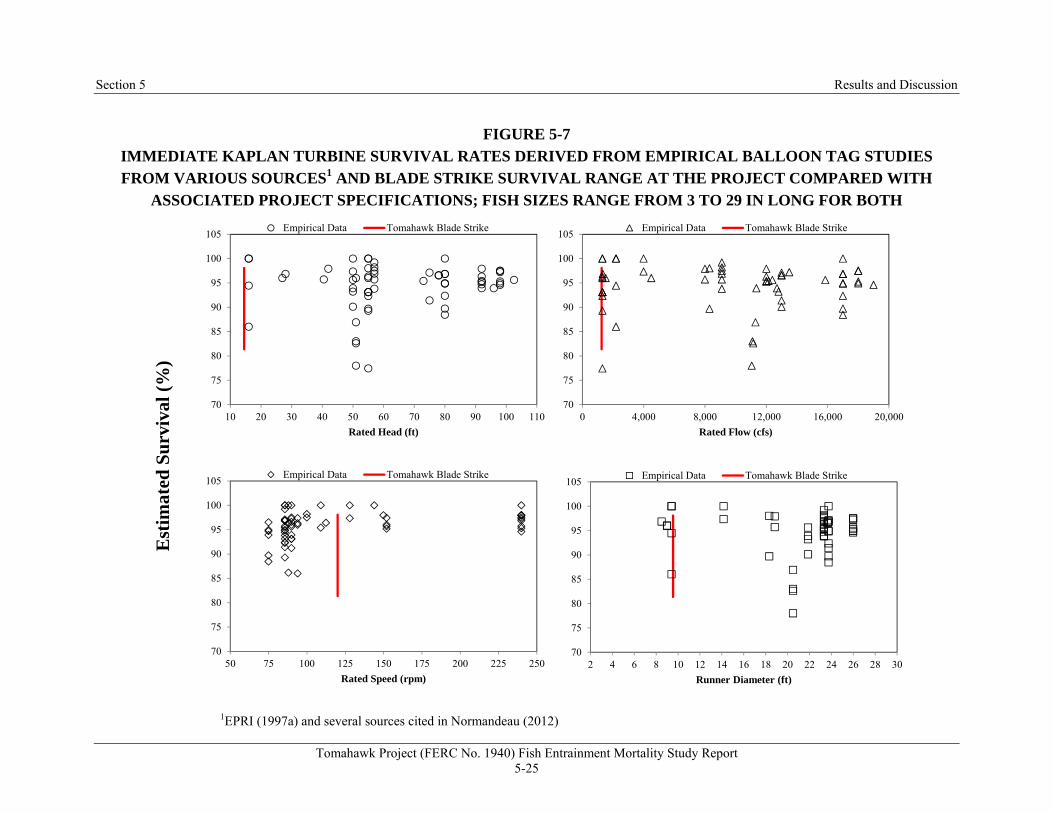
FIGURE 5-8 COMBINED MONTHLY MORTALITY ESTIMATES FOR ALL SPECIES AND ASSOCIATED GENERATION
Note min and max represent dry and wet hydrology estimates.
0
100
200
300
400
500
600
700
800
900
1,000
0
500
1,000
1,500
2,000
2,500
3,000
3,500
4,000
4,500
5,000
January February March April May June July August September October November December
Webb, P. W. 1998. Swimming. In The Physiology of Fishes (ed. D. H. Evans), pp.3 -24. Boca
Raton: CRC Press.
Winchell, F., S. Amaral, and D. Dixon. 2000. Hydroelectric turbine entrainment and survival
database: an alternative to field studies. HydroVision Conference, August 8-11, 2000,
Charlotte, North Carolina.
WDNR Fish Mapping Application. 2014. Wisconsin Department of Natural Resources map of
distribution of WI fish species. https://cida.usgs.gov/wdnr_fishmap/map/. Accessed in
May 2014.
Wisconsin Public Service Corporation. 2012. Pre-Application Document. Tomahawk
Hydroelectric Project (FERC No. 1940). September 2012.
Tomahawk Project (FERC No. 1940) Fish Entrainment Mortality Study Report Appendices
APPENDICES
Tomahawk Project (FERC No. 1940) Fish Entrainment Mortality Study Report Appendix A
APPENDIX A
FISH SPECIES COLLECTED IN THE UPPER REACH OF THE
WISCONSIN RIVER
Tomahawk Project (FERC No. 1940) Fish Entrainment Mortality Study Report Appendix A-1
1"Upper Reach" of the Wisconsin River defined by Lyons (2005) and extends from Wausau Dam upstream to Otter Rapids Dam (114 river miles); 2Total number of fish, or 'N' represents combined catch from multiple years (2000 to present) of collections for most water bodies, as reported in WDNR Fish Mapping Application (2014)
N RC% N RC% N RC% N RC% N RC% N RC% N RC% N RC% N RC% N RC% N RC% N RC% N RC% N RC% N RC% N RC% N RC% N RC% N RC%
Wisconsin River Upstream from Wausau Dam at Confluence with
Trappe River
Wisconsin River Upstream from Wausau Dam Near Brokaw, WI
Wisconsin Upstream from Wausau Dam at
Wausau, WIHat Rapids Flowage
Wisconsin River at Headwaters of Rainbow
Flowage
Wisconsin River at Rainbow Flowage
Tailwaters
Wisconsin River Upstream from Two
Sisters Creek
Wisconsin River Near McNaughton
Wisconsin River Just Upstream from Crescent
Creek
Historcial fish community numbers and their relative composition (RC%) in the "Upper Reach" of the mainstem Wisconsin River (WVDNR 2014)1,2
Total
Alexander LakeWisconsin River
Inbetween Alexander and Merril Dams
Grandfather FlowageWisconsin River
Upstream from Lake Alice at Negro Island
Lake Mohawksin Grandmother FlowageWisconsin River Just
Downstream from Crescent Creek
Common Name Boom LakeRhinelander FlowageRainbow Flowage
Tomahawk Project (FERC No. 1940) Fish Entrainment Mortality Study Report
Appendix B
APPENDIX B
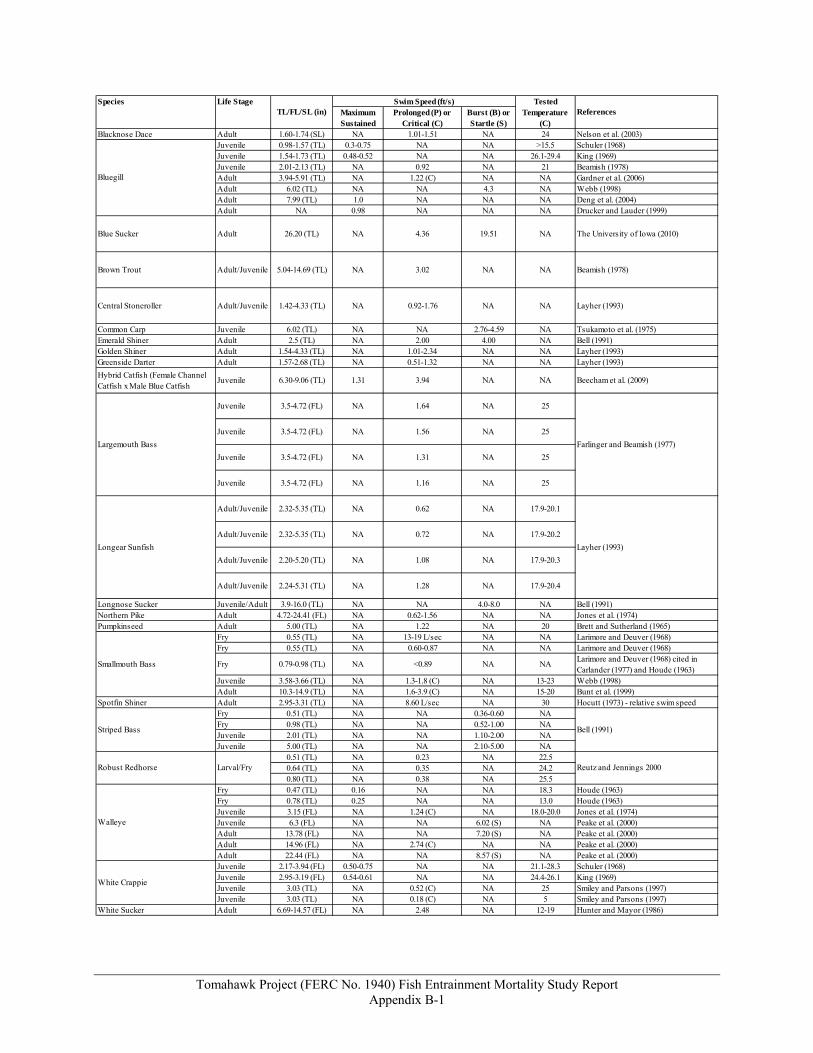
SWIM SPEED DATA
Tomahawk Project (FERC No. 1940) Fish Entrainment Mortality Study Report Appendix B-1
Maximum Sustained
Prolonged (P) or Critical (C)
Burst (B) or Startle (S)
Blacknose Dace Adult 1.60-1.74 (SL) NA 1.01-1.51 NA 24 Nelson et al. (2003)Juvenile 0.98-1.57 (TL) 0.3-0.75 NA NA >15.5 Schuler (1968)Juvenile 1.54-1.73 (TL) 0.48-0.52 NA NA 26.1-29.4 King (1969)Juvenile 2.01-2.13 (TL) NA 0.92 NA 21 Beamish (1978)Adult 3.94-5.91 (TL) NA 1.22 (C) NA NA Gardner et al. (2006)Adult 6.02 (TL) NA NA 4.3 NA Webb (1998)Adult 7.99 (TL) 1.0 NA NA NA Deng et al. (2004)Adult NA 0.98 NA NA NA Drucker and Lauder (1999)
Blue Sucker Adult 26.20 (TL) NA 4.36 19.51 NA The University of Iowa (2010)
Brown Trout Adult/Juvenile 5.04-14.69 (TL) NA 3.02 NA NA Beamish (1978)
Central Stoneroller Adult/Juvenile 1.42-4.33 (TL) NA 0.92-1.76 NA NA Layher (1993)
Common Carp Juvenile 6.02 (TL) NA NA 2.76-4.59 NA Tsukamoto et al. (1975)Emerald Shiner Adult 2.5 (TL) NA 2.00 4.00 NA Bell (1991)Golden Shiner Adult 1.54-4.33 (TL) NA 1.01-2.34 NA NA Layher (1993)Greenside Darter Adult 1.57-2.68 (TL) NA 0.51-1.32 NA NA Layher (1993)
Hybrid Catfish (Female Channel Catfish x Male Blue Catfish
Juvenile 6.30-9.06 (TL) 1.31 3.94 NA NA Beecham et al. (2009)
Juvenile 3.5-4.72 (FL) NA 1.64 NA 25
Juvenile 3.5-4.72 (FL) NA 1.56 NA 25
Juvenile 3.5-4.72 (FL) NA 1.31 NA 25
Juvenile 3.5-4.72 (FL) NA 1.16 NA 25
Adult/Juvenile 2.32-5.35 (TL) NA 0.62 NA 17.9-20.1
Adult/Juvenile 2.32-5.35 (TL) NA 0.72 NA 17.9-20.2
Adult/Juvenile 2.20-5.20 (TL) NA 1.08 NA 17.9-20.3
Adult/Juvenile 2.24-5.31 (TL) NA 1.28 NA 17.9-20.4
Longnose Sucker Juvenile/Adult 3.9-16.0 (TL) NA NA 4.0-8.0 NA Bell (1991)Northern Pike Adult 4.72-24.41 (FL) NA 0.62-1.56 NA NA Jones et al. (1974)Pumpkinseed Adult 5.00 (TL) NA 1.22 NA 20 Brett and Sutherland (1965)
Fry 0.55 (TL) NA 13-19 L/sec NA NA Larimore and Deuver (1968)Fry 0.55 (TL) NA 0.60-0.87 NA NA Larimore and Deuver (1968)
Fry 0.79-0.98 (TL) NA <0.89 NA NALarimore and Deuver (1968) cited in Carlander (1977) and Houde (1963)
Juvenile 3.58-3.66 (TL) NA 1.3-1.8 (C) NA 13-23 Webb (1998)Adult 10.3-14.9 (TL) NA 1.6-3.9 (C) NA 15-20 Bunt et al. (1999)
Spotfin Shiner Adult 2.95-3.31 (TL) NA 8.60 L/sec NA 30 Hocutt (1973) - relative swim speedFry 0.51 (TL) NA NA 0.36-0.60 NAFry 0.98 (TL) NA NA 0.52-1.00 NAJuvenile 2.01 (TL) NA NA 1.10-2.00 NAJuvenile 5.00 (TL) NA NA 2.10-5.00 NA
0.51 (TL) NA 0.23 NA 22.50.64 (TL) NA 0.35 NA 24.20.80 (TL) NA 0.38 NA 25.5
Fry 0.47 (TL) 0.16 NA NA 18.3 Houde (1963)Fry 0.78 (TL) 0.25 NA NA 13.0 Houde (1963)Juvenile 3.15 (FL) NA 1.24 (C) NA 18.0-20.0 Jones et al. (1974)Juvenile 6.3 (FL) NA NA 6.02 (S) NA Peake et al. (2000)Adult 13.78 (FL) NA NA 7.20 (S) NA Peake et al. (2000)Adult 14.96 (FL) NA 2.74 (C) NA NA Peake et al. (2000)Adult 22.44 (FL) NA NA 8.57 (S) NA Peake et al. (2000)Juvenile 2.17-3.94 (FL) 0.50-0.75 NA NA 21.1-28.3 Schuler (1968)Juvenile 2.95-3.19 (FL) 0.54-0.61 NA NA 24.4-26.1 King (1969)Juvenile 3.03 (TL) NA 0.52 (C) NA 25 Smiley and Parsons (1997)Juvenile 3.03 (TL) NA 0.18 (C) NA 5 Smiley and Parsons (1997)
White Sucker Adult 6.69-14.57 (FL) NA 2.48 NA 12-19 Hunter and Mayor (1986)
Reutz and Jennings 2000
Farlinger and Beamish (1977)
Layher (1993)
Bell (1991)
TL/FL/SL (in)Swim Speed (ft/s) Tested
Temperature (C)
ReferencesSpecies
Largemouth Bass
Smallmouth Bass
Walleye
Longear Sunfish
Striped Bass
Robust Redhorse Larval/Fry
Life Stage
White Crappie
Bluegill
Tomahawk Project (FERC No. 1940) Fish Entrainment Mortality Study Report
Appendix C
APPENDIX C
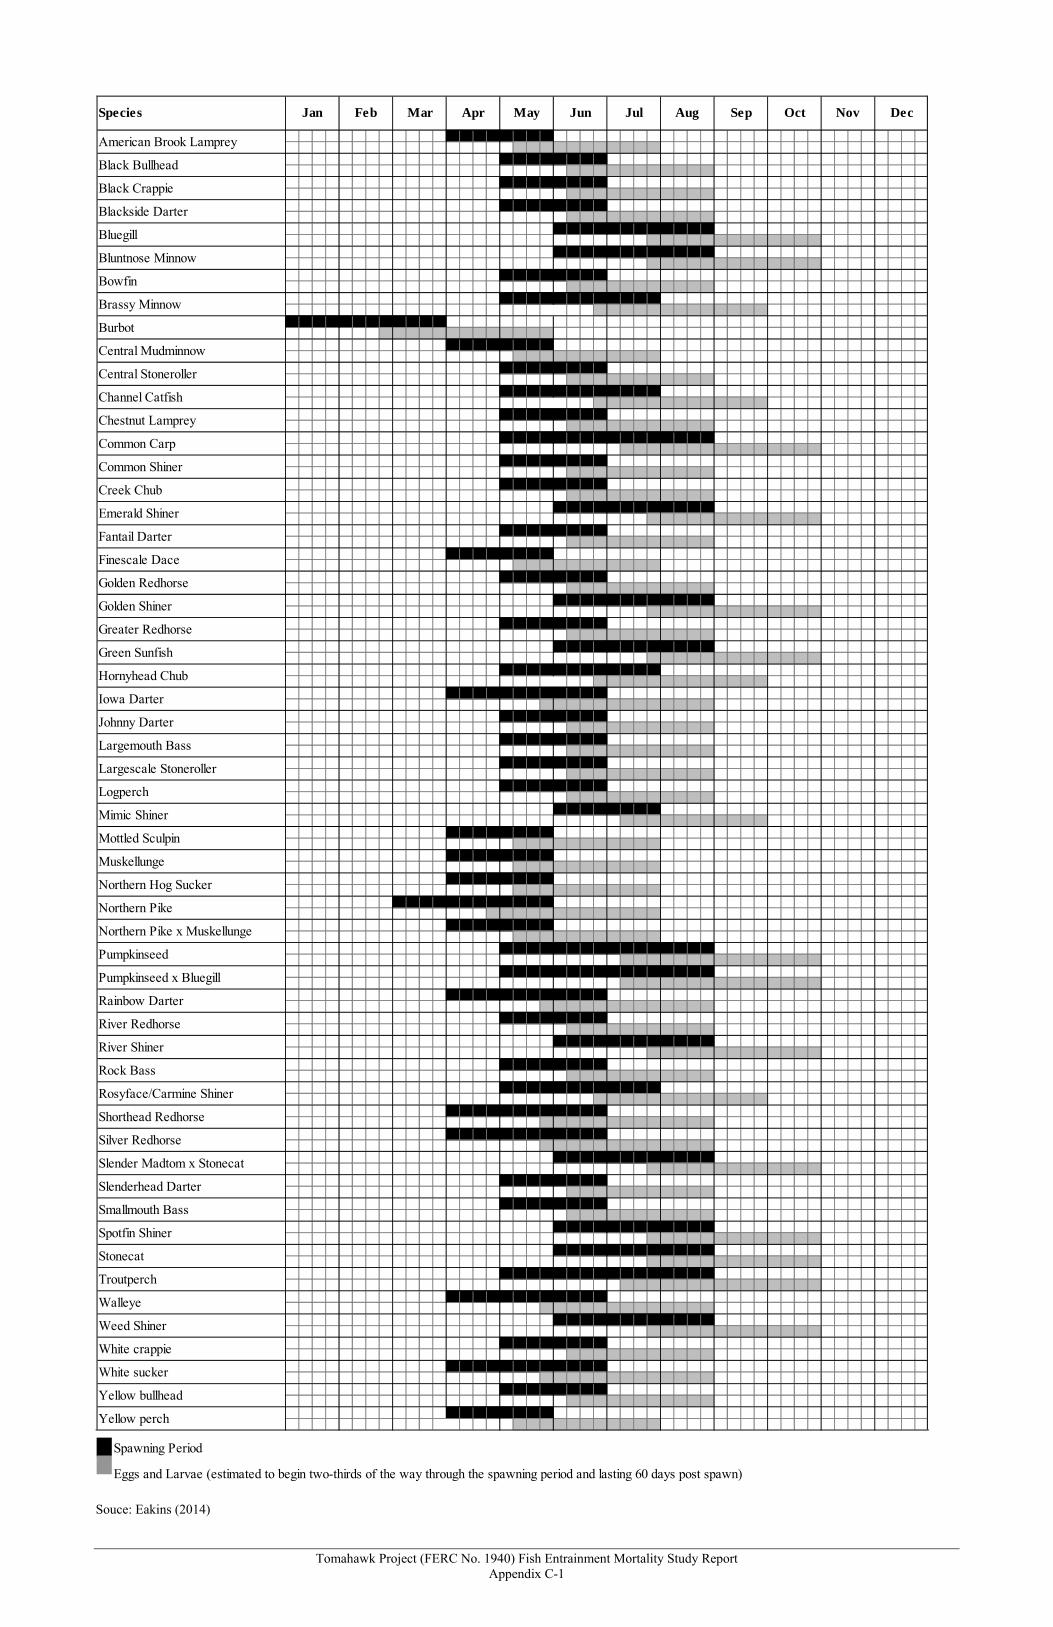
SPAWNING AND EARLY LIFE STAGE PERIODICITIES
Tomahawk Project (FERC No. 1940) Fish Entrainment Mortality Study Report Appendix C-1
Souce: Eakins (2014)
Eggs and Larvae (estimated to begin two-thirds of the way through the spawning period and lasting 60 days post spawn)
River Shiner
Rock Bass
Rosyface/Carmine Shiner
Shorthead Redhorse
Silver Redhorse
Slender Madtom x Stonecat
Slenderhead Darter
White crappie
Stonecat
Troutperch
Walleye
Weed Shiner
Spawning Period
White sucker
Yellow bullhead
Yellow perch
Pumpkinseed
Pumpkinseed x Bluegill
Rainbow Darter
River Redhorse
Smallmouth Bass
Spotfin Shiner
Northern Pike x Muskellunge
Hornyhead Chub
Iowa Darter
Johnny Darter
Largemouth Bass
Largescale Stoneroller
Logperch
Mimic Shiner
Mottled Sculpin
Muskellunge
Northern Hog Sucker
Northern Pike
Brassy Minnow
Burbot
Central Mudminnow
Green Sunfish
Channel Catfish
Chestnut Lamprey
Common Carp
Common Shiner
Creek Chub
Emerald Shiner
Fantail Darter
Finescale Dace
Golden Redhorse
Golden Shiner
Greater Redhorse
Species Jan Feb
Bluntnose Minnow
Bowfin
Mar Apr May
Central Stoneroller
Dec
American Brook Lamprey
Black Bullhead
Black Crappie
Blackside Darter
Bluegill
Jun Jul Aug Sep Oct Nov
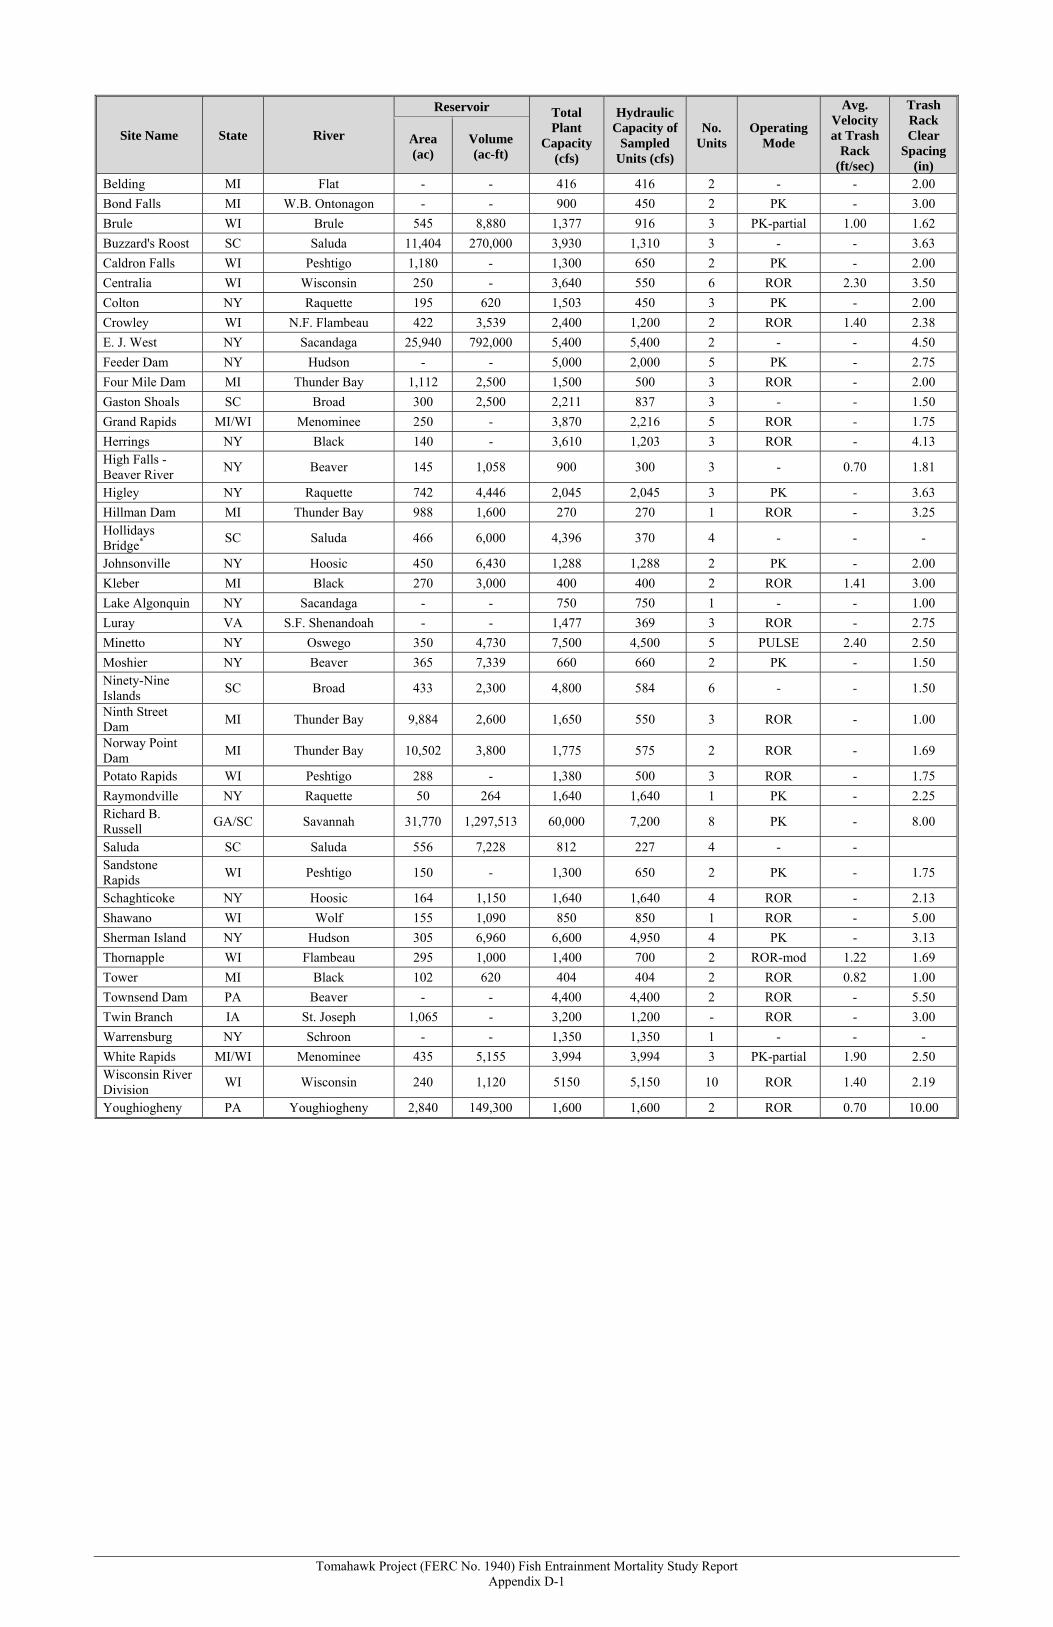
Tomahawk Project (FERC No. 1940) Fish Entrainment Mortality Study Report Appendix D
APPENDIX D
FORTY-THREE HYDROELECTRIC PROJECTS USED IN THE
ENTRAINMENT ASSESSMENT (EPRI 1997A)
Tomahawk Project (FERC No. 1940) Fish Entrainment Mortality Study Report Appendix D-1
Site Name State River
Reservoir Total Plant
Capacity (cfs)
Hydraulic Capacity of
Sampled Units (cfs)
No. Units
Operating Mode
Avg. Velocity at Trash
Rack (ft/sec)
Trash Rack Clear
Spacing (in)
Area (ac)
Volume (ac-ft)
Belding MI Flat - - 416 416 2 - - 2.00
Bond Falls MI W.B. Ontonagon - - 900 450 2 PK - 3.00