18
TomTom Australia & New Zealand Congestion Index
TomTom Australia & New ZealandCongestion Index
TomTom Congestion Index
© 2013 TomTom International BV. All rights reserved. – 1
DisclaimerAll copyrights, commercial rights, design rights, trademarks and other elements considered intellectual property that arepublished in this report are reserved by TomTom International B.V.. You are permitted to use the contents of this reportin online, offline and social media and other publication channels for non-commercial purposes with clear reference toTomTom International B.V. as its main source. You are not permitted to modify, compile, adapt or use any part of thisreport in any way for commercial purposes without a written agreement from TomTom International B.V.. For moreinformation please contact [email protected].
TomTom Congestion Index
© 2013 TomTom International BV. All rights reserved. – 2
TomTom Congestion IndexIt is our mission to get drivers to their destinations faster, safer and greener.
Over the years we have invested in new ideas and technologies with the aim of bringing significant benefits to drivers,businesses and society as a whole.
In 2007 we started a groundbreaking initiative that helped us to understand how we could guide drivers in a better way.We set out to build a more precise view of traffic flow over the entire road network to enable us to give drivers moreexact route information and arrival times.
With the support of millions of TomTom customers we have captured anonymous travel time information in all theterritories where we are active. Rather than relying on theoretical models, we are now able to understand real-life drivingpatterns by time of day, day of week, time of year and around special events. This initiative is unique in that we are ableto capture, evaluate and redistribute vehicle-centric travel information on a global scale.
Over the years we have built the world's largest database of historic travel times and the most detailed and accurate real-time traffic information available. Based on the insights we gained we have developed advanced routing technologies thathelp millions of drivers get to their destinations faster, safer and with lower emissions of greenhouse gases.
Contrary to popular belief, there are often multiple ways to reach a destination and avoid traffic congestion. Finding thefastest route is a complex task. Now, thanks to advanced routing technologies, motorists can drive with dynamicnavigation systems which quickly react and adjust routes to the ever changing traffic situations.
By helping drivers to find a faster route we can also demonstrate that the total available capacity on the road networkincreases. If a small percentage of drivers uses different (and faster) routes, congestion can be alleviated across theentire road network, thereby benefitting all drivers.
By offering a more accurate analysis of traffic flows, we help identify and pinpoint congestion trouble spots moreeffectively. And by routing traffic away from congested areas we can play a key role in easing congestion in cities andurban areas.
Our historical archive of real travel times has paved the way for the creation of the TomTom Congestion Index – the mostaccurate and comprehensive barometer of traffic congestion in major cities all over the world.
TomTom Congestion Index
© 2013 TomTom International BV. All rights reserved. – 3
About the TomTom Congestion IndexWith the publication of the TomTom Congestion Index we are aiming to provide the general public, industry and policymakers with unique and unbiased information about congestion levels in urban areas*.
The methodology that is used in this report compares travel times* during non-congested periods (free flow*) with traveltimes* in peak hours*. The difference is expressed as a percentage increase in travel time*. We take into account localroads, arterials and highways. All data is based on actual GPS based measurements and for each city* the sample size isexpressed in total number of measured kilometres for the period.
As well as assigning and ranking the overall congestion levels of over 120 cities* on different continents, the reportevaluates the congestion levels* in cities at different times of the day and on different days of the week.
Individual city reports include more detailed information such as the most congested day*, time delay per year forcommuters* and congestion levels on highways* and local roads.
To download a copy of the report go to: www.tomtom.com/congestionindex.
If you would like to know more about TomTom's trafflc solutions, please contact your local TomTom office [email protected].
For questions or comments about this report, please contact us at [email protected].
Note: words with a * are explained on the keywords page at the end of the report.
TomTom Congestion Index
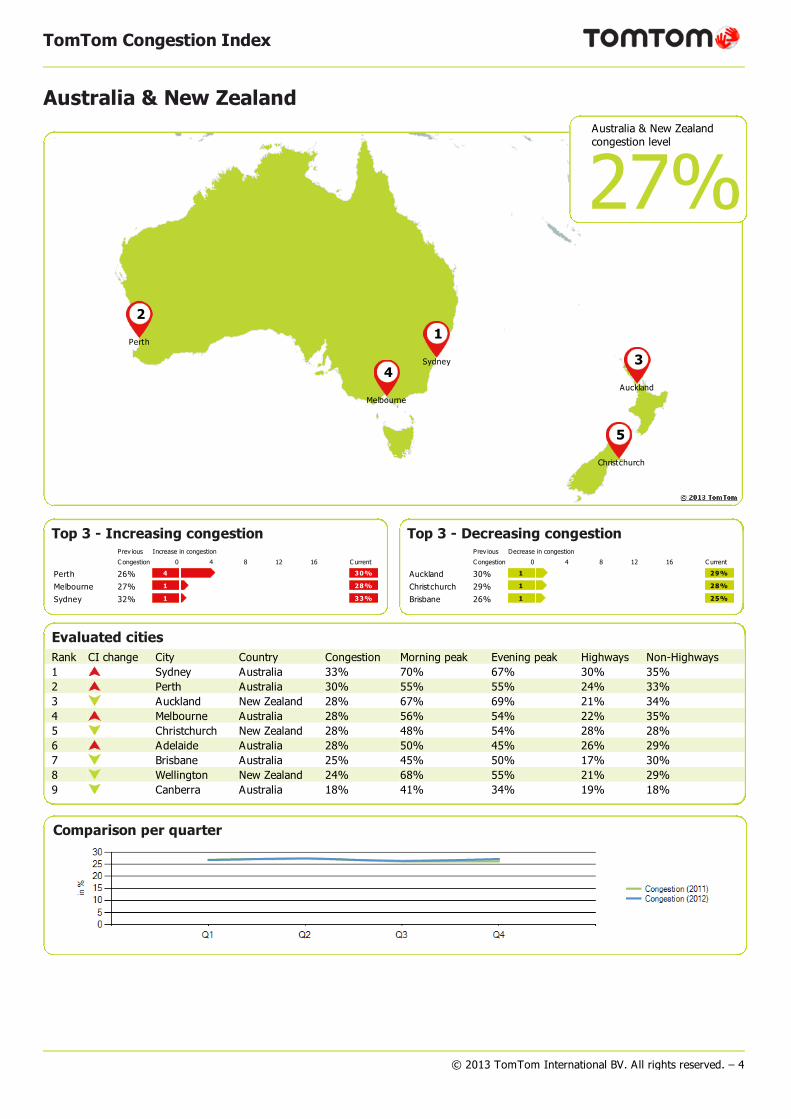
Top 3 - Increasing congestionPrev ious Increase in congestion
C ongestion 0 4 8 12 16 C urrent
Perth 26% 4 30%
Melbourne 27% 1 28%
Sydney 32% 1 33%
Top 3 - Decreasing congestionPrev ious Decrease in congestion
C ongestion 0 4 8 12 16 C urrent
Auckland 30% 1 29%
Christchurch 29% 1 28%
Brisbane 26% 1 25%
Evaluated citiesRank CI change City Country Congestion Morning peak Evening peak Highways Non-Highways1 Sydney Australia 33% 70% 67% 30% 35%2 Perth Australia 30% 55% 55% 24% 33%3 Auckland New Zealand 28% 67% 69% 21% 34%4 Melbourne Australia 28% 56% 54% 22% 35%5 Christchurch New Zealand 28% 48% 54% 28% 28%6 Adelaide Australia 28% 50% 45% 26% 29%7 Brisbane Australia 25% 45% 50% 17% 30%8 Wellington New Zealand 24% 68% 55% 21% 29%9 Canberra Australia 18% 41% 34% 19% 18%
Comparison per quarter
© 2013 TomTom International BV. All rights reserved. – 4
Australia & New ZealandAustralia & New Zealandcongestion level
27%
5
Christchurch
4
Melbourne
3
Auckland
2
Perth1
Sydney
TomTom Congestion Index
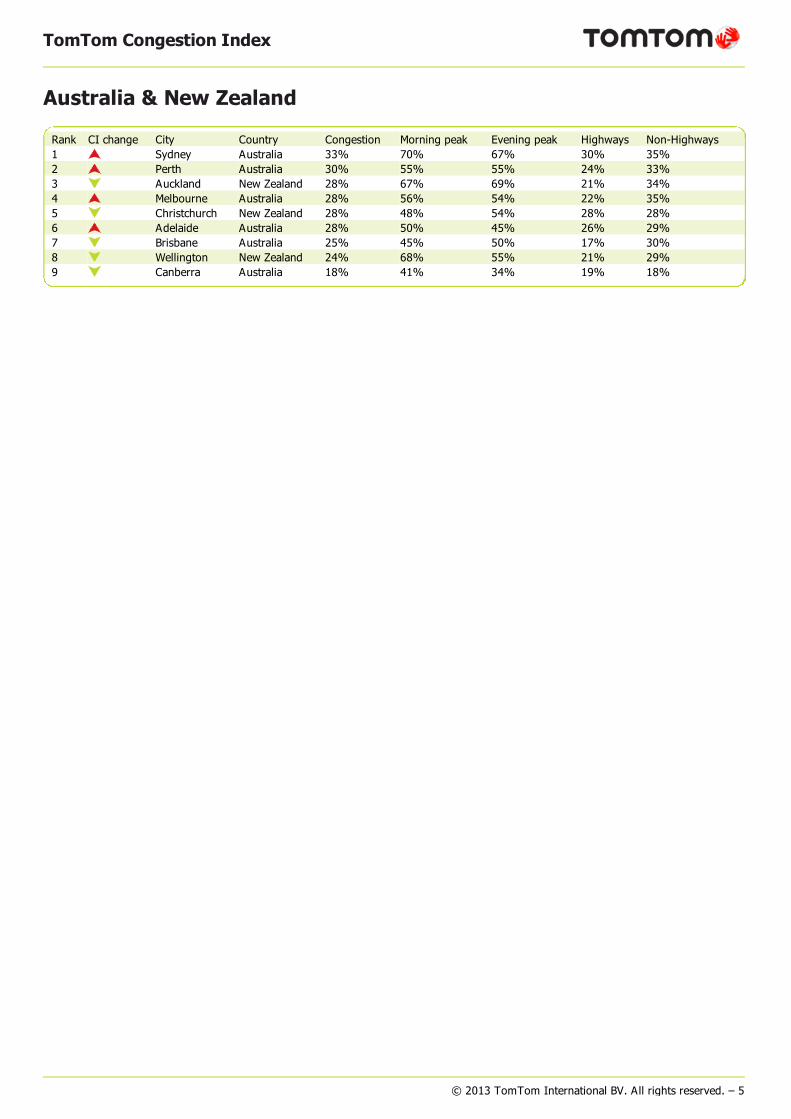
Rank CI change City Country Congestion Morning peak Evening peak Highways Non-Highways1 Sydney Australia 33% 70% 67% 30% 35%2 Perth Australia 30% 55% 55% 24% 33%3 Auckland New Zealand 28% 67% 69% 21% 34%4 Melbourne Australia 28% 56% 54% 22% 35%5 Christchurch New Zealand 28% 48% 54% 28% 28%6 Adelaide Australia 28% 50% 45% 26% 29%7 Brisbane Australia 25% 45% 50% 17% 30%8 Wellington New Zealand 24% 68% 55% 21% 29%9 Canberra Australia 18% 41% 34% 19% 18%
© 2013 TomTom International BV. All rights reserved. – 5
Australia & New Zealand
TomTom Congestion Index
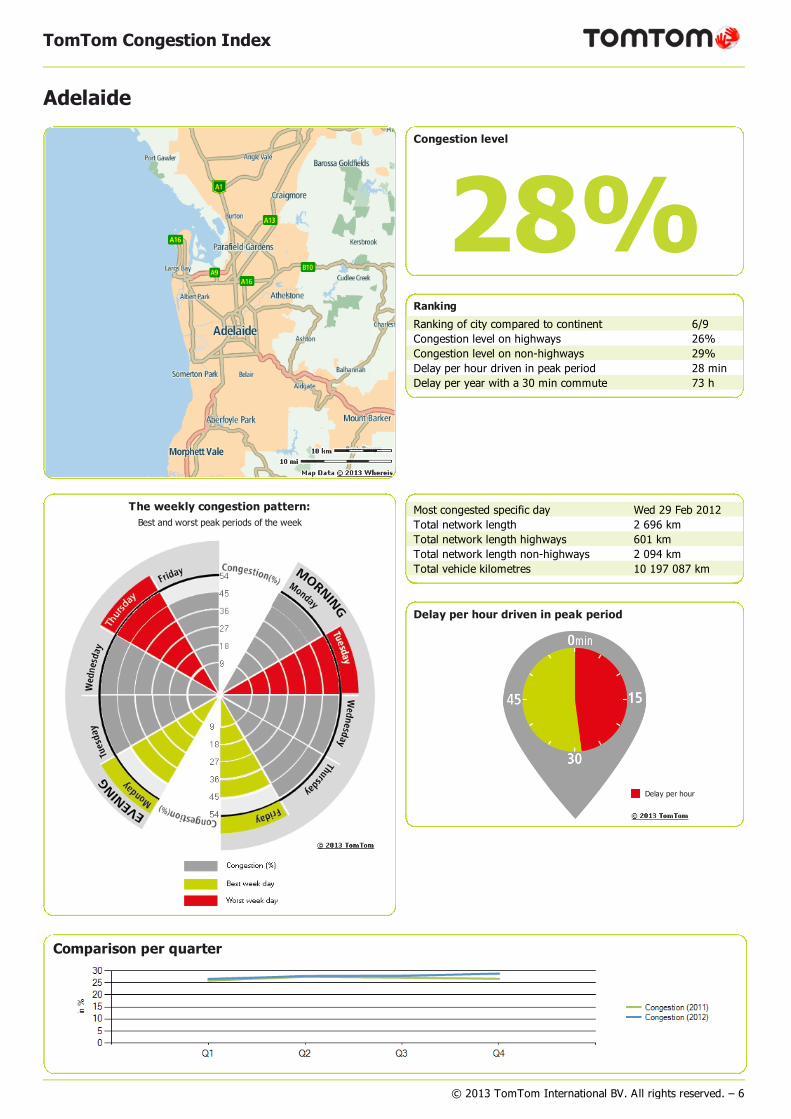
Ranking
Ranking of city compared to continent 6/9Congestion level on highways 26%Congestion level on non-highways 29%Delay per hour driven in peak period 28 minDelay per year with a 30 min commute 73 h
Most congested specific day Wed 29 Feb 2012Total network length 2 696 kmTotal network length highways 601 kmTotal network length non-highways 2 094 kmTotal vehicle kilometres 10 197 087 km
Comparison per quarter
© 2013 TomTom International BV. All rights reserved. – 6
Adelaide
Congestion level
28%
The weekly congestion pattern:Best and worst peak periods of the week
Delay per hour driven in peak period
Delay per hour
TomTom Congestion Index
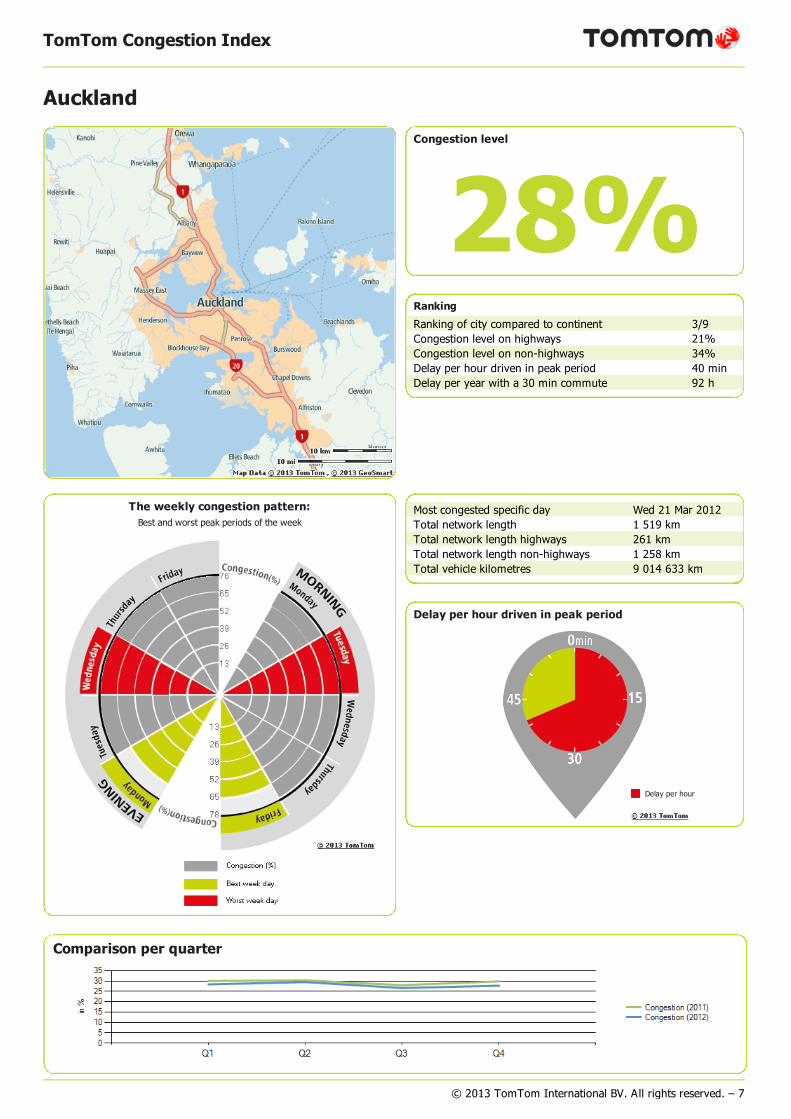
Ranking
Ranking of city compared to continent 3/9Congestion level on highways 21%Congestion level on non-highways 34%Delay per hour driven in peak period 40 minDelay per year with a 30 min commute 92 h
Most congested specific day Wed 21 Mar 2012Total network length 1 519 kmTotal network length highways 261 kmTotal network length non-highways 1 258 kmTotal vehicle kilometres 9 014 633 km
Comparison per quarter
© 2013 TomTom International BV. All rights reserved. – 7
Auckland
Congestion level
28%
The weekly congestion pattern:Best and worst peak periods of the week
Delay per hour driven in peak period
Delay per hour
TomTom Congestion Index
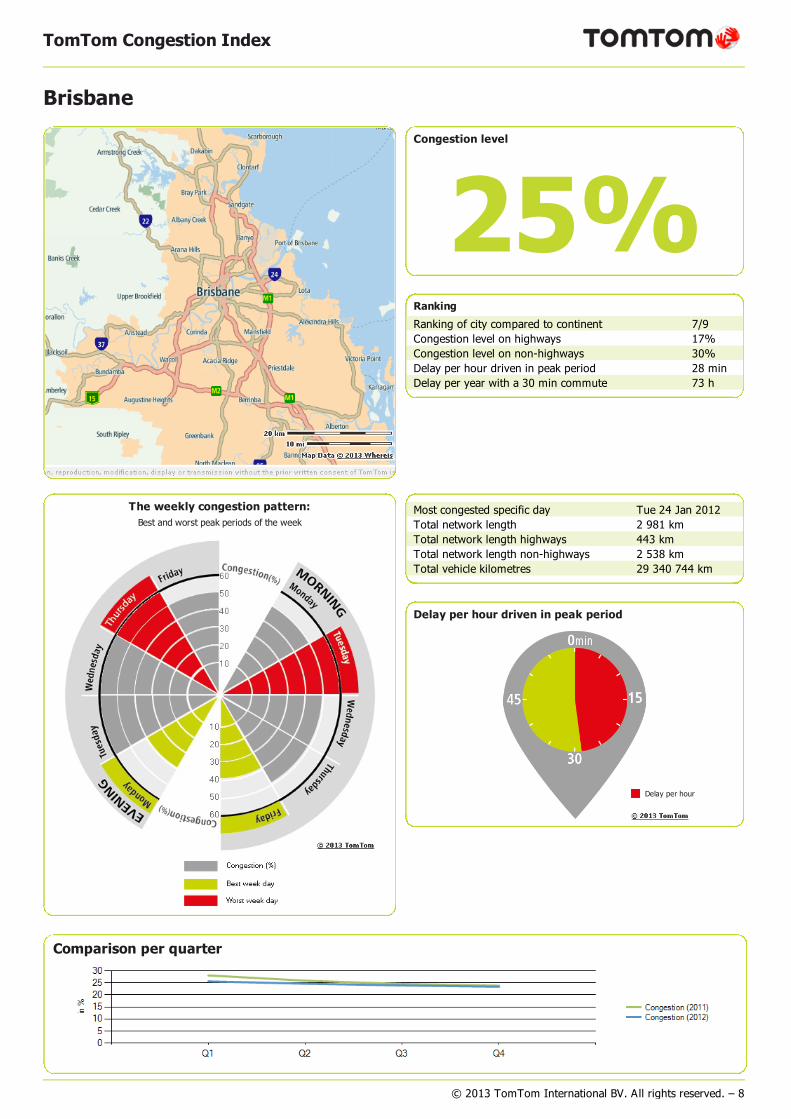
Ranking
Ranking of city compared to continent 7/9Congestion level on highways 17%Congestion level on non-highways 30%Delay per hour driven in peak period 28 minDelay per year with a 30 min commute 73 h
Most congested specific day Tue 24 Jan 2012Total network length 2 981 kmTotal network length highways 443 kmTotal network length non-highways 2 538 kmTotal vehicle kilometres 29 340 744 km
Comparison per quarter
© 2013 TomTom International BV. All rights reserved. – 8
Brisbane
Congestion level
25%
The weekly congestion pattern:Best and worst peak periods of the week
Delay per hour driven in peak period
Delay per hour
TomTom Congestion Index
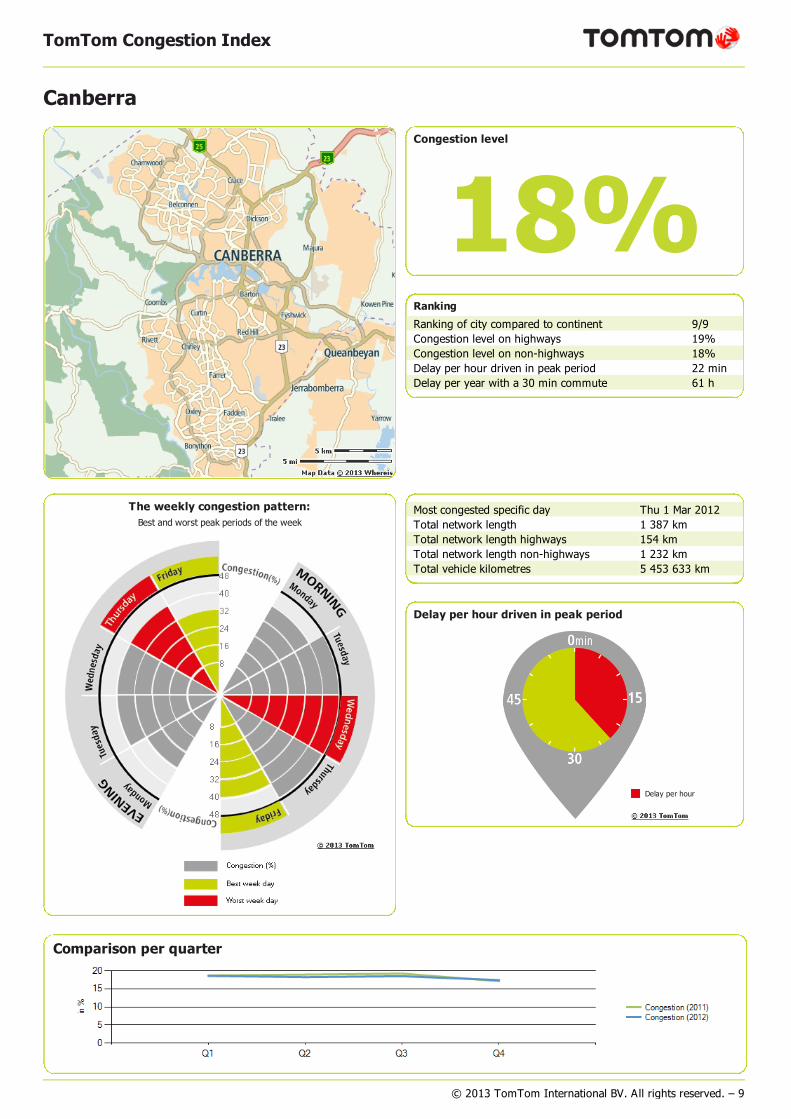
Ranking
Ranking of city compared to continent 9/9Congestion level on highways 19%Congestion level on non-highways 18%Delay per hour driven in peak period 22 minDelay per year with a 30 min commute 61 h
Most congested specific day Thu 1 Mar 2012Total network length 1 387 kmTotal network length highways 154 kmTotal network length non-highways 1 232 kmTotal vehicle kilometres 5 453 633 km
Comparison per quarter
© 2013 TomTom International BV. All rights reserved. – 9
Canberra
Congestion level
18%
The weekly congestion pattern:Best and worst peak periods of the week
Delay per hour driven in peak period
Delay per hour
TomTom Congestion Index
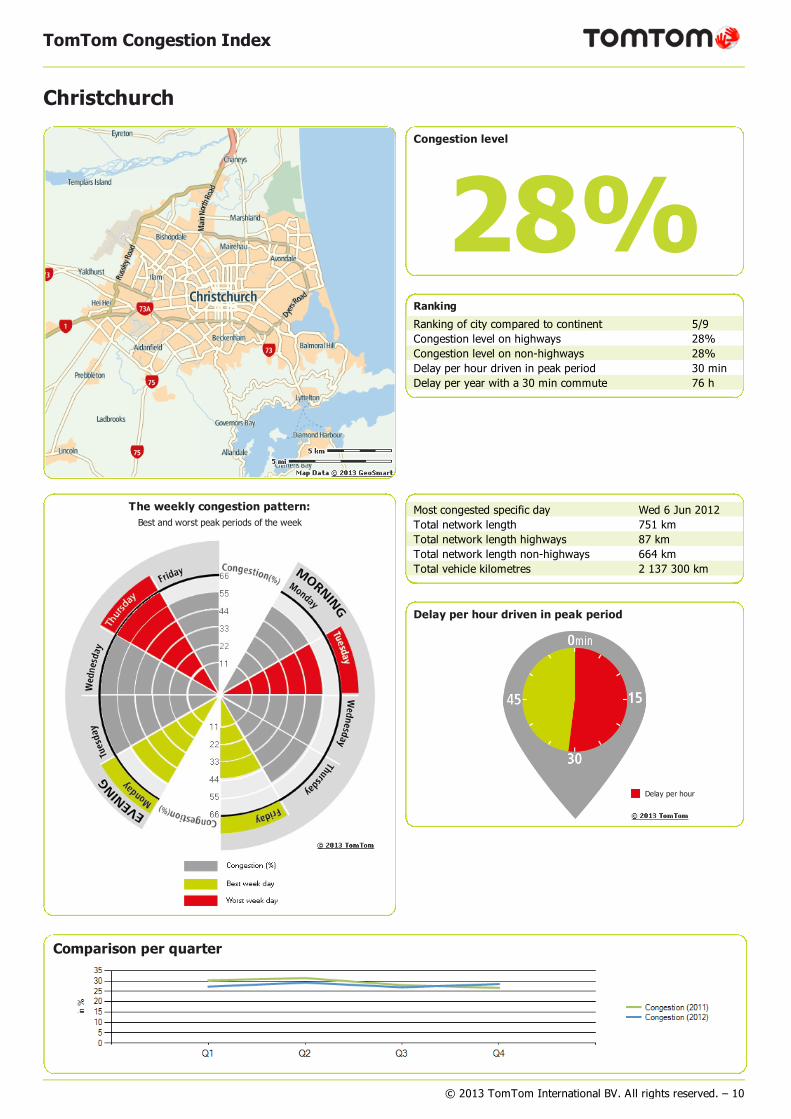
Ranking
Ranking of city compared to continent 5/9Congestion level on highways 28%Congestion level on non-highways 28%Delay per hour driven in peak period 30 minDelay per year with a 30 min commute 76 h
Most congested specific day Wed 6 Jun 2012Total network length 751 kmTotal network length highways 87 kmTotal network length non-highways 664 kmTotal vehicle kilometres 2 137 300 km
Comparison per quarter
© 2013 TomTom International BV. All rights reserved. – 10
Christchurch
Congestion level
28%
The weekly congestion pattern:Best and worst peak periods of the week
Delay per hour driven in peak period
Delay per hour
TomTom Congestion Index
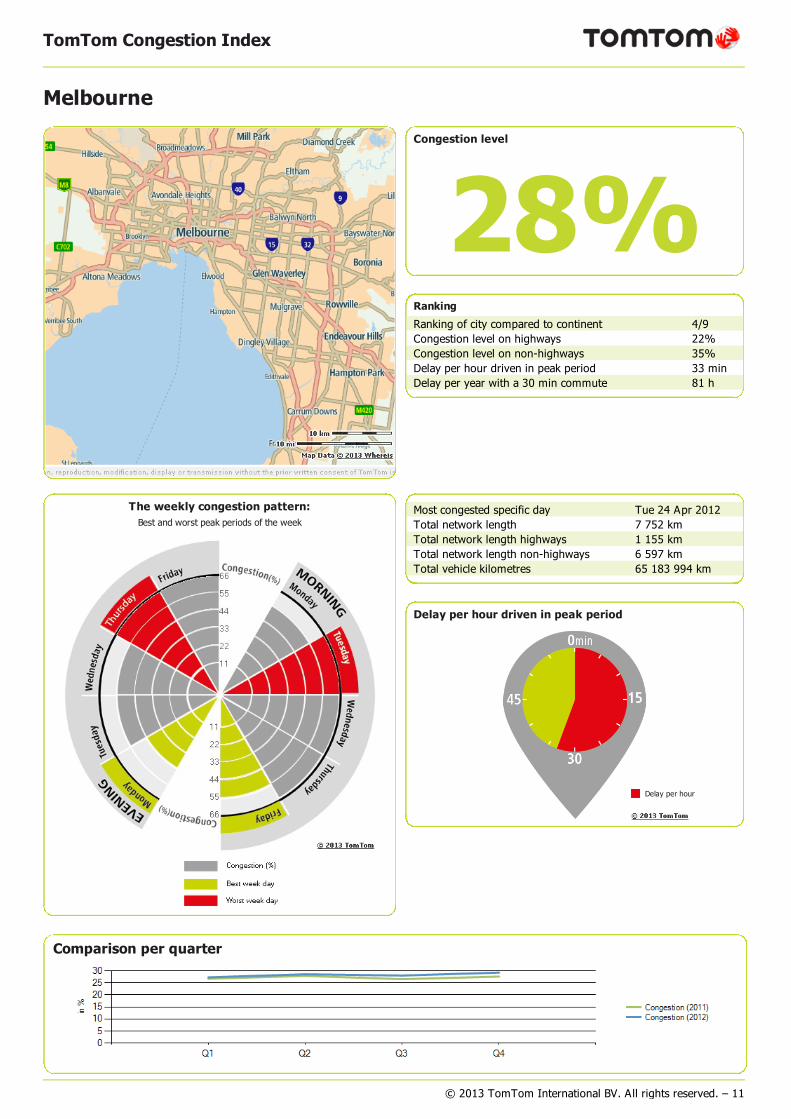
Ranking
Ranking of city compared to continent 4/9Congestion level on highways 22%Congestion level on non-highways 35%Delay per hour driven in peak period 33 minDelay per year with a 30 min commute 81 h
Most congested specific day Tue 24 Apr 2012Total network length 7 752 kmTotal network length highways 1 155 kmTotal network length non-highways 6 597 kmTotal vehicle kilometres 65 183 994 km
Comparison per quarter
© 2013 TomTom International BV. All rights reserved. – 11
Melbourne
Congestion level
28%
The weekly congestion pattern:Best and worst peak periods of the week
Delay per hour driven in peak period
Delay per hour
TomTom Congestion Index
Ranking
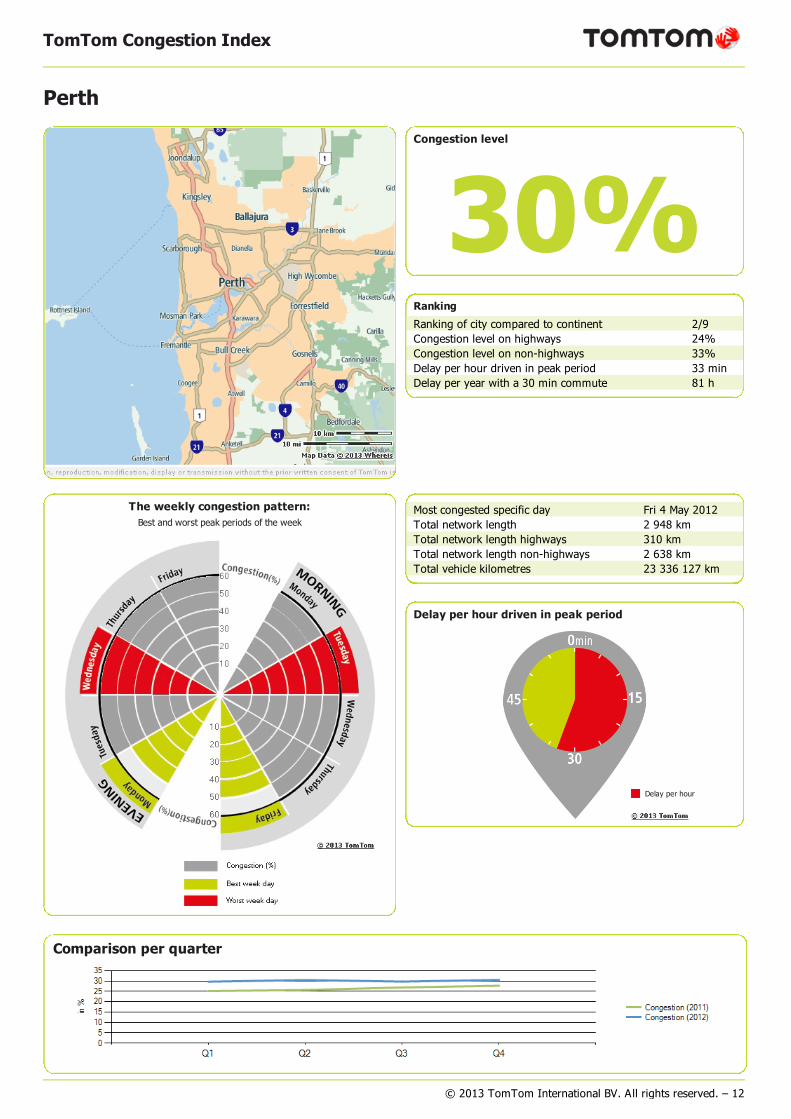
Ranking of city compared to continent 2/9Congestion level on highways 24%Congestion level on non-highways 33%Delay per hour driven in peak period 33 minDelay per year with a 30 min commute 81 h
Most congested specific day Fri 4 May 2012Total network length 2 948 kmTotal network length highways 310 kmTotal network length non-highways 2 638 kmTotal vehicle kilometres 23 336 127 km
Comparison per quarter
© 2013 TomTom International BV. All rights reserved. – 12
Perth
Congestion level
30%
The weekly congestion pattern:Best and worst peak periods of the week
Delay per hour driven in peak period
Delay per hour
TomTom Congestion Index
Ranking
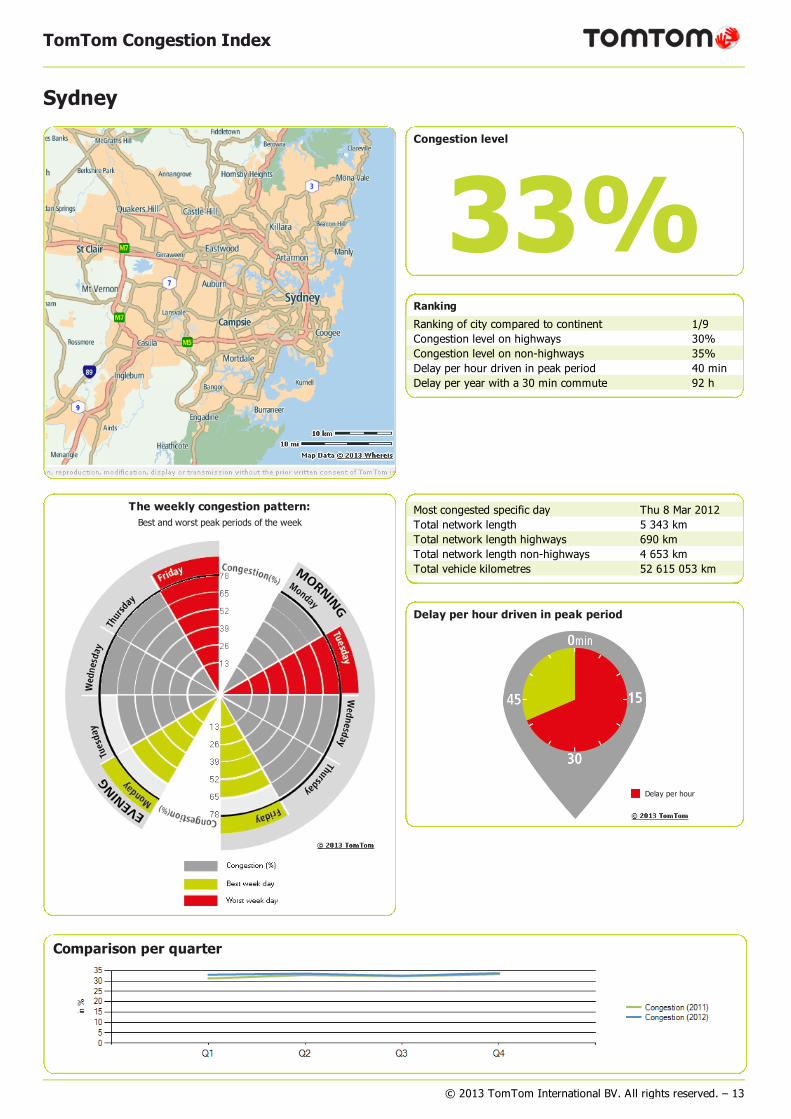
Ranking of city compared to continent 1/9Congestion level on highways 30%Congestion level on non-highways 35%Delay per hour driven in peak period 40 minDelay per year with a 30 min commute 92 h
Most congested specific day Thu 8 Mar 2012Total network length 5 343 kmTotal network length highways 690 kmTotal network length non-highways 4 653 kmTotal vehicle kilometres 52 615 053 km
Comparison per quarter
© 2013 TomTom International BV. All rights reserved. – 13
Sydney
Congestion level
33%
The weekly congestion pattern:Best and worst peak periods of the week
Delay per hour driven in peak period
Delay per hour
TomTom Congestion Index
Ranking
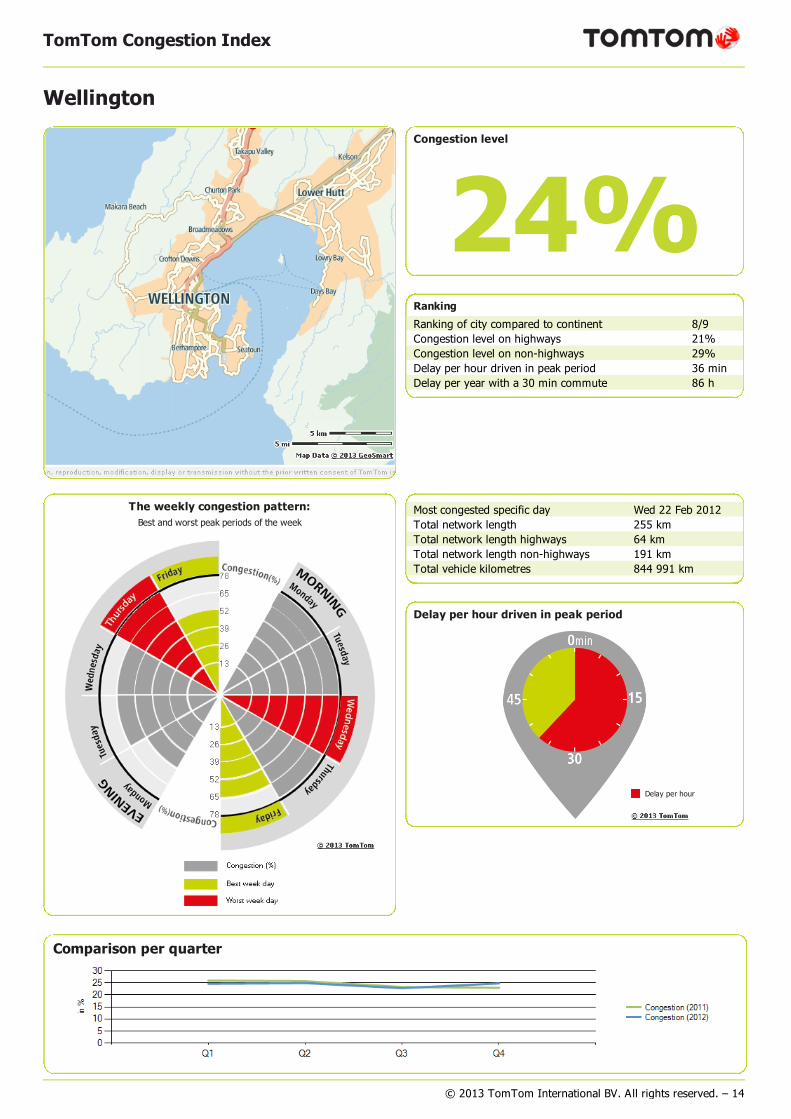
Ranking of city compared to continent 8/9Congestion level on highways 21%Congestion level on non-highways 29%Delay per hour driven in peak period 36 minDelay per year with a 30 min commute 86 h
Most congested specific day Wed 22 Feb 2012Total network length 255 kmTotal network length highways 64 kmTotal network length non-highways 191 kmTotal vehicle kilometres 844 991 km
Comparison per quarter
© 2013 TomTom International BV. All rights reserved. – 14
Wellington
Congestion level
24%
The weekly congestion pattern:Best and worst peak periods of the week
Delay per hour driven in peak period
Delay per hour
TomTom Congestion Index
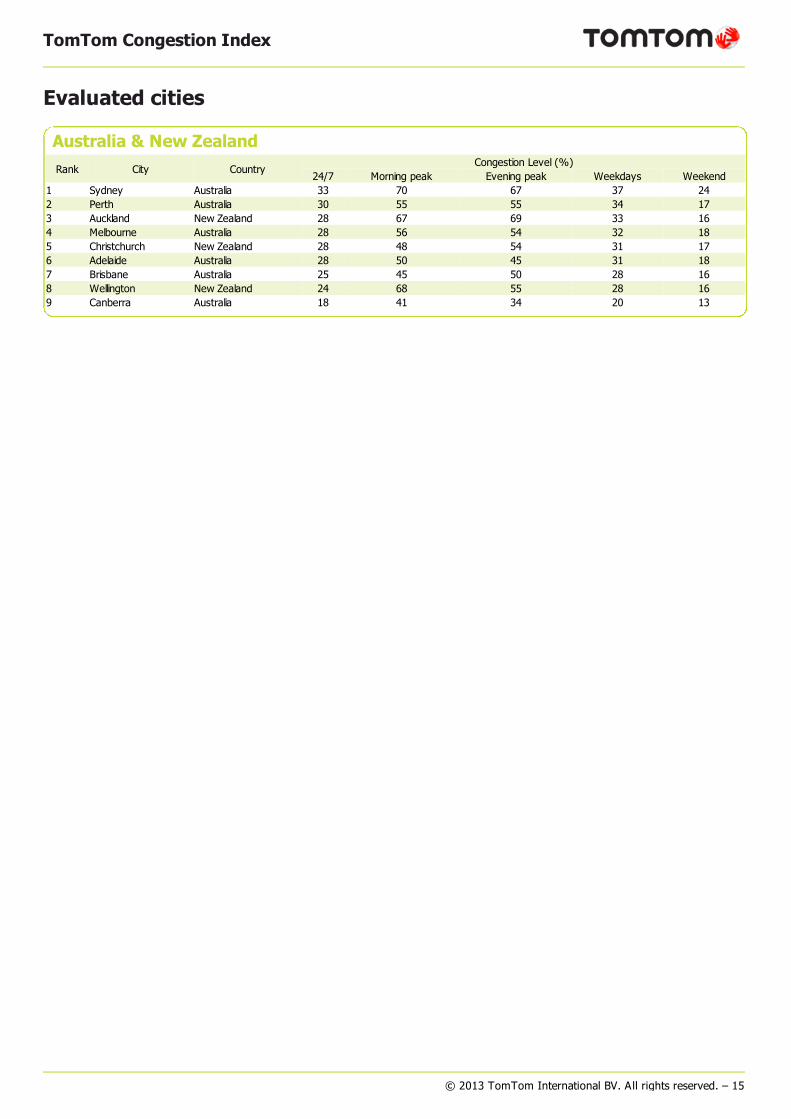
Australia & New ZealandRank City Country
Congestion Level (%)24/7 Morning peak Evening peak Weekdays Weekend
1 Sydney Australia 33 70 67 37 242 Perth Australia 30 55 55 34 173 Auckland New Zealand 28 67 69 33 164 Melbourne Australia 28 56 54 32 185 Christchurch New Zealand 28 48 54 31 176 Adelaide Australia 28 50 45 31 187 Brisbane Australia 25 45 50 28 168 Wellington New Zealand 24 68 55 28 169 Canberra Australia 18 41 34 20 13
© 2013 TomTom International BV. All rights reserved. – 15
Evaluated cities
TomTom Congestion Index
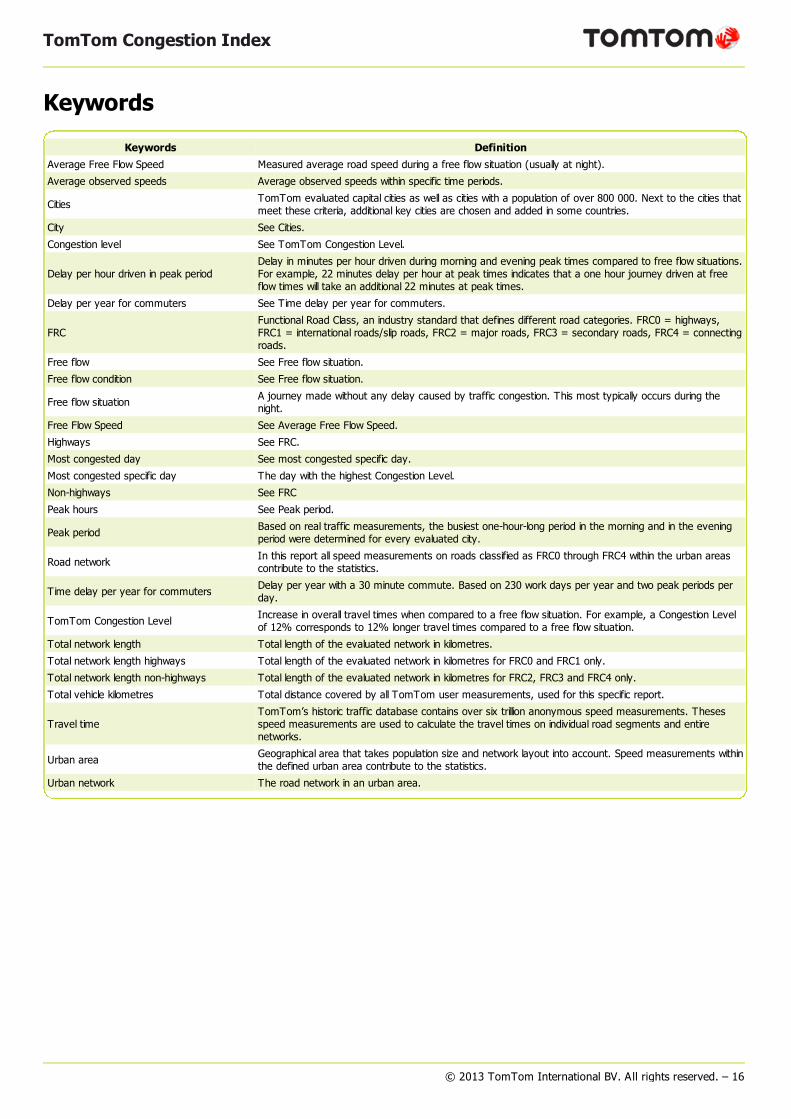
Keywords
Keywords Definition
Average Free Flow Speed Measured average road speed during a free flow situation (usually at night).
Average observed speeds Average observed speeds within specific time periods.
Cities TomTom evaluated capital cities as well as cities with a population of over 800 000. Next to the cities thatmeet these criteria, additional key cities are chosen and added in some countries.
City See Cities.
Congestion level See TomTom Congestion Level.
Delay per hour driven in peak periodDelay in minutes per hour driven during morning and evening peak times compared to free flow situations.For example, 22 minutes delay per hour at peak times indicates that a one hour journey driven at freeflow times will take an additional 22 minutes at peak times.
Delay per year for commuters See Time delay per year for commuters.
FRCFunctional Road Class, an industry standard that defines different road categories. FRC0 = highways,FRC1 = international roads/slip roads, FRC2 = major roads, FRC3 = secondary roads, FRC4 = connectingroads.
Free flow See Free flow situation.
Free flow condition See Free flow situation.
Free flow situation A journey made without any delay caused by traffic congestion. This most typically occurs during thenight.
Free Flow Speed See Average Free Flow Speed.
Highways See FRC.
Most congested day See most congested specific day.
Most congested specific day The day with the highest Congestion Level.
Non-highways See FRC
Peak hours See Peak period.
Peak period Based on real traffic measurements, the busiest one-hour-long period in the morning and in the eveningperiod were determined for every evaluated city.
Road network In this report all speed measurements on roads classified as FRC0 through FRC4 within the urban areascontribute to the statistics.
Time delay per year for commuters Delay per year with a 30 minute commute. Based on 230 work days per year and two peak periods perday.
TomTom Congestion Level Increase in overall travel times when compared to a free flow situation. For example, a Congestion Levelof 12% corresponds to 12% longer travel times compared to a free flow situation.
Total network length Total length of the evaluated network in kilometres.
Total network length highways Total length of the evaluated network in kilometres for FRC0 and FRC1 only.
Total network length non-highways Total length of the evaluated network in kilometres for FRC2, FRC3 and FRC4 only.
Total vehicle kilometres Total distance covered by all TomTom user measurements, used for this specific report.
Travel timeTomTom’s historic traffic database contains over six trillion anonymous speed measurements. Thesesspeed measurements are used to calculate the travel times on individual road segments and entirenetworks.
Urban area Geographical area that takes population size and network layout into account. Speed measurements withinthe defined urban area contribute to the statistics.
Urban network The road network in an urban area.
© 2013 TomTom International BV. All rights reserved. – 16
TomTom Congestion Index
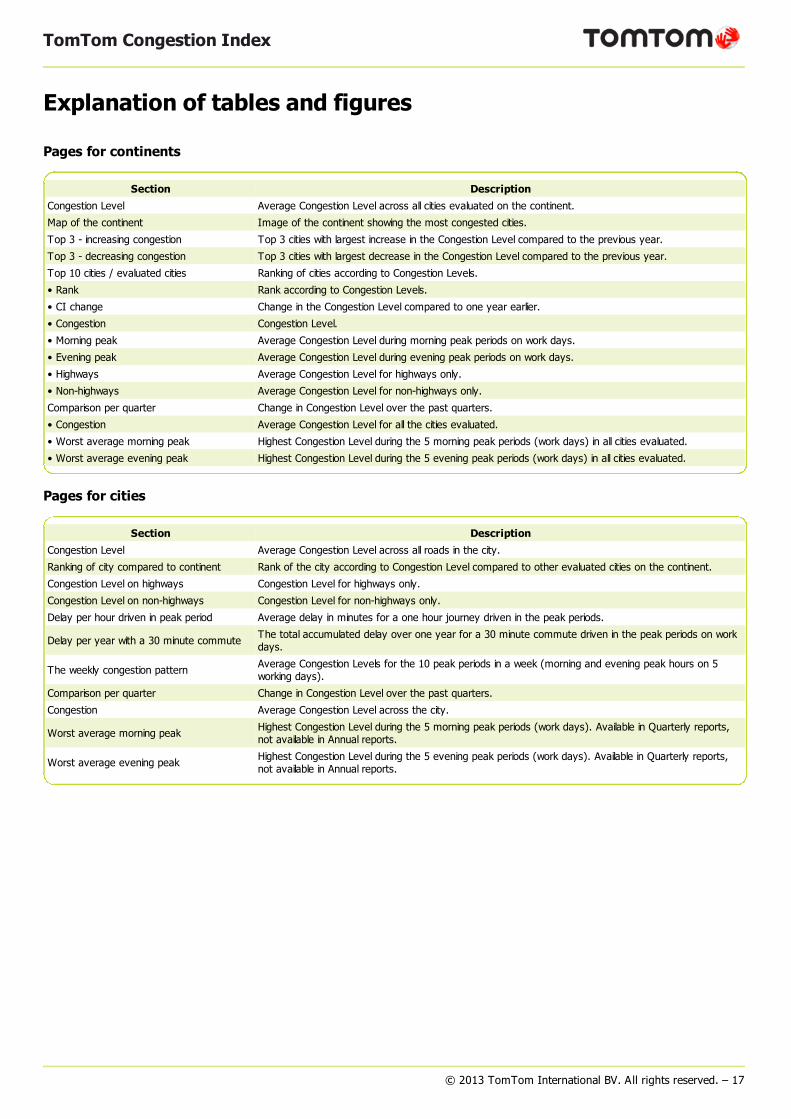
Explanation of tables and figures
Pages for continents
Section Description
Congestion Level Average Congestion Level across all cities evaluated on the continent.
Map of the continent Image of the continent showing the most congested cities.
Top 3 - increasing congestion Top 3 cities with largest increase in the Congestion Level compared to the previous year.
Top 3 - decreasing congestion Top 3 cities with largest decrease in the Congestion Level compared to the previous year.
Top 10 cities / evaluated cities Ranking of cities according to Congestion Levels.
• Rank Rank according to Congestion Levels.
• CI change Change in the Congestion Level compared to one year earlier.
• Congestion Congestion Level.
• Morning peak Average Congestion Level during morning peak periods on work days.
• Evening peak Average Congestion Level during evening peak periods on work days.
• Highways Average Congestion Level for highways only.
• Non-highways Average Congestion Level for non-highways only.
Comparison per quarter Change in Congestion Level over the past quarters.
• Congestion Average Congestion Level for all the cities evaluated.
• Worst average morning peak Highest Congestion Level during the 5 morning peak periods (work days) in all cities evaluated.
• Worst average evening peak Highest Congestion Level during the 5 evening peak periods (work days) in all cities evaluated.
Pages for cities
Section Description
Congestion Level Average Congestion Level across all roads in the city.
Ranking of city compared to continent Rank of the city according to Congestion Level compared to other evaluated cities on the continent.
Congestion Level on highways Congestion Level for highways only.
Congestion Level on non-highways Congestion Level for non-highways only.
Delay per hour driven in peak period Average delay in minutes for a one hour journey driven in the peak periods.
Delay per year with a 30 minute commute The total accumulated delay over one year for a 30 minute commute driven in the peak periods on workdays.
The weekly congestion pattern Average Congestion Levels for the 10 peak periods in a week (morning and evening peak hours on 5working days).
Comparison per quarter Change in Congestion Level over the past quarters.
Congestion Average Congestion Level across the city.
Worst average morning peak Highest Congestion Level during the 5 morning peak periods (work days). Available in Quarterly reports,not available in Annual reports.
Worst average evening peak Highest Congestion Level during the 5 evening peak periods (work days). Available in Quarterly reports,not available in Annual reports.
© 2013 TomTom International BV. All rights reserved. – 17


