27
1 Tonga 2010 Global School-Based Student Health Survey Final Report December 2012

1
Tonga
2010 Global School-Based Student Health Survey
Final Report
December 2012

2
Table of Contents
Acknowledgements
Executive Summary
Introduction
Methods
Results
Demographics
Alcohol Use
Dietary Behaviours
Drug Use
Hygiene
Mental Health
Physical Activity
Protective Factors
HIV Infection
Tobacco Use
Violence and Unintentional Injury
Conclusions and Recommendations
References
Appendices

3
Acknowledgments
The Global School-based Student Health Survey (GSHS) in Tonga 2010 would like to acknowledge
the generous support and collaboration of WHO Regional Office and Center of Disease Control
(CDC) in Atlanta USA to bring together the 10 Pacific Islands in June 2010 in conjunction with
Massey University in Auckland to carry out the GSHS.
This momentum effort has driven Tonga to contact the survey accordingly. The continued
collaboration among the Ministry of Health and the Ministry of Education, Women Affairs and
Culture (MEWAC); and the Mission Schools in Tonga was the outmost achievement in making
GSHS succeeded.
I wish to acknowledge all participating students of sampled secondary schools on both government
and mission for contributed to the success of Tonga GSHS.
Tonga GSHS would like to extend special thanks to the technical assistance provided from the
following consultants:
Leanne Riley – Head, Surveillance Department of Chronic Diseases and Health Promotion, WHO
Laura Kann – Head, Division of Adolescent and School Health, CDC Atlanta US
Dr Temo Waqanivalu – Technical Officer-Nutrition and Physical Activity, WHO – Fiji
Tonga GSHS would also like to express sincere appreciation to the dedicated duty on the field from
the following Officers:
Dr Malakai ‘Ake – Chief Medical Officer / Head of the Public Health Division
Dr Paula Vivili – Senior Medical Officer i/c NCD & HP Unit
Talahiva Fine – Senior Education Officer from MEWAC
Naomi Fakauka – Health Promotion Officer
Pita Fatai – Health Promotion Officer
Suli’ana Tu’itupou – Health Promotion Officer
Luseane Liongitau – Health Promotion Officer
Lute Malungahu – Health Promotion Officer
Vaisioa Tu’ionetoa – Health Promotion Officer
Palei Vaha’i – Health Promotion Officer
‘Ana Timani – Public Health Officer
Tonga GSHS is greatly appreciated the effort on translation of the questionnaire into Tongan from
Elizabeth and Rev. Ma’afu Palu.
The WHO Office staff in Tonga is also acknowledged for provision of the financial need through to
the Health Planning Office of the Ministry of Health to fully fund the expenses of the survey.
As such with all the support given is paramount to recognize and acknowledge without it we would
not succeed the GSHS.
The acknowledgement is given for completion of the Global Tobacco Youth Survey (GYTS) as has
been sampling from CDC for the same forms. The staff has rotated for both surveys. The classes
chosen for conducting GYTS was also doing the Refractive Error Survey. Sr. Meleane Eke and
Mele Vuki of the Eye Clinic were responsible for refractive error survey.
4
Executive Summary
Tonga was fortunate to participating in the Global School-based Health Survey initiated by World
Health Organization (WHO), in collaboration with UNAIDS, UNESCO, and UNICEF, and with
technical assistance from the U.S. Centers for Disease Control and Prevention (CDC).
Purpose:
The purpose of the GSHS is to obtain systematic information from students to support school health
and youth health programmes and policies globally. The GSHS is a school-based survey conducted
primarily among students aged 13 – 15 years. It includes modules which measure the main health
behaviours and protective factors among students related to the leading causes of morbidity and
mortality among youth and adults worldwide. The core modules include alcohol use, drug use,
dietary behaviours, hygiene, mental health, physical activity, protective factors, HIV infection and
other STI infection, unwanted pregnancy, tobacco use and violence and intended injury. Tonga has
only chosen HIV infection on the GSHS excluding Sexual Behaviour, STI infection and unwanted
pregnancy as advising from the Education Department.
Methodology:
CDC has randomly selected the sampling of 24 schools in Tonga where 14 in Tongatapu, 5 in
Vava’u, 3 in Ha’apai and 2 in ‘Eua. The form 2 - 4 was chosen whereas most likely to capture the
targeted age group.
The Global School-Based Student Health Survey (GSHS) was completed by 2211 students in 24
schools in Tonga during 2010. The school response rate was 100%, the student response rate was
80%, and the overall response rate was 80%. The results are representative of all students in the
grades below. The weighted demographic characteristics of the sample are as follows:
Male 51.6% Form 2 26.8%
Female 48.4% Form 3 33.9%
Form 4 38.5%
Other 0.8%
Students completed a self-administered, anonymous, 89-item questionnaire. Survey procedures were
designed to protect the privacy of students by allowing for anonymous and voluntary participation.
The questionnaire administered was in both English and Tongan to make it easy for students to
answer.
Key results:
The overall result of the survey, males and females are not significantly different on the high risk
behaviours and protective factors as on the following results.
• Alcohol use
The exposure of drinking alcohol is very high of 63.4% on their first drink before age of 14 years.
This is significantly indicated of early exposure to behaviour of drinking alcohol. The prevalence of
18.4% students who currently drinking is very high and also to identify 49.4% of both gender are
more likely to drink alcohol when their friends gave them to drink. In contrast that 85% of students
definitely or probably not drink if one of their friends offered a drink of alcohol.
5
• Dietary Behaviours
Females are more likely underweight than males. The 58.7% prevalence of overweight and 21.1%
obese are high among students. The 56.3% prevalence of drinking carbonated soft drinks among
targeted age group is also high. The students usually ate fruits and vegetables during the past 30
days are around 38%. The 66.2% of students were being taught the benefits of healthy eating.
• Drug use
The prevalence of students who are using drugs before the age 14 years is 67.5%. As such indicating
the exposure to behavour of using drugs is respectively high. The overall 7.5% of students used
marijuana one or more times during their life. The students got into trouble with their friends and
family, missed school or even got into fight as result of using drugs is 15.8%.
• Hygiene
Overall males are significantly cleaned or brushed their teeth less than one time per day during the
past 30 days than females. The hygiene behaviour of the students is around 10% which is very too
low while around 70% were being taught in their classes.
• Mental Health
Significantly that 28.5% students who attempted suicidal behaviors are relative high to recognize in
time despite that there is no significantly different between males and females. The 29.5% of
students made a plan about they would attempt suicide during the past 12 months. Overall, 35.7%
of students actually attempted suicide one or more times during the past 12 months. The 65.6% of
students are couldn’t sleep at night and worried because they bullied on one or days during the last
30 days.
• Physical activity
There is no significant different between males and females but to recognize the below average of
physical activity level on both gender at least five or more days a week. Tonga, 25.1% of students
were physically active for a total of at least 60 minutes per day on five or more days during the past
seven days. The 28.8% of students spent three or more hours in sitting activities such as video and
games.
• Protective factors
Significantly the support and role of the parents and guardians is below average in protective factors
which is 27.1% reported parents and guardians understood their problems. Overall 40.2% of
students missed classes or school without permission on one or more of the past 30 days. The 79.2%
of students thought of themselves as a spiritual person.
• HIV-related knowledge
In Tonga, 57.3% of students had ever heard of HIV infection or the disease called AIDS. Overall,
36.9% of students were taught in classes during the school year about HIV and AIDS. Addressing
of HIV infections or AIDS is 32.9% of students ever talked with their parents and guardians.
• Tobacco use
The 76.1% of Students were exposure to smoking before age of 14 years is very high and prevalence
of 22.7% is also an alert level. The 66.6% of students reported people smoked in their presence on
one or more days during the past seven days. Overall, 42.3% of students had parents or guardians
who used tobacco.

6
• Violence and unintentional injury
The students were more likely to injure from related behavior of violence and unintentional injury as
significantly indicated of 50.9% were physically attacked, 49.2% physical fight and 62.7% were
seriously injured. Overall, 51.3% of students were bullied on one or more days during the past 30
days.The 53.3% of students who never or rarely used seat belt when rode in a motor vehicle driven
by someone else. Overall, 39.0% of students were in a motor vehicle driven by someone who had
been drinking alcohol.
Recommendation:
o Presenting results from Tonga GSHS to related stakeholders and partners of health to notice
the prevalence of risk behaviours and protective factors.
o Advocating schools and parents to participate in health promoting school programs.
o Promoting healthy lifestyle in schools and parent teacher association based on the findings.
o Producing of IEC material in relation to the findings.
o Financial support.
o Next survey will conduct after four years and to conduct in the beginning of the year whereas
response rate was 80% but it can be higher if it is conducted earlier.

7
Introduction
In 2001, WHO, in collaboration with UNAIDS, UNESCO, and UNICEF, and with technical
assistance from the U.S. Centers for Disease Control and Prevention (CDC), initiated development
of the Global School-based Student Health Survey (GSHS).
Since 2003, Ministries of Health and Education around the world have been using the GSHS to
periodically monitor the prevalence of important health risk behaviours and protective factors
among students.
To date, more than 80 countries globally have completed a GSHS. This report describes results from
the first GSHS conducted in TONGA by the Ministry of Health and Ministry of Education, Women
Affairs and Culture and mission schools during 6 September to 6 October.
The purpose of the GSHS is to provide accurate data on health behaviours and protective factors
among students to:
• Help countries develop priorities, establish programmes, and advocate for resources for school
health and youth health programmes and policies;
• Establish trends in the prevalence of health behaviours and protective factors for use in
evaluation of school health and youth health promotion; and
• Allow countries, international agencies, and others to make comparisons across countries and
within countries regarding the prevalence of health behaviours and protective factors
The GSHS is a school-based survey conducted primarily among students aged 13-15 years. It
measures behaviours and protective factors related to the leading causes of mortality and morbidity
among youth and adults in TONGA:
• Alcohol use
• Dietary behaviours
• Drug use
• Hygiene
• Mental health
• Physical activity
• Protective factors
• HIV infection and other STI
• Tobacco use • Violence and unintentional injury The GSHS was conducted together with Global Youth Tobacco Survey (GYTS) and Refractive
Error Survey.
The GYTS was a school-based survey designed to enhance the capacity of countries to monitor
tobacco use among youth and to guide the implementation and evaluation of tobacco prevention and
control programmes. The GYTS uses a standard methodology for constructing the sampling frame,
selecting schools and classes, preparing questionnaires, following consistent field procedures, and
using consistent data management procedures for data processing and analysis.

8
The results of these surveys help us obtain more accurate and recent health data on health
behaviours and protective factors among students in Tonga and will assist in the overall intervention
as identified on GSHS and GYTS.
Refractive Error Survey
To date there has not been a survey to look into the refractive error (both myopia and hyperopia) in
students to date. This would be an opportunity to ‘piggy back’ on the GYTS and accomplish this
work. It was a simple survey where students’ visual acuity will be tested, first unaided (to check for
myopia) then with a +2 lens (to check for hyperopia).
It is ideal to do it at this age group (13 – 15) as visual pathways are by this time fully developed.
Also, add information about school health and youth health policies and programs that these data
may be used to improve.

9
Methods
The 2010 TONGA GSHS employed a two-stage cluster sample design to produce a representative
sample of students in forms. The first-stage sampling frame consisted of all schools containing any
of forms. Schools were selected with probability proportional to school enrolment size. 24 schools
were selected to participate in the TONGA GSHS.
The second stage of sampling consisted of randomly selecting intact classrooms (using a random
start) from each school to participate. All classrooms in each selected school were included in the
sampling frame. All students in the sampled classrooms were eligible to participate in the GSHS.
The Tonga GSHS was a school-based survey of students in Forms 2, 3, and 4. A two-stage cluster
sample design was used to produce data representative of all students in Forms 2, 3, and 4 in Tonga.
A weighting factor was applied to each student record to adjust for non-response and for the varying
probabilities of selection. W = W1 * W2 * f1 * f2 * f3 W1 = the inverse of the probability of selecting the school;
W2 = the inverse of the probability of selecting the classroom within the school;
f1 = a school-level nonresponse adjustment factor calculated by school size
category (small, medium, large). The factor was calculated in terms of
school enrollment instead of number of schools.
f2 = a student-level nonresponse adjustment factor calculated by class.
f3 = a poststratification adjustment factor calculated by grade.
For the 2010 TONGA GSHS, 2,211 questionnaires were completed in 24 schools. The school
response rate was 100%, the student response rate was 80%, and the overall response rate was 80%.
The data set was cleaned and edited for inconsistencies. Missing data were not statistically imputed.
Software that takes into consideration the complex sample design was used to compute prevalence
estimates and 95% confidence intervals. GSHS data are representative of all students attending
FORMS in TONGA.
Survey administration occurred from 6 September to 6 October. Survey procedures were designed
to protect student privacy by allowing for anonymous and voluntary participation. Students
completed the self-administered questionnaire during one classroom period and recorded their
responses directly on a computer-scannable answer sheet. Approximately, 10 Survey
Administrators were specially trained to conduct the GSHS. The questionnaire was in English and
Tongan version.
The TONGA GSHS questionnaire contained 89 questions addressing the following topics:
• Alcohol use
• Dietary behaviours
• Drug use
• Hygiene
• Mental health
• Physical activity
• Protective factors
• HIV infection

10
• Tobacco use • Violence and unintentional injury
The questionnaire was developed by WHO and CDC once Tonga given their desirable and final
questions as attached.

11
Results
Demographics
The demographic characteristics of the sample are described in the following table.
Table 1. Demographic characteristics of the sample TONGA, 2010.
Sex Age Form
Males
Females
12 or
younger
13-15
16 or
older
2 3 4 Other
TONGA 1,006 1,186 121 1,835 243 668 805 689 18
Alcohol Use
Table 2. Alcohol use among students, by sex, TONGA, 2010.
Behaviour
Total %
(CI)*
Sex
Male %
(CI)
Female %
(CI)
Males Different Than
Females (Yes or No) Among students who ever had a
drink of alcohol, those who had
their first drink of alcohol before
age 14 years
63.4
(57.3 – 69.0)
64.5
( 56.7 – 71.6)
62.0
(52.6 – 70.6)
No
Drank at least one drink
containing alcohol on one or more
of the past 30 days
18.4
(16.0 – 21.0)
17.8
(14.8 – 21.3)
18.9
(15.9 – 22.3)
No
Among students who drank
alcohol during the past 30 days,
those who usually drank two or
more drinks per day on the days
they drank alcohol
36.8
(31.9 – 42.1)
43.7
(36.4 – 51.4)
31.0
(23.5 – 39.6)
No
Among students who drank
alcohol during the past 30 days,
the percentage who usually got
the alcohol they drank from their
friends
49.4
(42.9 – 55.9)
44.8
(35.2 – 54.9)
55.1
(47.1 – 62.9)
No
Drank so much alcohol that they
were really drunk one or more
times during their life
16.1
(13.6 – 19.0)
16.0
(13.0 – 19.5)
16.1
(12.9 – 20.0)
No
Got into trouble with their family
or friends, missed school, or got
into fights one or more times
during their life as a result of
drinking alcohol.
13.6
(11.7 – 15.7)
12.9
(10.3 – 16.0)
14.2
(11.9 – 17.0)
No
Student definitely or probably not
drink if one of their best friends
offered them a drink of alcohol
85.0
(82.5 – 87.2)
85.1
(81.2 – 88.3)
84.8
(82.1 – 87.2)
No
Taught in any of their classes
during this school year the
problems associated with drinking
alcohol
54.3
(51.0 – 57.6)
56.8
(51.7 – 61.8)
51.8
(48.0 – 55.6)
No
Taught in any of their classes
during this school year the effects
55.5
(52.0 – 58.9)
58.5
(52.7 – 64.2)
52.2
(48.5 – 55.8)
No

12
of alcohol use on decision making
*95% confidence interval.
In TONGA, among students who ever had a drink of alcohol, 63.4% of students had their first drink
of alcohol before age 14 years
Overall, the prevalence of current alcohol use among students (i.e., drinking at least one drink
containing alcohol on one or more of the past 30 days) is 18.4%.
Among students who drank alcohol during the past 30 days, 36.8% of students usually drank two or
more drinks per day on the days they drank alcohol during the past 30 days.
Among students who drank alcohol during the past 30 days, 49.4% of students usually got the
alcohol they drank from their friends.
Overall, 16.1% of students drank so much alcohol they were really drunk one or more times during
their life.
Overall, 13.6% of students got into trouble with their family or friends, missed school, or got into
fights one or more times during their life as a result of drinking alcohol.
Overall, 85.0% students definitely or probably not drink if one of their best friends offered a drink of
alcohol.
Overall, 54.3% students taught in any of their classes during the school year the problems associated
with drinking alcohol.
Overall, 55.5% students taught in any of their classes during the school year the effects of alcohol
use on decision making.
Although there is no significantly different on drinking alcohol among males and females but the
prevalence of drinking alcohol is very high of 63.4% on their first drink before age of 14 years. This
is significantly identified early exposure to behaviour of drinking alcohol. The prevalence of 18.4%
student who currently drinking is very high and also to identify 49.4% of both gender are more
likely to drink alcohol when their friends gave them to drink.
Dietary Behaviours
Table 3. BMI and dietary behaviours, by sex, TONGA, 2010.
Behaviour or Health
Outcome
Total %
(CI)*
Sex
Male %
(CI)
Female %
(CI)
Males Different
Than Females (Yes
or No) Underweight
1 0.2
(0.1 – 0.5)
0.3
(0.1 – 0.9)
0.0
( - - - )
Yes
Overweight2
58.7
(56.0 – 61.3)
59.8
(56.5 – 62.9)
57.6
(53.5 – 61.5)
No
Obese3 21.1
(18.8 – 23.6)
23.9
(20.7 – 27.4)
18.1
(15.2 – 21.5)
No
13
Went hungry most of the time or
always because there was not enough
food in their home during the past 30
days
14.2
(12.5 – 16.0)
15.6
(13.2 – 18.4)
12.3
(10.3 – 14.7)
No
Usually ate fruit two or more times
per day during the past 30 days
41.5
(38.9 – 44.1)
39.9
(35.8 – 44.1)
43.2
(39.8 – 46.6)
No
Usually ate vegetables three or more
times per day during the past 30 days
36.1
(33.7 – 38.6)
34.1
(29.9 – 38.4)
38.5
(35.1 – 42.0)
No
Usually ate fruits and vegetables five
or more times per day during the past
30 days
38.7
(36.0 – 41.6)
37.2
(32.9 – 41.6)
40.7
(37.0 – 44.6)
No
Usually drank carbonated soft drinks
one or more times per day during the
past 30 days
56.3
(54.1 – 58.5)
55.0
(51.8 – 58.2)
57.6
(54.6 – 60.6)
No
Ate food from a fast food restaurant
on three or more days during the past
7 days
24.3
(22.1 – 26.6)
21.3
(18.6 – 24.3)
27.5
(24.3 – 30.9)
No
Described themselves as slightly or
very overweight
26.2
(24.1 – 28.3)
25.2
(22.5 – 28.1)
27.1
(24.3 – 30.3)
No
Ate breakfast most of the time or
always during the past 30 days
40.9
(38.4 – 43.5)
40.7
(37.1 – 44.3)
41.2
(38.2 – 44.2)
No
Taught in any of their classes during
this school year the benefits of
healthy eating
66.2
(62.9 – 69.3)
67.0
(61.8 – 71.8) 65.1
(62.0 – 68.1)
No
Taught in any of the classes during
this school year the benefits of eating
more fruits and vegetables
63.6
(60.4 – 66.7)
64.2
(59.8 – 68.3)
62.9
(59.2 – 66.6)
No
Taught in any of their classes during
this school year healthy ways to lose
weight
46.4
(43.1 – 49.7) 49.8
(45.0 – 54.5)
42.3
(38.5 – 46.3)
No
*95% confidence interval. 1<-2SD from median for BMI by age and sex.
2>+1SD from median for BMI by age and sex.
3>+2SD from median for BMI by age and sex.
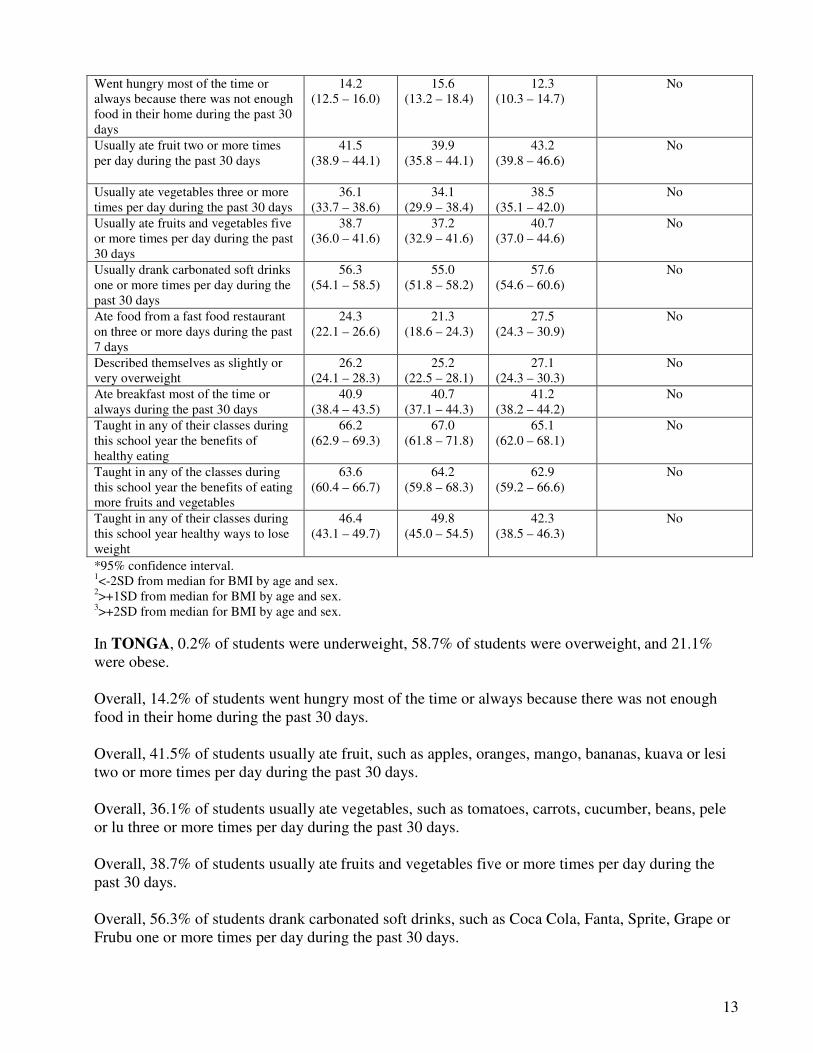
In TONGA, 0.2% of students were underweight, 58.7% of students were overweight, and 21.1%
were obese.
Overall, 14.2% of students went hungry most of the time or always because there was not enough
food in their home during the past 30 days.
Overall, 41.5% of students usually ate fruit, such as apples, oranges, mango, bananas, kuava or lesi
two or more times per day during the past 30 days.
Overall, 36.1% of students usually ate vegetables, such as tomatoes, carrots, cucumber, beans, pele
or lu three or more times per day during the past 30 days.
Overall, 38.7% of students usually ate fruits and vegetables five or more times per day during the
past 30 days.
Overall, 56.3% of students drank carbonated soft drinks, such as Coca Cola, Fanta, Sprite, Grape or
Frubu one or more times per day during the past 30 days.

14
Overall, 24.3% of students ate food from a fast food restaurant, such as BBQ takeaway, Hot Curry
takeaway, Country Fried Chicken takeaway and Fish & Chips takeaway on three or more days
during the past 7 days.
Overall, 26.2% of students describe themselves as slightly or very overweight.
Overall, 40.9% of students ate breakfast most of the time or always during the past 30 days.
Overall, 66.2% of students taught in any of their classes during this school year the benefits of
healthy eating.
Overall, 63.6% of students taught in any of their classes during this school year the benefits of
eating more fruits and vegetables.
Overall, 46.4 of students taught in any of their classes during this school year healthy ways to lose
weight.
Overall, males and females are not significantly different except females are more likely
underweight than males. The 58.7% prevalence of overweight and 21.1% obese are high among
student. The 56.3% prevalence of drinking carbonated soft drinks among targeted age group is also
high.
Drug Use
Table 4. Drug-use behaviours, by sex, TONGA, 2010.
Behaviour
Total %
(CI)*
Sex
Male %
(CI)
Female %
(CI)
Males Different Than
Females (Yes or No) Among students who ever used
drugs, those who first used drugs
before age 14 years
67.5
(60.3 – 73.9)
70.5
(61.0 - 78.5)
64.0
(53.5 – 73.3)
No
Used marijuana one or more times
during their life
7.5
(5.9 – 9.5)
6.1
(4.0 – 9.2)
8.7
(6.5 – 11.5)
No
Used marijuana one or more times
during the past 30 days
6.8
(5.2 – 8.8)
6.5
(4.4 – 9.6)
7.0
(5.1 – 9.5)
No
Used amphetamines or
methamphetamines one or more
times during their life
6.4
(4.7 – 8.5)
6.1
(3.8 – 9.7)
6.4
(4.3 – 9.5)
No
Used marijuana one or more times
during the past 12 months
10.1
(7.7 – 13.2)
9.2
(6.0 – 14.1)
10.6
(7.7 – 14.5)
No
Got into trouble with their family or
friends, missed school, or got into
fights, as a result of using drugs
during their life
15.8
(13.6 – 18.2)
14.9
(11.4 – 19.2)
16.6
(14.2 – 19.4)
No
Taught in any of their classes
during this school year the
problems associated with using
drugs
51.5
(48.0 – 55.1)
53.1
(47.4 – 58.8)
49.6
(45.7 – 53.6)
No
*95% confidence interval.
In TONGA, among students who ever used drugs, 67.5% of students first used drugs before age 14
years.

15
Overall, 7.5% of students used marijuana one or more times during their life.
Overall, 6.8% of students used marijuana one or more times during the past 30 days.
Overall, 6.4% of students used amphetamines or methamphetamines one or more times during their
life.
Overall, 10.1% of students used marijuana one or more times during the past 12 months.
Overall, 15.8% of students who one or more times got into trouble with their family or friends,
missed school, or got into fights as a result of using drugs during their life.
Overall, 51.5% of students taught in any of their classes during this school year the problems
associated with using drugs.
Overall there is no different amongst males and females but to recognize the 67.4% prevalence of
students who are using drugs before the age 14 years is high. As such indicating the exposure to
behavour of using drugs is respectively high.
Hygiene
Table 5. Hygiene-related behaviours, by sex, TONGA, 2010.
Question
Total %
(CI)*
Sex
Male %
(CI)
Female %
(CI)
Males Different Than
Females (Yes or No) Usually cleaned or brushed their
teeth less than one time per day
during the past 30 days
9.6
(8.2 – 11.2)
11.7
(9.3 – 14.6)
7.0
(5.7 – 8.7)
Yes
Never or rarely washed their
hands before eating during the
past 30 days
11.9
(10.2 – 13.9)
11.8
(9.4 – 14.7)
11.5
(9.5 – 13.9)
No
Never or rarely washed their
hands after using the toilet or
latrine during the past 30 days
7.0
(5.8 – 8.5)
7.1
(5.4 – 9.4)
6.7
(5.3 – 8.5)
No
Never or rarely used soap when
washing their hands during the
past 30 days
17.8
(15.8 – 19.9)
16.4
(14.0 – 19.0)
19.2
(16.2 – 22.5)
No
Taught in any of their classes
during this school year the
importance of cleaning or
brushing teeth
70.3
(66.8 – 73.5)
68.7
(64.0 – 73.1)
71.7
(67.1 – 75.9)
No
Taught in any of their classes
during this school year the
importance of hand washing
68.1
(64.9 – 71.2)
67.5
(62.9 – 71.9)
68.5
(64.5 – 72.3)
No
*95% confidence interval.
In TONGA, the percentage of students who usually cleaned or brushed their teeth less than one time
per day during the past 30 days was 9.6%.

16
Overall, 11.9% of students never or rarely washed their hands before eating during the past 30 days.
Overall, 7.0% of students never or rarely washed their hands after using the toilet or latrine during
the past 30 days.
Overall, 17.8% of students never or rarely used soap when washing their hands during the past 30
days.
Overall, 70.3% of students were taught in any of their classes during this school year the importance
of cleaning or brushing teeth.
Overall, 68.1% of students were taught in any of their classes during this school year the importance
of hand washing.
Overall males are significantly cleaned or brushed their teeth less than one time per day during the
past 30 days than females. The hygiene behaviour of the students around 10% is very too low while
around 70% were being taught in their classes the importance of cleaning or brushing teeth and
handwashing.
Mental Health
Table 6. Mental health issues among students, by sex, TONGA, 2010 .
Behaviour
Total %
(CI)*
Sex
Male %
(CI)
Female %
(CI)
Males Different Than
Females (Yes or No) Most of the time or always felt
lonely during the past 12 months
17.2
(15.0 – 19.5)
18.6
(15.4 – 22.3)
15.5
(13.2 – 18.1)
No
Most of the time or always were
so worried about something that
they could not sleep at night
during the past 12 months
15.9
(14.1 – 17.9)
16.1
(13.3 – 19.3)
15.8
(13.9 – 18.0)
No
Ever seriously considered
attempting suicide during the past
12 months
28.5
(25.1 – 32.1)
30.6
(25.2 – 36.4)
26.5
(23.2 – 30.1)
No
Made a plan about how they
would attempt suicide during the
past 12 months
29.5
(26.7 – 32.5)
30.0
(25.2 – 35.3)
28.7
(25.6 – 32.0)
No
Actually attempted suicide one or
more times during the past 12
months
35.7
(32.5 – 39.1)
35.6
(30.7 – 40.8)
35.3
(31.7 – 39.2)
No
Had no close friends 9.6
(8.3 – 11.1)
10.1
(8.3 – 12.4)
8.7
(6.8 – 11.1)
No
Among students who most of the
time or always worried about
something that they could not
sleep at night during the past 12
months, the percentage who were
bullied on one or more days
during the past 30 days
65.6
(57.9 – 72.7)
70.7
(59.6 – 79.7)
60.3
(50.8 – 69.0)
No
Most of the time or always were
so worried about something that
they wanted to use alcohol or
6.8
(5.6 – 8.2)
7.9
(6.1 – 10.3)
5.5
(4.1 – 7.3)
No

17
drugs to feel better during the
past 12 months
Taught in any of their classes
during this school year how to
manage anger
45.4
(42.1 – 48.8)
46.8
(42.0 – 51.7)
43.5
(39.5 – 47.5)
No
Taught in any of their classes
during this school year signs of
depression and suicidal behavior
38.8
(35.2 – 42.5)
39.8
(34.7 – 45.1)
37.8
(34.1 – 41.7)
No
Taught in any of their classes
during this school year what to do
if a friend is thinking about
suicide
31.9
(29.3 – 34.7)
30.9
(27.1 – 35.1)
32.9
(30.3 – 35.7)
No
Taught in any of their classes
during this school year how to
handle stress in healthy ways
53.7
(50.6 – 56.8)
53.9
(49.6 – 58.0)
53.6
(49.6 – 57.6)
No
*95% confidence interval.
In TONGA, 17.2% of students most of the time or always felt lonely during the past 12 months.
Overall, 15.9% of students most of the time or always were so worried about something that they
could not sleep at night during the past 12 months.
Overall, 28.5% of students ever seriously considered attempting suicide during the past 12 months.
Overall, 29.5% of students made a plan about they would attempt suicide during the past 12 months.
Overall, 35.7% of students actually attempted suicide one or more times during the past 12 months.
Overall, 9.6% of students had no close friends.
Among students most of the time or always had been so worried about something that they could not
sleep at night during the past 12 months, 65.6% were bullied on one or more days during the past 30
days.
Overall, 6.8% of students that most of the time or always were so worried about something that they
wanted to use alcohol or drugs to feel better during the past 12 months.
Overall, 45.4% of students were taught in any of their classes during this school year how to manage
anger.
Overall, 38.8% of students were taught in any of their classes during this school year signs of
depression and suicidal behavior.
Overall, 31.9% of students were taught in any of their classes during this year of school what to do if
a friend is thinking about suicide.
Overall, 53.7% of students were taught in any of their classes during this school year how to handle
stress in healthy ways.

18
Significantly attempting suicidal behaviors are relative high to recognize in time despite that there is
no significantly different between males and females. The 65.6% of students are couldn’t sleep at
night and worried because they bullied on one or days during the last 30 days is high.
Physical Activity
Table 7. Physical activity among students, by sex, TONGA, 2010.
Behaviour
Total %
(CI)*
Sex
Male %
(CI)
Female %
(CI)
Males Different Than
Females (Yes or No) Were physically active for a total
of at least 60 minutes per day on
five or more days during the past
seven days
25.1
(22.2 – 28.3)
24.9
(20.3 – 30.1)
25.2
(22.3 – 28.4)
No
Were physically active for a total
of at least 60 minutes per day on
all seven days during the past
seven days
13.8
(11.9 – 16.0)
11.7
(9.5 – 14.2)
15.9
(13.1 – 19.1)
No
Did not walk or ride a bicycle to
or from school during the past
seven days
41.9
(39.0 – 44.9)
38.9
(35.1 – 42.9)
45.5
(41.4 – 49.6
No
Went to physical education class
on three or more days each week
during this school year
23.8
(21.9 – 25.8)
22.4
(19.6 – 25.6)
24.8
(22.2 – 27.5)
No
Went to physical education class
on five or more days each week
during this school year
16.5
(14.8 – 18.3)
15.8
(13.5 – 18.5)
16.9
(14.6 – 19.4)
No
Spent three or more hours per day
during a typical or usual day
doing sitting activities
28.8
(26.4 – 31.3)
28.2
(24.9 – 31.6)
29.5
(26.2 – 33.0)
No
Taught in any of their classes
during this school year the
benefits of physical activity
60.7
(57.5 – 63.9)
63.3
(58.4 – 68.0)
57.9
(53.9 – 61.7)
No
Taught in any of their classes
during this school year about
opportunities for physical activity
in their community
46.4
(43.0 – 49.9)
45.6
(40.8 – 50.5)
47.1
(43.0 – 51.2)
No
*95% confidence interval.
In TONGA, 25.1% of students were physically active for a total of at least 60 minutes per day on
five or more days during the past seven days.
Overall, 13.8% of students were physically active for a total of at least 60 minutes on all seven days
during the past seven days.
Overall, 41.9% of students did not walk or ride a bicycle to or from school during the past seven
days.
Overall, 23.8% of students went to physical education class on three or more days each week
during this school year.
Overall, 16.5% of students went to physical education class on five or more days each week during
this school year.
19
Overall, 28.8% of students spent three or more hours per day during a typical or usual day doing
sitting activities, such as watching video and games.
Overall, 60.7% of students were taught in any of their classes during this school year the benefit of
physical activity.
Overall, 46.4% of students were taught in any of their classes during this school year about
opportunities for physical activity in their community.
There is no significant different between males and females but to recognize the lower level of
physical activity on both gender is 25.1% at least five or more days a week during the past seven
days.
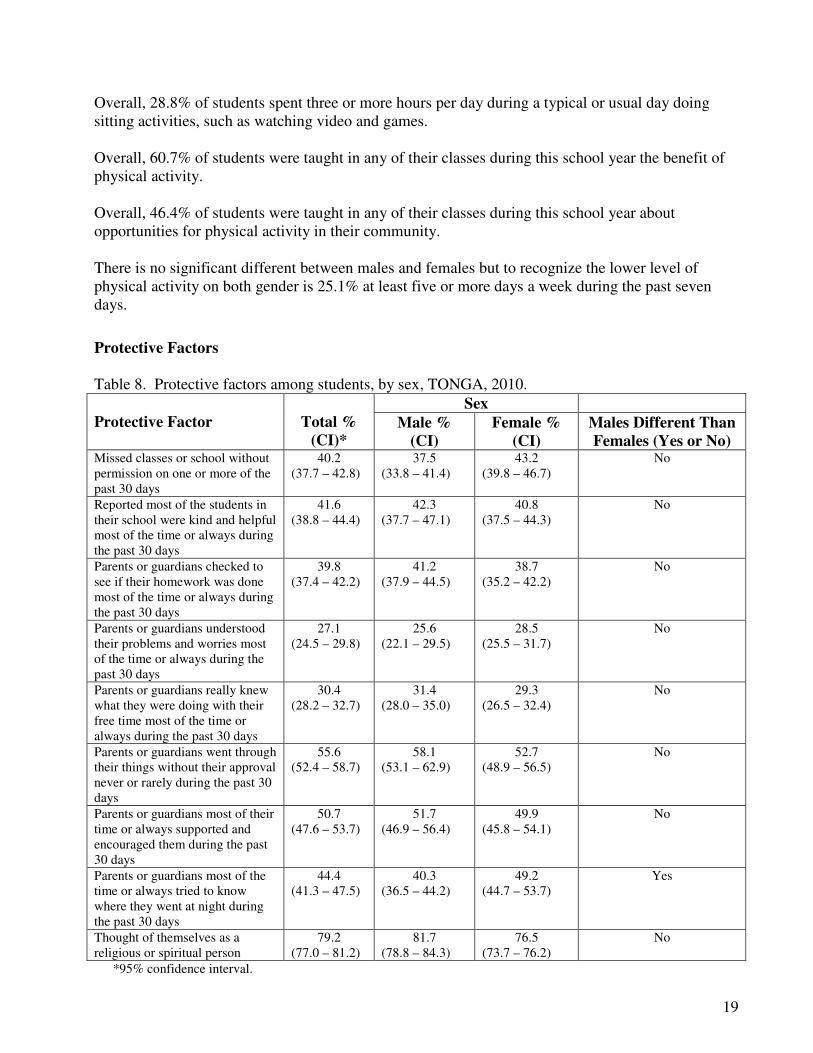
Protective Factors
Table 8. Protective factors among students, by sex, TONGA, 2010.
Protective Factor
Total %
(CI)*
Sex
Male %
(CI)
Female %
(CI)
Males Different Than
Females (Yes or No) Missed classes or school without
permission on one or more of the
past 30 days
40.2
(37.7 – 42.8)
37.5
(33.8 – 41.4)
43.2
(39.8 – 46.7)
No
Reported most of the students in
their school were kind and helpful
most of the time or always during
the past 30 days
41.6
(38.8 – 44.4)
42.3
(37.7 – 47.1)
40.8
(37.5 – 44.3)
No
Parents or guardians checked to
see if their homework was done
most of the time or always during
the past 30 days
39.8
(37.4 – 42.2)
41.2
(37.9 – 44.5)
38.7
(35.2 – 42.2)
No
Parents or guardians understood
their problems and worries most
of the time or always during the
past 30 days
27.1
(24.5 – 29.8)
25.6
(22.1 – 29.5)
28.5
(25.5 – 31.7)
No
Parents or guardians really knew
what they were doing with their
free time most of the time or
always during the past 30 days
30.4
(28.2 – 32.7)
31.4
(28.0 – 35.0)
29.3
(26.5 – 32.4)
No
Parents or guardians went through
their things without their approval
never or rarely during the past 30
days
55.6
(52.4 – 58.7)
58.1
(53.1 – 62.9)
52.7
(48.9 – 56.5)
No
Parents or guardians most of their
time or always supported and
encouraged them during the past
30 days
50.7
(47.6 – 53.7)
51.7
(46.9 – 56.4)
49.9
(45.8 – 54.1)
No
Parents or guardians most of the
time or always tried to know
where they went at night during
the past 30 days
44.4
(41.3 – 47.5)
40.3
(36.5 – 44.2)
49.2
(44.7 – 53.7)
Yes
Thought of themselves as a
religious or spiritual person
79.2
(77.0 – 81.2)
81.7
(78.8 – 84.3)
76.5
(73.7 – 76.2)
No
*95% confidence interval.
20
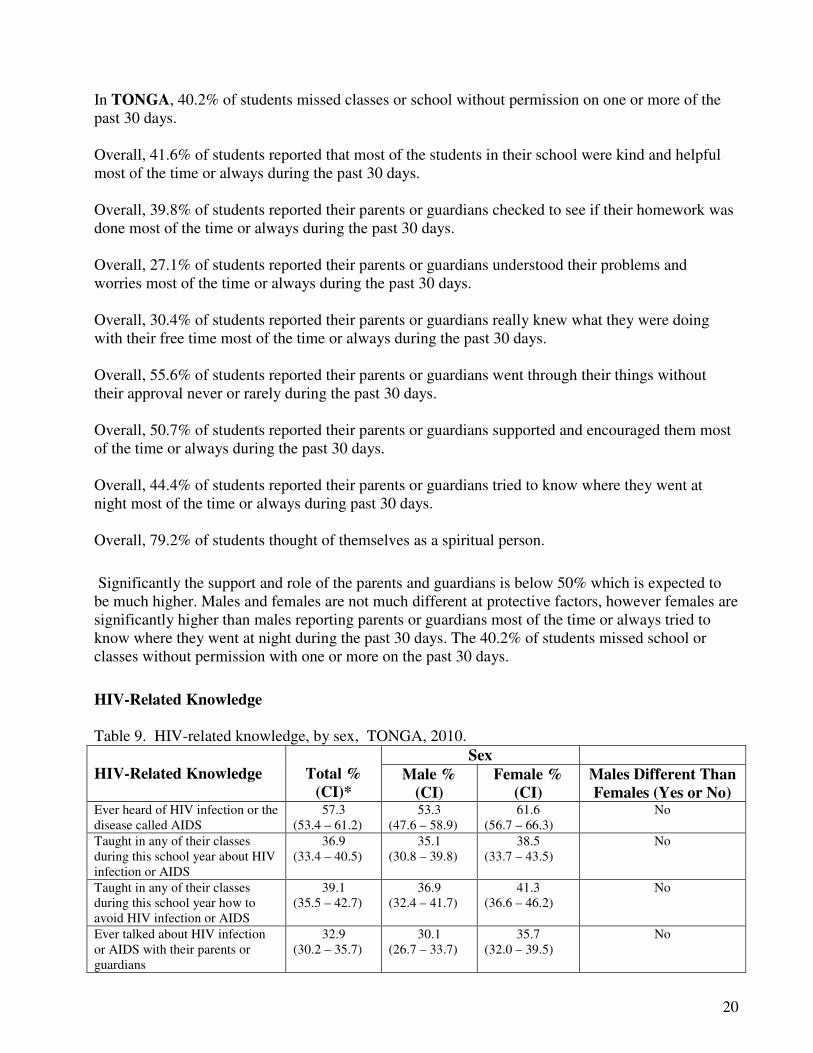
In TONGA, 40.2% of students missed classes or school without permission on one or more of the
past 30 days.
Overall, 41.6% of students reported that most of the students in their school were kind and helpful
most of the time or always during the past 30 days.
Overall, 39.8% of students reported their parents or guardians checked to see if their homework was
done most of the time or always during the past 30 days.
Overall, 27.1% of students reported their parents or guardians understood their problems and
worries most of the time or always during the past 30 days.
Overall, 30.4% of students reported their parents or guardians really knew what they were doing
with their free time most of the time or always during the past 30 days.
Overall, 55.6% of students reported their parents or guardians went through their things without
their approval never or rarely during the past 30 days.
Overall, 50.7% of students reported their parents or guardians supported and encouraged them most
of the time or always during the past 30 days.
Overall, 44.4% of students reported their parents or guardians tried to know where they went at
night most of the time or always during past 30 days.
Overall, 79.2% of students thought of themselves as a spiritual person.
Significantly the support and role of the parents and guardians is below 50% which is expected to
be much higher. Males and females are not much different at protective factors, however females are
significantly higher than males reporting parents or guardians most of the time or always tried to
know where they went at night during the past 30 days. The 40.2% of students missed school or
classes without permission with one or more on the past 30 days.
HIV-Related Knowledge
Table 9. HIV-related knowledge, by sex, TONGA, 2010.
HIV-Related Knowledge
Total %
(CI)*
Sex
Male %
(CI)
Female %
(CI)
Males Different Than
Females (Yes or No) Ever heard of HIV infection or the
disease called AIDS
57.3
(53.4 – 61.2)
53.3
(47.6 – 58.9)
61.6
(56.7 – 66.3)
No
Taught in any of their classes
during this school year about HIV
infection or AIDS
36.9
(33.4 – 40.5)
35.1
(30.8 – 39.8)
38.5
(33.7 – 43.5)
No
Taught in any of their classes
during this school year how to
avoid HIV infection or AIDS
39.1
(35.5 – 42.7)
36.9
(32.4 – 41.7)
41.3
(36.6 – 46.2)
No
Ever talked about HIV infection
or AIDS with their parents or
guardians
32.9
(30.2 – 35.7)
30.1
(26.7 – 33.7)
35.7
(32.0 – 39.5)
No

21
Taught in any of their classes
during this school year where to
get tested for HIV infection or
AIDS
28.3
(25.0 – 32.0)
27.0
(22.1 – 32.6)
29.4
(25.4 – 33.9)
No
Taught in any of their classes
during this school year the
importance of being kind and
supportive to persons with HIV
infection and AIDS
30.6
(27.9 – 33.4)
30.9
(27.7 – 34.3)
29.6
(25.9 – 33.6)
No
Taught in any of their classes
during this school year the signs
and symptoms of HIV infections
or AIDS
29.0
(26.1 – 32.1)
29.3
(25.6 – 33.2)
28.4
(24.6 – 32.6)
No
Taught in any of their classes
during this school year about the
effectiveness of condom
28.0
(24.7 – 31.6)
28.9
(23.7 – 34.6)
26.7
(22.8 – 31.1)
No
*95% confidence interval
In TONGA, 57.3% of students had ever heard of HIV infection or the disease called AIDS.
Overall, 36.9% of students were taught in any of their classes during this school year about HIV
infection or AIDS.
Overall, 39.1% of students had been taught in any of their classes during this school year how to
avoid HIV infection or AIDS.
Overall, 32.9% of students ever talked about HIV infection or AIDS with their parents or guardians.
Overall, 28.3% of students were taught in any of their classes during this school year where to get
tested for HIV infections or AIDS.
Overall, 30.6% of students were taught in any if their classes during this school year the importance
of being kind and supportive to persons with HIV infections or AIDS.
Overall, 29.0% of students were taught in any of their classes during this school year the signs and
symptoms of HIV infection or AIDS.
Overall, 28.0% of students were taught in any of their classes during this school year about the
effectiveness of condoms.
Addressing of HIV infections or AIDS is 32.9% as it is not supported by the parents and guardians
to talk about. This is strongly indicated the existence of taboo and traditional influence. The 57.3%
of students had ever heard of HIV infections and AIDS. Males and females are not significantly
different on HIV.
Tobacco Use
Table 10. Tobacco use among students, by sex, TONGA, 2010.
Behaviour
Total %
(CI)*
Sex
Male %
(CI)
Female %
(CI)
Males Different Than
Females (Yes or No) Among students who ever 76.1 76.3 76.3 No
22
smoked cigarettes, those who first
tried a cigarette before age 14
years
(72.4 – 79.5) (71.2 – 80.7) (70.9 – 81.0)
Smoked cigarettes on one or more
days during the past 30 days
22.7
(19.9 – 25.8)
20.9
(17.5 – 24.8)
24.4
(20.7 – 28.4)
No
Used any tobacco products other
than cigarettes on one or more
days during the past 30 days
20.6
(18.0 – 23.4)
20.3
(17.0 – 24.0)
20.7
(17.6 – 24.1)
No
Used any tobacco on one or more
days during the past 30 days
26.3
(23.4 – 29.6)
24.3
(20.5 – 28.6)
28.0
(24.3 – 32.1)
No
Among students who smoked
cigarettes during the past 12
months, those who tried to stop
smoking cigarettes during the past
12 months
82.1
(77.5 – 86.0)
81.0
(74.4 – 86.3)
83.5
(77.1 – 88.3)
No
Reported people smoked in their
presence on one or more days
during the past seven days
66.6
(62.8 – 70.2)
67.1
(61.5 – 72.2)
66.2
(61.7 – 70.4)
No
Had parents or guardians who
used any form of tobacco
42.3
(39.5 – 45.1)
42.4
(38.2 – 46.7)
42.3
(38.6 – 46.1)
No
Would definitely or probably not
smoke a cigarette during the next
12 months
86.6
(84.6 – 88.5)
86.1
(83.3 – 88.6)
87.3
(84.5 – 89.7)
No
Would definitely or probably not
smoke if one of their best friends
offered them a cigarette
85.6
(83.4 – 87.6)
86.1
(82.9 – 88.7)
85.3
(82.2 – 88.0)
No
*95% confidence interval.
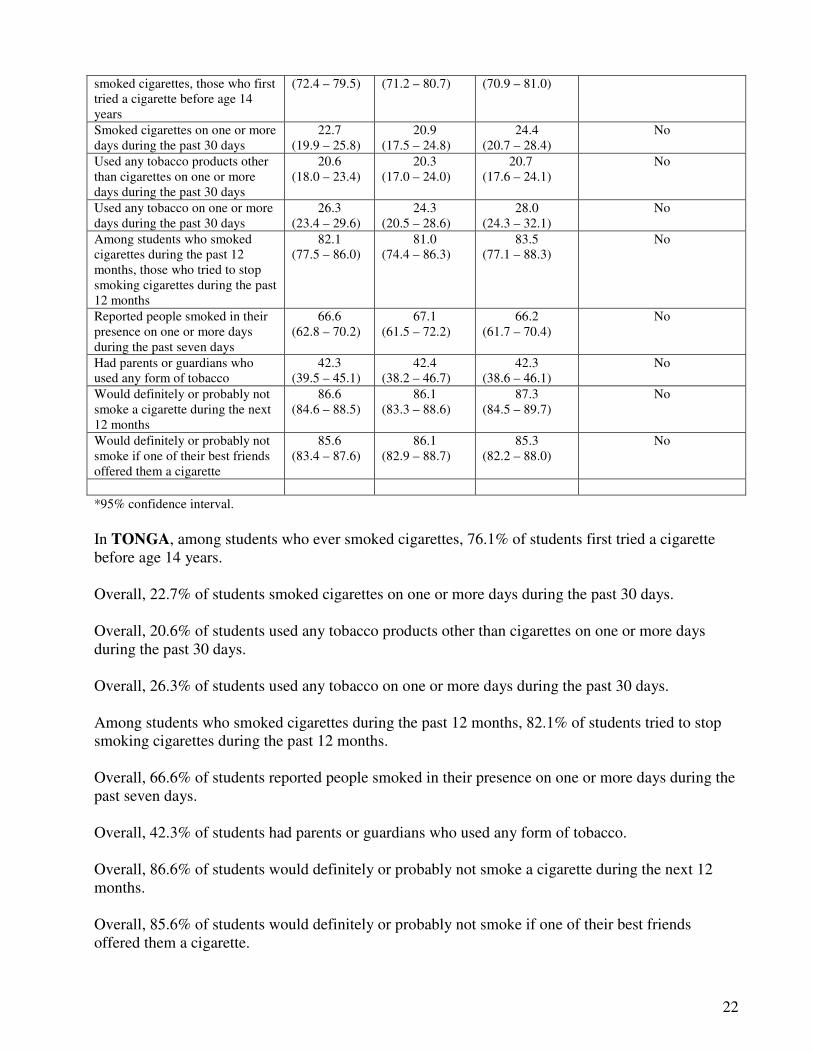
In TONGA, among students who ever smoked cigarettes, 76.1% of students first tried a cigarette
before age 14 years.
Overall, 22.7% of students smoked cigarettes on one or more days during the past 30 days.
Overall, 20.6% of students used any tobacco products other than cigarettes on one or more days
during the past 30 days.
Overall, 26.3% of students used any tobacco on one or more days during the past 30 days.
Among students who smoked cigarettes during the past 12 months, 82.1% of students tried to stop
smoking cigarettes during the past 12 months.
Overall, 66.6% of students reported people smoked in their presence on one or more days during the
past seven days.
Overall, 42.3% of students had parents or guardians who used any form of tobacco.
Overall, 86.6% of students would definitely or probably not smoke a cigarette during the next 12
months.
Overall, 85.6% of students would definitely or probably not smoke if one of their best friends
offered them a cigarette.

23
Among students who ever smoked cigarettes, the 76.1% of students exposed to smoking before age
of 14 years is very high and prevalence of 22.7% is also an alarming. Among males and females
have no different in tobacco use.
Violence and Unintentional Injury
Table 11. Violence and unintentional injury among students, by sex, TONGA, 2010.
Behaviour
Total %
(CI)*
Sex
Male %
(CI)
Female %
(CI)
Males Different Than
Females (Yes or No) Were physically attacked one or
more times during the past 12
months
50.9
(48.3 – 53.6)
48.1
(44.5 – 51.8)
53.4
(49.6 – 57.2)
No
Were in a physical fight one or
more times during the past 12
months
49.2
(46.5 – 52.0)
47.8
(43.6 – 52.1)
50.7
(47.0 – 54.4)
No
Were seriously injured one or
more times during the past 12
months
62.7
(59.6 – 65.7)
59.5
(54.4 – 64.4)
65.6
(61.8 – 69.2)
No
Among students who were
seriously injured during the past
12 months, those whose most
serious injury was a broken bone
or dislocated joint
17.5
(14.9 – 20.5)
20.7
(16.9 – 25.0)
13.8
(10.4 – 18.1)
No
Among students who were
seriously injured during the past
12 months, those who most
serious injury was caused by a
motor vehicle accident or being
hit by a motor vehicle
9.4
(7.3 – 12.1)
11.1
(7.9 – 15.5)
7.6
(5.1 – 11.1)
No
Were bullied on one or more days
during the past 30 days
51.3
(47.6 – 54.9)
49.5
(43.7 – 55.3)
52.7
(48.8 – 56.5)
No
Among students who were bullied
during the past 30 days, those
who were bullied most often by
being hit, kicked, pushed, shoved
around, or locked indoors
21.1
(18.2 – 24.3)
20.2
(16.6 – 24.4)
22.1
(17.9 – 26.8)
No
Among students who rode in a
motor vehicle driven by someone
else during the past 30 days and
never or rarely used a seat belt
53.3 (50.1 – 56.5)
53.6 (49.3 – 57.7)
53.1 (48.5 – 57.6)
No
Among students who rode in a
motor vehicle driven by someone
else during the past 30 days who
rode in a car or other motor
vehicle one or more times driven
by someone who had been
drinking alcohol
39.0 (35.7 – 42.3)
40.1 (36.2 – 44.1)
37.6 (32.7 – 42.7)
No
Taught in any of their classes
during this school year how to
avoid or prevent motor vehicle
accidents
47.7 (44.5 – 51.0)
51.0 (45.9 – 56.1)
44.2
(40.7 – 47.9) No
*95% confidence interval.
In TONGA, 50.9% of students were physically attacked one or more times during the past 12
months.

24
Overall, 49.2% of students were in a physical fight one or more times during the past 12 months.
Overall, 62.7% of students were seriously injured one or more times during the past 12 months.
Among students who were seriously injured during the past 12 months, a broken bone or dislocated
joint was the most serious injury among 17.5% of students.
Among students who were seriously injured during the past 12 months, a motor vehicle accident or
being hit by a motor vehicle was the cause of the most serious injury among 9.4% of students.
Overall, 51.3% of students were bullied on one or more days during the past 30 days.
Among students who were bullied during the past 30 days, being hit, kicked, pushed, shoved
around, or locked indoors was the most common form of bullying among 21.1% of students.
Among students who were rode in a motor vehicle driven by someone else during the past 30 days,
53.3% of students who never or rarely used a seat belt.
Among students who rode in a motor vehicle driven by someone else during the past 30 days, 39.0%
of students who rode in a car or other motor vehicle one or more times driven by someone who had
been drinking alcohol.
Overall, 47.7% of students were taught in any of their classes during this school year how to avoid
or prevent motor vehicle accidents.
The students were more likely to injure from related behavior of violence and unintentional injury as
significantly indicated of 50.9% were physically attacked, 49.2% physical fight and 62.7% were
seriously injured. The 53.3% of students who were rode in a motor vehicle never or rarely used seat
belt. Drinking of alcohol while driving in a motor vehicle is 39.0%. Among males and females were
not different on violence and unintentional injury.

25
Conclusions:
Tonga GSHS has important results and interesting findings to look at for better intervention to
overcome risk behaviours and protective factors for students as follows.
o Alcohol, Tobacco and Drug use
Tonga students were at risk of early exposure to drinking alcohol, smoking cigarette and drug use.
As clearly indicated that around 63% of students before the age 14 years who had their first drink,
smoke cigarette and drug use. In every 3 out of 5 students were in the presence of people smoking
and 2 out 5 had parent smoking. The influence of friendship in drinking alcohol is around 86% of
the students.
o Dietary Behaviour
There is no significant different on both gender whereas 3 out of 5 students were overweight while 1
out of 5 students were obese. The students usually ate fruits and vegetables are below average. The
drinking of carbonated soft drinks is around half of the students.
o Hygiene
Tonga students who usually cleaned or brushed their teeth less than one time per day during the past
30 days was in one out of ten and the same as washing hands before eating and washing hands after
using the toilet or latrine.
o Mental Health
Tonga students of almost one third were ever seriously considered attempting suicide and made a
plan during the past 12 months. Two third of the students were most of the time or always worried
about something that they could not sleep at night during the past 12 months , the percentage who
were bullied on one or more days during the past 30 days.
o Physical Activity
Tonga one ten of students was physically active for a total of at least 60 minutes on all seven days of
the week which is far below average. In physical education class on five or more days a week during
school year is four out of twenty five or 16.5%. One third of students spent three or more hours per
day doing sitting activities.
o Protective Factors
Tongan parents or guardians understood the student problems and worries most of their time is
around one third. The 40.2% of students missed classes or school without permission once or more
of the past 30 days.
o HIV-Related knowledge
Tonga parents or guardians hardly talked about HIV infection or AIDS is around one third. Three
out of five students had ever heard of HIV infection or the disease called AIDS. Taught in school of
HIV infection and AIDS is around one third of students.
o Violence and Unintentional Injury
Tonga students that half of them were physically attacked and involved in physical fight one or more
times during the past 12 months. Three out five students were seriously injured in the past 12
months. The students being bullied on the last 30 days is half of them. For not using seat belt that

26
half of the students. Two out of five students were in motor vehicle driven by someone who had
been drinking alcohol.
Recommendation:
Tonga is extremely found the baseline dataset on health related risk behaviours and protective
factors particularly the age group of 13 -15 years. The findings of Tonga GSHS warrant a call to
action to overcome the emerging health behaviours and generally improving population health. The
close collaboration and integration at the policy level for successful interventions is paramount to be
on board.
Tonga GSHS thus recommend that strengthening of strategic action and programs for Health
Promoting School in regards to the alarming health factors. The Education Departments are required
to engage closely on the matters arising.
o Presenting results from Tonga GSHS to related stakeholders and partners of health to notice
the prevalence of risk behaviours and protective factors.
The data dissemination is required to present to School Departments and related
organizations in order to draw attention for the current health factors that facing with
students. The national workshop is essential to host for Schools to realize the current and
significant data for the health of the Tonga students.
o Advocating schools and parents to take action in health promoting school programs.
The role of the schools and parents is paramount on planning of strategic action that
appropriate and effective for the overcoming of the health problems lie around school health.
School is solely known their individual health consequences and they are needed to come
together and take action.
School clinic and Health Officer should be established within school.
o Promoting healthy lifestyle in schools and parent teacher association based on the findings
Hence the advocacy conducted then promoting of healthy lifestyle through increasing
physical within school time is required. Growing of organic veggies at school backward and
selling of healthy food at the canteen or food stools at the school ground is needed to
enhancing. Tobacco is prohibited for student within school ground but not for teachers
whereas smoking at school ground during school time is against the Tobacco Act.
For every school should be required to employ a school teacher for physical education to
consistently running the classes during school days.
o Producing of IEC material in relation to the findings
The information, education and communication materials are paramount to develop and
produce for supporting the advocacy and promotion intervention for schools. This is required
to be available for educational purpose.

27
o Financial support
The financial support for the overall implementation based on the results is required enough
to push the activity effectively.
o The next survey will do after four years. Tonga should continue with the GSHS in order to track the trends and current prevalence of
health risk behaviours and protective factors after four years. It is also required to conduct in
the begin of the year as to minimize the student dropout whereas response rate was 80%
because of absentees towards end of the year.


