United States Department of Agriculture Forest Service Pacific Northwest Research Station General Technical Report PNW-GTR-934 April 2016 Tongass National Forest Timber Demand: Projections for 2015 to 2030 Jean M. Daniels, Michael D. Paruszkiewicz, and Susan J. Alexander
Transcript
United States Department of Agriculture
Forest Service
Pacific Northwest Research Station
General Technical ReportPNW-GTR-934
April 2016
Tongass National Forest Timber Demand: Projections for 2015 to 2030Jean M. Daniels, Michael D. Paruszkiewicz, and Susan J. Alexander
In accordance with federal civil rights law and U.S. Department of Agriculture (USDA) civil rights regulations and policies, the USDA, its agencies, offices, and employees, and institutions participating in or administering USDA programs are prohibited from discriminating based on race, color, national origin, religion, sex, gender identity (including gender expression), sexual orientation, disability, age, marital status, family/parental status, income derived from a public assistance program, political beliefs, or reprisal or retaliation for prior civil rights activity, in any program or activity conducted or funded by USDA (not all bases apply to all programs). Remedies and complaint filing deadlines vary by program or incident.
Persons with disabilities who require alternative means of communication for program information (e.g., braille, large print, audiotape, American sign language, etc.) should contact the responsible Agency or USDA’s TARGET Center at (202) 720-2600 (voice and TTY) or contact USDA through the Federal Relay Service at (800) 877-8339. Additionally, program information may be made available in languages other than English.
To file a program discrimination complaint, complete the USDA Program Discrimination Complaint Form, AD-3027, found online at http://www.ascr.usda.gov/complaint_filing_cust.html and at any USDA office or write a letter addressed to USDA and provide in the letter all of the information requested in the form. To request a copy of the complaint form, call (866) 632-9992. Submit your completed form or letter to USDA by: (1) mail: U.S. Department of Agriculture, Office of the Assistant Secretary for Civil Rights, 1400 Independence Avenue, SW, Washington, D.C. 20250-9410; (2) fax: (202) 690-7442; or (3) email: [email protected].
USDA is an equal opportunity provider, employer, and lender.
AuthorsJean M. Daniels is a research forester, U.S. Department of Agriculture, Forest Service, Pacific Northwest Research Station, Forestry Sciences Laboratory, 620 SW Main St., Suite 400, Portland, OR 97205; Michael D. Paruszkiewicz is an econo-mist, Northwest Economic Research Center, Portland State University, P.O. Box 751, Portland, OR 97207; Susan J. Alexander is a program manager; U.S. Depart-ment of Agriculture, Forest Service, Pacific Northwest Research Station, Forestry Sciences Laboratory, 11175 Auke Lake Way, Juneau AK 99801.
AbstractDaniels, Jean M.; Paruszkiewicz, Michael D.; Alexander, Susan J. 2016.
Tongass National Forest timber demand: projections for 2015 to 2030. Gen. Tech. Rep. PNW-GTR-934. Portland, OR: U.S. Department of Agriculture, Forest Service, Pacific Northwest Research Station. 53 p.
Projections of Alaska timber products output; the derived demand for logs, lumber, residues, and niche products; and timber harvest by owner were developed using a trend-based analysis. This is the fifth such analysis performed since 1990 to assist planners in meeting statutory requirements for estimating planning-cycle demand for timber from the Tongass National Forest. Results reflect the conse-quences of recent changes in Tongass forest policy, the Alaska forest sector, and trends in markets for Alaska products. Demand for Alaska national forest timber currently depends on markets for sawn wood and exports of softwood logs. Three scenarios are presented that display a range of possible future market conditions. The model was most sensitive to changes in Pacific Rim log demand. Areas of uncertainty include the prospect of continuing changes in markets and competi-tion, the impact of the transition to young-growth timber, and the rates of invest-ment in manufacturing in Alaska.
Contents 1 Introduction 2 Literature Review 4 Changes Since the Last Study 21 Methods 22 Steps Used for This Analysis 23 Identifying Markets 25 Assembling Historical Market Data 28 Baseline Model 32 Baseline Projected Demand and Harvest Estimates 32 Scenario 1 38 Scenario 2 44 Scenario 3 45 Sensitivity of the Model 45 Selecting an Alternative 48 Discussion and Conclusion 49 Acknowledgments 49 Metric Equivalents 49 Literature Cited
1
Tongass National Forest Timber Demand, Projections for 2015 to 2030
IntroductionThe Tongass Timber Reform Act (TTRA 1990) states that the Secretary of Agri-culture will “…seek to provide a supply of timber from the Tongass National Forest which (1) meets the annual market demand for timber from such forest and (2) meets the market demand for timber from such forest for each planning cycle.” Although all national forests are required to estimate demand for timber during forest planning efforts, the “seek to meet” requirement is unique to the Tongass National Forest. The USDA Forest Service Pacific Northwest Research Station has a tradition of conducting timber demand and price forecasting to support forest planning on the Tongass. Previous analyses have estimated the quantity of national forest timber required to satisfy projected demand for forest products given harvest by other owners and assumptions about future market conditions and prices.
The Pacific Northwest Research Station has been asked to assist planners in meeting the TTRA requirement for estimating planning cycle demand for timber from the Tongass. This is the fifth such analysis performed by the station. Results from this long-term analysis will be used by the Forest Service’s Alaska Region as an input in calculations of annual demand for Tongass timber and to inform new efforts to amend the Tongass Land Management Plan (TLMP). Results presented reflect the standing volume sold from an average forest stand on the Tongass.
Several findings in a 5-year review of the 2008 TLMP, including changes in forest policy regarding the harvest of timber on the Tongass and land ownership changes, resulted in a decision to amend the plan. Efforts were set into motion by evolving USDA policy limiting old-growth harvesting and encouraging the harvest of younger second-growth forest stands. In addition, some national forest lands were recently transferred to the Sealaska Corporation. These changes require a new analysis of planning-cycle timber demand projections to support planning efforts. Several other events have occurred that invalidate many of the assumptions for the last timber demand analysis. These include developments in Alaska’s forest sec-tor and domestic and export forest product markets, the entry of Tongass sawlogs into international export markets, rising fuel costs, and efforts to promote biomass energy products and technology for space heating and electricity generation.
The Tongass National Forest covers most of southeast Alaska; this analysis defines southeast Alaska explicitly as the region comprised by the Haines, Hoonah-Angoon, Juneau, Ketchikan-Gateway, Prince of Wales-Hyder, Petersburg, Sitka, Skagway, Wrangell, and Yakutat Census areas. A review of the literature with respect to previous demand studies and to changes to the forest products industry in southeast Alaska is presented next.
Results from this long-term analysis will be used by the Forest Service’s Alaska Region as an input in calculations of annual demand for Tongass timber and to inform new efforts to amend the Tongass Land Management Plan.
2
GENERAL TECHNICAL REPORT PNW-GTR-934
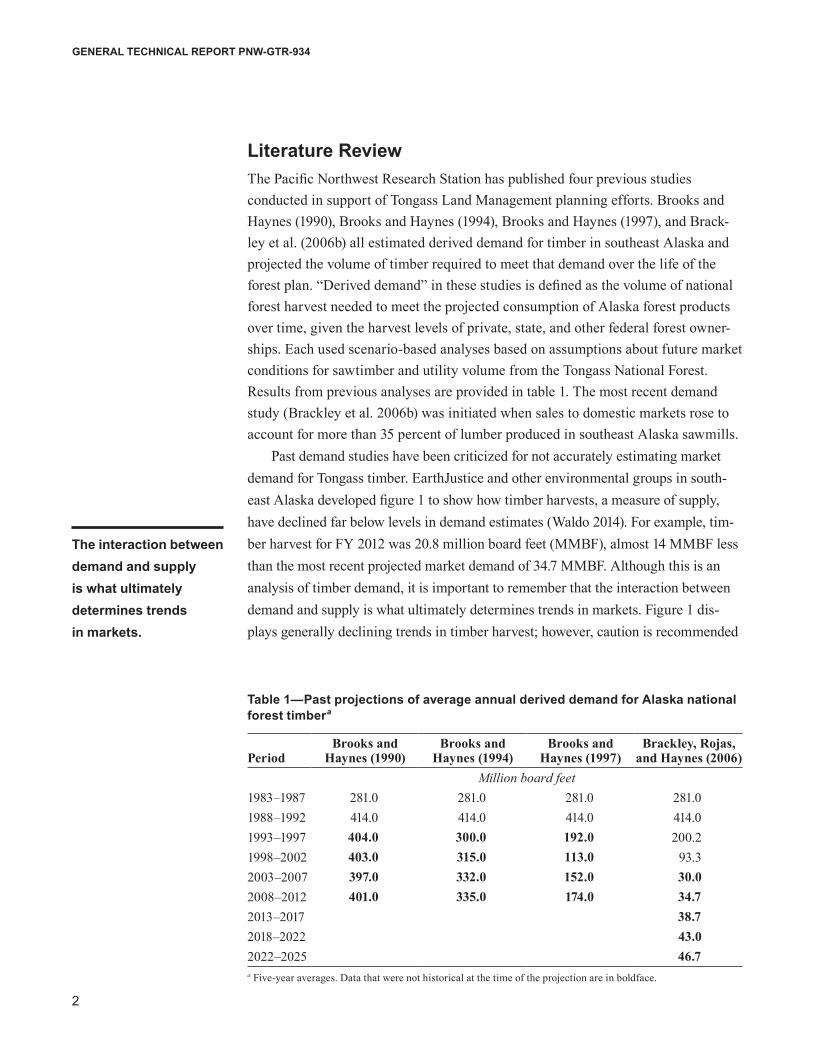
Literature ReviewThe Pacific Northwest Research Station has published four previous studies conducted in support of Tongass Land Management planning efforts. Brooks and Haynes (1990), Brooks and Haynes (1994), Brooks and Haynes (1997), and Brack-ley et al. (2006b) all estimated derived demand for timber in southeast Alaska and projected the volume of timber required to meet that demand over the life of the forest plan. “Derived demand” in these studies is defined as the volume of national forest harvest needed to meet the projected consumption of Alaska forest products over time, given the harvest levels of private, state, and other federal forest owner-ships. Each used scenario-based analyses based on assumptions about future market conditions for sawtimber and utility volume from the Tongass National Forest. Results from previous analyses are provided in table 1. The most recent demand study (Brackley et al. 2006b) was initiated when sales to domestic markets rose to account for more than 35 percent of lumber produced in southeast Alaska sawmills.
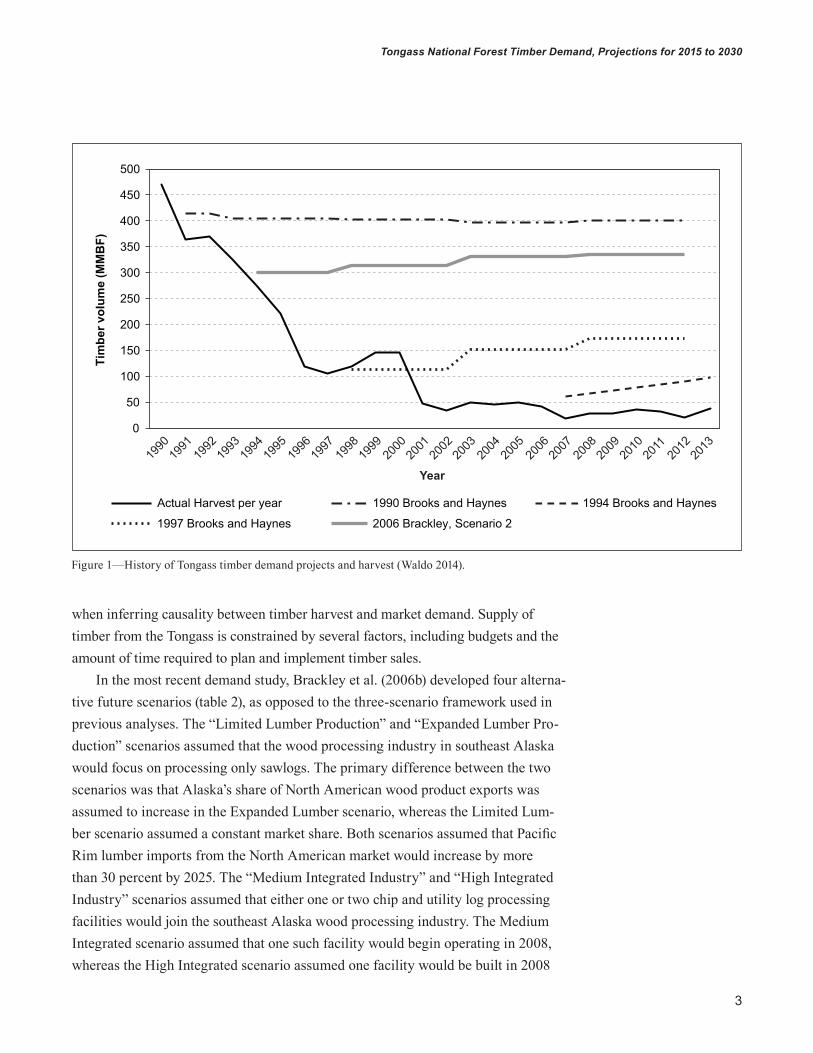
Past demand studies have been criticized for not accurately estimating market demand for Tongass timber. EarthJustice and other environmental groups in south-east Alaska developed figure 1 to show how timber harvests, a measure of supply, have declined far below levels in demand estimates (Waldo 2014). For example, tim-ber harvest for FY 2012 was 20.8 million board feet (MMBF), almost 14 MMBF less than the most recent projected market demand of 34.7 MMBF. Although this is an analysis of timber demand, it is important to remember that the interaction between demand and supply is what ultimately determines trends in markets. Figure 1 dis-plays generally declining trends in timber harvest; however, caution is recommended
Table 1—Past projections of average annual derived demand for Alaska national forest timbera
PeriodBrooks and
Haynes (1990)Brooks and
Haynes (1994)Brooks and
Haynes (1997)Brackley, Rojas,
and Haynes (2006)Million board feet
1983–1987 281.0 281.0 281.0 281.01988–1992 414.0 414.0 414.0 414.01993–1997 404.0 300.0 192.0 200.21998–2002 403.0 315.0 113.0 93.32003–2007 397.0 332.0 152.0 30.02008–2012 401.0 335.0 174.0 34.72013–2017 38.72018–2022 43.02022–2025 46.7a Five-year averages. Data that were not historical at the time of the projection are in boldface.
The interaction between demand and supply is what ultimately determines trends in markets.
3
Tongass National Forest Timber Demand, Projections for 2015 to 2030
when inferring causality between timber harvest and market demand. Supply of timber from the Tongass is constrained by several factors, including budgets and the amount of time required to plan and implement timber sales.
In the most recent demand study, Brackley et al. (2006b) developed four alterna-tive future scenarios (table 2), as opposed to the three-scenario framework used in previous analyses. The “Limited Lumber Production” and “Expanded Lumber Pro-duction” scenarios assumed that the wood processing industry in southeast Alaska would focus on processing only sawlogs. The primary difference between the two scenarios was that Alaska’s share of North American wood product exports was assumed to increase in the Expanded Lumber scenario, whereas the Limited Lum-ber scenario assumed a constant market share. Both scenarios assumed that Pacific Rim lumber imports from the North American market would increase by more than 30 percent by 2025. The “Medium Integrated Industry” and “High Integrated Industry” scenarios assumed that either one or two chip and utility log processing facilities would join the southeast Alaska wood processing industry. The Medium Integrated scenario assumed that one such facility would begin operating in 2008, whereas the High Integrated scenario assumed one facility would be built in 2008
0
50
100
150
200
250
300
350
400
450
500
Tim
ber v
olum
e (M
MB
F)
Actual Harvest per year 1990 Brooks and Haynes 1994 Brooks and Haynes
1997 Brooks and Haynes 2006 Brackley, Scenario 2
1990
1991
1992
1993
1994
1995
1996
1997
1998
1999
2000
2001
2002
2003
2004
2005
2006
2007
2008
2009
2010
2011
2012
2013
Year
Figure 1—History of Tongass timber demand projects and harvest (Waldo 2014).
4
GENERAL TECHNICAL REPORT PNW-GTR-934
and another in 2012. To date, neither of these facilities has been built. Demand for low-grade material could have increased owing to factors such as market demand for whole-log, utility-grade material in another location, but so far these markets have not materialized.
Changes Since the Last StudyMarket conditions for the Alaskan forest sector have changed considerably since the last demand study. Efforts to end harvesting of old-growth timber on the Ton-gass National Forest have spurred multiple initiatives focused on transitioning to a young-growth timber base. The young-growth transition is expected to affect timber supply for the remaining southeast Alaska forest products industry, where industrial capacity, capacity utilization, and production have fallen by about 50 percent since the last demand study. In addition, land exchanges and administrative changes to the harvestable land base have reduced the acres available for harvest. Another signifi-cant development is the Tongass Limited Export Policy (last revised in 2015), which authorizes the export of roundwood harvested from the Tongass to the continental United States and international destinations (USDA FS 2015). Lastly, the ascendancy of China to dominant overseas purchaser of Alaskan softwood logs, supplanting Japan, has changed the profile of foreign log demand. Whereas Japanese purchasers have historically preferred higher quality and higher value old-growth logs, Chinese log demand swings toward the quantity end of the quantity/quality spectrum. Each of these developments is discussed in detail in the following sections.
Table 2—Characteristics of demand scenarios for Alaska roundwood from Brackley et al. (2006b)
PercentAlaska share of North American market:Starting 0.39 0.39 0.39 0.39Ending 0.39 1.14 1.60 2.34
Estimated low-grade material in sawmill log mixa
33 33 10 10
Demand stimulation No Yes Yes YesMarket for low-grade logs No No Yes Yesa Estimated volume of low-grade and utility-grade logs delivered to sawmills for use as saw logs, meeting the definition of a number 2 saw logs at least 12 feet long.
Efforts to end harvesting of old-growth timber on the Tongass National Forest have spurred multiple initiatives focused on transitioning to a young-growth timber base.
5
Tongass National Forest Timber Demand, Projections for 2015 to 2030
Young-growth issues and studies—In 2013, the Secretary of Agriculture, in Memorandum 1044-009, directed the Forest Service to speed the transition away from old-growth timber harvesting on the Tongass National Forest and move to a forest industry that utilizes second-growth forests in a way that preserves a viable timber industry (USDA 2013). The USDA’s goal is to complete this transition in 10 to 15 years, at which time the vast majority of timber sold by the Tongass will be second growth. Significant effort has been directed toward measuring the young-growth inventory on the forest, predicting volume available after the conversion, and estimating the impact on the southeast Alaska forest industry. Two issues that consistently arise are that young-growth trees have not reached their maximum rate of growth, and that planned timber sales must appraise positively before they can be offered for sale. These are discussed next, followed by a review of published and internal documents examin-ing the young-growth timber resource and industry implications of the transition.
One hurdle in transitioning to young growth is the lack of older and larger young-growth stands that have reached their maximum rate of growth, called the culmination of mean annual increment (CMAI). Most young growth originated between the 1950s and the 1980s, creating a lack of older managed stands. The National Forest Management Act of 1976 (NFMA), expressed in 16 U.S. Code 1604(m)1, directs the Secretary of Agriculture to establish standards to ensure that trees in the National Forest System (NFS) will have reached CMAI before harvest, with certain exceptions, such as salvage of damaged stands. CMAI is designed to restrict harvest to stands where the rate of growth has slowed, which maximizes forest growth but limits opportunities to harvest stands at earlier ages. Because most of young-growth stands on the Tongass have not yet reached the CMAI, they are not eligible to be harvested under this part of the statute. However, the next section, 16 U.S. Code 1604(m) 2, states that the Secretary shall establish:
“…exceptions to these standards for the harvest of particular species of trees in management units after consideration has been given to the multiple uses of the forest including, but not limited to, recreation, wildlife habitat, and range and after completion of public participation processes.”
Discussions with managers suggest that the likely administrative response will be to exempt certain species in Tongass young-growth stands from CMAI requirements.
Another major challenge to young-growth transition is that, since 2003, annual appropriation legislation has prohibited the Forest Service from offering commercial timber sales on the Tongass that do not receive a positive appraisal (Coleman 2013). Appraising young-growth stands on the Tongass is difficult because of a lack of stand-level information on species composition, tree size, and logging systems, and because
Two issues that consistently arise are that young-growth trees have not reached their maximum rate of growth, and that planned timber sales must appraise positively before they can be offered for sale.
6
GENERAL TECHNICAL REPORT PNW-GTR-934
little young-growth timber has been harvested on the forest. Note that the positive appraisal rule excludes timber harvested for habitat improvement, precommercial thin-ning, or harvest resulting from nontimber purposes like mining or road construction.
Many studies (both published and internal) examining the availability and implications of the young-growth transition have been conducted since 2009. The Meridian Institute was selected to facilitate and coordinate the 15-member Tongass Advisory Committee to advise the Secretary of Agriculture and the Chief of the Forest Service on transitioning the Tongass National Forest to young-growth forest management. The Meridian Institute website contains an exhaustive list with links to the full text of these studies, as well as synopses of them (Meridian Institute 2015). Generally, these studies attempt to quantify the young-growth timber resource available on the Tongass, the policy and economic challenges to implementing a young-growth strategy, and the impact of the transition on Alaska’s forest industries.
Changes in the Tongass land use designations—Federal land comprises about 94 percent of southeast Alaska and the Tongass National Forest administers 17 million acres of this total. Legislative action and administrative decisions over time have moved large tracts of the Tongass into preservation and conservation status and have reduced the acreage available for timber harvest. With each law or policy decision, some number of harvestable acres has been removed from the timber management base. The proportion of land in southeast Alaska designated for timber harvest (Timber Development Lands) is small compared to the vast amount under federal ownership. Harvestable acres are divided between old- and young-growth timber. Policies that have limited the area available for timber harvest on the Tongass include efforts to protect riparian resources, beach fringe areas, and karst geologic formations, nondevelopment land use designations, and the Roadless Area Conservation Rule.
Land adjustments and exchanges—Federal legislation passed in December 2014 finalized the Sealaska Corpora-tion’s remaining land entitlement under the Alaska Native Claims Settlement Act (ANSCA). The Southeast Alaska Native Land Entitlement Finalization and Jobs Protection Act (also known as the Sealaska Lands Bill) conveyed 70,075 acres of NFS lands on the Tongass to Sealaska, an Alaska Native Corporation, to satisfy outstanding land claims under ANSCA. The 18 parcels selected include a large proportion of the Tongass’s older second-growth volume. Moreover, the Alaska Mental Health Trust has proposed an administrative, equal-value land exchange under which substantial amounts of both old-growth and young-growth timber lying within the viewshed of several southeast Alaska communities would change hands from the Forest Service to the Mental Health Trust.
Legislative action and administrative decisions over time have moved large tracts of the Tongass into preservation and conservation status and have reduced the acreage available for timber harvest.
7
Tongass National Forest Timber Demand, Projections for 2015 to 2030
Changes to Alaska’s forest sector—Two of the four scenarios considered in the last Forest Service demand study (Brackley et al. 2006b) predicted possible industry expansion through the reestab-lishment of an integrated processing industry. Demand for low- and utility-grade logs would result from opening of either one or two facilities producing medium-density fiberboard. To date, neither of these facilities has been built, markets for low-quality and utility logs have not emerged, and the southeast Alaska forest industry is primarily focused on processing sawlogs into lumber and exporting roundwood logs. Trends in industrial production and capacity in Alaskan wood processing mills are discussed next, along with two TPO reports published since the Brackley et al. (2006b) study. These provide direct measures of the relationship between final product markets and timber harvested in Alaska.
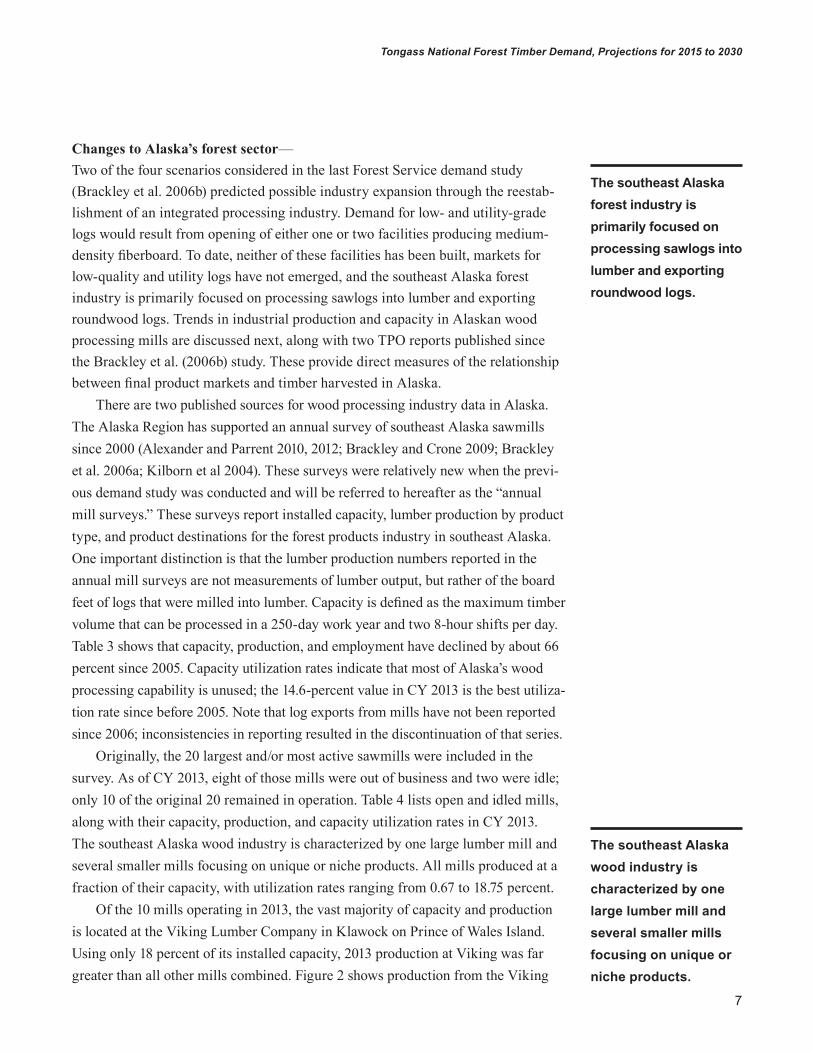
There are two published sources for wood processing industry data in Alaska. The Alaska Region has supported an annual survey of southeast Alaska sawmills since 2000 (Alexander and Parrent 2010, 2012; Brackley and Crone 2009; Brackley et al. 2006a; Kilborn et al 2004). These surveys were relatively new when the previ-ous demand study was conducted and will be referred to hereafter as the “annual mill surveys.” These surveys report installed capacity, lumber production by product type, and product destinations for the forest products industry in southeast Alaska. One important distinction is that the lumber production numbers reported in the annual mill surveys are not measurements of lumber output, but rather of the board feet of logs that were milled into lumber. Capacity is defined as the maximum timber volume that can be processed in a 250-day work year and two 8-hour shifts per day. Table 3 shows that capacity, production, and employment have declined by about 66 percent since 2005. Capacity utilization rates indicate that most of Alaska’s wood processing capability is unused; the 14.6-percent value in CY 2013 is the best utiliza-tion rate since before 2005. Note that log exports from mills have not been reported since 2006; inconsistencies in reporting resulted in the discontinuation of that series.
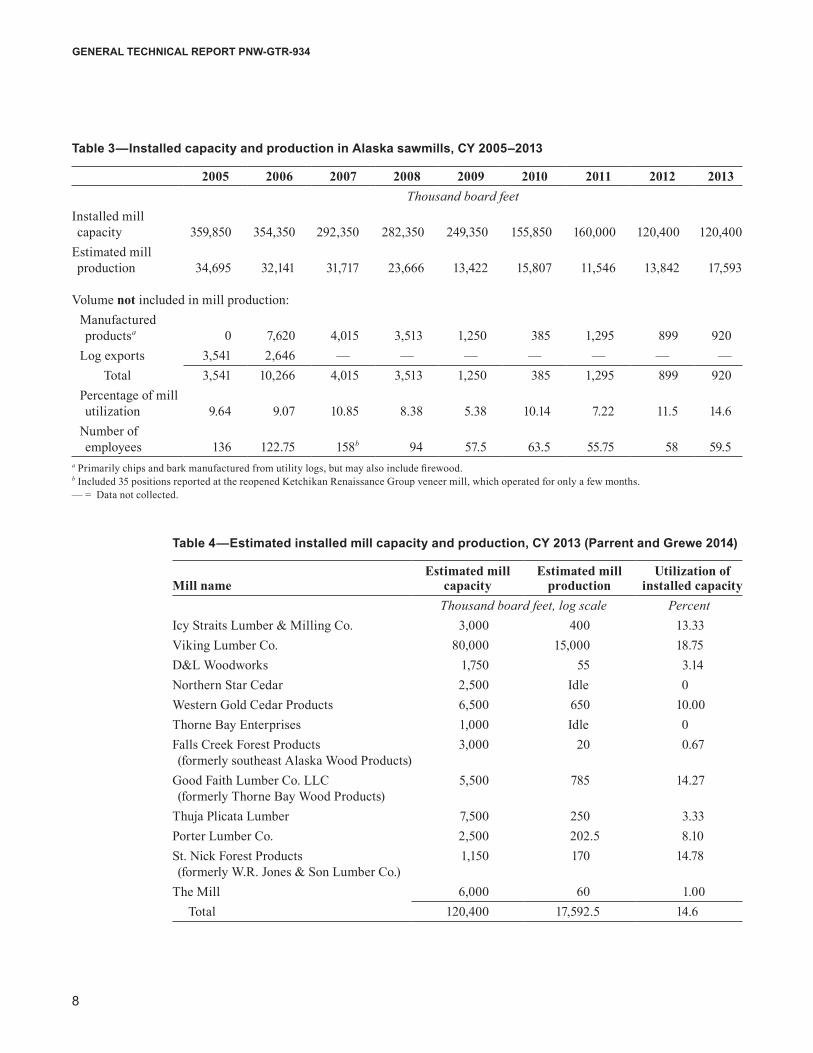
Originally, the 20 largest and/or most active sawmills were included in the survey. As of CY 2013, eight of those mills were out of business and two were idle; only 10 of the original 20 remained in operation. Table 4 lists open and idled mills, along with their capacity, production, and capacity utilization rates in CY 2013. The southeast Alaska wood industry is characterized by one large lumber mill and several smaller mills focusing on unique or niche products. All mills produced at a fraction of their capacity, with utilization rates ranging from 0.67 to 18.75 percent.
Of the 10 mills operating in 2013, the vast majority of capacity and production is located at the Viking Lumber Company in Klawock on Prince of Wales Island. Using only 18 percent of its installed capacity, 2013 production at Viking was far greater than all other mills combined. Figure 2 shows production from the Viking
The southeast Alaska forest industry is primarily focused on processing sawlogs into lumber and exporting roundwood logs.
The southeast Alaska wood industry is characterized by one large lumber mill and several smaller mills focusing on unique or niche products.
8
GENERAL TECHNICAL REPORT PNW-GTR-934
Table 3—Installed capacity and production in Alaska sawmills, CY 2005–2013
Number of employees 136 122.75 158b 94 57.5 63.5 55.75 58 59.5
a Primarily chips and bark manufactured from utility logs, but may also include firewood.b Included 35 positions reported at the reopened Ketchikan Renaissance Group veneer mill, which operated for only a few months.— = Data not collected.
Table 4—Estimated installed mill capacity and production, CY 2013 (Parrent and Grewe 2014)
Icy Straits Lumber & Milling Co. 3,000 400 13.33Viking Lumber Co. 80,000 15,000 18.75D&L Woodworks 1,750 55 3.14Northern Star Cedar 2,500 Idle 0Western Gold Cedar Products 6,500 650 10.00Thorne Bay Enterprises 1,000 Idle 0Falls Creek Forest Products (formerly southeast Alaska Wood Products)
3,000 20 0.67
Good Faith Lumber Co. LLC (formerly Thorne Bay Wood Products)
5,500 785 14.27
Thuja Plicata Lumber 7,500 250 3.33Porter Lumber Co. 2,500 202.5 8.10St. Nick Forest Products (formerly W.R. Jones & Son Lumber Co.)
1,150 170 14.78
The Mill 6,000 60 1.00Total 120,400 17,592.5 14.6
9
Tongass National Forest Timber Demand, Projections for 2015 to 2030
mill compared to other southeast Alaska mills over time. Viking’s share of industrial output has grown from just over 50 percent in 2005 to 85 percent in 2013. The con-centration of industrial capacity in this single producer raises concerns about market durability and monopolistic influence, especially because it is the only mill capable of processing a significant volume of young-growth timber in southeast Alaska.
The second source of mill data is two statewide surveys of Timber Products Output (TPO) from Alaska wood processing mills conducted in 2005 and 2011 (Berg et al. 2014, Halbrook et al. 2009). The University of Montana’s Bureau of Business and Economic Research (BBER), in conjunction with the Pacific Northwest Research Station’s Forest Inventory and Analysis (PNW-FIA) program, conducts a census of timber processors for all Western states every 5 years. These will be referred to hereafter as the “BBER surveys.” Through a written questionnaire or telephone interview, timber-processing and residue-utilizing facilities provided information about their operations. The BBER surveyed 116 mills statewide, 41 of which were located in southeast Alaska. Facility-level information was compiled and summarized to avoid disclosing firm-level production information. Because TPO reports are based on a census, rather than sample of firms, there is no sampling error associated with the results presented. The reports provide information including:
0
5
10
15
20
25
30
35
40
2005 2006 2007 2008 2009 2010 2011 2012 2013
Mill
pro
duct
ion
(MM
BF
Scri
bner
)
Viking
Not Viking
Year
Figure 2—Lumber production, Viking Lumber Company and all other southeast Alaska producers.
Facility-level information was compiled and summarized to avoid disclosing firm-level production information.
10
GENERAL TECHNICAL REPORT PNW-GTR-934
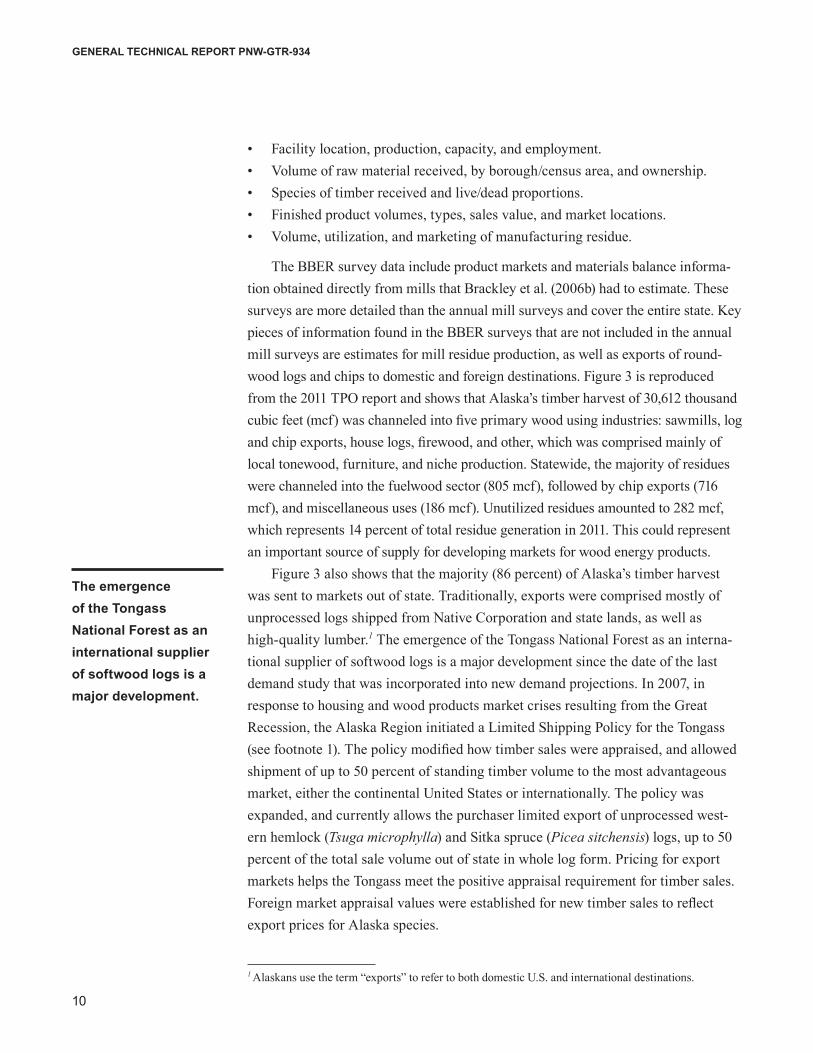
• Facility location, production, capacity, and employment.• Volume of raw material received, by borough/census area, and ownership.• Species of timber received and live/dead proportions.• Finished product volumes, types, sales value, and market locations.• Volume, utilization, and marketing of manufacturing residue.
The BBER survey data include product markets and materials balance informa-tion obtained directly from mills that Brackley et al. (2006b) had to estimate. These surveys are more detailed than the annual mill surveys and cover the entire state. Key pieces of information found in the BBER surveys that are not included in the annual mill surveys are estimates for mill residue production, as well as exports of round-wood logs and chips to domestic and foreign destinations. Figure 3 is reproduced from the 2011 TPO report and shows that Alaska’s timber harvest of 30,612 thousand cubic feet (mcf) was channeled into five primary wood using industries: sawmills, log and chip exports, house logs, firewood, and other, which was comprised mainly of local tonewood, furniture, and niche production. Statewide, the majority of residues were channeled into the fuelwood sector (805 mcf), followed by chip exports (716 mcf), and miscellaneous uses (186 mcf). Unutilized residues amounted to 282 mcf, which represents 14 percent of total residue generation in 2011. This could represent an important source of supply for developing markets for wood energy products.
Figure 3 also shows that the majority (86 percent) of Alaska’s timber harvest was sent to markets out of state. Traditionally, exports were comprised mostly of unprocessed logs shipped from Native Corporation and state lands, as well as high-quality lumber.1 The emergence of the Tongass National Forest as an interna-tional supplier of softwood logs is a major development since the date of the last demand study that was incorporated into new demand projections. In 2007, in response to housing and wood products market crises resulting from the Great Recession, the Alaska Region initiated a Limited Shipping Policy for the Tongass (see footnote 1). The policy modified how timber sales were appraised, and allowed shipment of up to 50 percent of standing timber volume to the most advantageous market, either the continental United States or internationally. The policy was expanded, and currently allows the purchaser limited export of unprocessed west-ern hemlock (Tsuga microphylla) and Sitka spruce (Picea sitchensis) logs, up to 50 percent of the total sale volume out of state in whole log form. Pricing for export markets helps the Tongass meet the positive appraisal requirement for timber sales. Foreign market appraisal values were established for new timber sales to reflect export prices for Alaska species.
1 Alaskans use the term “exports” to refer to both domestic U.S. and international destinations.
The emergence of the Tongass National Forest as an international supplier of softwood logs is a major development.
11
Tongass National Forest Timber Demand, Projections for 2015 to 2030
Total harvest30,612 MCFa
Other manufacturersb
190 MCFHouse log and log
home manufacturers259 MCF
Fuelwoodmanufacturers
869 MCF
Sawmills2,995 MCF
Log and chipexports
26,299 MCF
Use of Alaska’s 2011 timber harvest
Pulp chipresidue
716 MCF
Residue forfuelwood4 MCF Residue for
fuelwood742 MCF
Residue forfuelwood59 MCF
Residue formiscellaneous uses
22 MCFResidue for
miscellaneous uses9 MCF
Unutilized residue
164 MCF
Shrinkage45 MCF
Residue formiscellaneous uses
137 MCF
Residue formiscellaneous uses
18 MCF
Unutilized residue57 MCF
Unutilized residue27 MCF
Unutilized residue34 MCF
Shrinkage4 MCF
Products produced byother manufacturersb
103 MCF
Products produced by house log sector
155 MCF
Products produced by fuelwood sector
1,631 MCF
Exportedlogs and chips27,015 MCF
Product produced by sawmill sector
1,191 MCF
aThousand cubic feet (MCF) excludes bark.bOther manufacturers include manufactures of log furniture, tonewood, novelty items, and cedar products.
Figure 3—Use of Alaska’s 2011 timber harvest, reproduced from Berg et al. (2014).
12
GENERAL TECHNICAL REPORT PNW-GTR-934
Changes in domestic and export product markets—Previous demand studies were performed when Japan was the primary market for export logs from Alaska and before the Tongass began exporting logs to U.S. domestic and international markets. These developments have changed the competi-tive position of Alaskan exports compared to Washington and Oregon. The propor-tion of Alaska products being sent to the lower 48 states has also changed. These and the unique issues associated with Alaska trade statistics are discussed next.
The International Trade Commission within the U.S. Census Bureau collects and provides trade statistics by U.S. customs district using the Harmonized Tariff Schedule (HTS) and distributes these data in an online database (USITC 2014). Port-level data for the state of Alaska are aggregated into the state-level Anchor-age Customs District. Table 5 shows softwood chip, log, and lumber exports from the Anchorage Customs District from 2005 to 2013 by export destination. Chips have not been exported in any consequential volume since 2005, although a ship-ment of 4.4 thousand metric tons went to Canada in 2013. Softwood log exports to China have risen dramatically in recent years, while log exports from Alaska to all other destinations have fallen. China supplanted Japan as the primary destination for Alaskan logs in 2010. Figure 4 illustrates trends in log exports to China and Japan over time. Japanese exports have fallen, but the decline is less
0
200
400
600
800
1,000
1,200
2005 2006 2007 2008 2009 2010 2011 2012 2013
Japan
China
Year
Softw
ood
log
expo
rt v
olum
e (th
ousa
nd c
ubic
met
ers)
Figure 4—Log exports to China and Japan from the Anchorage Customs District, 2005 –2013.
Softwood log exports to China have risen dramatically in recent years.
13
Tongass National Forest Timber Demand, Projections for 2015 to 2030
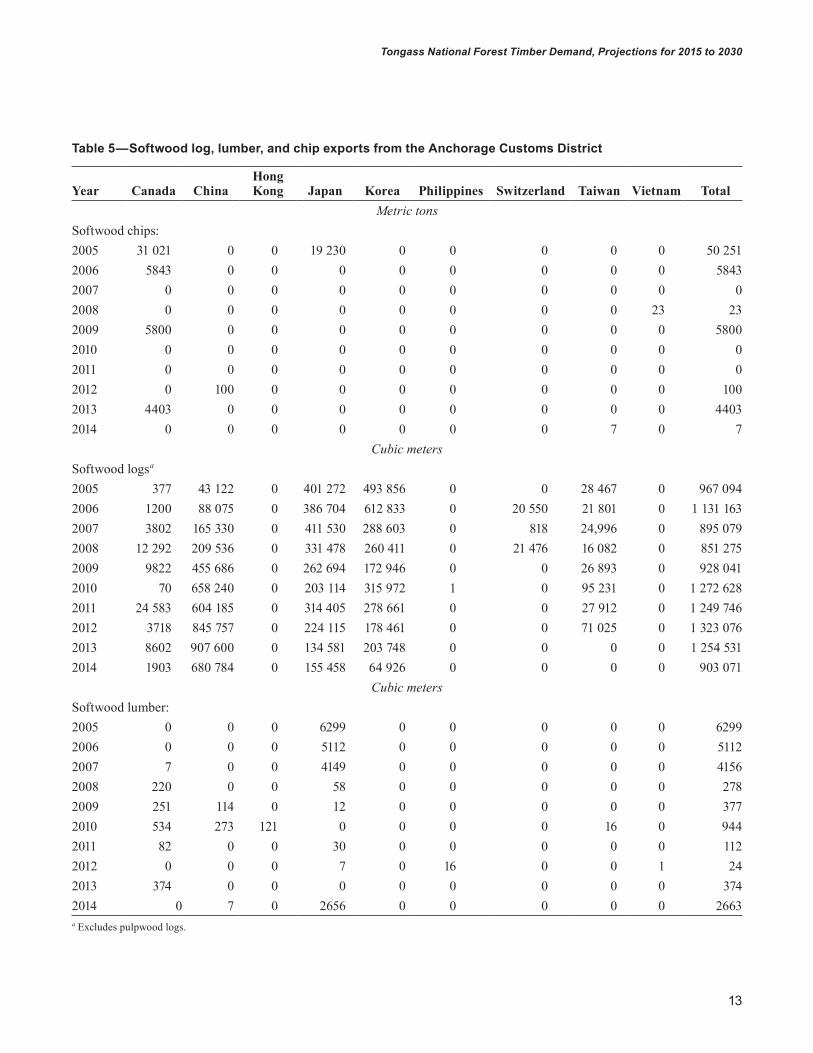
Table 5—Softwood log, lumber, and chip exports from the Anchorage Customs District
Year Canada China Hong Kong Japan Korea Philippines Switzerland Taiwan Vietnam Total
steep than the rise in exports to China. Softwood lumber exports to Japan were strongest from 2005 to 2007, but dropped by 93 percent in 2008 with few signs of recovery. To summarize, international exports of primary wood products from Alaska have fallen for all products, except for sharp growth in softwood log exports to China.
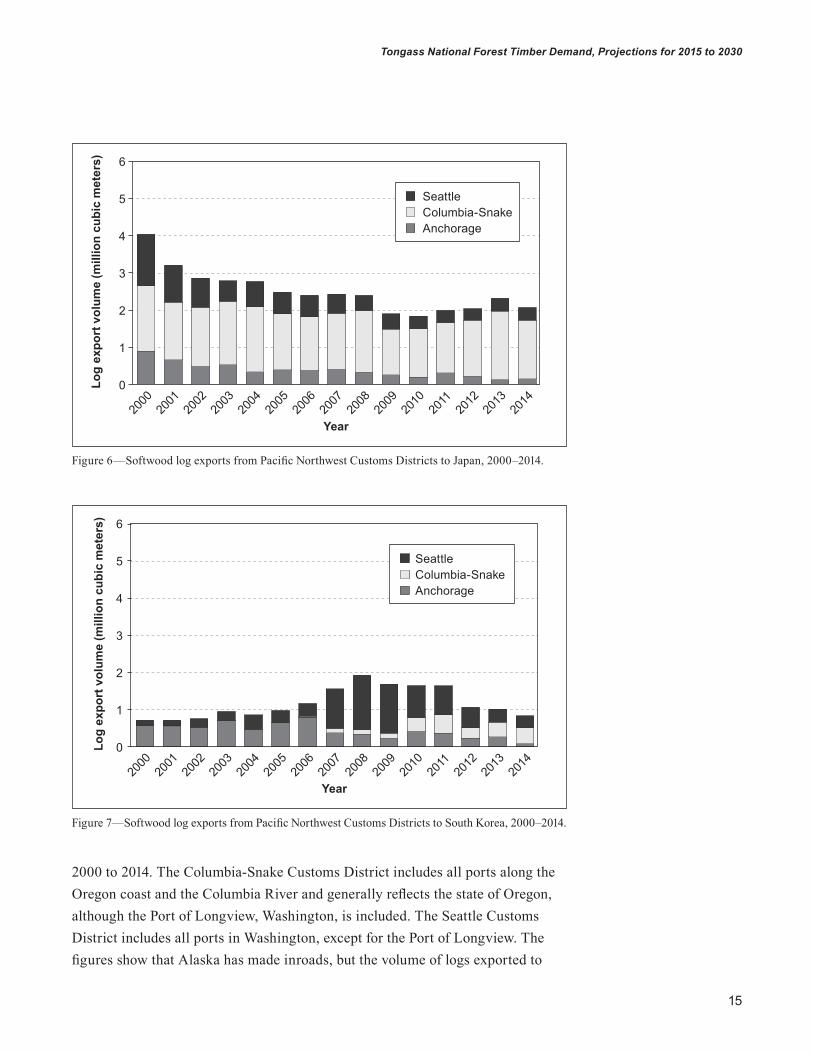
The Anchorage Customs District contains data for all Alaska ports. Inter-national export data are not publicly available at the port level; all data are aggregated and reported at the customs district level. The volume of exports leaving ports in southeast Alaskan (those most likely to contain Tongass timber) is not available from this dataset. However, USITC data are useful for comparing exports from Alaska to those by competitors in Washington and Oregon. Figures 5, 6, and 7 show softwood log exports to China, Japan, and South Korea, respec-tively, from the Anchorage, Columbia-Snake, and Seattle Customs District from
SeattleColumbia-SnakeAnchorage
Year20
0020
0120
0220
0320
0420
0520
0620
0720
0820
0920
1020
1120
1220
1320
14
6
5
4
3
2
1
0
Softw
ood
log
expo
rt v
olum
e (m
illio
n cu
bic
met
ers)
Figure 5—Softwood log exports from Pacific Northwest Customs Districts to China, 2000–2014.
International exports of primary wood products from Alaska have fallen for all products, except for sharp growth in softwood log exports to China.
15
Tongass National Forest Timber Demand, Projections for 2015 to 2030
2000 to 2014. The Columbia-Snake Customs District includes all ports along the Oregon coast and the Columbia River and generally reflects the state of Oregon, although the Port of Longview, Washington, is included. The Seattle Customs District includes all ports in Washington, except for the Port of Longview. The figures show that Alaska has made inroads, but the volume of logs exported to
Log
expo
rt v
olum
e (m
illio
n cu
bic
met
ers)
Year20
0020
0120
0220
0320
0420
0520
0620
0720
0820
0920
1020
1120
1220
1320
14
6
5
4
3
2
1
0
SeattleColumbia-SnakeAnchorage
Log
expo
rt v
olum
e (m
illio
n cu
bic
met
ers)
Year20
0020
0120
0220
0320
0420
0520
0620
0720
0820
0920
1020
1120
1220
1320
14
6
5
4
3
2
1
0
SeattleColumbia-SnakeAnchorage
Figure 7—Softwood log exports from Pacific Northwest Customs Districts to South Korea, 2000–2014.
Figure 6—Softwood log exports from Pacific Northwest Customs Districts to Japan, 2000–2014.
16
GENERAL TECHNICAL REPORT PNW-GTR-934
China represented only 14 percent of the total in 2014. The 5-year average of logs received from Alaska into Chinese markets was 17 percent. Log exporters in Washington and Oregon each have managed to supply about 40 percent of log exports to China.
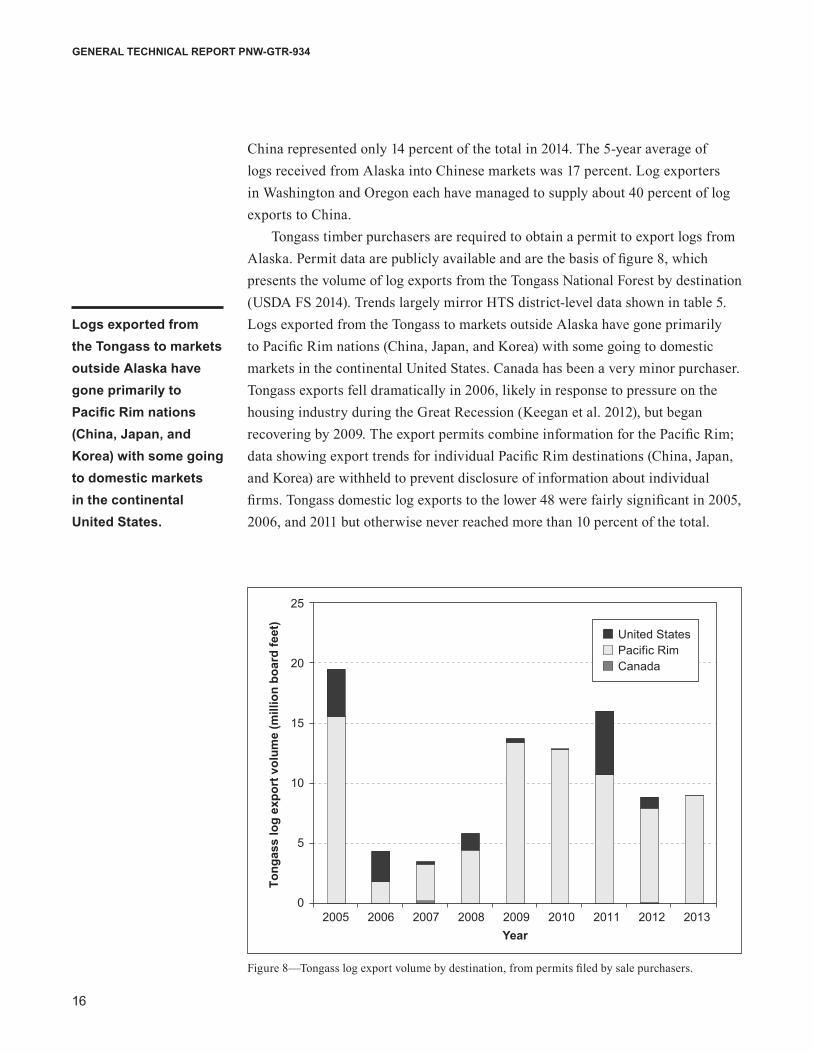
Tongass timber purchasers are required to obtain a permit to export logs from Alaska. Permit data are publicly available and are the basis of figure 8, which presents the volume of log exports from the Tongass National Forest by destination (USDA FS 2014). Trends largely mirror HTS district-level data shown in table 5. Logs exported from the Tongass to markets outside Alaska have gone primarily to Pacific Rim nations (China, Japan, and Korea) with some going to domestic markets in the continental United States. Canada has been a very minor purchaser. Tongass exports fell dramatically in 2006, likely in response to pressure on the housing industry during the Great Recession (Keegan et al. 2012), but began recovering by 2009. The export permits combine information for the Pacific Rim; data showing export trends for individual Pacific Rim destinations (China, Japan, and Korea) are withheld to prevent disclosure of information about individual firms. Tongass domestic log exports to the lower 48 were fairly significant in 2005, 2006, and 2011 but otherwise never reached more than 10 percent of the total.
2005 2006 2007 2008 2009 2010 2011 2012 2013
Tong
ass
log
expo
rt v
olum
e (m
illio
n bo
ard
feet
)
United StatesPacific RimCanada
Year
25
20
15
10
5
0
Figure 8—Tongass log export volume by destination, from permits filed by sale purchasers.
Logs exported from the Tongass to markets outside Alaska have gone primarily to Pacific Rim nations (China, Japan, and Korea) with some going to domestic markets in the continental United States.
17
Tongass National Forest Timber Demand, Projections for 2015 to 2030
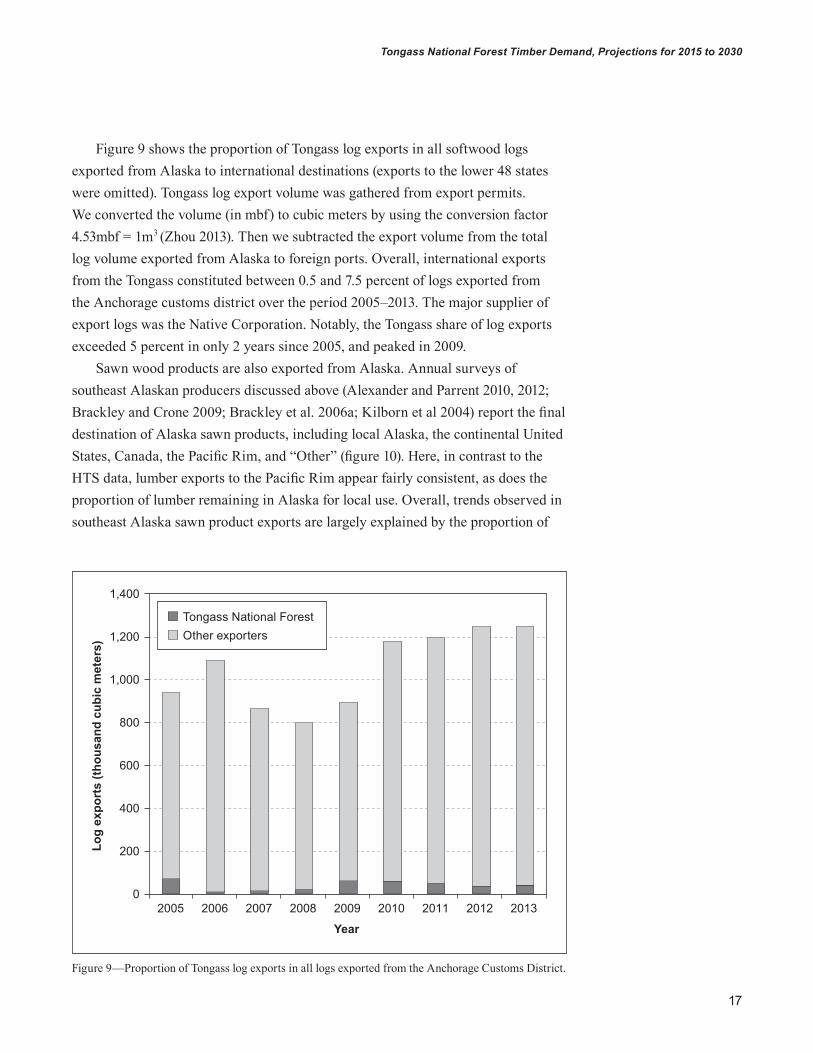
Figure 9 shows the proportion of Tongass log exports in all softwood logs exported from Alaska to international destinations (exports to the lower 48 states were omitted). Tongass log export volume was gathered from export permits. We converted the volume (in mbf) to cubic meters by using the conversion factor 4.53mbf = 1m3 (Zhou 2013). Then we subtracted the export volume from the total log volume exported from Alaska to foreign ports. Overall, international exports from the Tongass constituted between 0.5 and 7.5 percent of logs exported from the Anchorage customs district over the period 2005–2013. The major supplier of export logs was the Native Corporation. Notably, the Tongass share of log exports exceeded 5 percent in only 2 years since 2005, and peaked in 2009.
Sawn wood products are also exported from Alaska. Annual surveys of southeast Alaskan producers discussed above (Alexander and Parrent 2010, 2012; Brackley and Crone 2009; Brackley et al. 2006a; Kilborn et al 2004) report the final destination of Alaska sawn products, including local Alaska, the continental United States, Canada, the Pacific Rim, and “Other” (figure 10). Here, in contrast to the HTS data, lumber exports to the Pacific Rim appear fairly consistent, as does the proportion of lumber remaining in Alaska for local use. Overall, trends observed in southeast Alaska sawn product exports are largely explained by the proportion of
2005 2006 2007 2008 2009 2010 2011 2012 2013
Year
1,400
1,200
1,000
800
600
400
200
0
Log
expo
rts
(thou
sand
cub
ic m
eter
s)
Tongass National ForestOther exporters
Figure 9—Proportion of Tongass log exports in all logs exported from the Anchorage Customs District.
18
GENERAL TECHNICAL REPORT PNW-GTR-934
mill production shipped to markets in the continental United States. These domestic shipments declined from 26 MMBF to 6.7 MMBF between 2005 and 2011 but rose to 9.5 MMBF in 2013. Again, trends reflect recessionary pressures on the housing industry felt nationally, although markets have slowly recovered since the low that occurred in 2009.
Export volumes reported by respondents to mill surveys are difficult to verify using HTS data, primarily because of accounting issues associated with trade data. One would expect the foreign exports of sawn material from all of Alaska as reported by the Anchorage Customs District to be similar to the amount reported by sawmills if products were shipped directly to their final destination. As can be seen in table 6, lumber exports reported in the HTS data are significantly lower than exports of sawn products reported by southeast Alaska mill owners, reflecting three possible discrepancies. The first is that HTS data are statewide and include sawn products from mills in all regions of Alaska. The second is that in the annual mill surveys, mills report the volume of logs processed into lumber rather than the volume of lumber produced, which could bias production estimates. A more significant discrepancy arises when products from Alaska are routed elsewhere before ultimately being shipped out of the United States. These are called transshipments. For example, southeast Alaska sawn products may be transshipped to the Seattle Customs District, then sent to final foreign markets in Asia.
0
5
10
15
20
25
30
35
40
2005 2006 2007 2008 2009 2010 2011 2012 2013Estim
ated
mill
pro
duct
ion
(MM
BF
Scrib
ner)
Year
Pacific RimOtherContinental United StatesCanadaAlaska
Figure 10—Destination of lumber manufactured in southeast Alaska sawmills, 2005–2013 (million board feet, Scribner log scale).
19
Tongass National Forest Timber Demand, Projections for 2015 to 2030
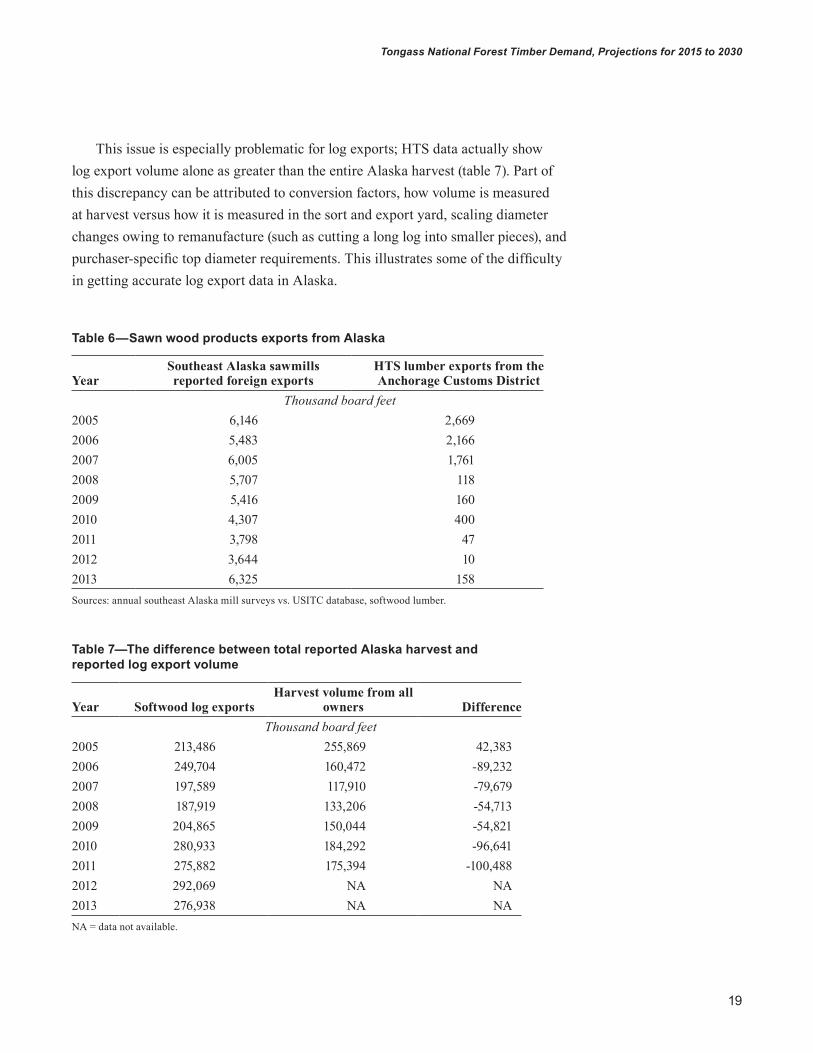
This issue is especially problematic for log exports; HTS data actually show log export volume alone as greater than the entire Alaska harvest (table 7). Part of this discrepancy can be attributed to conversion factors, how volume is measured at harvest versus how it is measured in the sort and export yard, scaling diameter changes owing to remanufacture (such as cutting a long log into smaller pieces), and purchaser-specific top diameter requirements. This illustrates some of the difficulty in getting accurate log export data in Alaska.
Table 6—Sawn wood products exports from Alaska
Year Southeast Alaska sawmills reported foreign exports
HTS lumber exports from the Anchorage Customs District
Table 7—The difference between total reported Alaska harvest and reported log export volume
Year Softwood log exports Harvest volume from all
owners Difference Thousand board feet
2005 213,486 255,869 42,3832006 249,704 160,472 -89,2322007 197,589 117,910 -79,6792008 187,919 133,206 -54,7132009 204,865 150,044 -54,8212010 280,933 184,292 -96,6412011 275,882 175,394 -100,4882012 292,069 NA NA2013 276,938 NA NANA = data not available.
20
GENERAL TECHNICAL REPORT PNW-GTR-934
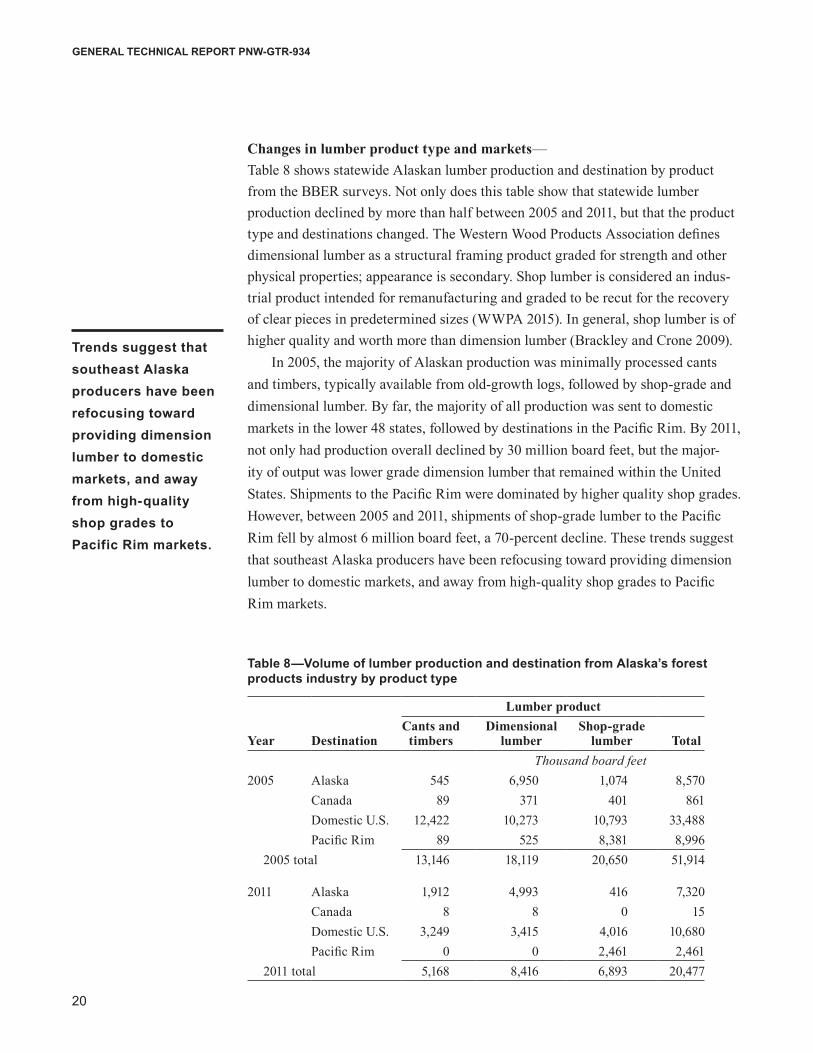
Changes in lumber product type and markets—Table 8 shows statewide Alaskan lumber production and destination by product from the BBER surveys. Not only does this table show that statewide lumber production declined by more than half between 2005 and 2011, but that the product type and destinations changed. The Western Wood Products Association defines dimensional lumber as a structural framing product graded for strength and other physical properties; appearance is secondary. Shop lumber is considered an indus-trial product intended for remanufacturing and graded to be recut for the recovery of clear pieces in predetermined sizes (WWPA 2015). In general, shop lumber is of higher quality and worth more than dimension lumber (Brackley and Crone 2009).
In 2005, the majority of Alaskan production was minimally processed cants and timbers, typically available from old-growth logs, followed by shop-grade and dimensional lumber. By far, the majority of all production was sent to domestic markets in the lower 48 states, followed by destinations in the Pacific Rim. By 2011, not only had production overall declined by 30 million board feet, but the major-ity of output was lower grade dimension lumber that remained within the United States. Shipments to the Pacific Rim were dominated by higher quality shop grades. However, between 2005 and 2011, shipments of shop-grade lumber to the Pacific Rim fell by almost 6 million board feet, a 70-percent decline. These trends suggest that southeast Alaska producers have been refocusing toward providing dimension lumber to domestic markets, and away from high-quality shop grades to Pacific Rim markets.
Table 8—Volume of lumber production and destination from Alaska’s forest products industry by product type
Lumber product
Year DestinationCants and
timbersDimensional
lumberShop-grade
lumber TotalThousand board feet
2005 Alaska 545 6,950 1,074 8,570Canada 89 371 401 861Domestic U.S. 12,422 10,273 10,793 33,488Pacific Rim 89 525 8,381 8,996
2005 total 13,146 18,119 20,650 51,914
2011 Alaska 1,912 4,993 416 7,320Canada 8 8 0 15Domestic U.S. 3,249 3,415 4,016 10,680Pacific Rim 0 0 2,461 2,461
2011 total 5,168 8,416 6,893 20,477
Trends suggest that southeast Alaska producers have been refocusing toward providing dimension lumber to domestic markets, and away from high-quality shop grades to Pacific Rim markets.
21
Tongass National Forest Timber Demand, Projections for 2015 to 2030
MethodsThe objective of this analysis is to estimate and project demand for timber from the Tongass National Forest. The projected national forest timber demand is the quantity of timber required to satisfy projected demand given harvest by other owners based on assumptions about product markets. As in past efforts, demand for Tongass tim-ber will be estimated using a materials balance approach based on forecasted trends in product markets. Our methods are adapted from previous analyses of Tongass timber demand performed by Brackley et al. (2006b), Haynes and Brooks (1990), Brooks and Haynes (1994), and Brooks and Haynes (1997). Since the Brackley demand analysis, the two TPO reports discussed above were published, and these provide data on the relation between timber harvest and end markets not available for previous studies. In addition, the annual mill surveys were relatively new; the 7 additional years of sawmill processing data have been incorporated into this effort. These sources of published forest sector data for Alaska helped reduce the uncer-tainty associated with past demand projections where data were more limited.
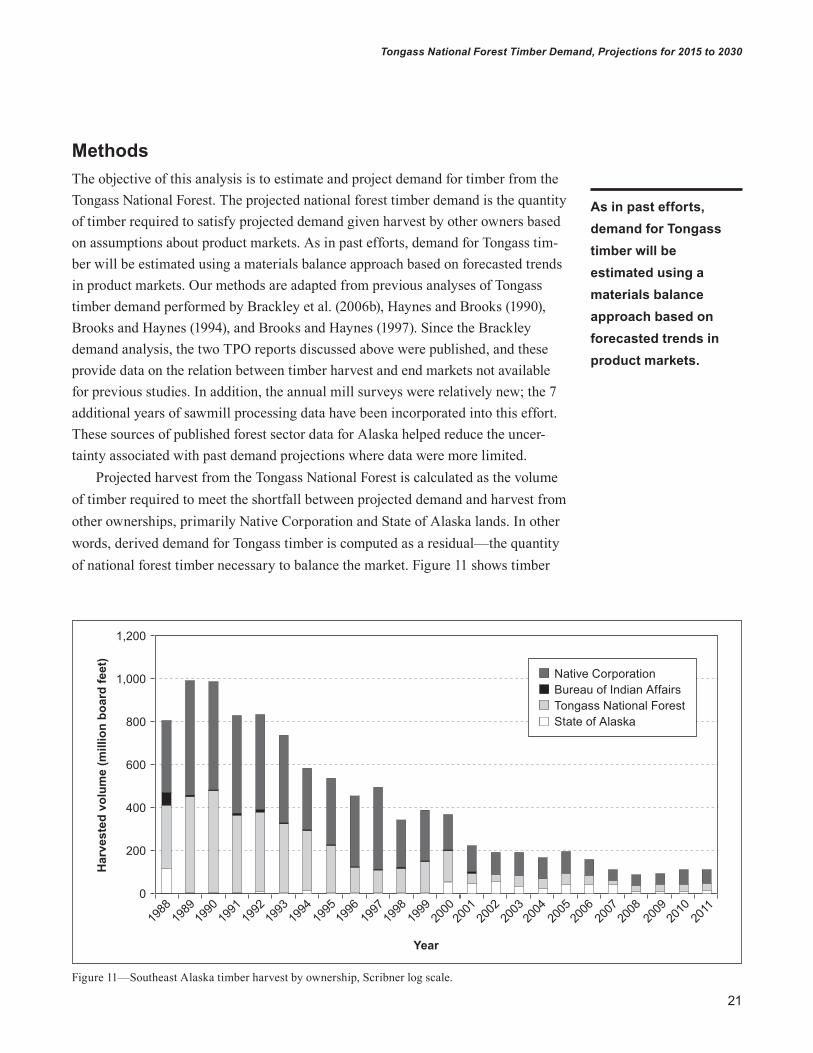
Projected harvest from the Tongass National Forest is calculated as the volume of timber required to meet the shortfall between projected demand and harvest from other ownerships, primarily Native Corporation and State of Alaska lands. In other words, derived demand for Tongass timber is computed as a residual—the quantity of national forest timber necessary to balance the market. Figure 11 shows timber
Native CorporationBureau of Indian AffairsTongass National ForestState of Alaska
Year
2000
2001
2002
2003
2004
2005
2006
2007
2008
2009
2010
2011
1988
1989
1990
1991
1992
1993
1994
1995
1996
1997
1998
1999
1,200
1,000
800
600
400
200
0
Har
vest
ed v
olum
e (m
illio
n bo
ard
feet
)
Figure 11—Southeast Alaska timber harvest by ownership, Scribner log scale.
As in past efforts, demand for Tongass timber will be estimated using a materials balance approach based on forecasted trends in product markets.
22
GENERAL TECHNICAL REPORT PNW-GTR-934
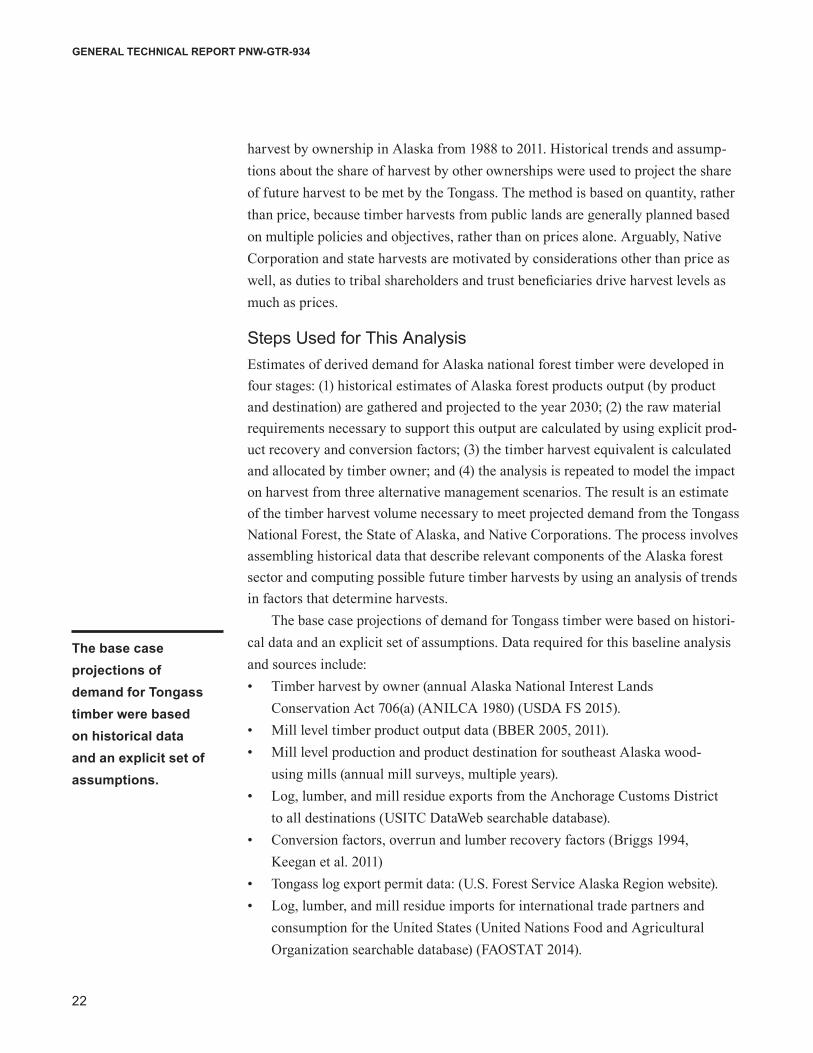
harvest by ownership in Alaska from 1988 to 2011. Historical trends and assump-tions about the share of harvest by other ownerships were used to project the share of future harvest to be met by the Tongass. The method is based on quantity, rather than price, because timber harvests from public lands are generally planned based on multiple policies and objectives, rather than on prices alone. Arguably, Native Corporation and state harvests are motivated by considerations other than price as well, as duties to tribal shareholders and trust beneficiaries drive harvest levels as much as prices.
Steps Used for This AnalysisEstimates of derived demand for Alaska national forest timber were developed in four stages: (1) historical estimates of Alaska forest products output (by product and destination) are gathered and projected to the year 2030; (2) the raw material requirements necessary to support this output are calculated by using explicit prod-uct recovery and conversion factors; (3) the timber harvest equivalent is calculated and allocated by timber owner; and (4) the analysis is repeated to model the impact on harvest from three alternative management scenarios. The result is an estimate of the timber harvest volume necessary to meet projected demand from the Tongass National Forest, the State of Alaska, and Native Corporations. The process involves assembling historical data that describe relevant components of the Alaska forest sector and computing possible future timber harvests by using an analysis of trends in factors that determine harvests.
The base case projections of demand for Tongass timber were based on histori-cal data and an explicit set of assumptions. Data required for this baseline analysis and sources include:• Timber harvest by owner (annual Alaska National Interest Lands
Conservation Act 706(a) (ANILCA 1980) (USDA FS 2015).• Mill level timber product output data (BBER 2005, 2011). • Mill level production and product destination for southeast Alaska wood-
using mills (annual mill surveys, multiple years).• Log, lumber, and mill residue exports from the Anchorage Customs District
to all destinations (USITC DataWeb searchable database).• Conversion factors, overrun and lumber recovery factors (Briggs 1994,
Keegan et al. 2011)• Tongass log export permit data: (U.S. Forest Service Alaska Region website). • Log, lumber, and mill residue imports for international trade partners and
consumption for the United States (United Nations Food and Agricultural Organization searchable database) (FAOSTAT 2014).
The base case projections of demand for Tongass timber were based on historical data and an explicit set of assumptions.
23
Tongass National Forest Timber Demand, Projections for 2015 to 2030
Data will be stored with the corresponding author and available with one exception. To protect the identity of individual firms, mill-level data from the BBER surveys are confidential and will not be disclosed. The BBER conducts mill surveys in Alaska and other Western states for the Forest Service’s Forest Inventory and Analysis (FIA) program. BBER data used in this analysis were obtained only after finalizing a Data Security Plan and a Memorandum of Cooperation with FIA to pre-vent disclosing any proprietary information. All remaining data was acquired from public or published sources and will be shared upon request.
Identifying MarketsAfter Alaska forest industry data were amassed, all markets receiving wood products from Alaska were identified. We were able to gather information about production, shipments, and relative scale of markets served by southeast Alaska producers. These were combined with projections of total wood product consump-tion (for domestic markets) or product imports in destination regions to arrive at the market share supplied by southeast Alaska timber producers.
Softwood sawlogs—The majority of timber harvested in southeast Alaska is exported to Pacific Rim (China, Japan, and South Korea) destinations as unprocessed sawlogs. Traditional sources of trade statistics are problematic for tracking Alaska log exports for two reasons. The U.S. International Trade Commission maintains a searchable database for foreign trade statistics by U.S. Customs District (USITC). As discussed above, the use-fulness of USITC data in Alaska is limited because data are only available at the state level, rather than by port, making it impossible to track shipments solely from south-east Alaska. In addition-softwood log export data for Alaska are notoriously unreliable owing to the transshipment issues and data discrepancies between harvest volume and softwood log export volume described above, as well in the 2011 BBER Survey.
Instead, we used published mill surveys of southeast Alaska wood processors. The annual mill surveys do not cover log exports, but 2005 and 2011 BBER mill data show that southeast Alaska softwood logs were sent to domestic markets in the lower 48 states and to international markets. By far, the majority southeast Alaska logs were sent to the Pacific Rim; the share of logs sent there was over 90 percent in both 2005 and 2011. China is by far the largest single purchaser, but mill survey data were available only at an aggregated regional Pacific Rim level. Consequently, we combined data for China, Japan, and South Korea into one series for Pacific Rim markets in all subsequent analysis. We also included softwood logs to Canada because USITC data show that modest shipments were sent there in several years not covered by the BBER sueveys.
The majority of timber harvested in southeast Alaska is exported to Pacific Rim (China, Japan, and South Korea) destinations as unprocessed sawlogs.
24
GENERAL TECHNICAL REPORT PNW-GTR-934
Utility logs—We were unable to find evidence of market demand for utility logs. Discussions with Forest Service staff and industry representatives suggest that much of the harvested volume of utility logs is left in the woods because of their low economic value. Utility volume data were assembled but not assigned a market initially. They play an important role in the management scenarios.
Softwood lumber—Markets for southeast Alaska sawn wood products were identified using two sources for mill survey data. The annual mill surveys gathered consistent informa-tion on the same 20 wood processing mills over time. Half have shut down since the survey began, but annual lumber production volume and product destination are reported in these surveys. Data from 2002 to 2013 show that shipments of Alaskan lumber were sent to markets in the Pacific Rim and the lower 48 states or remained locally in Alaska. The 5-year average share (2009 to 2013) of lumber production in southeast Alaska sent to these markets was 57 percent to the lower 48 states, 32 percent to the Pacific Rim, 10 percent to local Alaska markets, and 1 percent to Canada. These findings for lumber markets are consistent with the BBER surveys conducted in 2005 and 2011.
Mill residue—Mill residues are reported in detail in the BBER surveys. However, destination data were lacking; volume of residues sold was reported only as either in state and out of state. As a result, we based the market assumptions for residue on the proportion that was unsold vs. sold and, further, sold for energy purposes. In the 2011 BBER mill data, the proportion of residues unsold, sold, and sold for energy was 11.8, 56.0, and 32.1 percent, respectively. The proportion sold for energy rose from the 22.4 percent reported in the 2005 survey. Of the bdus (bone-dry units) sold, we know the propor-tion sold for wood energy purposes. Estimating the volume of residue sold for energy was key for bioenergy assumptions considered for Tongass management scenarios.
There is little evidence that significant markets for residue from Alaska proces-sors currently exist outside of Alaska. Because we had no destination information from the BBER survey, USITC data were examined for state level trends in residue shipments. We wanted the option to model growth in residue exports as part of a Tongass management scenario.2 For every year after 2002, most of the small volume of residue exported from Alaska went to Canada until shipments began to dwindle after 2010. By 2014, the only shipment of residue reported as exported
2 Query of fuel wood, coniferous chips, sawdust and slabs, wood pellets, and other. Harmonized Trade Schedule codes used were 4401.10.0000, 4401.21.0000, 4401.30.0000, 4401.31.0000, and 4401.39.0000.
There is little evidence that significant markets for residue from Alaska processors currently exist outside of Alaska.
25
Tongass National Forest Timber Demand, Projections for 2015 to 2030
from Alaska was a shipment of 7 metric tons of coniferous chips to Taiwan. To date, there has been no record of any wood pellets exported from Alaska to any international destination. Evidence suggests that rapid expansion of the pellet industry in western Canada has dramatically increased the production and exports of pellets from competitors in Canada, which will hinder the development of export markets for southeast Alaska residues in the foreseeable future.
Other products—Berg et al. (2014) found southeast facilities that produced bowls, furniture, housel-ogs, molding, shingles, shakes, and siding. These were combined into an “other” market to capture niche markets that are popular with advocates for small producers and micro sales. The majority of these products remained in Alaska or went to the lower 48 states, but modest shipments were sent to Canada and the Pacific Rim. For the model, Alaska and the lower 48 were combined into a “U.S. other” series.
To summarize, log, lumber, residue and other niche product markets were iden-tified for southeast Alaska forest products using published sources and databases. The next step was to assemble historical time-series datasets for each of these markets for use in projections.
Assembling Historical Market DataSoftwood log exports—Softwood logs from southeast Alaska have been exported to Canada, China, Japan, and South Korea, as well as to domestic markets in the lower 48 states. To model each of these markets, we downloaded the historical volume of softwood logs3 imported by each of these countries from 1997 to 2012 from the FAOSTAT Forestry Database (Food and Agriculture Organization of the United Nations 2014). After completing our projections (discussed below), data for China, Japan, and South Korea were combined to create one Pacific Rim series. FAOSTAT also contains trade data between trading partners, so next we downloaded the volume of soft-wood log imports in each destination that originated from the United States. From the two series, we calculated the shares of Canadian and Pacific Rim log imports met by the United States.
Next, we estimated the proportion of the flow of U.S. softwood logs to Canada and the Pacific Rim met by southeast Alaska producers. Sawlog export volume from the Tongass to Canada and the Pacific Rim from 2001 to 2011 was directly available from Tongass export permits. These were combined with the estimated volume of logs harvested from Native Corporation and State of Alaska lands
Log, lumber, residue and other niche product markets were identified for southeast Alaska forest products using published sources and databases.
26
GENERAL TECHNICAL REPORT PNW-GTR-934
available in the ANILCA 706(a) reports from 1988 to 2011. From discussions with national forest, state, and industry representatives, we used the assumption that 90 percent of the Native harvest and 70 percent of the state harvest were exported to the Pacific Rim. The result was the share of logs imported from the United States into Canada and the Pacific Rim met by southeast Alaska exporters.
Domestic log market—The remaining sawlogs not sent to southeast Alaska processing mills were sent to the lower 48 states. Production, imports, and exports were downloaded from FAOSTAT then used to calculate a historical data series for U.S. softwood log consumption (consumption = production – exports + imports). Next, we subtracted imports to generate another series for the volume of U.S. softwood log demand met by domestic producers. These two series were used to calculate the share of U.S. log demand met by producers located in the United States.
Next, we gathered historical data pertaining to shipments from southeast Alaska. The volume of sawlogs sent to lower 48 destinations from the Tongass was available in the Tongass export permits. We assumed that, in addition to logs from the Tongass, 10 percent of the Native Corporation harvest (obtained from the ANILCA 706(a) reports) was channeled to the lower 48 states.4 The result was the volume of logs sent to the lower 48 from southeast Alaska. The share of U.S. log demand met by southeast Alaska producers was then calculated.
Utility logs—Historical utility log harvest data from 1988 to 2011 were gathered from the ANILCA 706(a) reports. Because they were not assigned a market initially, no market share calculations were performed.
Lumber—The process for generating historic lumber market data was similar to the one just described for softwood log markets. For international markets, we obtained from FAOSTAT the historical volume of softwood lumber5 imported by Canada, China, Japan, and South Korea from 1997 to 2012. Data for China, Japan, and South Korea
4 Per Forest Service staff consultations; see above for discussion. 5 FAOSTAT code 1632, coniferous sawnwood, reported in cubic meters. Defined as “wood produced from both domestic and imported roundwood, either by sawing lengthways or by a profile-chipping process and that exceeds 6 mm in thickness. Includes planks, beams, joists, boards, rafters, scantlings, laths, boxboards and ‘lumber,’ etc., in the following forms: unplaned, planed, end-jointed, etc. Excludes sleepers, wooden flooring, mouldings (sawnwood continuously shaped along any of its edges or faces, like tongued, grooved, rebated, V-jointed, beaded, moulded, rounded or the like) and sawnwood produced by resawing previously sawn pieces.”
27
Tongass National Forest Timber Demand, Projections for 2015 to 2030
were combined to create one Pacific Rim series after individual projections were made for each country. Next, we obtained the volume of softwood lumber received by each country from the United States. The result was the share of lumber imports met by the United States. Softwood lumber consumed in domestic U.S. markets was calculated from production, import, and export data obtained from FAOSTAT. U.S. imports of softwood lumber were subtracted from U.S. lumber consumption, to arrive at the volume of U.S. consumption met by U.S. producers. These were then used to calculate the U.S. share of domestic lumber consumption.
Southeast Alaska lumber production data are available from the annual mill surveys of southeast Alaska processing facilities from 2002 to 2013. Lumber in these surveys is defined as cants, shop and board, and dimension grades of Sitka spruce, western hemlock, western redcedar, and Alaskan yellow-cedar. The surveys include mill production, measured as the volume of logs produced into lumber in MBF log scale, and destination of final product. The volume and proportion of lumber heading to Canada, the Pacific Rim, the continental U.S. and remaining in Alaska are reported annually. These were used to generate series for the southeast Alaska share of each lumber export market. The baseline includes demand within Alaska within total U.S. demand, but local Alaska markets are explicitly incorpo-rated based on data in the BBER surveys. Berg et al. (2012) found that the average overrun in Alaska lumber mills in the 2011 mill survey was 1.19. Because the annual mill surveys were used only to calculate market shares and not used for the lumber demand projections, we opted to use volume numbers reported directly in log scale rather than adjust for product recovery.
Mill residue—After attempting to use published sources and finding them either incompatible or incomplete, residue volume was estimated by assuming that 55 percent of a log was recovered as lumber or “other” products. The remaining 45 percent was residue, defined as either coarse (chips, edging, and slabs), sawdust, planer shavings, or bark. BBER mill survey data contained information about the proportion of residue that remained in state vs. shipped out of state, but destination data for residue shipments were not available. We suspect that the modest shipments sent out of state went to Canada, but we did not model residue markets to Canada in the baseline scenario for reasons discussed above. We assumed that residue produced in southeast Alaska remained in Alaska.
The BBER surveys do contain usable information about the disposition of residues produced in southeast Alaska mills. Survey respondents estimated the proportion of residue that was unused, sold, or used but unsold. Of the sold residue, producers reported the amount that was sold for energy purposes such as hog fuel
Residue volume was estimated by assuming that 55 percent of a log was recovered as lumber or “other” products. The remaining 45 percent was residue, defined as either coarse (chips, edging, and slabs), sawdust, planer shavings, or bark.
28
GENERAL TECHNICAL REPORT PNW-GTR-934
or firewood. Thus we were able to calculate the market shares for residues that were sold and further divide sold residue into markets for energy uses vs. other uses. Because there were only two data points (2005 and 2011), we held the 2005 share constant for the period from 2005–2010 and the 2011 share constant from 2011–2013.
Other products—Products in this category are highly disparate and characterized by incompatible measurement units. Historical baseline series were estimated based on assump-tions from both the annual and BBER surveys. Mills classified as sawmills in the annual mill surveys could be making additional products that would be classified as “other” in the BBER survey, such as cedar products and siding. We made an assumption that “other” products measured in MBF could have been produced in the annual mill surveys. Then we averaged the 2005 and 2011 “other” volume and held those values constant for each reported destination. On average, 6 percent of “other” production was sent to Canada and 14 percent to the Pacific Rim, and the remaining 80 percent remained in the United States. We acknowledge the uncer-tainty of this process; we felt the necessity to have an “other” category outweighed the data limitations, especially because “other” volume was never greater than 1.5 percent of total southeast Alaska production.
Baseline ModelAfter assembling the historical datasets necessary to represent southeast Alaska timber markets, we developed a baseline model based on projections and mar-ket shares for each market served by southeast Alaska producers for the period 2015–2030. The baseline is a deterministic model based on the assumption that the industry in southeast Alaska production would remain at post-2008 recession levels for the next 15 years. The first step was to project conditions in product markets. Several projection methods were explored; experience and discussion with stake-holders all emphasized the need for straightforward, logical, and repeatable method-ology for this foundation piece of our analysis. We thus chose to use a trend-based approach to project each of the product markets in the baseline model according to historical trends. In short, this entailed calculating the annual average change in each market time series over the available historical data, and applying that change to each subsequent year of the projections. In a few cases, recent market conditions (since the late 2000s recession) clearly broke from historical trends. In these cases, we restricted the analysis6 to a period ending before the recession to reflect a return to historical trends. In other words, our assumption was that long-run conditions in each market would continue into the projection period from 2015 to 2030.
6 These cases were U.S. and Canadian sawlog consumption and China’s lumber imports.
The baseline is a deterministic model based on the assumption that the industry in southeast Alaska production would remain at post-2008 recession levels for the next 15 years.
29
Tongass National Forest Timber Demand, Projections for 2015 to 2030
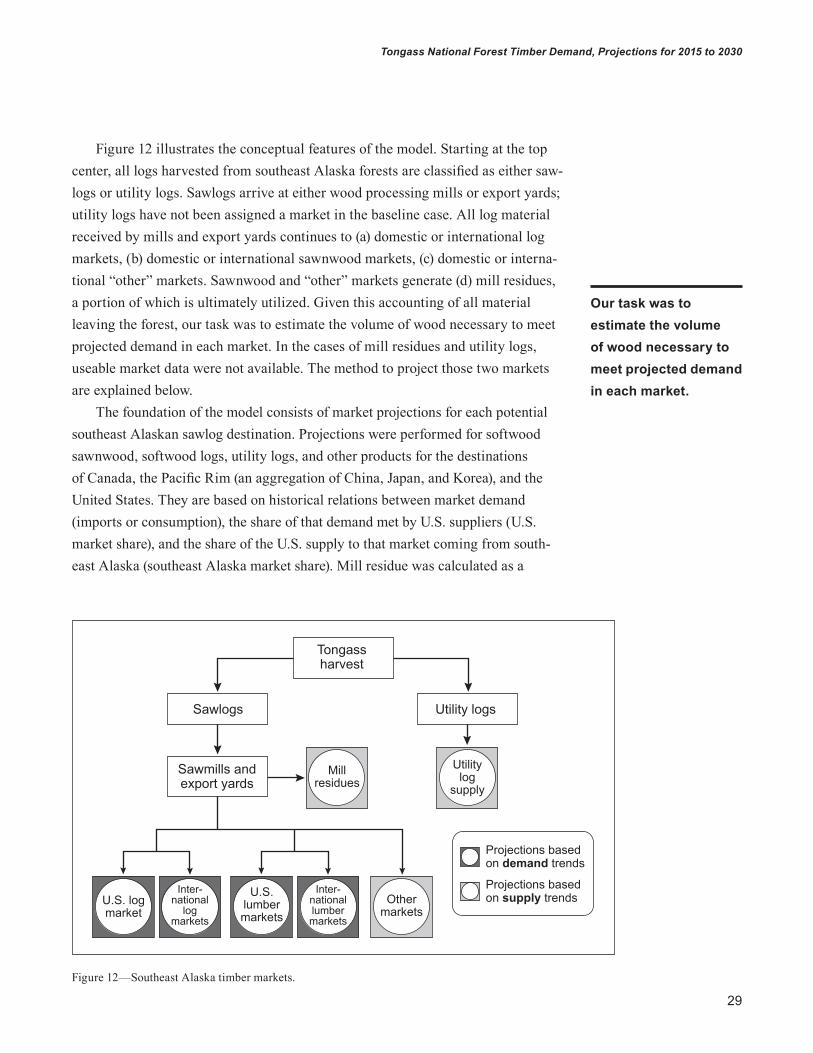
Figure 12 illustrates the conceptual features of the model. Starting at the top center, all logs harvested from southeast Alaska forests are classified as either saw-logs or utility logs. Sawlogs arrive at either wood processing mills or export yards; utility logs have not been assigned a market in the baseline case. All log material received by mills and export yards continues to (a) domestic or international log markets, (b) domestic or international sawnwood markets, (c) domestic or interna-tional “other” markets. Sawnwood and “other” markets generate (d) mill residues, a portion of which is ultimately utilized. Given this accounting of all material leaving the forest, our task was to estimate the volume of wood necessary to meet projected demand in each market. In the cases of mill residues and utility logs, useable market data were not available. The method to project those two markets are explained below.
The foundation of the model consists of market projections for each potential southeast Alaskan sawlog destination. Projections were performed for softwood sawnwood, softwood logs, utility logs, and other products for the destinations of Canada, the Pacific Rim (an aggregation of China, Japan, and Korea), and the United States. They are based on historical relations between market demand (imports or consumption), the share of that demand met by U.S. suppliers (U.S. market share), and the share of the U.S. supply to that market coming from south-east Alaska (southeast Alaska market share). Mill residue was calculated as a
Tongassharvest
Sawlogs
Sawmills andexport yards
Utility logs
Millresidues
Othermarkets
U.S. logmarket
Utilitylog
supply
U.S.lumbermarkets
Inter-nationallumbermarkets
Inter-national
logmarkets
Projections based on demand trends
Projections based on supply trends
Figure 12—Southeast Alaska timber markets.
Our task was to estimate the volume of wood necessary to meet projected demand in each market.
30
GENERAL TECHNICAL REPORT PNW-GTR-934
proportion of projected lumber and other production. For illustration, the market equation describing southeast Alaskan sawlog production destined for country i’s market for wood product j is:
Dij × αij × βij = Sijwhere:Dij = market demand in country i for product jαij = the U.S. share of the market for product j in country iβij = southeast Alaskan suppliers’ share of the U.S. flow of product j to country iSij = southeast Alaska production of product j destined for country i
Utility logs, other products, and mill residues could not be modelled as a func-tion of market demand in this way. Instead, utility logs are modeled according to historical harvest data for the Tongass National Forest, State of Alaska lands, and Native Corporation lands. Mill residue production data were available only for 2005 and 2011 from the BBER surveys, so mill residue production values were derived using assumptions about product recovery for sawnwood and “other” production that remained constant into the future. Explicitly, the assumption was that product recovery represented 55 percent of a typical log entering southeast Alaska sawmills and the remaining 45 percent became residue. Based on information in published sources, we reallocated a modest portion of projected lumber production to cre-ate an “other” series to account for niche products like houselogs, molding, cedar products, shingles, and siding.
The baseline model assumes that parameter values for α and β appearing above remain constant over time. For example, we have historical data for Chinese lumber imports from 1997 to 2012, as well as the volume of Chinese lumber imported spe-cifically from the United States (both from the FAO). We can then calculate α—the U.S. market share—in each year. Summed across all Pacific Rim countries (China, Japan, and Korea), these values can be compared to the portion of lumber produc-tion destined for the Pacific Rim published in the BBER surveys and the annual mill surveys to calculate β, southeast Alaska suppliers’ share of the U.S. flow to the Pacific Rim market in each year. For the baseline projections, we assume that both the annual the rate of change and the U.S. and southeast Alaska share of each product market remained constant from 2015 to 2030. The management scenarios discussed next were developed by adjusting either market projections or shares to represent various alternatives.
The management scenarios discussed next were developed by adjusting either market projections or shares to represent various alternatives.
31
Tongass National Forest Timber Demand, Projections for 2015 to 2030
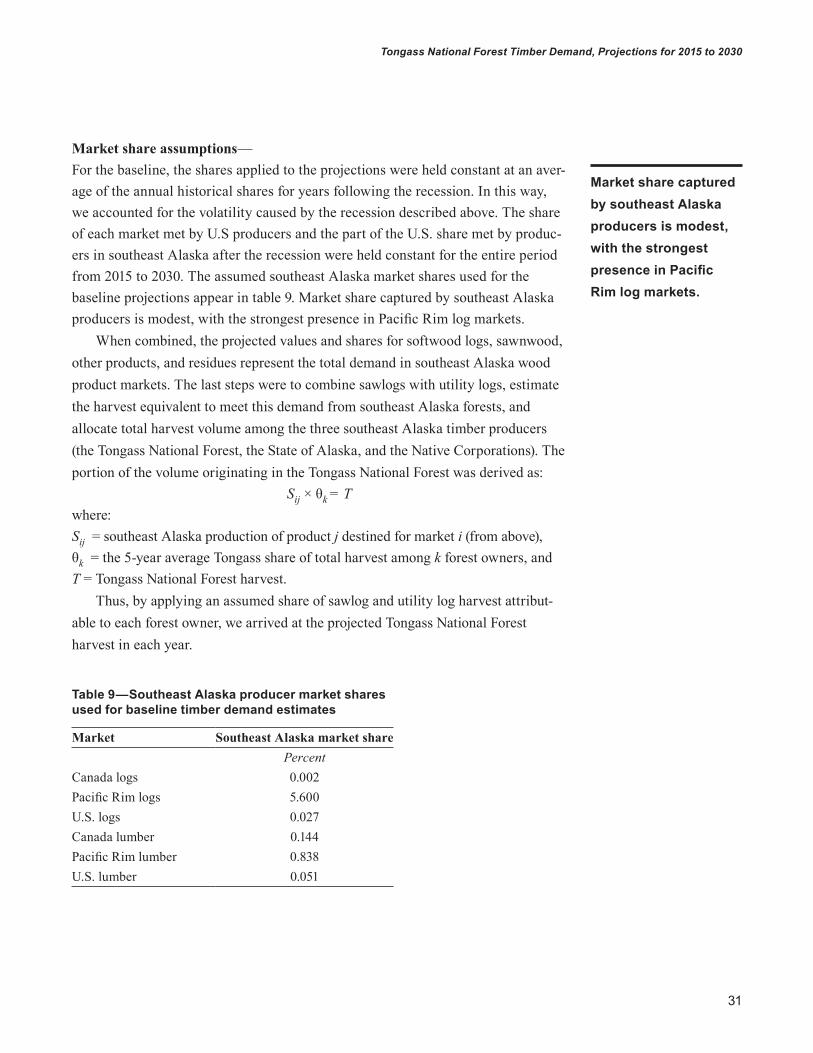
Market share assumptions—For the baseline, the shares applied to the projections were held constant at an aver-age of the annual historical shares for years following the recession. In this way, we accounted for the volatility caused by the recession described above. The share of each market met by U.S producers and the part of the U.S. share met by produc-ers in southeast Alaska after the recession were held constant for the entire period from 2015 to 2030. The assumed southeast Alaska market shares used for the baseline projections appear in table 9. Market share captured by southeast Alaska producers is modest, with the strongest presence in Pacific Rim log markets.
When combined, the projected values and shares for softwood logs, sawnwood, other products, and residues represent the total demand in southeast Alaska wood product markets. The last steps were to combine sawlogs with utility logs, estimate the harvest equivalent to meet this demand from southeast Alaska forests, and allocate total harvest volume among the three southeast Alaska timber producers (the Tongass National Forest, the State of Alaska, and the Native Corporations). The portion of the volume originating in the Tongass National Forest was derived as:
Sij × θk = Twhere:Sij = southeast Alaska production of product j destined for market i (from above),θk = the 5-year average Tongass share of total harvest among k forest owners, andT = Tongass National Forest harvest.
Thus, by applying an assumed share of sawlog and utility log harvest attribut-able to each forest owner, we arrived at the projected Tongass National Forest harvest in each year.
Table 9—Southeast Alaska producer market shares used for baseline timber demand estimates
Market Southeast Alaska market sharePercent
Canada logs 0.002Pacific Rim logs 5.600U.S. logs 0.027Canada lumber 0.144Pacific Rim lumber 0.838U.S. lumber 0.051
Market share captured by southeast Alaska producers is modest, with the strongest presence in Pacific Rim log markets.
32
GENERAL TECHNICAL REPORT PNW-GTR-934
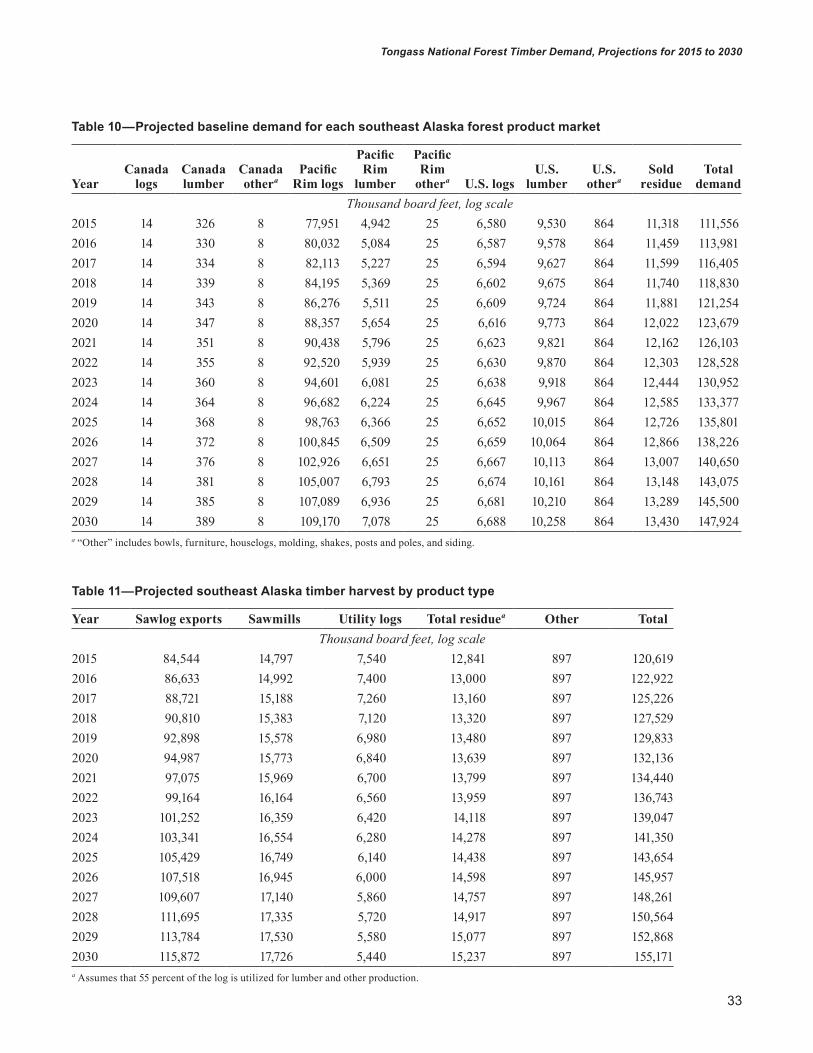
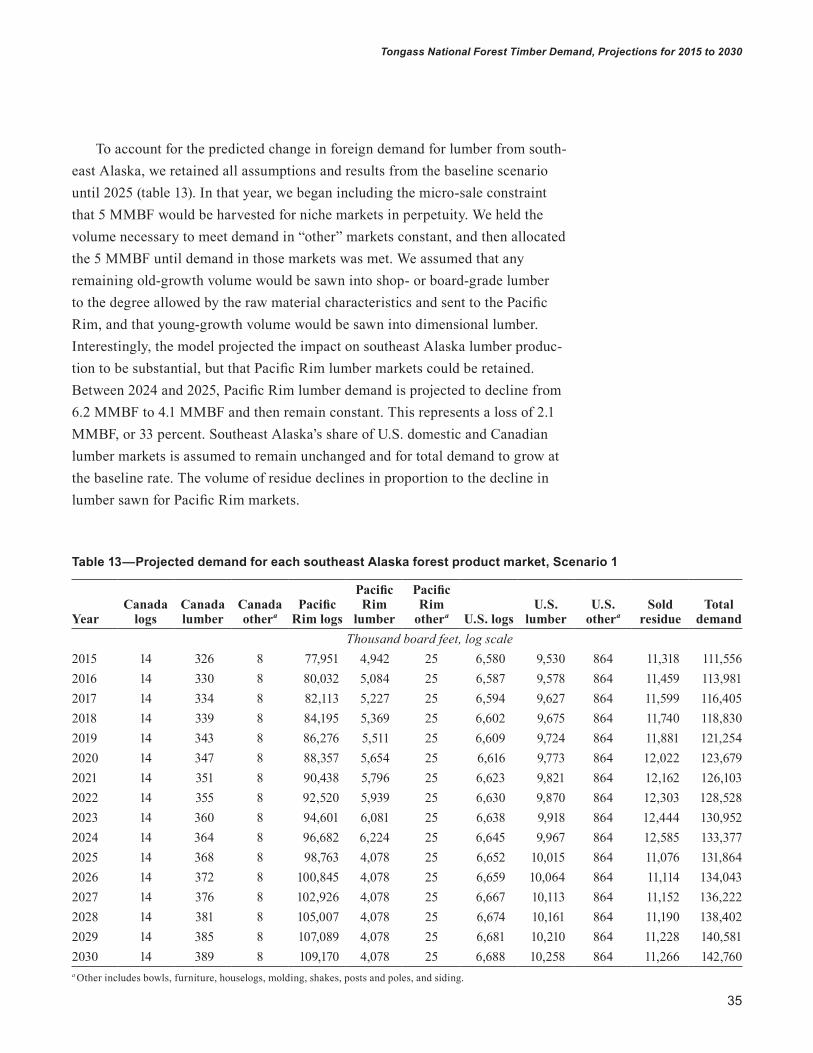
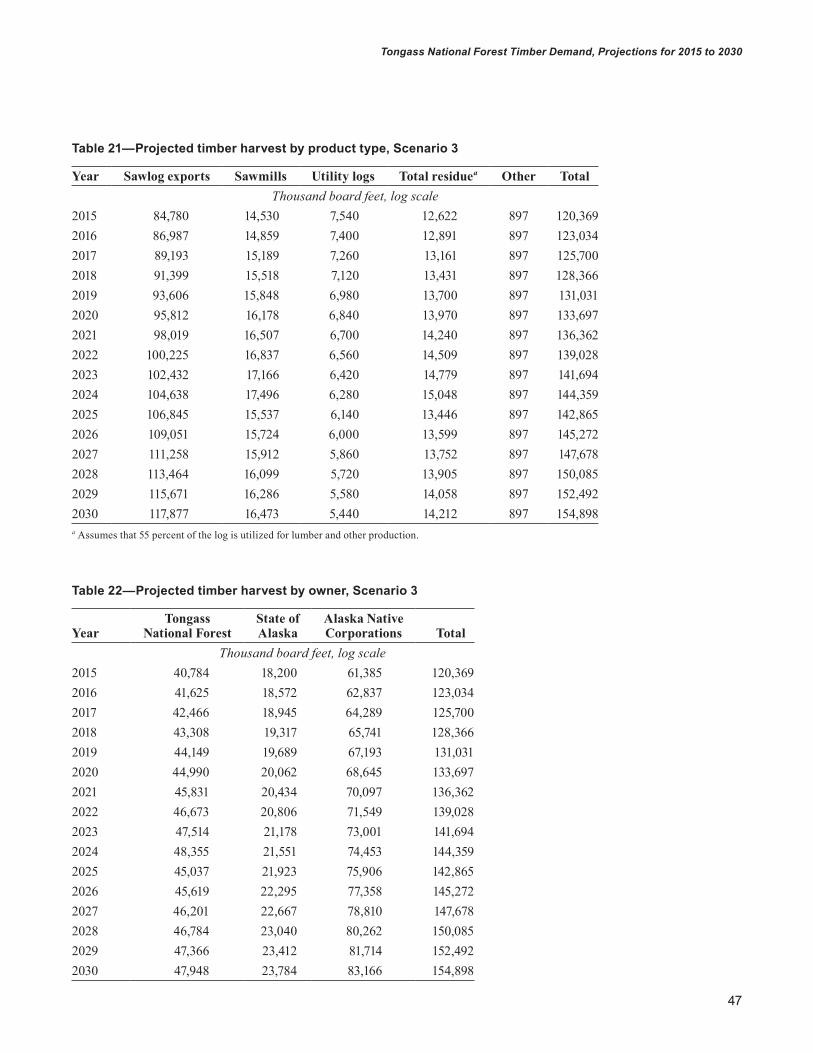
Baseline Projected Demand and Harvest EstimatesTable 10 contains the projected volume of demand in each southeast Alaska product market from 2015 to 2030. Demand for logs, lumber, and other products in each market was taken directly from our calculations. Residue was first decomposed into sold vs. unsold residue; sold residue was calculated as a constant 88 percent of the total residue volume based on proportions found in the 2011 BBER survey.
Data from the table above were combined with harvested utility logs and unsold residue volume to estimate total harvest allocated by industry (table 11). Projected demand for logs and lumber in Canada, the Pacific Rim, and the United States was combined into series representing log exporters and sawmills. This interim step was used to compute the final results, projected harvest by owner (table 12). Projected market volume was allocated to each timber owner using an average of the last 5 years’ share of total sawlog harvest according to the ANILCA 706(a) reports. Shares used to allocate sawlogs were 29.76 percent Tongass, 57.57 percent Native Corporation, and 13.65 percent state. Utility logs were allocated in the same fashion; shares used were 35.60 percent Tongass, 50.75 percent Native Corpora-tion, and 13.65 percent state. Residues were allocated only to the Tongass and the state because we assumed that 100 percent of the Native Corporation harvest was exported in log form. Table 12 shows that the majority of harvest is allocated to Native Corporation lands, followed by the Tongass and State of Alaska lands.
The baseline model was used to construct three management scenarios represent-ing alternative futures for timber harvest in southeast Alaska. The first scenario (S1) establishes a timeline for the young-growth transition and reflects the current state of knowledge and professional judgment of regional forest managers. The second scenario retains the assumptions from S1, but builds in an expansion of bioenergy markets. Scenario 3 also retains the young-growth transition assumptions from S1, but adds an increase in forecasted demand in the United States arising from recovery of housing markets with corresponding demand for wood products for construction.
Scenario 1Scenario 1 (S1) incorporates the young-growth transition and the resulting changing quality of timber from the Tongass National Forest over time. It includes a transition period of 10 years in which tapering levels of old growth will be harvested while the industry adjusts and more young-growth timber becomes available. The Ton-gass will continue to supply more than 90 percent of the logs received by southeast Alaska mills. By 2025, old-growth harvest will be constrained at 5 MMBF annually in perpetuity for micro-sales designed to provide raw material for small businesses and specialty products. The timing of the transition and post-transition micro-sale
The baseline model was used to construct three management scenarios representing alternative futures for timber harvest in southeast Alaska.
Scenario 1 (S1) incorporates the young-growth transition and the resulting changing quality of timber from the Tongass National Forest over time.
33
Tongass National Forest Timber Demand, Projections for 2015 to 2030
Table 10—Projected baseline demand for each southeast Alaska forest product market
harvest volume are the best available estimates and were obtained from discussions with Forest Service staff (Harris 2015, Spores 2015). We assume that all current purchasers of Forest Service timber sales can bid on these micro-sales and that existing mills will make any machinery upgrades necessary for the young-growth transition, but that rates of utilization may fluctuate. For the years before 2025, we retained assumptions from the baseline model, including: log exports from all owners will continue at their 5-year average rate; “other” production will remain constant; markets for utility logs and other low-grade material will remain elusive; and 88 percent of residues will be sold. Finally, none of the scenarios is constrained by CMAI requirements; we assume that the Tongass will receive an exemption.
For the years from 2025 to 2030, the key impact of the young-growth transition on timber demand from southeast Alaska is on markets for high-quality lumber. Alaskan high-quality sawn product markets are traditionally tied to the Pacific Rim. Because of the changing log characteristics as harvests transition to young growth, southeast Alaska sawmills are more likely to produce more dimension lumber in the future and thus are unlikely to remain as competitive in the Pacific Rim. We assume that purchasers in the Pacific Rim will not be willing to substitute dimension-grade lumber for shop grade, nor will demand for dimensional southeast Alaska lumber in the United States grow beyond the baseline projections. The competitive position and markets for logs exported from southeast Alaska are assumed to remain unchanged.
Table 12—Projected southeast Alaska timber harvest by owner
YearTongass National
Forest State of AlaskaAlaska Native Corporations Total
For the years from 2025 to 2030, the key impact of the young-growth transition on timber demand from southeast Alaska is on markets for high-quality lumber.
35
Tongass National Forest Timber Demand, Projections for 2015 to 2030
To account for the predicted change in foreign demand for lumber from south-east Alaska, we retained all assumptions and results from the baseline scenario until 2025 (table 13). In that year, we began including the micro-sale constraint that 5 MMBF would be harvested for niche markets in perpetuity. We held the volume necessary to meet demand in “other” markets constant, and then allocated the 5 MMBF until demand in those markets was met. We assumed that any remaining old-growth volume would be sawn into shop- or board-grade lumber to the degree allowed by the raw material characteristics and sent to the Pacific Rim, and that young-growth volume would be sawn into dimensional lumber. Interestingly, the model projected the impact on southeast Alaska lumber produc-tion to be substantial, but that Pacific Rim lumber markets could be retained. Between 2024 and 2025, Pacific Rim lumber demand is projected to decline from 6.2 MMBF to 4.1 MMBF and then remain constant. This represents a loss of 2.1 MMBF, or 33 percent. Southeast Alaska’s share of U.S. domestic and Canadian lumber markets is assumed to remain unchanged and for total demand to grow at the baseline rate. The volume of residue declines in proportion to the decline in lumber sawn for Pacific Rim markets.
Table 13—Projected demand for each southeast Alaska forest product market, Scenario 1
Tables 14 and 15 show the model results of S1 on timber harvest. Table 14 shows that sawmills and residue-dependent industries are affected by the young-growth transition. The loss of Pacific Rim lumber market demand was allocated entirely to the Tongass harvest, rather than distributed across the three southeast Alaska timber owners. Table 15 shows that the harvest volume differs from the baseline model only by a reduction in timber harvested from the Tongass. There are several reasons to support the idea that the young-growth transition will reduce demand for Tongass timber. First, the high costs of harvesting and transportation in remote areas of southeast Alaska and the relatively lower price commanded in dimensional lumber markets limits the profitability of commodity products sawn from young growth. In addition, historical trends, market analyses, and discussions with subject matter experts all suggest that Pacific Rim purchasers would not be willing to substitute dimensional lumber for shop lumber in the future. One pos-sibility is that the Tongass could simply take the volume directed into Pacific Rim lumber markets and export it in log form. However, Tongass sawlog exports are limited by both the Limited Export Policy and by the competitive position of the forest. This log supply constraint is coupled with a competitive disadvantage in log markets traditionally served by Native Corporations and the state of Alaska, as well as domestic competitors in the Pacific Northwest and international competitors such as New Zealand and Russia. Developments in any competing regions could affect the comparative advantage of southeast Alaskan producers and change their share of foreign exports. The majority of harvest is allocated to Native Corporation lands, followed by the Tongass and the state of Alaska. Residues were allocated only to the Tongass and the state. To summarize, the S1 alternative describes a future in which the young-growth transition is completed by 2025 and results in a loss of demand in Pacific Rim lumber markets that will reduce harvest from the Tongass and leave the harvest from Native or state timberlands unchanged from the baseline.
The largest source of uncertainty in this scenario is whether the state of Alaska has enough supply of high-quality timber and a willingness to increase allowable harvest to meet the projected shortfall in material for shop-grade lumber producers and their clients. We designed the young-growth model to maintain the assumption that the state harvest consists of 70-percent log exports and 30-percent local south-east Alaska processing.
Table 15 displays a future in which demand for export logs grows, lumber demand declines, and demand for other products remains constant compared to the baseline rate. Our best professional estimation is that a greater proportion of timber harvested from the Tongass will be unsuitable to meet the specifications for shop- and board-grade lumber and that southeast Alaskan producers will be unable to
Developments in any competing regions could affect the comparative advantage of southeast Alaskan producers and change their share of foreign exports.
37
Tongass National Forest Timber Demand, Projections for 2015 to 2030
Table 14—Projected timber harvest by product type, Scenario 1
Year Sawlog exports Sawmills Utility logs Total residuea Other TotalThousand board feet, log scale
increase shipments of dimensional lumber to traditional North American markets. The model estimated an overall decline in harvest from the Tongass beginning in 2025 of 3.4 MMBF from the previous year. By 2030, the cumulative impact on harvest compared to the baseline model is a decline in harvesting from the Tongass of 5.5 MMBF.
Scenario 2The second scenario (S2) builds upon S1 by adding markets for wood-based energy products. The motivation behind this scenario is a policy goal set by the Forest Service to support the conversion of distillate fuel use in southeast Alaska to wood-based fuels (Deering 2014). The scenario incorporates a Forest Service target of 30-percent conversion from distillate fuels to wood-based energy products in southeast Alaska’s residential, commercial, and industrial sectors. Expand-ing markets for biomass energy will affect timber harvest from the Tongass by generating demand for two sources of biomass—sawmill residues and low- and utility-grade logs. Logging slash was excluded because of its high moisture content and transport cost (Beck Group 2009). The scenario includes estimates of derived demand for Tongass timber as the conversion from heating oil to wood-based fuel is phased in over time, although findings suggest that the 30-percent goal may be too ambitious. For our purposes, the terms “distillate fuels” and “heating oil” are used interchangeably.
The methodology and results of this analysis are described in depth in a sup-porting document we produced for scenario 2 (Donels et al. 2016). The approach began with estimating the amount of raw material required to substitute an equivalent amount of Btus from heating oil with Btus of wood. First, we gathered data on the number of establishments and distillate-fuel use in Alaska’s residential, commercial, and industrial sectors (USDC CB 2014a, 2014b; USDE EIA 2014). We selected 2012 as the base year for the 30-percent target; the total amount of heating oil used statewide in 2012 was 39.7 trillion Btus. To estimate the effect on wood demand from southeast Alaska, we converted the Btus of heating oil to wood equivalents (MBF), assuming that distillate fuel and wood heating equipment would operate at 85- and 65-percent efficiency, respectively, and that wood mate-rial would have 10-percent moisture content.7 The U.S. Department of Energy’s Energy Information Administration (EIA) provides both historical and forecasted consumption data for each end-use sector at the state level; we defined the residen-tial, commercial, and industrial sectors using the same North American Industry
7 Oven-dry basis.
The motivation behind this scenario is a policy goal set by the Forest Service to support the conversion of distillate fuel use in southeast Alaska to wood-based fuels.
39
Tongass National Forest Timber Demand, Projections for 2015 to 2030
Classification System (NAICS) criteria as the EIA. Southeast Alaska’s share of the state consumption was allocated using its share of occupied homes using distillate fuels for their primary source of heat for the residential sector, and its share of businesses in the commercial and industrial sectors. After adjusting for climate using the statewide values for heating degree days (Alaska Climate Research Center 2014), we calculated that the number of Btus necessary to replace 30 percent of distillate fuel use in southeast Alaska was 1.4 trillion Btus. Table 16 shows heating oil purchases statewide and in southeast Alaska for the residential, commercial, and industrial sectors, along with the volume of wood necessary to replace 30 percent of the heating oil used in southeast Alaska.
The next step was to simulate the markets and harvest requirement of the 30-percent goal using our model. We began with the young-growth transition mod-eled in Scenario 1, then added the assumption that 5 percent of the 30-percent goal would be achieved every year starting in 2015.8 This assumption means that every year, 5 percent of the total conversion target will be met, translating to 70.8 billion additional Btus of energy annually. We assume that initially this demand would create a market for the unsold mill residues estimated in our baseline analysis. The BBER surveys showed that almost 15 percent of mill residue in Alaska was unused in 2011. Those were the first channeled into wood energy markets and the supply was exhausted in the first year of the projection period. Next, mill residues that were previously sold for non-energy purposes9 were assumed to be rechanneled into bioenergy markets. When that supply was exhausted (in the second year of our scenario), we assumed that the supply of southeast Alaska utility-grade logs would begin to flow into a growing market for wood energy.
Until this point in the scenario, all new demand was assumed to be met by a reallocation of existing supply—first from previously unsold material, then from material previously destined for other markets. In the fourth year of the proposed conversion, however, the entire supply of utility logs projected by the baseline model was exhausted alongside the supplies of mill residues. The last step was to calculate the additional low- and utility-grade material necessary to fill any remaining shortfall to meet the substitution goal. Thus, the considerable remaining demand for wood energy not met by existing supplies was met by additional harvest of utility-grade logs. We assumed that this additional material was harvested from each of southeast Alaska’s forest ownerships according to their 5-year average share
8 At an annual rate of 5 percent, the 30-percent goal is not achieved by the end of the forecast horizon of 2030.9 Such as animal bedding and industrial use.
Thus, the considerable remaining demand for wood energy not met by existing supplies was met by additional harvest of utility-grade logs.
40
GENERAL TECHNICAL REPORT PNW-GTR-934
Tabl
e 16
—D
istil
late
fuel
a use
in A
lask
a by
eco
nom
ic s
ecto
r, 20
03–2
012
R
esid
entia
l sec
tor
C
omm
erci
al se
ctor
In
dust
rial
sect
or
Year
Stat
ewid
e to
tal
Sout
heas
t Ala
ska,
30
per
cent
b
Stat
ewid
e to
tal
Sout
heas
t Ala
ska,
30
per
cent
St
atew
ide
tota
lSo
uthe
ast A
lask
a,
30 p
erce
ntTh
ousa
nd
barr
els
Billi
on
Btus
Billi
on
Btus
Thou
sand
bo
ard
feet
Th
ousa
nd
barr
els
Billi
on
Btus
Billi
on
Btus
Thou
sand
bo
ard
feet
Th
ousa
nd
barr
els
Billi
on
Btus
Billi
on
Btus
Thou
sand
bo
ard
feet
2003
1,47
28,
480
433
40,3
8593
25,
369
166
15,4
792,
195
12,6
4540
838
,021
2004
1,68
79,7
1949
746
,283
1,15
86,
671
206
19,2
332,
089
12,0
3538
836
,184
2005
1,61
99,
327
477
44,4
181,
006
5,79
617
916
,708
1,91
211
,015
355
33,11
920
061,
932
11,1
3056
953
,005
1,16
66,
717
208
19,3
662,
187
12,5
9940
637
,882
2007
1,45
88,
400
429
40,0
0098
15,
652
175
16,2
932,
691
15,5
0350
046
,612
2008
1,24
87,1
9036
734
,239
1,22
67,
063
218
20,3
622,
709
15,6
0750
346
,924
2009
1,50
08,
642
442
41,1
531,
093
6,29
719
518
,153
3,29
218
,965
612
57,0
2220
101,
504
8,66
544
341
,263
1,92
411
,084
343
31,9
552,
455
14,14
345
642
,524
2011
1,39
38,
025
410
38,2
171,7
4310
,041
311
28,9
493,
309
19,0
6361
557
,317
2012
1,35
67,
812
399
37,2
02
1,48
18,
532
264
24,5
97
4,05
623
,367
754
70,2
56a F
uel o
il; k
eros
ene;
and
bot
tle, t
ank,
or l
ique
fied
petr
oleu
m g
as.
b Adj
uste
d fo
r hea
ting
degr
ee d
ays,
pror
ated
by
num
ber o
f hou
seho
lds a
nd e
stab
lishm
ents
, mul
tiplie
d by
30
perc
ent.
41
Tongass National Forest Timber Demand, Projections for 2015 to 2030
of utility log production. Recall that utility log shares used were 35.60 percent from the Tongass National Forest, 50.75 percent from Native Corporations, and 13.65 percent from the state.
This analysis is the first attempt to estimate the harvest equivalent for the 30-percent bioenergy conversion policy. Applying the assumptions of (1) 5-percent annual rate of adoption, (2) 65-percent combustion efficiency, and (3) 10-percent moisture content, we were able to replace only 68 percent of the heating oil use in southeast Alaska by 2030. Tables 17, 18, and 19 show derived demand in product markets, projected timber harvest by product type, and harvest by owner for S2, respectively. By 2030, the harvest necessary to meet demand for the wood energy scenario is more than double the entire 2011 south-east Alaska timber harvest and almost 79 MMBF greater than the baseline. We assumed that the harvest would be distributed proportionally among the timber owners, because each has a supply of utility logs and no barriers to entering bioenergy markets. According to our calculations, the rate of adoption of wood energy technology necessary to meet the 30-percent goal is just shy of 7 percent per year.
In addition to the expansion of bioenergy markets in the region, this sce-nario’s results could reflect any alternative future characterized by increased use of low-grade and utility logs. One such potential is large-scale ecological restoration and habitat improvement. Concerns about subsistence and the fate of Alaska wolf populations have risen along with concerns about deer habitat on the Tongass. These concerns are reflected in a 2011 petition to list the Alexan-der Archipelago wolf (Canis lupus ligoni) as either threatened or endangered, filed with the U.S. Fish and Wildlife Service. In March 2014, in response to the petition, the agency made a positive initial finding that listing the species as threatened or endangered “may be warranted,” and that it will prepare a formal status review. High-density regrowth in previously harvested areas precludes the development of deer browse in the forest understory for a period of time, called stem exclusion. Harvest for habitat improvement could potentially add to the stock of harvestable utility grade second-growth timber. Thus S2 supports the growth of markets for mill residues and low- and utility-grade logs from south-east Alaska, whether from increased demand for bioenergy, demand for habitat and ecological improvement, or some other unforeseen market developing for low-grade and utility logs.
By 2030, the harvest necessary to meet demand for the wood energy scenario is more than double the entire 2011 southeast Alaska timber harvest and almost 79 MMBF greater than the baseline.
42
GENERAL TECHNICAL REPORT PNW-GTR-934
Tabl
e 17
—Pr
ojec
ted
dem
and
for e
ach
sout
heas
t Ala
ska
fore
st p
rodu
ct m
arke
t, Sc
enar
io 2
Year
Can
ada
logs
Can
ada
lum
ber
Can
ada
othe
ra
Paci
fic
Rim
lo
gs
Paci
fic
Rim
lu
mbe
r
Paci
fic
Rim
ot
hera
U.S
. lo
gsU
.S.
lum
ber
U.S
. ot
hera
Sold
re
sidu
eU
tilit
y lo
gsTo
tal
dem
and
Thou
sand
boa
rd fe
et, l
og sc
ale
2015
1432
68
77,9
514,
942
256,
580
9,53
086
411
,318
011
1,55
620
1614
330
880
,032
5,08
425
6,58
79,
578
864
13,0
004,
232
119,7
5420
1714
334
882
,113
5,22
725
6,59
49,
627
864
13,16
010
,229
128,
195
2018
1433
98
84,1
955,
369
256,
602
9,67
586
413
,320
16,2
2613
6,63
620
1914
343
886
,276
5,51
125
6,60
99,7
2486
413
,480
22,2
2414
5,07
620
2014
347
888
,357
5,65
425
6,61
69,7
7386
413
,639
28,2
2115
3,51
720
2114
351
890
,438
5,79
625
6,62
39,
821
864
13,7
9934
,218
161,
958
2022
1435
58
92,5
205,
939
256,
630
9,87
086
413
,959
40,2
1517
0,39
920
2314
360
894
,601
6,08
125
6,63
89,
918
864
14,11
846
,213
178,
840
2024
1436
48
96,6
826,
224
256,
645
9,96
786
414
,278
52,2
1018
7,28
020
2514
368
898
,763
4,07
825
6,65
210
,015
864
12,5
6659
,353
192,
707
2026
1437
28
100,
845
4,07
825
6,65
910
,064
864
12,6
0965
,422
200,
960
2027
1437
68
102,
926
4,07
825
6,66
710
,113
864
12,6
5271
,491
209,
214
2028
1438
18
105,
007
4,07
825
6,67
410
,161
864
12,6
9677
,559
217,
467
2029
1438
58
107,
089
4,07
825
6,68
110
,210
864
12,7
3983
,628
225,
720
2030
1438
98
109,
170
4,07
825
6,68
810
,258
864
12,7
8289
,697
233,
973
a Oth
er in
clud
es b
owls
, fur
nitu
re, h
ouse
logs
, mol
ding
, sha
kes,
post
s and
pol
es, a
nd si
ding
.
43
Tongass National Forest Timber Demand, Projections for 2015 to 2030
Table 18—Projected timber harvest by product type, Scenario 2
Year Sawlog exports Sawmills Utility logs Total residuea Other TotalThousand board feet, log scale
Scenario 3Underlying the model’s baseline scenario are demand projections of each product market for southeast Alaska forest products. These projections are based on avail-able historical data, as outlined above. Scenario 3 (S3) is motivated by uncertainty regarding the future of a critical driver of global lumber demand—the U.S. housing market—and assumes a higher trajectory for this market by considering only the pre-recession rate of growth in domestic lumber consumption, as opposed to more conservative growth rates used in the model’s baselines.
As we finalized this publication in summer 2015, U.S. sawnwood consumption had grown from a Great Recession trough in 2009 to levels approaching those seen during the pre-recession housing boom. It is still too soon to determine whether this recovery will be sustained past the very near term; early evidence10 suggests that the recovery is underway, although whether it will match the velocity seen before the 2007–2009 collapse is yet unknown. Scenario 3 was built on the possibility that domestic sawnwood demand growth will continue at a pre-recession rate through the entire projection period.
This scenario affects southeast Alaska harvest and production through two channels. The first is domestic demand for locally produced lumber, which has averaged over 10 MMBF (0.05 percent of total U.S. demand) since 2009. The second channel is the demand of domestic lumber producers for locally harvested logs as a raw material input for production. In both 2012 and 2013, approximately 6.5 MMBF of logs left southeast Alaska for domestic destinations, comprising 0.03 percent of total market demand. The approach for this scenario traced higher lumber demand growth through both channels to local harvest impacts. The first step was generating new projections for U.S. sawnwood based on average growth prior to 2007, and thus prior to the recession, from our calculation. Maintaining our baseline assumptions for southeast Alaska’s share of this market, growth in domes-tic demand for housing generates greater demand for locally produced lumber.
Accelerated domestic lumber consumption necessarily requires greater domes-tic log consumption. To account for this second effect on southeast Alaska produc-tion, we revised the underlying projection for U.S. log consumption in proportion to the projected increase in U.S. sawnwood consumption. Again maintaining the baseline for southeast Alaska’s share of the market, we generated revised projec-tions of demand for locally sourced logs. The method to estimate mill residue and other niche production remained unchanged from the baseline procedure. Table 20
10 See FPL-GTR-219 (http://www.fpl.fs.fed.us/documnts/fplgtr/fpl_gtr219.pdf), Effects on U.S. Timber Outlook of Recent Economic Recession, Collapse in Housing Construction, and Wood Energy Trends, among others.
Scenario 3 was built on the possibility that domestic sawnwood demand growth will continue at a pre-recession rate through the entire projection period.
45
Tongass National Forest Timber Demand, Projections for 2015 to 2030
shows that markets for Pacific Rim lumber, U.S. logs, U.S. lumber, and sold residue are affected by the assumptions for S3, compared to the baseline.
Scenario 3 essentially models the change in harvest by incorporating an increased demand for housing into projections for domestic lumber consumption but leaving the market share of southeast Alaska producers constant. Tables 21 and 22 show the projected harvest by industry and timber owner. Interestingly, the results of this scenario are quite similar to the baseline that does not include the young-growth transition; the increase in total harvest spurred by stronger U.S. housing demand almost exactly offsets the losses from the Tongass young-growth policy beginning in 2025. Scenario 3 suggests that the model is relatively insensi-tive to accelerated domestic lumber demand. Here, a 25-percent increase in the pro-jection for domestic lumber consumption translated to 3.3 and 3.5 percent increases in Tongass and total southeast Alaska harvest from the baseline, respectively.
Sensitivity of the ModelOur approach to incorporating and displaying uncertainty has two components. The first is the design and analysis of the three management scenarios. The second is a sensitivity analysis in which we examined the effects of changes in individual elements of the projections. The sensitivity analysis showed model results to be most sensitive to changes in Pacific Rim log export markets. This highlights the impor-tance of competitiveness relative to producers in the Pacific Northwest and other global log suppliers. Our model showed that the young-growth transition is most likely to affect lumber production; maintaining Pacific Rim log export markets in the face of changing raw material quality and the high costs of harvesting and transport-ing material are central issues facing the competitiveness of the Alaska forest sector.
Selecting an AlternativeThe alternative management scenarios presented here represent three different futures for timber demand in southeast Alaska. In the last study, Brackley et al. (2006b) initially avoided labeling a “most likely” projection, but later asserted that the limited lumber scenario had the greatest likelihood of occurrence because it depended only on maintenance of the status quo. We also are avoiding recommend-ing any one scenario as a “most likely” projection because of the relatively high degree of uncertainty surrounding developments in southeast Alaska. Our objective is to focus attention on key market drivers like competitiveness, efficiency, access to affordable energy, and global and domestic macroeconomic conditions. These in turn were translated into a range of values for parameters in our model. The model is a framework for quantifying assumptions about the future for Alaska and displaying their implications in terms of demand for timber from the Tongass National Forest.
Scenario 3 essentially models the change in harvest by incorporating an increased demand for housing into projections for domestic lumber consumption but leaving the market share of southeast Alaska producers constant.
The sensitivity analysis showed model results to be most sensitive to changes in Pacific Rim log export markets.
46
GENERAL TECHNICAL REPORT PNW-GTR-934
Tabl
e 20
—Pr
ojec
ted
dem
and
for e
ach
sout
heas
t Ala
ska
fore
st p
rodu
ct m
arke
t, Sc
enar
io 3
Year
Can
ada
logs
Can
ada
lum
ber
Can
ada
othe
raPa
cific
R
im lo
gsPa
cific
Rim
lu
mbe
r
Paci
fic
Rim
ot
hera
U.S
. lo
gsU
.S.
lum
ber
U.S
. ot
hera
Sold
re
sidu
eTo
tal
dem
and
Thou
sand
boa
rd fe
et, l
og sc
ale
2015
1432
68
77,9
514,
942
256,
816
9,26
286
411
,125
111,
332
2016
1433
08
80,0
325,
084
256,
941
9,44
586
411
,363
114,
105
2017
1433
48
82,11
35,
227
257,
066
9,62
886
411
,600
116,
879
2018
1433
98
84,1
955,
369
257,1
919,
811
864
11,8
3811
9,65
320
1914
343
886
,276
5,51
125
7,31
69,
994
864
12,0
7612
2,42
620
2014
347
888
,357
5,65
425
7,44
210
,177
864
12,3
1312
5,20
020
2114
351
890
,438
5,79
625
7,56
710
,360
864
12,5
5112
7,97
420
2214
355
892
,520
5,93
925
7,69
210
,543
864
12,7
8813
0,74
720
2314
360
894
,601
6,08
125
7,81
710
,725
864
13,0
2613
3,52
120
2414
364
896
,682
6,22
425
7,94
210
,908
864
13,2
6413
6,29
520
2514
368
898
,763
4,07
825
8,06
711
,091
864
11,8
5113
5,13
020
2614
372
810
0,84
54,
078
258,
193
11,2
7486
411
,986
137,
659
2027
1437
68
102,
926
4,07
825
8,31
811
,457
864
12,1
2114
0,18
720
2814
381
810
5,00
74,
078
258,
443
11,6
4086
412
,256
142,
716
2029
1438
58
107,
089
4,07
825
8,56
811
,823
864
12,3
9114
5,24
420
3014
389
810
9,17
04,
078
258,
693
12,0
0686
412
,526
147,7
73a O
ther
incl
udes
bow
ls, f
urni
ture
, hou
selo
gs, m
oldi
ng, s
hake
s, po
sts a
nd p
oles
, and
sidi
ng.
47
Tongass National Forest Timber Demand, Projections for 2015 to 2030
Table 21—Projected timber harvest by product type, Scenario 3
Year Sawlog exports Sawmills Utility logs Total residuea Other TotalThousand board feet, log scale
Discussion and ConclusionOver the period from 2000 to 2011, harvest of timber from the Tongass National Forest declined by nearly 70 percent. Factors contributing to the decline included changes in the structure of the Alaska forest sector, macroeconomic conditions both in the United States and overseas, markets for Alaskan products, and conditions faced by Alaska’s competitors. Taking these changes into account, our projections of the average demand for Tongass timber over the next 15 years (2015 to 2030) range from 46 to 76 million board feet. Three different scenarios display alternative futures for southeast Alaska that all incorporate the young-growth transition on the Tongass. These scenarios differ in the use of the projected harvest, in that the young-growth scenario calls for a reduction in harvest from the Tongass, the wood energy scenario focuses on demand for utility logs, and the U.S. housing scenario includes projected increased demand for sawlogs for lumber.
We encountered several challenges in completing this analysis. Foremost was the lack of published market data for Alaskan forest products. Of the two sources available, one measures only lumber production from a predetermined set of southeast Alaska mills; the other is performed only every 5 years. In many cases, the most recent data were from 2011. Disclosure and confidentiality issues abound, owing to an industry structure characterized by a small number of producers. Traditional sources of international trade data were of little use owing to the issues surrounding transshipments and the fact that trade data showed export volume to exceed what was actually harvested by a significant amount. Efforts to explain these discrepancies in Alaskan trade data are underway. Last, we hope that Tongass timber sale administrators will devise a reporting method to differentiate between young- and old-growth sales to enable tracking the progress of the young-growth transition from outside the local area.
The changes occurring in southeast Alaska represent a shift in federal forest policy that recognizes changing societal expectations about goods and services pro-vided from public lands. Whether Alaskan products will remain competitive during the young-growth transition will depend on a variety of factors. Many stakeholders expressed hope that the emergence of bioenergy markets could increase the profit-ability of operations owing to increased utilization of low-quality material, espe-cially utility-grade logs and mill residues. Interest has been focused on developing a wood pellet industry in southeast Alaska, both in terms of increasing demand for timber and generating additional forest sector employment. Although economic feasibility will depend on capital investment and product prices, producers may
We hope that Tongass timber sale administrators will devise a reporting method to differentiate between young- and old-growth sales to enable tracking the progress of the young-growth transition from outside the local area.
49
Tongass National Forest Timber Demand, Projections for 2015 to 2030
find it difficult to compete with pellet producers in British Columbia in interna-tional markets. In addition, transportation challenges make it difficult for southeast Alaska producers to ship material to other regions within Alaska itself. There also is tremendous interest in developing markets for value-added niche products. Whether demand for these products could be sufficient to sustain a timber industry in southeast Alaska will likely be the subject of debate for many years to come.
AcknowledgmentsThis study was completed with funding from the USDA Forest Service Alaska Region. The authors are grateful for the assistance of many people during the completion of this project. We thank the staff from the Alaska Region and the Tongass National Forest, including Dave Harris, Nicole Grewe, Sheila Spores, Randy Coleman, and Forrest Cole. Clarence Clark with the State of Alaska pro-vided data and contacts, and facilitated access to southeast Alaska mill owners and exporters. Buck Lindekugel, Tom Waldo, and Keith Rush provided valuable insights and materials from the southeast Alaska environmentalist community. Bob Deer-ing shared his vision for the development of wood-based energy resources. Finally, Richard Haynes, Allen Brackley, and Erik Berg were kind enough to share their perspectives from working within the southeast Alaska research community and to perform technical reviews of this manuscript. Mill-level TPO data were acquired after completing a Memorandum of Cooperation and data confidentiality plan with the Forest Inventory and Analysis group at the Pacific Northwest Research Station.
Metric EquivalentsWhen you know: Multiply by: To find:Feet (ft) 0.305 MetersSquare feet (ft2) 0.0929 Square metersAcres (ac) 0.405 HectaresCubic feet (ft3) 0.0283 Cubic metersBoard feet, logs 0.00453 Cubic meters, logsBoard feet, lumber 0.00236 Cubic meters, lumberBritish thermal units (Btus) 3,412.14 Kilowatt-hourBritish thermal units 100,000 ThermsPounds 2,400 Bone-dry units
50
GENERAL TECHNICAL REPORT PNW-GTR-934
Literature Cited Alaska Climate Research Center. 2014. Mean annual heating degree days for selected
base years 1981–2010. http://akclimate.org/Climate/Normals. (July 18, 2014).
Alexander, S.J.; Parrent, D.J. 2010. Estimating sawmill processing capacity for Tongass timber: 2007 and 2008 update. Res. Note PNW-RN-565. Portland, OR: U.S. Department of Agriculture, Forest Service, Pacific Northwest Research Station. 15 p.
Alexander, S.J.; Parrent, D.J. 2012. Estimating sawmill processing capacity for Tongass timber: 2009 and 2010 update. Res. Note PNW-RN-568. Portland, OR: U.S. Department of Agriculture, Forest Service, Pacific Northwest Research Station. 15 p.
Alaska National Interest Lands Conservation Act of 1980 [ANILCA]. Public Law No. 96-487, 94 Stat. 2371.
Beck Group. 2009. Transitioning to young growth: Prince of Wales Island, southeast Alaska. http://www.merid.org/en/TongassAdvisoryCommittee/~/media/Files/Projects/tongass/Ecological/Transitioning%20to%20Young%20Growth%20on%20POW%20BECK%20report%202009.pdf. (August 10, 2014).
Berg, E.C.; Gale, C.B.; Morgan, T.A.; Brackley, A.M.; Keegan, C.E.; Alexander, S.J.; Christensen, G.A.; McIver, C.P.; Scudder, M.G. 2014. Alaska’s timber harvest and forest products industry, 2011. Gen. Tech. Rep. PNW-GTR-903. Portland, OR: U.S. Department of Agriculture, Forest Service, Pacific Northwest Research Station. 39 p.
Brackley, A.M.; Crone, L.K. 2009. Estimating sawmill processing capacity for Tongass timber: 2005 and 2006 update. Res. Note PNW-RN-561. Portland, OR: U.S. Department of Agriculture, Forest Service, Pacific Northwest Research Station. 15 p.
Brackley, A.M.; Parrent, D.J.; Rojas, T.D. 2006a. Estimating sawmill processing capacity for Tongass timber: 2003 and 2004 update. Res. Note PNW-RN-553. Portland, OR: U.S. Department of Agriculture, Forest Service, Pacific Northwest Research Station. 15 p.
Brackley, A.M.; Rojas, T.D.; Haynes, R.W. 2006b. Timber products output and timber harvests in Alaska: projections for 2005–2025. Gen. Tech. Rep. PNW-GTR-677. Portland, OR: U.S. Department of Agriculture, Forest Service, Pacific Northwest Research Station. 33 p.
51
Tongass National Forest Timber Demand, Projections for 2015 to 2030
Briggs, D. 1994. Forest products measurements and conversion factors: with special emphasis on the U.S. Pacific Northwest. IFR Contribution No. 75. Seattle, WA: University of Washington, College of Forest Resources. 168 p.
Brooks, D.J.; Haynes, R.W. 1990. Timber products output and timber harvests in Alaska: projections for 1989–2010. Gen. Tech. Rep. PNW-GTR-261. Portland, OR: U.S. Department of Agriculture, Forest Service, Pacific Northwest Research Station. 48 p.
Brooks, D.J.; Haynes, R.W. 1994. Timber products output and timber harvests in Alaska: projections for 1992–2010. Gen. Tech. Rep. PNW-GTR-334. Portland, OR: U.S. Department of Agriculture, Forest Service, Pacific Northwest Research Station. 48 p.
Brooks, D.J.; Haynes, R.W. 1997. Timber products output and timber harvests in Alaska: projections for 1997–2010. Gen. Tech. Rep. PNW-GTR-409. Portland, OR: U.S. Department of Agriculture, Forest Service, Pacific Northwest Research Station. 17 p.
Daniels, J.M.; Paruszkiewicz, M.D. 2016. Estimates of wood energy demand for residential use in Alaska: an update. Gen. Tech. Rep. PNW-GTR-928. Portland OR: U.S. Department of Agriculture, Forest Service, Pacific Northwest Research Station. 32 p.
Deering, R. 2014. Local biomass pellets provide heat and jobs. Ketchikan, AK: U.S. Department of Agriculture, Forest Service, Tongass National Forest. http://www.fs.usda.gov/detail/tongass/news-events/?cid=STELPRD3792905. (January 14, 2015).
Food and Agriculture Organization of the United Nations Statistics Division [FAOSTAT]. 2014. http://faostat3.fao.org/home/E. (November 14, 2014)
Halbrook, J.M.; Morgan, T.A.; Brandt, J.P.; Keegan, C.E., III; Dillon, T.; Barrett, T.M. 2009. Alaska’s timber harvest and forest products industry, 2005. Gen. Tech. Rep. PNW-GTR-787. Portland, OR: U.S. Department of Agriculture, Forest Service, Pacific Northwest Research Station. 30 p.
Harris, D.P. 2015. Personal communication. Director of Forest Management, Alaska Region, USDA Forest Service, P.O. Box 21628, Juneau, AK 99802-1628.
Keegan, C.E., III; Morgan, T.A.; Blatner, K.A.; Daniels J.M. 2011. Trends in lumber processing in the western United States. Part II: Overrun and lumber recovery factors. Forest Products Journal. 60( 2): 140–143.
52
GENERAL TECHNICAL REPORT PNW-GTR-934
Keegan, C.E., III; Sorenson, C.B.; Morgan, T.A.; Hayes, S.W.; Daniels J.M. 2012. Impact of the Great Recession and housing collapse on the forest products industry in the western United States. Forest Products Journal. 61(8): 5–9.
Kilborn, K.A.; Parrent, D.J.; Housley, R.D. 2004. Estimating sawmill processing capacity for Tongass timber. Res. Note PNW-RN-545. Portland, OR: U.S. Department of Agriculture, Forest Service, Pacific Northwest Research Station. 12 p.
Meridian Institute. 2015. Background materials. http://www.merid.org/en/TongassAdvisoryCommittee/Background_Materials.aspx. (January 13, 2015).
Parrent, D.; Grewe, N. 2014. Tongass National Forest: 2013 sawmill capacity and production report. 9 p. Unpublished report. On file with: U.S. Department of Agriculture, Forest Service, Alaska Region, P.O. Box 21628, Juneau, AK 99802-1628.
National Forest Management Act of 1976 [NFMA]; Act of October 22, 1976; 16 U.S.C. 1600.
Spores, S.R. 2015. Personal communication. Forest silviculturist, Tongass National Forest, 648 Mission Street, Ketchikan, AK 99901.
Tongass Timber Reform Act of 1990 [TTRA]; Public Law No. 101-626, 104 Stat. 4426.
U.S. Department of Agriculture [USDA]. 2013. Secretary’s memorandum 1044-009: addressing sustainable forestry in southeast Alaska. http://www.ocio.usda.gov/document/secretarys-memorandum-1044-009. (October 14, 2014).
U.S. Department of Agriculture, Forest Service [USDA FS]. 2010. Alaska Mental Health Trust Authority Land Exchange. Issue paper, July 2010. Juneau, AK: Alaska Region. http://www.fs.usda.gov/Internet/FSE_DOCUMENTS/stelprdb5252637.pdf. (October 14, 2014).
U.S. Department of Agriculture, Forest Service [USDA FS]. 2014. Forest management reports and accomplishments: log exports and interstate shipments. Juneau, AK: Alaska Region. http://www.fs.usda.gov/detail/r10/landmanagement/ resourcemanagement/?cid=fsbdev2_038785. (September 8, 2014).
U.S. Department of Agriculture, Forest Service [USDA FS]. 2015. Briefing papers 2015. Juneau, AK: Alaska Region. http://www.fs.usda.gov/detail/r10/ news-events/?cid=stelprdb5299987. (October 27, 2015).
53
Tongass National Forest Timber Demand, Projections for 2015 to 2030
U.S. Department of Commerce, Census Bureau [USDC CB]. 2014a. Selected housing characteristics—2011 American community survey 1-year estimates. http://factfinder.census.gov/faces/tableservices/jsf/pages/productview.xhtml?src=bkmk. (December 20, 2014).
U.S. Department of Commerce, Census Bureau [USDC CB]. 2014b. 2013 County business patterns. http://censtats.census.gov/cgi-bin/cbpnaic/cbpsect.pl. (December 20, 2014).
U.S. Department of Energy, Energy Information Administration (USDE EIA). 2014. Alaska—Consumption, price and expenditure estimates—State Energy Demand System (SEDS). http://www.eia.gov/state/seds/. (October 13, 2014).
U.S. International Trade Commission [USITC]. 2014. USITC interactive tariff and trade dataweb [Database]. Version 3.1.0. http://dataweb.usitc.gov/scripts/user_set.asp. (October 5, 2014).
Waldo, T. 2014. Personal communication. History of Tongass timber demand projects and harvest. On file with: Earthjustice, Alaska Regional Office, 325 Fourth Street, Juneau, AK 99801.
Warren, D. 2005–2011. Production, prices employment, and trade in Northwest forest industries. Res. Bull. PNW-RB-261. Portland, OR: U.S. Department of Agriculture, Forest Service, Pacific Northwest Research Station. 148 p.
Western Wood Products Association [WWPA]. 2015. Western lumber grades and quality control. http://www.wwpa.org/TECHGUIDE/Grades/tabid/849/Default.aspx. (March 18, 2015).
Wisertrade. 2013. World Institute for Strategic Economic Research. http://www.wisertrade.org/home/portal/index.jsp. (October2, 2014).
Zhou, X. 2013. Production, prices employment, and trade in Northwest forest industries. Res. Bull. PNW-RB-261. Portland, OR: U.S. Department of Agriculture, Forest Service, Pacific Northwest Research Station. 148 p.
Pacific Northwest Research Station
Website http://www.fs.fed.us/pnw/Telephone (503) 808–2592Publication requests (503) 808–2138FAX (503) 808–2130E-mail [email protected] address Publications Distribution Pacific Northwest Research Station P.O. Box 3890 Portland, OR 97208–3890
U.S. Department of Agriculture Pacific Northwest Research Station 1220 SW 3rd Ave. P.O. Box 3890 Portland, OR 97208–3890