24
Committee for the Common Organisation of the Agricultural Market Market Situation for Sheep & Goat Meats 17 September 2020

Committee for the Common Organisation of theAgricultural Market
Market Situation for Sheep & Goat Meats17 September 2020

Production
DG AGRI G3 SHEEP & GOAT 17 September 2020

DG AGRI G3 SHEEP & GOAT 17 September 2020
P R O D U C T I O N
56
.7
48
.5
42
.4
30
.7
26
.9
17
.0
12
.4
7.9
7.7
3.8
3.5 7
.9
12
7.9
-5.6% -3.4% -0.8%
2.4%
-7.6% -5.6% -9.7% -9.1%
18.9%
-41.3%
-6.3%-14.5%
-10.3%
- 140%
- 120%
- 100%
- 80%
- 60%
- 40%
- 20%
+ 0%
+ 20%
+ 40%
0
20
40
60
80
100
120
140
160
180
200
ES RO FR IE EL DE IT PT NL BG AT Others UK
Ch
ange
(%
)
In '0
00
to
nn
es
ca
rca
se w
eig
ht
Sheep slaughtering for EU+UK
2020/2019 (up to June)
Tonnes 2020 Change 2020/2019
EU - 4.7%
Estimated data for EL in June 2020

DG AGRI G3 SHEEP & GOAT 17 September 2020
P R O D U C T I O N
10
.94
6.5
3
4.9
8
3.7
8
1.8
6
0.9
2
0.7
5
0.5
5
0.5
2
0.3
6
0.4
6
0.2
1
-20.7%
0.8%
-3.9% -4.3%
20.8%
-18.6% -22.7%
-61.4%
-17.5% -20.0%
43.2%31.3%
- 140%
- 120%
- 100%
- 80%
- 60%
- 40%
- 20%
+ 0%
+ 20%
+ 40%
+ 60%
0
5
10
15
20
EL RO ES FR NL CY IT BG PT AT Others UK
Ch
an
ge
(%
)
In '0
00
to
nn
es
ca
rca
se w
eig
ht
Goat slaughtering for EU+UK
2020/2019 (up to June)
Tonnes 2020 Change 2020/2019
EU - 11.8%
Estimated data for EL in June 2020

Prices
DG AGRI G3 SHEEP & GOAT 17 September 2020

DG AGRI G3 SHEEP & GOAT 17 September 2020
S H E E P P R I C E S EU E V O L U T I O N
450
500
550
600
650
2018 2019 2020
€u
ro /
100kg
/CW
Evolution of EU lamb prices
Heavy lamb
EU
Light lamb
EU

DG AGRI G3 SHEEP & GOAT 17 September 2020
S H E E P P R I C E S EU E V O L U T I O N
Brexit
400
450
500
550
600
650
2018 2019 2020
€u
ro /
100kg
/CW
Evolution of EU average heavy lamb prices
Heavy lamb
EU
Heavy lamb
EU+UK

DG AGRI G3 SHEEP & GOAT 17 September 2020
S H E E P P R I C E S EU E V O L U T I O N
100
200
300
400
500
600
700
800
BE DE EE ES FR HR IE IT CY LV LT HU NL AT PL PT RO SI FI SE NI GB
€/10
0 kg
cwHeavy lamb prices
week 36
2019 2020

DG AGRI G3 SHEEP & GOAT 17 September 2020
S H E E P P R I C E S EU E V O L U T I O N
400
450
500
550
600
650
2017 2018 2019 2020
€u
ro /
100kg
/CW
Evolution of EU average light lamb prices
Light lamb
EU

DG AGRI G3 SHEEP & GOAT 17 September 2020
S H E E P P R I C E S EU E V O L U T I O N
150
250
350
450
550
650
750
BG EL ES HR IT LV HU PT SI
€/10
0 kg
cw
Light lamb prices
week 36
2019 2020

DG AGRI G3 SHEEP & GOAT 17 September 2020
W O R L D
M A R K E T
SHEEP PRICES
NI, GB, NZ, AUS, UY
250
350
450
550
650
750
Jan
18
Feb
18
Mar
18
Ap
r 1
8
May
18
Jun
18
Jul 1
8
Au
g 1
8
Sep
18
Oct
18
No
v 1
8
De
c 18
Jan
19
Feb
19
Mar
19
Ap
r 1
9
May
19
Jun
19
Jul 1
9
Au
g 1
9
Sep
19
Oct
19
No
v 1
9
De
c 19
Jan
20
Feb
20
Mar
20
Ap
r 2
0
May
20
Jun
20
Jul 2
0
Au
g 2
0
Sep
20
Oct
20
No
v 2
0
De
c 20
€/10
0 kg
car
cass
we
igh
t
World Market Prices(Lamb carcasses)
NI GB New Zealand
(Y-Lamb:
North + South Island)
Australia
(Trade lamb)
Uruguay
(INAC prices)
€/100 kg

Trade
DG AGRI G3 SHEEP & GOAT 17 September 2020

EU imports of sheep & goatmeat and live animalsTrade figures (COMEXT)
DG AGRI G3 SHEEP & GOAT 17 September 2020
T R A D EI M P O R TS
61 42548 968
40 497
39 403
47 552
37 632
111 122 104 986
84 715
0
20 000
40 000
60 000
80 000
100 000
120 000
Jan-Jul 18 Jan-Jul 19 Jan-Jul 20
InTonnes
cwe
EU IMPORTS of Sheep & Goat (Tonnes cwe)
New Zealand United Kingdom Australia
North Macedonia Argentina Other origins
437
339287
221
250
217
717
634
541
0
100
200
300
400
500
600
700
800
Jan-Jul 18 Jan-Jul 19 Jan-Jul 20
in Millions
EUR
EU IMPORTS of Sheep & Goat (Millions EUR)
New Zealand United Kingdom Australia
North Macedonia Argentina Other origins

EU imports of sheep & goatmeat and live animalsTrade figures (COMEXT)
DG AGRI G3 SHEEP & GOAT 17 September 2020
T R A D EI M P O R TS
2016 2017 Compared
tonnes % tonnes % tonnes % tonnes % tonnes % to Jan-Jul 19
New Zealand 90 949 51.3% 81 553 46.5% 84 222 47.2% 68 947 41.0% 40 497 47.8% - 17.3%
United Kingdom up to Jun 20 74 515 42.0% 80 775 46.1% 78 997 44.3% 87 246 51.8% 37 632 44.4% #N/A
Australia 4 525 2.6% 5 514 3.1% 7 535 4.2% 5 986 3.6% 2 891 3.4% - 24.0%
North Macedonia 2 135 1.2% 2 003 1.1% 1 770 1.0% 1 683 1.0% 1 451 1.7% - 10.6%
Argentina 939 0.5% 630 0.4% 1 297 0.7% 1 448 0.9% 1 033 1.2% - 7.2%
Uruguay 1 322 0.7% 1 545 0.9% 656 0.4% 444 0.3% 328 0.4% - 25.2%
Norway 7 0.0% 393 0.2% 598 0.3% 197 0.1% 200 0.2% + 34.9%
Other Origins 689 0.4% 1 205 0.7% 1 291 0.7% 1 070 0.6% 104 0.1%
Total from Third Countries 177 351 175 352 178 348 168 319 84 715
% change - 1% + 2% - 6% - 19.3%
Total (without UK) 102 836 94 576 99 351 81 073 47 083
% change - 8% + 5% - 18% - 18.0%
2018 Jan-Jul 202019

DG AGRI G3 SHEEP & GOAT 17 September 2020
T R A D EE X P O R TS
0
2 000
4 000
6 000
8 000
10 000
12 000
Jun-19 Jul-19 Aug-19 Sep-19 Oct-19 Nov-19 Dec-19 Jan-20 Feb-20 Mar-20 Apr-20 May-20 Jun-20 Jul-20
ton
ne
s c
we
Evolution of NZ exports of sheep meat to the EU)
Netherlands Germany Belgium France Others
Source: Eurostat

Evolution NZ Exports of sheep meat products to EU(in tonnes cw)
DG AGRI G3 SHEEP & GOAT 17 September 2020
T R A D E
0
500
1 000
1 500
2 000
2 500
3 000
3 500
4 000
Jun
-19
Jul-
19
Au
g-1
9
Sep
-19
Oct
-19
No
v-1
9
Dec
-19
Jan
-20
Feb
-20
Mar
-20
Ap
r-2
0
May
-20
Jun
-20
Jul-
20
Sheep legs
Fresh or chilled legs Frozen legs
0
1 000
2 000
3 000
4 000
5 000
6 000
7 000
8 000
Jun
-19
Jul-
19
Au
g-19
Sep
-19
Oct
-19
No
v-19
Dec
-19
Jan-
20
Feb
-20
Mar
-20
Ap
r-20
May
-20
Jun
-20
Jul-
20
Other meat products
Other frozen cuts Other fresh/chilled cuts
Frozen carcases Fresh Carcases

DG AGRI G3 SHEEP & GOAT 17 September 2020
T R A D E
0
200
400
600
800
1 000
1 200
Jun-19 Jul-19 Aug-19 Sep-19 Oct-19 Nov-19 Dec-19 Jan-20 Feb-20 Mar-20 Apr-20 May-20 Jun-20 Jul-20
ton
ne
s c
we
Evolution of AUS exports of sheep meat to the EU
Netherlands France Germany Belgium OthersSource: Eurostat

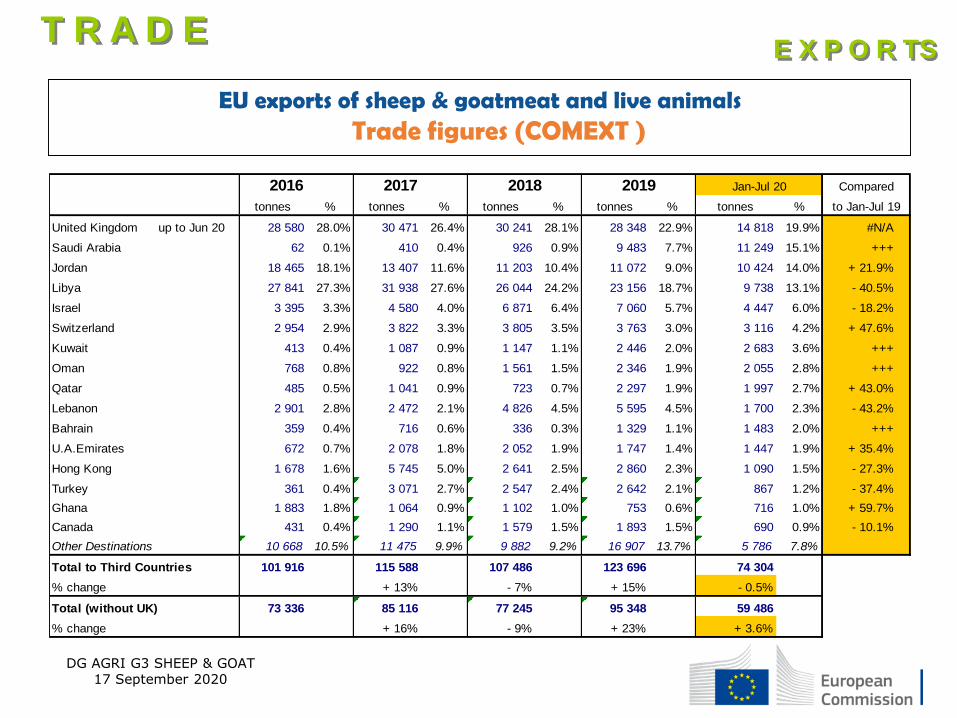
EU exports of sheep & goatmeat and live animalsTrade figures (COMEXT )
DG AGRI G3 SHEEP & GOAT 17 September 2020
T R A D EE X P O R TS
17 436 17 272 14 818
498 2 20511 249
8 551
10 424
4 6745 437 4 447
18 133
24 845 23 627
63 254
74 688 74 304
0
10 000
20 000
30 000
40 000
50 000
60 000
70 000
80 000
Jan-Jul 18 Jan-Jul 19 Jan-Jul 20
Tonnes c
w
EU EXPORTS of Sheep & Goat (Tonnes cwe)
United Kingdom Saudi Arabia Jordan Libya Israel Other destinations
55 55 53
2 10
7044 45
6976
89
65
36
42
3582
112
102294
354
394
0
50
100
150
200
250
300
350
400
450
Jan-Jul 18 Jan-Jul 19 Jan-Jul 20
Millio
ns EU
R
EU EXPORTS of Sheep & Goat (Millions EUR)
United Kingdom Saudi Arabia Jordan Libya Israel Other destinations
EU exports of sheep & goatmeat and live animalsTrade figures (COMEXT )
DG AGRI G3 SHEEP & GOAT 17 September 2020
T R A D EE X P O R TS
2016 2017 Compared
tonnes % tonnes % tonnes % tonnes % tonnes % to Jan-Jul 19
United Kingdom up to Jun 20 28 580 28.0% 30 471 26.4% 30 241 28.1% 28 348 22.9% 14 818 19.9% #N/A
Saudi Arabia 62 0.1% 410 0.4% 926 0.9% 9 483 7.7% 11 249 15.1% +++
Jordan 18 465 18.1% 13 407 11.6% 11 203 10.4% 11 072 9.0% 10 424 14.0% + 21.9%
Libya 27 841 27.3% 31 938 27.6% 26 044 24.2% 23 156 18.7% 9 738 13.1% - 40.5%
Israel 3 395 3.3% 4 580 4.0% 6 871 6.4% 7 060 5.7% 4 447 6.0% - 18.2%
Switzerland 2 954 2.9% 3 822 3.3% 3 805 3.5% 3 763 3.0% 3 116 4.2% + 47.6%
Kuwait 413 0.4% 1 087 0.9% 1 147 1.1% 2 446 2.0% 2 683 3.6% +++
Oman 768 0.8% 922 0.8% 1 561 1.5% 2 346 1.9% 2 055 2.8% +++
Qatar 485 0.5% 1 041 0.9% 723 0.7% 2 297 1.9% 1 997 2.7% + 43.0%
Lebanon 2 901 2.8% 2 472 2.1% 4 826 4.5% 5 595 4.5% 1 700 2.3% - 43.2%
Bahrain 359 0.4% 716 0.6% 336 0.3% 1 329 1.1% 1 483 2.0% +++
U.A.Emirates 672 0.7% 2 078 1.8% 2 052 1.9% 1 747 1.4% 1 447 1.9% + 35.4%
Hong Kong 1 678 1.6% 5 745 5.0% 2 641 2.5% 2 860 2.3% 1 090 1.5% - 27.3%
Turkey 361 0.4% 3 071 2.7% 2 547 2.4% 2 642 2.1% 867 1.2% - 37.4%
Ghana 1 883 1.8% 1 064 0.9% 1 102 1.0% 753 0.6% 716 1.0% + 59.7%
Canada 431 0.4% 1 290 1.1% 1 579 1.5% 1 893 1.5% 690 0.9% - 10.1%
Other Destinations 10 668 10.5% 11 475 9.9% 9 882 9.2% 16 907 13.7% 5 786 7.8%
Total to Third Countries 101 916 115 588 107 486 123 696 74 304
% change + 13% - 7% + 15% - 0.5%
Total (without UK) 73 336 85 116 77 245 95 348 59 486
% change + 16% - 9% + 23% + 3.6%
2018 Jan-Jul 202019

DG AGRI G3 SHEEP & GOAT 17 September 2020
T R A D EE X P O R TS
1889
1767
1428
1494 19
28
1207
1114
85
859
954
889
1 11
0
815
879
0
500
1000
1500
2000
2500
3000
3500
2015 2016 2017 2018 2019 Jan-Jul 19 Jan-Jul 20
(Qty
in 1
000
head
s)
Evolution EU exports of live sheep(Excluding pure-bred breeding)
Live Adults Live Lambs

DG AGRI G3 SHEEP & GOAT 17 September 2020
T R A D E
726 14
5292
411
1739
5438
0028
9161
1010
96 2048
1390 1551 1775
1198 18
6233
3748
8531
2016
0384
3090
6 1560
1652
731 12
6735
2 641 94
030
0025
4944
4165
6842
321
0413
94 2022
901 20
7413
9828
2920
3110
6360
7999
312
1613
0312
67 1971
463 99
156
0 1599
1150 15
3434
39641
1 754
2 727
2 209
1 398
1 571
1 468
2 287
2 932
363
953
3 085
2 471
2 146
1 061
1 534
2 151
1 958
1 722
819
609
1 334
2 114
1 702
1 990
1 113
478
1 352 64
298
32 2
391 2
882 2
381 2
31
659
846 86
1
551
500 51
0
639
1 020
802
680
616
832
930
1 267
564
730
805
743
875
4 200
1 423
962
687
2 058
2 512
1 692
1 066
1 306
496
851
655
556 808 632
494
747
544
908 54
1
511
606
511
1 583
2 037
629
507
1 511
632
535
562
0
2 000
4 000
6 000
8 000
10 000
12 000
14 000
2016
0120
1602
2016
0320
1604
2016
0520
1606
2016
0720
1608
2016
0920
1610
2016
1120
1612
2017
0120
1702
2017
0320
1704
2017
0520
1706
2017
0720
1708
2017
0920
1710
2017
1120
1712
2018
0120
1802
2018
0320
1804
2018
0520
1806
2018
0720
1808
2018
0920
1810
2018
1120
1812
2019
0120
1902
2019
0320
1904
2019
0520
1906
2019
0720
1908
2019
0920
1910
2019
1120
1912
2020
0120
2002
2020
0320
2004
2020
0520
2006
2020
07
2016 2017 2018 2019 2020
Tonn
es C
WE
EU Exports of LIVE Sheep Animals(Source COMEXT - Tonnes cwe)
Libya Jordan Israel Saudi Arabia Lebanon Others

DG AGRI G3 SHEEP & GOAT 17 September 2020
Chin
a +
H. K
ong
Chin
a +
H. K
ong
Unite
d St
ates
Unite
d St
ates
EU
EU
UK UK
Mal
aysi
a (up
to M
ay)
Mal
aysi
a (up
to M
ay)
0
50
100
150
200
250
300
2019 (up to July). 2020 (up to July).
Qty
in 1
000
Tonn
es p
w
Main Importers of SHEEP&GOAT Products (up to July).
Source : GTA Excl. Live animals
W O R L D
M A R K E T

DG AGRI G3 SHEEP & GOAT 17 September 2020
W O R L D
M A R K E T
New
Zea
land
New
Zea
landAu
stra
lia
Aust
ralia
UK UK
EU EU
Unite
d St
ates
Unite
d St
ates
Paki
stan
(up
to Ju
n)
Paki
stan
(up
to Ju
n)
0
50
100
150
200
250
300
350
2019 (up to July). 2020 (up to July).
Qty
in 1
000
Tonn
es p
w
Main Exporters of SHEEP&GOAT Products (up to July).
Source : GTA Excl. Live animals

Follow market updates via the Dashboard
http://ec.europa.eu/agriculture/dashboards/index_en.htm
EUROPA SITE DASHBOARD
DG AGRI G3 SHEEP & GOAT 17 September 2020


