28
10-1 Department of Computer Science and Engineering 10 Toolkit-based Visualization Toolkit-based Visualization

10-1Department of Computer Science and Engineering
10 Toolkit-based Visualization
Toolkit-based Visualization

10-2Department of Computer Science and Engineering
10 Toolkit-based Visualization
Introduction
VTK is obviously only one of the many toolkits and
libraries that can be used for visualizing data and
information.
Most of these toolkits are java-based, even though many
are nowadays JavaScipt/web-based (see next chapter).
The next slides will provide an overview of some of these
toolkits.
An extensive list can be found on the InfoViw Wiki:
http://www.infovis-wiki.net/index.php?title=Toolkit_Links

10-3Department of Computer Science and Engineering
10 Toolkit-based Visualization
ParaView
ParaView is a VTK-based software package that makes
using VTK easier in that it does not involve programming.
The user can select objects from the menu to build the
visualization pipeline interactively and make changes to
the settings of those filters.
ParaView is designed to run in parallel which is where
many of the parallel features in VTK’s design come from.

10-4Department of Computer Science and Engineering
10 Toolkit-based Visualization
VisIt
Similar to ParaView, VisIt is another open source
visualization tool. It is designed to be scalable to support
large-scale data sets and is also based on VTK.
It utilizes a client-server model, where the server is
parallelized. This design enables the capability to run the
server on a supercomputer with the client displaying he
results.

10-5Department of Computer Science and Engineering
10 Toolkit-based Visualization
Inviwo
Inviwo is a relatively new software package that provides
yet another user interface to VTK in which the user can
drag and drop filters and make connections among them
to define the visualization pipeline.

10-6Department of Computer Science and Engineering
10 Toolkit-based Visualization
Inviwo
Molecular visualization functionality implemented inside
an Inviwo module. Various operations are performed
inside processors and the result from each processor
flows between connected ports in an top-down topology
structure.
10-7Department of Computer Science and Engineering
10 Toolkit-based Visualization
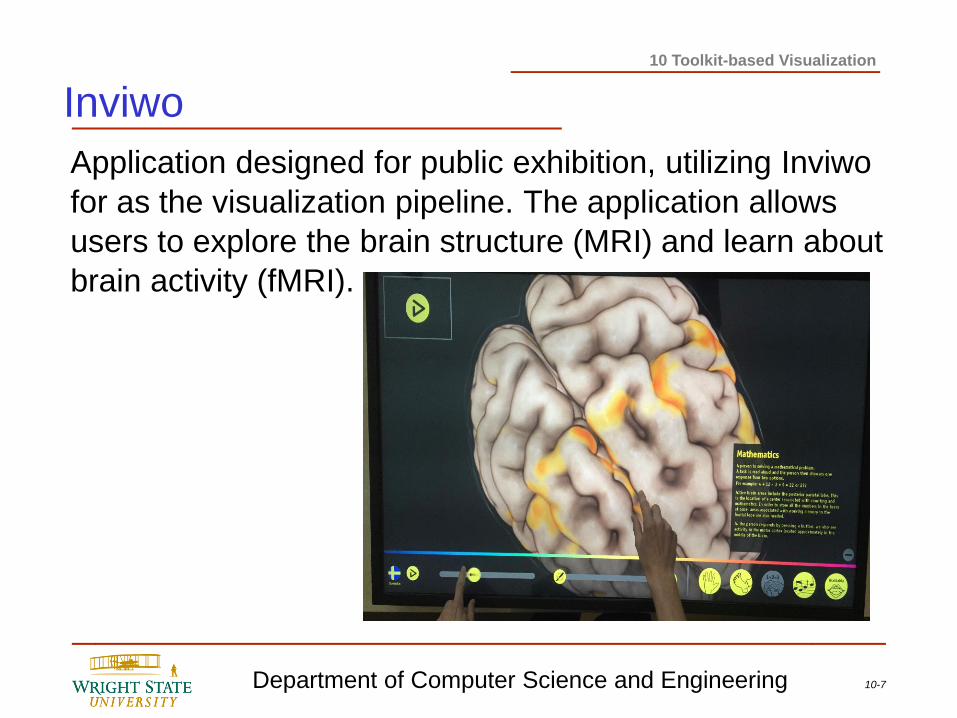
Inviwo
Application designed for public exhibition, utilizing Inviwo
for as the visualization pipeline. The application allows
users to explore the brain structure (MRI) and learn about
brain activity (fMRI).

10-8Department of Computer Science and Engineering
10 Toolkit-based Visualization
the prefuse toolkit
a java user interface toolkit for constructing
interactive information visualization applications
supports visualization, animation, and interaction
• application building by stringing
together fine-grained, reusable
components
• layers of indirection between
source data, visualized data,
and rendering

10-9Department of Computer Science and Engineering
10 Toolkit-based Visualization
system architecture

10-10Department of Computer Science and Engineering
10 Toolkit-based Visualization
toolkit features
Data structures and I/O libraries
Multiple visualizations, multiple views
Application design through composable modules
A library of provided layout and distortion techniques
Animation and time-based processing
Graphics transforms, including panning and zooming
A full force simulator for physics-based interfaces
Interactor components for common interactions
Integrated color maps and search functionality
Event logging to support visualization evaluation

10-11Department of Computer Science and Engineering
10 Toolkit-based Visualization
prefuse
Interactive demos, videos, and research papers available
at:
http://prefuse.sourceforge.net
http://github.com/prefuse/Prefuse

10-12Department of Computer Science and Engineering
10 Toolkit-based Visualization
InfoVis Toolkit (ivtk)
The InfoVis Toolkit is an Interactive Graphics Toolkit written in Java
to ease the development of Information Visualization applications and
components.
The main characteristics of the InfoVis Toolkit are:
Unified data structure: The base data structure is a table of
columns. Columns contain objects of homogeneous types, such as
integers or strings. Trees and Graphs are derived from Tables.
Small memory footprint: Using homogeneous columns instead of
compound types improves dramatically the memory required to store
large tables, trees or graphs, and generally the time to manage them.

10-13Department of Computer Science and Engineering
10 Toolkit-based Visualization
InfoVis Toolkit (ivtk)
Unified set of interactive components: Interactive filtering (a.k.a.
dynamic queries) can be performed with the same control objects
and components regardless of the data structure, simplifying the
reuse of existing components and the design of generic ones.
Fast: The InfoVis Toolkit can use accelerated graphics provided by
Agile2D, an implementations of Java2D based on the OpenGL API
for hardware accelerated graphics. On machine with hardware
acceleration, some visualizations redisplay 100 times faster than with
the standard Java2D implementation.
Extensible: The InfoVis Toolkit is meant to incorporate new
information visualization techniques and is distributed with the full
sources and with a very liberal license. It could be a base for student
projects, research projects or commercial products.

10-14Department of Computer Science and Engineering
10 Toolkit-based Visualization
InfoVis Toolkit (ivtk)
The InfoVis Toolkit, as of version 0.9, implements nine (9) types of
visualization: Scatter Plots, Time Series, Parallel Coordinates and
Matrices for tables; Node-Link diagrams, Icicle trees and Treemaps
for trees; Adjacency Matrices and Node-Link diagrams for graphs.
Node-Link visualizations provides several variants (8 for graphs and
4 for trees).

10-15Department of Computer Science and Engineering
10 Toolkit-based Visualization
Tulip
Tulip is an information visualization framework dedicated to the
analysis and visualization of relational data. Tulip aims to provide the
developer with a complete library, supporting the design of interactive
information visualization applications for relational data that can be
tailored to the problems he or she is addressing.
Written in C++ the framework enables the development of algorithms,
visual encodings, interaction techniques, data models, and domain-
specific visualizations. One of the goal of Tulip is to facilitates the
reuse of components and allows the developers to focus on
programming their application. This development pipeline makes the
framework efficient for research prototyping as well as the
development of end-user applications.

10-16Department of Computer Science and Engineering
10 Toolkit-based Visualization
Tulip
Social Power Chart of Chinese Provinces

10-17Department of Computer Science and Engineering
10 Toolkit-based Visualization
Tulip
World Air Traffic Maps 1990
10-18Department of Computer Science and Engineering
10 Toolkit-based Visualization
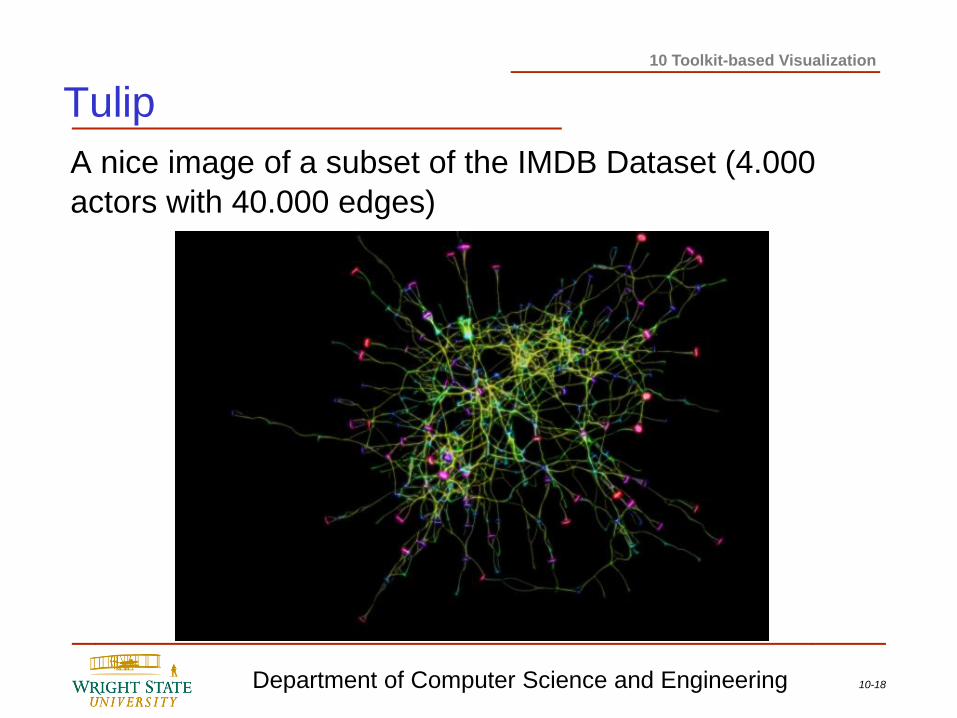
Tulip
A nice image of a subset of the IMDB Dataset (4.000
actors with 40.000 edges)

10-19Department of Computer Science and Engineering
10 Toolkit-based Visualization
GraphViz
The Graphviz layout programs take
descriptions of graphs in a simple text
language, and make diagrams in
useful formats, such as images and
SVG for web pages; PDF or
Postscript for inclusion in other
documents; or display in an interactive
graph browser. Graphviz has many
useful features for concrete diagrams,
such as options for colors, fonts,
tabular node layouts, line styles,
hyperlinks, and custom shapes.

10-20Department of Computer Science and Engineering
10 Toolkit-based Visualization
Walrus - Graph Visualization ToolWalrus is a tool for interactively visualizing large directed graphs in three-
dimensional space. It is technically possible to display graphs containing a
million nodes or more, but visual clutter, occlusion, and other factors can
diminish the effectiveness of Walrus as the number of nodes, or the degree
of their connectivity, increases. Thus, in practice, Walrus is best suited to
visualizing moderately sized graphs that are nearly trees. A graph with a few
hundred thousand nodes and only a slightly greater number of links is likely
to be comfortable to work with.
Walrus computes its layout based on a user-supplied spanning tree.
Because the specifics of the supplied spanning tree greatly affect the
resulting display, it is crucial that the user supply a spanning tree that is both
meaningful for the underlying data and appropriate for the desired insight.
The prominence and orderliness that Walrus gives to the links in the
spanning tree, in contrast to all other links, means that an arbitrarily chosen
spanning tree may create a misleading or ineffective visualization. Ideally,
the input graphs should be inherently hierarchical.

10-21Department of Computer Science and Engineering
10 Toolkit-based Visualization
Walrus - Graph Visualization ToolWalrus uses 3D hyperbolic geometry to display graphs under a fisheye-like
distortion. At any moment, the amount of magnification, and thus the level of
visible detail, varies across the display. This allows the user to examine the
fine details of a small area while always having a view of the whole graph
available as a frame of reference. Graphs are rendered inside a sphere that
contains the Euclidean projection of 3D hyperbolic space. Points within the
sphere are magnified according to their radial distance from the center.
Objects near the center are magnified, while those near the boundary are
shrunk. The amount of magnification decreases continuously and at an
accelerated rate from the center to the boundary, until objects are reduced to
zero size at the latter, which represents infinity. By bringing different parts of
a graph to the magnified central region, the user can examine every part of
the graph in detail.

10-22Department of Computer Science and Engineering
10 Toolkit-based Visualization
Walrus - Graph Visualization Tool3D hyperbolic browser

10-23Department of Computer Science and Engineering
10 Toolkit-based Visualization
GephiGephi is a visualization and exploration software for all
kinds of graphs and networks. Gephi is open-source and
free.
Exploratory Data Analysis: intuition-oriented analysis by
networks manipulations in real time.
Link Analysis: revealing the underlying structures of
associations between objects.
Social Network Analysis: easy creation of social data
connectors to map community organizations and small-
world networks.
Biological Network analysis: representing patterns of
biological data.

10-24Department of Computer Science and Engineering
10 Toolkit-based Visualization
Gephi
Gephi is a tool for data analysts and scientists keen to
explore and understand graphs. Like Photoshop™ but for
graph data, the user interacts with the representation,
manipulate the structures, shapes and colors to reveal
hidden patterns. The goal is to help data analysts to
make hypothesis, intuitively discover patterns, isolate
structure singularities or faults during data sourcing. It is a
complementary tool to traditional statistics, as visual
thinking with interactive interfaces is now recognized to
facilitate reasoning. This is a software for Exploratory
Data Analysis, a paradigm appeared in the Visual
Analytics field of research.

10-25Department of Computer Science and Engineering
10 Toolkit-based Visualization
Gephi
Gephi requires no programming to achieve results like
shown below.

10-26Department of Computer Science and Engineering
10 Toolkit-based Visualization
Cytoscape
Cytoscape is an open source software platform for
visualizing molecular interaction networks and biological
pathways and integrating these networks with
annotations, gene expression profiles and other state
data. Although Cytoscape was originally designed for
biological research, now it is a general platform for
complex network analysis and visualization. Cytoscape
core distribution provides a basic set of features for data
integration, analysis, and visualization.

10-27Department of Computer Science and Engineering
10 Toolkit-based Visualization
Cytoscape
Examples

10-28Department of Computer Science and Engineering
10 Toolkit-based Visualization
Community Board secvis.org
There is even an entire community devoted to security
visualization and the visual analytics challenges resulting
from it:
http://secviz.org/
There you can find further tutorials, courses, and
examples for security visualization, most of which are
based on toolkits and techniques we discussed in class.


