IIT, Powai, Mumbai, 16 Dec. 2008 Wind Energy Forecasting Tools and Techniques by RAJENDRA V KHARUL Sr. Fellow and Head, Centre for wind power World Institute of Sustainable Energy, Pune, 41006 [email protected]
Transcript
IIT, Powai, Mumbai, 16 Dec. 2008
Wind Energy Forecasting
Tools and Techniques
by
RAJENDRA V KHARUL
Sr. Fellow and Head, Centre for wind power
World Institute of Sustainable Energy, Pune, 41006
� Performance requirements for a forecasting - need of both the grid operator and the wind energy generators
� Wind energy generators - the priority is to minimize the deviation between forecasted and actual plant output
� First priority: To anticipate changes in wind production as accurately as possible in very short time (up to few hours ahead)
� To enable the Load Dispatch Centers (LDCs) to manage the grid operations in an optimal fashion
� Second priority :To forecast the wind generation for the next day - to enable the LDCs to schedule the reserve capacity as efficiently as possible
� Practiced in Denmark, Germany, Spain, U.K. and U.S.A.
IIT, Powai, Mumbai, 16 Dec. 200810
Time Scale of Forecasting
� Very short-term ( 0-6 hrs) is related to the prediction of small scale atmospheric features in the vicinity of wind farm
� Short-term (6-72 hrs) is related to the prediction of regional atmospheric features
� Medium range (3-10 days) is related to the prediction of continental, hemispheric and global systems
� Today the number of tools are available internationally for wind power forecasting considering these time scales
� Most of the existing power prediction systems are based on the results of numerical weather prediction (NWP) systems
� There are two approaches to transform the wind prediction given by NWP into a power prediction namely- statistical and physical
IIT, Powai, Mumbai, 16 Dec. 200811
Basic System of Forecasting
IIT, Powai, Mumbai, 16 Dec. 200812
Basic System of Forecasting…(2)
IIT, Powai, Mumbai, 16 Dec. 200813
Basic System of Forecasting…(3)
IIT, Powai, Mumbai, 16 Dec. 200814
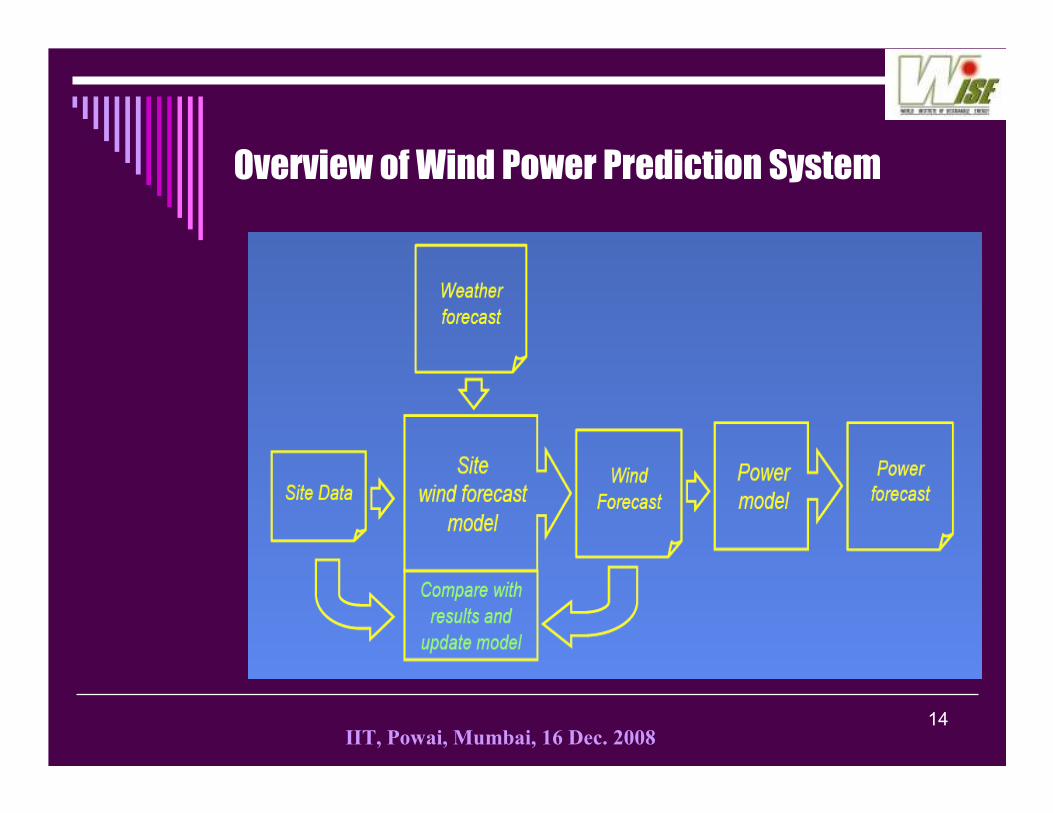
Overview of Wind Power Prediction System
IIT, Powai, Mumbai, 16 Dec. 200815
Basic Elements of Forecasting
� Numerical Weather Prediction system (NWP):
As input for wind power predictions
- Statistical systems
- Physical systems
� Site Topography
� SCADA
IIT, Powai, Mumbai, 16 Dec. 200816
Numerical Weather Prediction (NWP)
� Most of the existing power prediction systems are based on the results of NWP
� Extrapolate the actual state of the atmosphere using the laws of Physics.
� Wind speed and wind direction: most important variables
� Simulate the development of the atmosphere by numerically integrating the non-linear equations of the motions starting from the current atmospheric state.
� Requires continuous mapping of the real world on a discrete 3-Dimen-sional computational grid
� The resolution of numerical grid is finite, so NWP cannot simulate processes such as influence of orographic structures of terrain, localized thermal processes at sub-grid scale.
� Macroscopic effects of the sub-grid processes are modeled without considering the microscopic details.
� Thus, NWP models account for atmospheric behavior from larger scale e.g. 1000 km extension down to scale of the order of 10 km.
IIT, Powai, Mumbai, 16 Dec. 200817
Numerical Weather Prediction (NWP)…..(2)
� NWP provides the necessary input for power prediction system-both the physical and statistical
� Due to their complexity and large amount of data collection, these are typically operated by national weather services and these services use one global model.
� The global model drives a local model with a higher spatial resolution centered around the home country of the weather service.
� Data formats and measuring cycles are standardized by the World Meteorological Organization (WMO), then global meteorological data is available to the weather services to set the initial conditions for their NWP models.
� The output of the NWP is then useful for the power prediction tools.
IIT, Powai, Mumbai, 16 Dec. 200818
NWP system in Europe
60-11MetOffice, UKUnified Model
40 European Centre for Medium Range
Forecasts
ECMWF
10-50Sweden, Denmark, Norway, Spain ,
Iceland, Ireland, Finland, the Netherlands
Hirlam
19-250
9.5
Meto France Arpege
Aladin
60
7
German weather service (DWD) Globalmodell (GME)
Lokalmodell (LM)
Resolution (km)Weather serviceModel name
IIT, Powai, Mumbai, 16 Dec. 200819
Statistical Systems
� Statistical system approximate the relation between wind speed prediction and measured power output and generally don't use predefined power curves
� It derives the relation between predicted wind speed and measured power output with out an explicit local refinement.
� The optimal weights/difference between the online measurements and the meteorological forecast are continuously re-calculated. This has the advantage the parameters are automatically adapted long –term changes in the conditions e.g. variations in roughness due to seasonal effects etc.
� Mathematical models which are combined to generate the prediction of the aggregated power output of the wind farms in a certain area.
� Models: WPPT developed by RISØ, Demark, ANN developed by ISET, Germany.
� Advantages 1. Self-calibrating to inherent changes in the system
2. Incorporate site-specific conditions automatically 3. Includes small-scale influences
� Disadvantages1. Needs a lot of data to build the database
2. Requires accurate measurements3. Site-specific
4. Expertise concerning the physics of the atmosphere is still necessary to select the meteorological variables e.g thermal stratification
IIT, Powai, Mumbai, 16 Dec. 200820
Physical Systems
� Use of the concepts of atmospheric dynamics and boundary layer meteorology to carry out the spatial refinement of the coarse output of the NWP systems to the site-specific conditions
� Transformation of the predicted wind speed to the hub height of wind turbines
� Two classes:
1. Numerical model-based on operational fluid dynamical simulations like NWP
3 subclasses:
- NWP models: 1000-10 km
- Meso-scale models: 10-1 km e.g.MM5, GESIMA
- Micro-scale models: several 100-0.01 m e.g. WAsP
2. Diagnostic models-use of parameterizations of the boundary layer
e.g. PREDIKTOR by R RISØ,Denmark
Advantages � based on physical parameters
� Not site-specific
� Individual atmospheric process can be systematically invested to optimize the model
Disadvantages
� sensitive to errors due to erroneous initial information
IIT, Powai, Mumbai, 16 Dec. 200821
Global Scenario
Yes, in the UK, the USA,
Ireland, Spain, Austria,
Japan
X��������XGarrd Hassan, UKGH Forecaster
Under developmentX����X����University College
Cork, Ireland
Honeymoon
Yes , in Germany
(about 12 GW)
������������
(ANN)
XISET, GermanyAdvanced Wind Power
Prediction Tool
Yes, in Spain
(about 4 GW)
������������XUniversity Carlos
III, Madrid, and Red
Electrica de Espaňa
SIPREOLICO
Yes, for several wind
farms (about 1 GW)
X����X����True Wind
Solutions, USA
e Wind TM
Under development����������������Oldenburg
University Germany
Previento
Yes, in Denmark������������XIMM and
University of
Copenhagen,
Denmark
Wind Power Prediction
Tool Zephyr
Yes for several wind
farms (approx 2 GW) in
Denmark
X����X����Riso National
Laboratory,
Denmark
Prediktor
MeasurementNWPStatisticalPhysical
In operation by July 2003Input DataMethodDeveloperName
IIT, Powai, Mumbai, 16 Dec. 200822
Indian scenario
� Though 4th position in the world , very low penetration of wind power to the grid as compared to European countries
� No independent forecasting system for wind power
� Biasing the wind power due to its variability
� Need to develop wind power prediction system suitable to Indian conditions
Benefits � Generate desperately needed information and scientific evidence to support
wind sector growth.
� Help in mainstreaming wind power sector in India and hence contribute in business expansion activities.
� Remove misconception of power sector officials and decision makes based on scientific study and thereby reduce resistance level from the SEBs, grid operators for integration. Help in smoothening business development activities.
� In general help in nationwide acceptance for wind power