28
Tools for comparative Tools for comparative genomics and expert genomics and expert annotations annotations
| Date post: | 16-Jan-2016 |
| Category: |
Documents |
| Upload: | bryan-singleton |
| View: | 227 times |
| Download: | 0 times |

Tools for comparative Tools for comparative genomics and expert genomics and expert
annotationsannotations

www.nmpdr.org
Goals of this Presentation
• Introduce microbiologists to the power of NMPDR and SEED
• Enable users to interact with data
• Invite experts to participate in construction of subsystems
• Capture expert annotations via the annotation clearinghouse

www.nmpdr.org
What is NMPDR?• Beautified, read-only version of the SEED
What is the SEED?• Editable environment for assignment of function in
the context of systems biology• Intended to clean up legacy of errors created by
similarity-based, automated assignment of function• Manual assignment of function based on integrated
evidence: sequence similarity, functional clusters, phylogenetic and metabolic profiles
• Developed for the project to annotate 1000 genomes

www.nmpdr.org
When Will We Have 1000 Complete Genomes?
• Depends on what is meant by “complete” Many sequencing projects will stop without “finishing” or
“closing” the genome in one contiguous sequence for each replicon
• A genome is essentially complete when: 95 - 99% of genome accurately sequenced
10X coverage by 454 method; 5X coverage by Sanger method
Assembly places 70% data in contigs at least 20 kbp
www.nmpdr.org
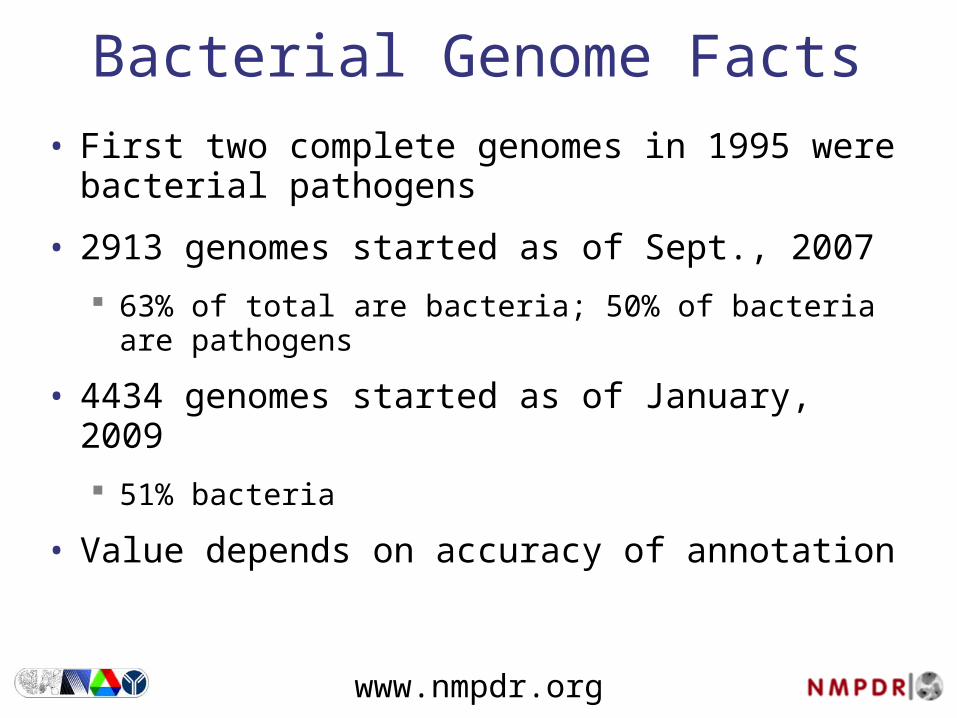
Bacterial Genome Facts• First two complete genomes in 1995 were
bacterial pathogens
• 2913 genomes started as of Sept., 2007
63% of total are bacteria; 50% of bacteria are pathogens
• 4434 genomes started as of January, 2009
51% bacteria
• Value depends on accuracy of annotation

www.nmpdr.org
Complete Genome Projects
0
100
200
300
400
500
600
700
800
900
1000
1995 1996 1997 1998 1999 2000 2001 2002 2003 2004 2005 2006 2007 2008
Total
Bacteria
Eukarya
Archaea

www.nmpdr.org
What is an Annotation?• Identification of nucleotide string that could
potentially encode a protein Open reading frames (ORFs) computed from stop
and start codons, codon bias, promoters and RBS
• Assignment of a name to that gene Usually that of known protein with most similar
sequence, computed from translated BLAST
• Prediction of functional role for that gene Function of most similar protein not always
established with experimental evidence Most similar protein may not have known function Most similar ORF may or may not be expressed

www.nmpdr.org
Problems with Standard Annotations• 42% of H. influenzae ORFs assigned no function in 1995
about half of those had no sequence match in GenBank the rest matched “hypothetical proteins” in E. coli
• 58% of H. influenzae ORFs assigned function of a significantly similar sequence
• What was in GenBank to compare with in 1995? 7% of all GenBank entries were bacterial, 16% of those, E. coli many “conserved hypotheticals” added to database
• Paralogous members of protein families may not be properly discriminated
• Significantly similar enzymes may act on different substrates
• Assignments are transitive, many times removed from experimental data

www.nmpdr.org
Subsystems Annotationsvs.
Pipelines or Protein Families
• What is subsystems annotation? humans integrating evidence within a comparative framework
• What’s wrong with “genome-at-a-time” pipelines? automated assignment of archived annotations to new genomes propagates uninformative and incorrect annotations
• What’s wrong with annotation based on protein families? emphasizes structural and phylogenetic evidence ignores metabolic and chromosomal contexts leads to ambiguity for members of large families, e.g. transporters
www.nmpdr.org
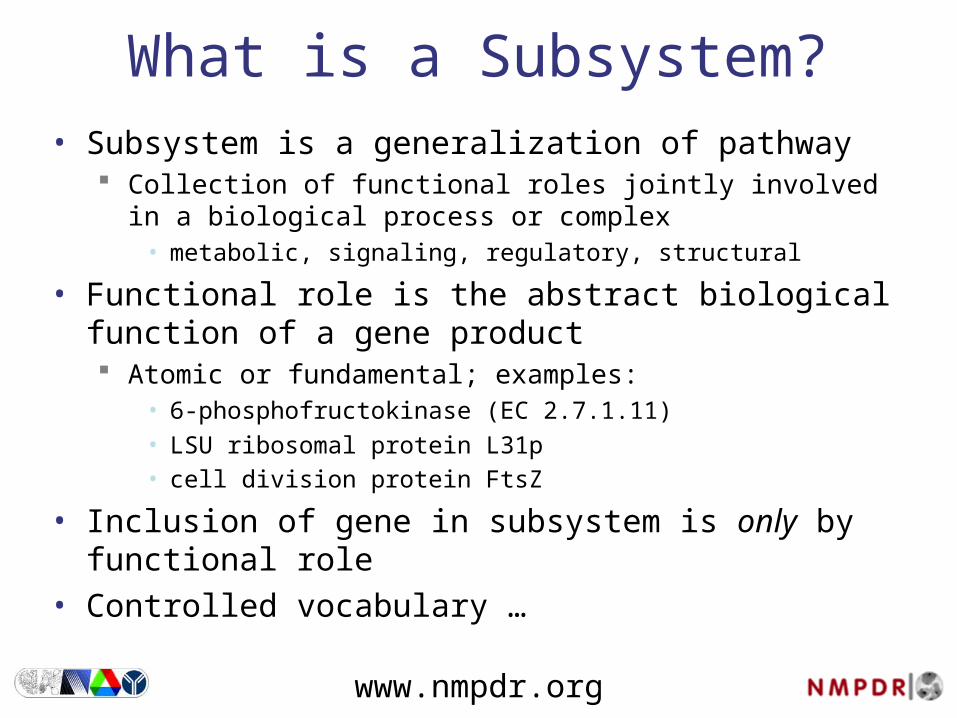
What is a Subsystem?• Subsystem is a generalization of pathway
Collection of functional roles jointly involved in a biological process or complex
• metabolic, signaling, regulatory, structural
• Functional role is the abstract biological function of a gene product Atomic or fundamental; examples:
• 6-phosphofructokinase (EC 2.7.1.11)• LSU ribosomal protein L31p• cell division protein FtsZ
• Inclusion of gene in subsystem is only by functional role
• Controlled vocabulary …

www.nmpdr.org
Expert-Defined Subsystems
• Curator is researcher with first-hand knowledge of biological system
• Functional roles defined and grouped into subsystem and subsets by curator universal groups of roles include all organisms functional variants are subsets of roles found in
a limited number of organisms• often represent alternative paths or nonorthologous
replacement
• Semi-automated assignment of function based on manual groundwork, sequence homology, and functional clustering

www.nmpdr.org
Subsystem Primer• Describe your subsystem in 150 words or less—why should
these functions be considered together? define the emergent properties of the system
• Provide or link to a diagram that illustrates this subsystem define the graph or network
• List the reactions or relationships between these functional roles define the edges
• List the exact names and abbreviations of these functional roles define the nodes
• List the id numbers (GenBank, SwissProt—any identifying alias) of genes that play these roles in one or more exemplar genomes examples of nodes
• Provide one or more references that support the assignment of function for the exemplar genes provide evidence
www.nmpdr.org
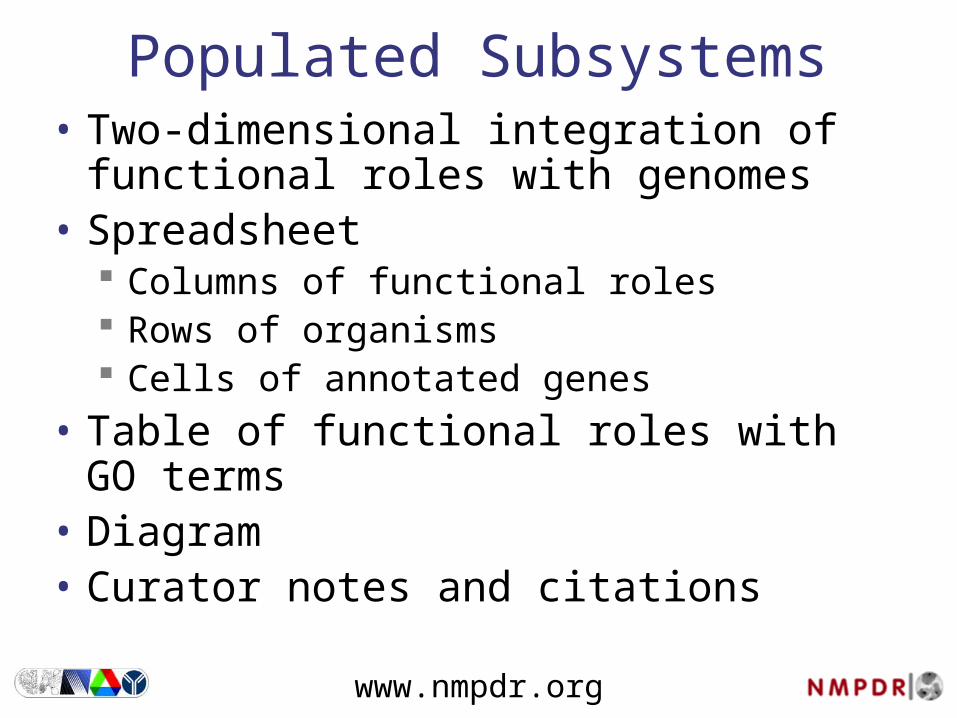
Populated Subsystems• Two-dimensional integration of
functional roles with genomes• Spreadsheet
Columns of functional roles Rows of organisms Cells of annotated genes
• Table of functional roles with GO terms
• Diagram• Curator notes and citations
www.nmpdr.org
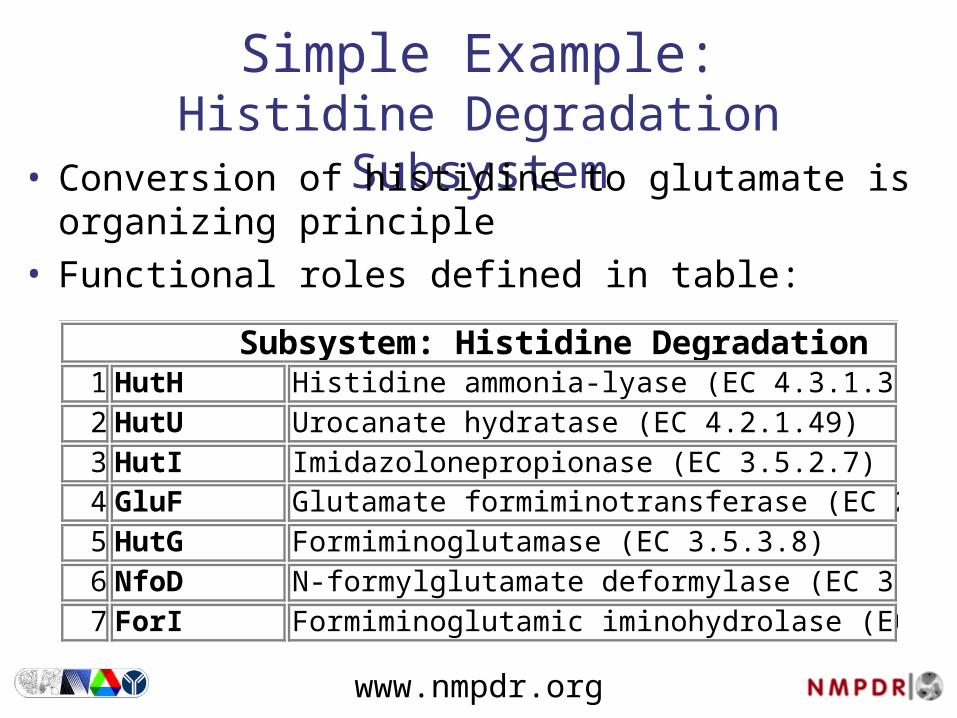
Simple Example:Histidine Degradation Subsystem
1 HutH Histidine ammonia-lyase (EC 4.3.1.3)
2 HutU Urocanate hydratase (EC 4.2.1.49)
3 HutI Imidazolonepropionase (EC 3.5.2.7)4 GluF Glutamate formiminotransferase (EC 2.1.2.5)
5 HutG Formiminoglutamase (EC 3.5.3.8)
6 NfoD N-formylglutamate deformylase (EC 3.5.1.68)
7 ForI Formiminoglutamic iminohydrolase (EC 3.5.3.13)
Subsystem: Histidine Degradation
• Conversion of histidine to glutamate is organizing principle
• Functional roles defined in table:

www.nmpdr.org
Subsystem Diagram• Three functional variants• Universal subset has three roles, followed
by three alternative paths from IV to VI

www.nmpdr.org
Subsystem Spreadsheet
• Column headers taken from table of functional roles• Rows are selected genomes, or organisms• Cells are populated with specific, annotated genes• Shared background color indicates proximity of genes• Functional variants defined by the annotated roles• Variant code -1 indicates subsystem is not functional
Organism Variant HutH HutU HutI GluF HutG NfoD ForI
Bacteroides thetaiotaomicron 1 Q8A4B3 Q8A4A9 Q8A4B1 Q8A4B0
Desulfotela psychrophila 1 gi51246205 gi51246204 gi51246203 gi51246202
Halobacterium sp. 2 Q9HQD5 Q9HQD8 Q9HQD6 Q9HQD7
Deinococcus radiodurans 2 Q9RZ06 Q9RZ02 Q9RZ05 Q9RZ04
Bacillus subtilis 2 P10944 P25503 P42084 P42068
Caulobacter crescentus 3 P58082 Q9A9MI P58079 Q9A9M0
Pseudomonas putida 3 Q88CZ7 Q88CZ6 Q88CZ9 Q88D00
Xanthomonas campestris 3 Q8PAA7 P58988 Q8PAA6 Q8PAA8
Listeria monocytogenes -1
Subsystem Spreadsheet

www.nmpdr.org
Missing Genes Noticed by Subsystems Annotation
• No genes were annotated “ForI (EC 3.5.3.13) Formiminoglutamic iminohydrolase” when the Histidine Degradation subsystem was populated
• Organisms missing ForI convert His to Glu• Candidate genes that could perform the
role “ForI” must be identified• Strategy for finding genes is based on
chromosomal clustering and occurrence profiling

www.nmpdr.org
Finding Genes that Cluster with NfoD
• Red gene in graphic and table is NfoD of Xanthomonas• Genes pictured in gray boxes located nearby NfoD in four or more species• Advanced controls expands display of homologous regions in other genomes• Functional Coupling score links to table of homologous pairs in other
genomes• Cluster button finds biggest clusters in other species when not clustered in
subject genome

www.nmpdr.org
What are Pinned Regions?• Focus gene is number 1, colored red• Most frequently co-localized homolog
numbered 2, colored green• Sets of homologous genes presented in the
same color with the same numerical label; BLASTP cut-off e-val = 1e-20
• Numerical labels correspond to rank-ordered frequency of co-localization with the focus gene
• Number of regions, size of region, and cut-off can be re-set by user

www.nmpdr.org
•Compare Regions around NfoD, red, center
•HutC, the regulator, is green, 2
HutH, the first functional role in the subsystem, is blue, 4
Candidate ForI is teal, 6, originally annotated as “conserved hypothetical”
Candidate ForI in Context with NfoD

www.nmpdr.org
Annotation of ForI EC 3.5.3.13• Metabolic context proves need for role
Organisms missing annotated ForI degrade His to Glu
• Chromosomal context points to candidate Clusters with NfoD and other genes in subsystem
• Occurrence context supports candidate Organisms containing NfoD lack GluF and HutG,
required for functional variants 1 and 2, respectively Organisms containing candidate ForI also contain
NfoD, indicating functional variant 3
• Phylogenetic trees of candidate ForI genes are coherent

www.nmpdr.org
Subsystems Allow Bioinformatics to Inform
Bench Research• Subsystems point to missing or
alternative genes• Bioinformatic predictions need to be
tested at the bench• ForI candidate now verified
experimentally• Connections forged between bench
and bioinformatics
www.nmpdr.org
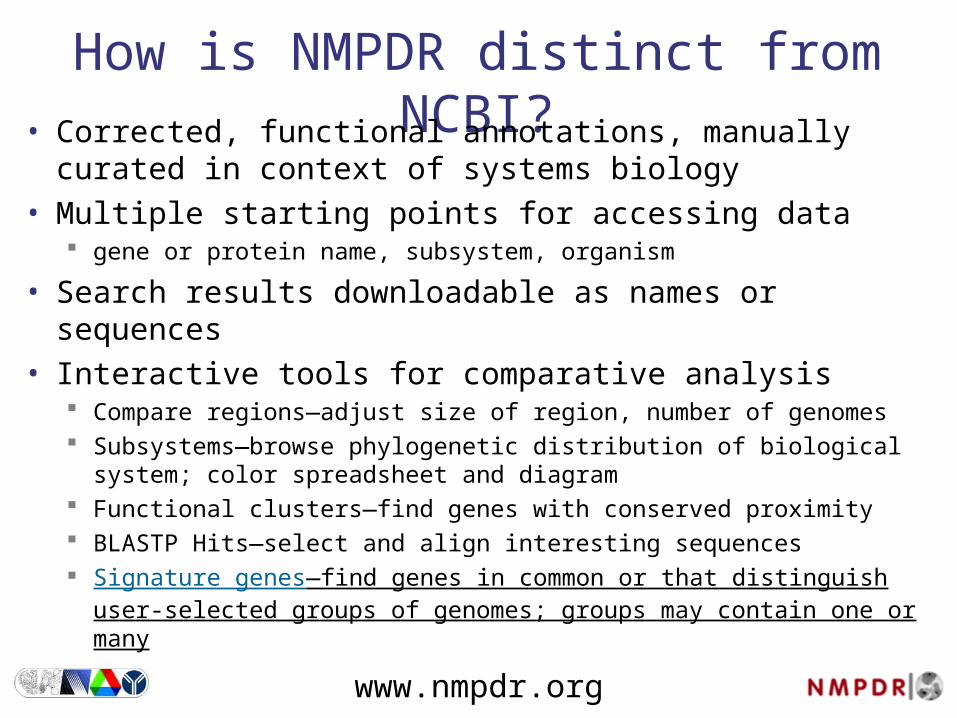
How is NMPDR distinct from NCBI?• Corrected, functional annotations, manually curated
in context of systems biology• Multiple starting points for accessing data
gene or protein name, subsystem, organism
• Search results downloadable as names or sequences• Interactive tools for comparative analysis
Compare regions—adjust size of region, number of genomes Subsystems—browse phylogenetic distribution of biological
system; color spreadsheet and diagram Functional clusters—find genes with conserved proximity BLASTP Hits—select and align interesting sequences Signature genes—find genes in common or that distinguish user-
selected groups of genomes; groups may contain one or many
www.nmpdr.org
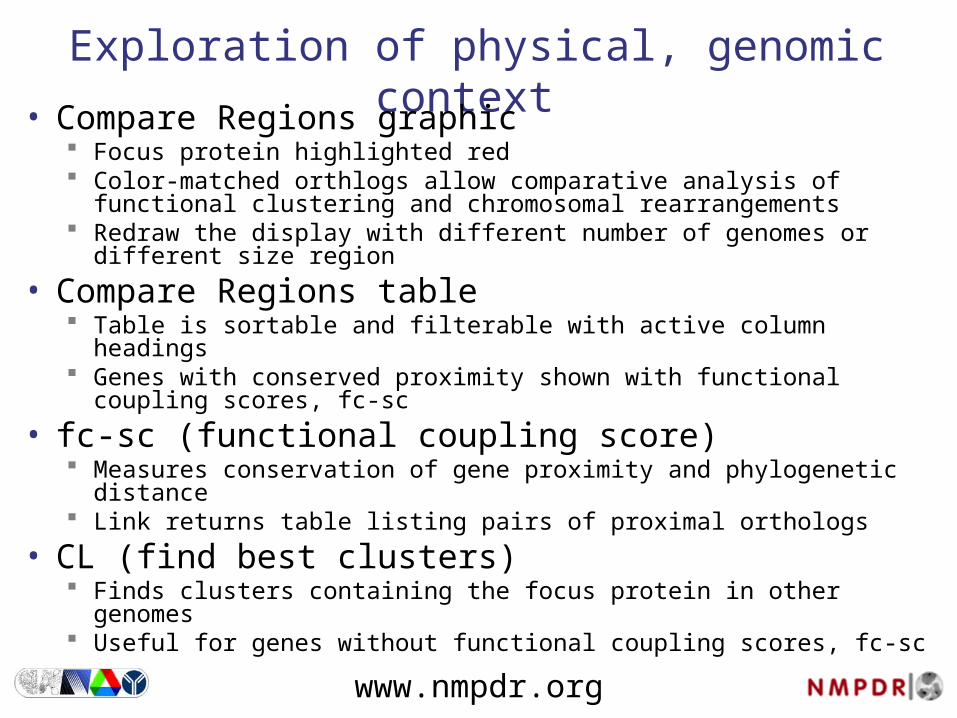
Exploration of physical, genomic context
• Compare Regions graphic Focus protein highlighted red Color-matched orthlogs allow comparative analysis of
functional clustering and chromosomal rearrangements Redraw the display with different number of genomes or
different size region
• Compare Regions table Table is sortable and filterable with active column headings Genes with conserved proximity shown with functional
coupling scores, fc-sc
• fc-sc (functional coupling score) Measures conservation of gene proximity and phylogenetic
distance Link returns table listing pairs of proximal orthologs
• CL (find best clusters) Finds clusters containing the focus protein in other genomes Useful for genes without functional coupling scores, fc-sc

www.nmpdr.org
Exploration of functional, biological context • Populated Subsystem Spreadsheet
Columns represent functional roles, mouse over header for definition
Genomes (rows) shown may be filtered and sorted by name or taxonomic group
Cells populated with specific, annotated genes linked to context pages
Functional variants defined by the annotated roles Variant codes defined in notes tab Diagram of subsystem often provided
• Protein families FIGfams taken from single column of functional
roles Links to structures, orthologs, literature
www.nmpdr.org
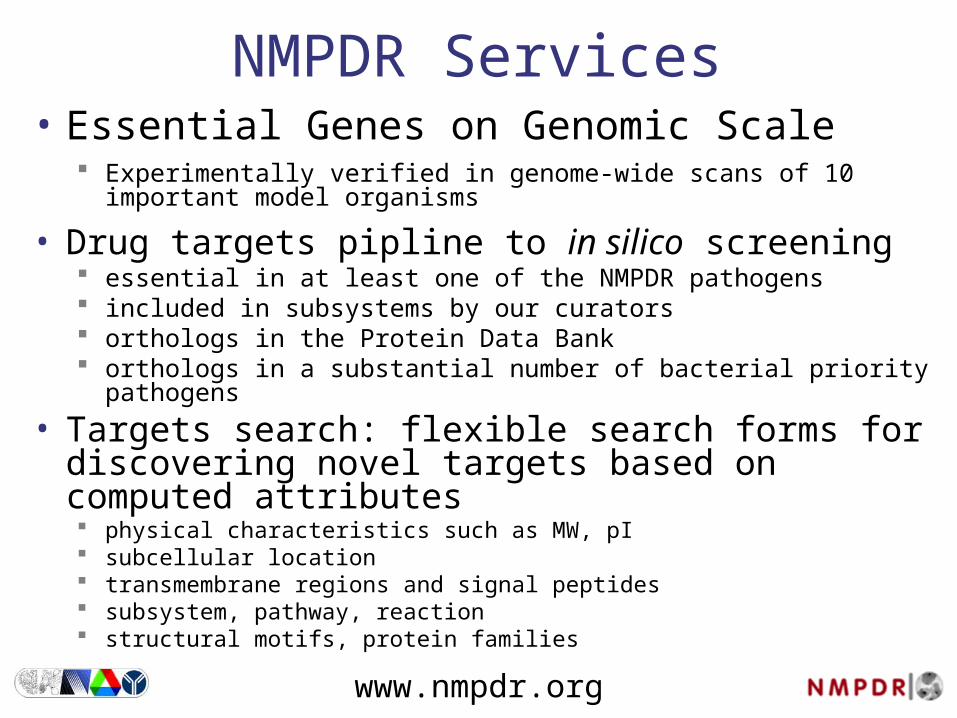
NMPDR Services• Essential Genes on Genomic Scale
Experimentally verified in genome-wide scans of 10 important model organisms
• Drug targets pipline to in silico screening essential in at least one of the NMPDR pathogens included in subsystems by our curators orthologs in the Protein Data Bank orthologs in a substantial number of bacterial priority
pathogens
• Targets search: flexible search forms for discovering novel targets based on computed attributes physical characteristics such as MW, pI subcellular location transmembrane regions and signal peptides subsystem, pathway, reaction structural motifs, protein families

www.nmpdr.org
Related NMPDR Services• RAST Genome annotation server
Automated annotation of essentially complete genome sequences in a small set of long sequence contigs
View results in comparative context with other genomes
• MG-RAST Metagenome annotation server Automated annotation of a very large set of very short DNA
sequences View results in comparative context with other data sets
• Annotation Clearinghouse Tool to credit experts with annotation of specific genes and
to share annotations with other databases Input is a two-column table of gene IDs and annotations
vouched for by expert

www.nmpdr.org
Who is NMPDR?• Fellowship for Interpretation of Genomes (FIG)
Ross Overbeek, Veronika Vonstein, Gordon Pusch, Bruce Parrello, Rob Edwards, Andrei Osterman, Michael Fonstein, Svetlana Gerdes, Olga Zagnitko, Olga Vassieva, Yakov Kogan, Irina Goltsman
• Argonne National LaboratoryRick Stevens, Terry Disz, Robert Olson, Folker Meyer, Elizabeth Glass, Chris Henry, Jared Wilkening
• Computation Institute at University of ChicagoDaniela Bartels, Michael Kubal, William Mihalo, Tobias Paczian, Andreas Wilke, Alex Rodriguez, Mark D'Souza, Rami Aziz
• University of Illinois at Urbana; Hope CollegeGary J. Olsen, Claudia Reich, Leslie McNeil; Aaron Best, Matt DeJongh
• National Institute of Allergy and Infectious DiseasesNational Institutes of Health, Department of Health and Human Services, Contract HHSN266200400042C.


