Tools for inverse mapping and visualization of multi-spectral image data on 3D scanned representations of drawings M. Callieri, P. Cignoni, F. Ganovelli, P. Pingi, F. Ponchio, C. Montani, R. Scopigno Istituto di Scienza e Tecnologie dell’Informazione (ISTI-CNR), Via Moruzzi 1, 56124 Pisa Italy ABSTRACT A new prospective for the study, documentation and presentation of Cultural Heritage is opened by the joint usage of the tools for the automatic reconstruction of digital 3D models and the instruments for interactive 3D visualization. New techniques are available to perform high-resolution sampling of both the shape and the multi-band reflection properties of painted surfaces. The digital 3D models produced are extremely accurate and rich of information, as it has been proved in the experiments run on the Leonardo’s Madonna of the Yarnwinder. This paper presents an overview of the techniques needed to build high-quality 3D models from the raw data produced by the scanning devices and describes how to process those models to make them usable in interactive applications. A very critical point is how to integrate the reflection properties with 3D shape models; this integration (based on texture mapping) allows us to produce textured 3D models that allow a joint visualization of shape and color attributes. The interactive visualization tools developed by ISTI-CNR are described, presenting both their features and potential for the visual presentation and analysis of works of art. Examples of the results obtained on the Madonna of the Yarnwinder are presented. Keywords: 3D scanning, multi-spectral imaging, color acquisition and mapping, interactive visualization 1. INTRODUCTION Modern 3D graphics technologies allows us to acquire accurate digital models of real objects or complex scenes; moreover, 3D graphics allows also to present those digital data to the public in an interactive and pleasant manner. 3D scanning technology evolved considerably in the last few years, both in terms of hardware devices and of algorithms for processing the raw data produced by scanning devices. 1 3D scanning devices are usually based on optical technology (laser or structured light) and use either the triangulation approach (small and medium scale objects) or the time of flight approach (large scale objects, e.g. architectures). The scanning of complex objects is therefore performed by taking a [usually large] set of partially overlapping range scans. The classical pipeline which characterizes a 3D scanning session is rather complex, involving many different operations (introduced in Section 2). Our group focused in the last few years on the software problems introduced by the need to process efficiently the huge dataset produced with 3D scanning devices, and to augment the 3D data with color information. This paper presents the results of a first experiment concerning the scientific analysis of a Leonardo’s painting, the Madonna of the Yarnwinder. In the framework of a complex set of investigations, a number of different image- based analysis have been performed on the painting together with a three-dimensional acquisition of the painted surface. We describe in this paper the technical steps needed to produce a complete 3D model (shape plus color ) and the potential of interactive 3D graphics for the visual analysis of the data. Send correspondence to: R. Scopigno, E-mail: [email protected]
Transcript
Tools for inverse mapping and visualization of multi-spectralimage data on 3D scanned representations of drawings
M. Callieri, P. Cignoni, F. Ganovelli, P. Pingi, F. Ponchio, C. Montani, R. Scopigno
Istituto di Scienza e Tecnologie dell’Informazione (ISTI-CNR),Via Moruzzi 1, 56124 Pisa Italy
ABSTRACT
A new prospective for the study, documentation and presentation of Cultural Heritage is opened by the jointusage of the tools for the automatic reconstruction of digital 3D models and the instruments for interactive3D visualization. New techniques are available to perform high-resolution sampling of both the shape and themulti-band reflection properties of painted surfaces. The digital 3D models produced are extremely accurateand rich of information, as it has been proved in the experiments run on the Leonardo’s Madonna of theYarnwinder. This paper presents an overview of the techniques needed to build high-quality 3D models fromthe raw data produced by the scanning devices and describes how to process those models to make them usablein interactive applications. A very critical point is how to integrate the reflection properties with 3D shapemodels; this integration (based on texture mapping) allows us to produce textured 3D models that allow ajoint visualization of shape and color attributes. The interactive visualization tools developed by ISTI-CNR aredescribed, presenting both their features and potential for the visual presentation and analysis of works of art.Examples of the results obtained on the Madonna of the Yarnwinder are presented.
Keywords: 3D scanning, multi-spectral imaging, color acquisition and mapping, interactive visualization
1. INTRODUCTION
Modern 3D graphics technologies allows us to acquire accurate digital models of real objects or complex scenes;moreover, 3D graphics allows also to present those digital data to the public in an interactive and pleasantmanner.
3D scanning technology evolved considerably in the last few years, both in terms of hardware devices and ofalgorithms for processing the raw data produced by scanning devices.1 3D scanning devices are usually based onoptical technology (laser or structured light) and use either the triangulation approach (small and medium scaleobjects) or the time of flight approach (large scale objects, e.g. architectures). The scanning of complex objectsis therefore performed by taking a [usually large] set of partially overlapping range scans. The classical pipelinewhich characterizes a 3D scanning session is rather complex, involving many different operations (introduced inSection 2).
Our group focused in the last few years on the software problems introduced by the need to process efficientlythe huge dataset produced with 3D scanning devices, and to augment the 3D data with color information. Thispaper presents the results of a first experiment concerning the scientific analysis of a Leonardo’s painting, theMadonna of the Yarnwinder. In the framework of a complex set of investigations, a number of different image-based analysis have been performed on the painting together with a three-dimensional acquisition of the paintedsurface. We describe in this paper the technical steps needed to produce a complete 3D model (shape plus color)and the potential of interactive 3D graphics for the visual analysis of the data.
2. PROCESSING 3D SCANNED DATA - SHAPE RECONSTRUCTION
Scanning any 3D object requires the acquisition of many shots of the artifact taken from different viewpoints,to gather geometric information on all of its shape. The scanning process is very similar to a photographicprocess: each single shot samples a subset of the surface of the work of art (the section visible from the currentview); the output produced is also similar to a photo, but each pixel produced in output encodes the geometricalcoordinates (x,y,z values) of the sampled surface parcel, rather than its RGB color. This raw output of a 3Dscanner is usually called range map.
Any complex object (either a statue or a large painting) requires usually the acquisition of many rangemaps to cover completely its entire surface. This set of range maps has to be processed to be converted into asingle, complete, non-redundant and optimal digital 3D representation.2 The general processing phases (usuallysupported by standard scanning software tools) are:
• Range maps alignment. Since by definition the geometry encoded in each range map is relative to thecurrent sensor location, all range maps have to be transformed into a common coordinate space where allof them lie well aligned. After alignment, the sections of the range maps corresponding to the same surfacezone will be geometrically overlapping.
• Range maps merge (or fusion). The goal of this phase is to build a single, non redundant mesh out of themany and partially overlapping range maps; this phase reduces the redundancy of the data, since regionsof the surface represented by multiple sampling (range maps) are represented after the merging phase bya unique sheet of triangles.
• Mesh editing. This processing is introduced to improve the quality of the reconstructed mesh; an exampleof editing action is the elimination of unsampled regions, performd by filling the gaps with interpolatedpatches (hole filling).
• Mesh simplification. The digital models produced are usually very accurate but at the same time highlytessellated (i.e. composed by millions of tiny triangular facets). The number of faces produced afterthe merging phase depends directly from the sampling resolution adopted in scanning. Current scanningtechnology allows to produce 10 samples per squared millimeter (or even more), and therefore an artworkwhose surface is 1 squared meter is represented by a triangle mesh composed by around 200M faces. Meshesso complex make interactive visualization hard to accomplish and data transmission on current networkseven more clumsy (web-based visualization becomes prohibitive). The accurate reduction of the hugecomplexity of the model obtained is therefore a must. Through simplification we can also produce multipleLevel Of Details (LOD) or multi-resolution representations.
The ones briefly described above are the standard phases to be performed to process scanned raw dataproduced by a generic 3D scanner. However, the case of painted surfaces is somehow simpler since we have tomanage objects that are mostly two-dimensional, or more correctly that can be encoded in a 2.5-dimensionalspace. As we will see, the 3D acquisition of painted surfaces can be implemented by taking into account theirspecific characteristics.
As we may see in other contributions in this proceedings,3 the acquisition of the shape of paintings can bedone by using scanning devices designed ad hoc for these type of objects. The scanning instruments designedby the INOA staff are based on a 2D translation system that allows acquiring in a single run large surfaceextents. When the scanner working size contains the painting we are interested in, we can acquire completelyits surface with just a single shot. Consequently, align and merging are not required in this case. But such asimple procedure is not always possible. As an example, if we adopt a very high resolution scanning device, suchas the micro-profilometry unit developed by INOA colleagues, the surface parcels acquired are often small (inthe range of few centimeters on each size). In this case, the acquisition of multiple range maps is often requiredand those data have to be aligned and merged.
Aligning range maps representing painted surfaces is, unfortunately, a more complex work than aligningrange maps representing portions of a standard 3D object. The peculiarity of painting scanning is the large ratio
between the extent of the sampled region and the mean size of the shape features (brush strokes, cracks, partiallydetached painted layer), which characterize geometrically the painted surface. Mesh alignment is implementedin most systems by searching for corresponding points pairs located on geometric features visible in each pairof overlapping range maps. This set of corresponding points is used to compute an initial rough alignment,which is then improved by an automatic optimization process (Iterative Closest Points, ICP4, 5) which reducesthe miss-alignment between pairs of range maps.
Since range maps representing painted surfaces are mostly nearly planar meshes, the problem of how toguarantee the convergence of ICP arises. Namely, selecting matching points on two planar surfaces is a hardtask, since featureless patches can slide one over the other and ICP may converge on false minima. The alignmentsoftware developed by ISTI-CNR6 allows to select the points used in the ICP iteration by choosing a uniformdistribution over the space of the normal vectors (computed on range maps vertices); conversely, other commercialor academic solutions select points performing a spatially uniform distribution. From a geometrical point of view,our solution corresponds to pick up points lying close to high curvature areas (e.g. cracks visible on the paintedsurface). This is strategic in the case of range maps representing paintings.
Merging range maps is also required when we want to produce a single model out of different acquisitions, e.g.a range map of the entire surface obtained with a laser-line scanning device and some more detailed range mapscovering sub-regions with a more dense sampling obtained with a micro-profilometry device. In this case, we areforced to merge those data to the resolution of the finer sampling, thus producing a huge mesh. Simplificationof the output is therefore a must, to produce a model that uses only the minimal data required to describethe geometry at the requested accuracy. Simplification is an adaptive process that iteratively removes those 3Dsamples that can be easily interpolated from the values of the adjacent ones; the intuitive idea is to use widertriangular faces in all those surface parcels which are nearly planar or smoothly curved.
Two problems arise when we try to simplify digital models of paintings with commercial simplification solu-tions:
• Data size: none of the commercial simplification solutions can manage a very large mesh using a PC-class platforms with a standard memory size; to give some figures, a standard mesh simplification methodbased on edge collapse would require around 15 GB of RAM memory to manage an 80M faces mesh. OurMeshSimplify tool6, 7 performs simplification running on external memory, and therefore has no limits interms of maximal size of the triangle mesh in input.
• Simplification accuracy: the simplification of our painted surface models is highly challenging. Most ofthe existing solution will wash out all the detail and features contained in the representation. In fact,even a small error (e.g. 0.5 mm) will remove most of the detail if the simplification is run by taking intoaccount only the shape degradation. MeshSimplify allows to take into account also the mesh curvature:surface normals are considered while evaluating the effect of each atomic simplification action, preservinghigh curvature regions like the ones on the profiles of the graffiti engravings. This allows MeshSimplify toreduce the size of the representation while at the same time preserving most of its shape features [bib3].
3. PROCESSING 3D SCANNED DATA - INTEGRATION OF REFLECTIONPROPERTIES
Once we have reconstructed a digital 3D model of the work of art, we have to integrate this model with theavailable surface reflection properties of its surface. Only a very small set of real world materials present auniform surface reflectance property (e.g. brand-new polished metals, such as gold or silver). The large majorityof works of art present highly complex reflection properties, due to their material composition or decoration(e.g. objects in stone present veins and patinas, ceramic objects or canvas have usually complex paintings, ironweapons have gold or silver decorations). Multiple options exist for the acquisition of the usually called ”color”,which allows to acquire this data at different levels of quality and accuracy:
• Apparent color : we may simply sample the color of the surface by tacking images with a standard digitalphotographic camera. In this case, we are not sampling the reflection properties of the surface, but the light
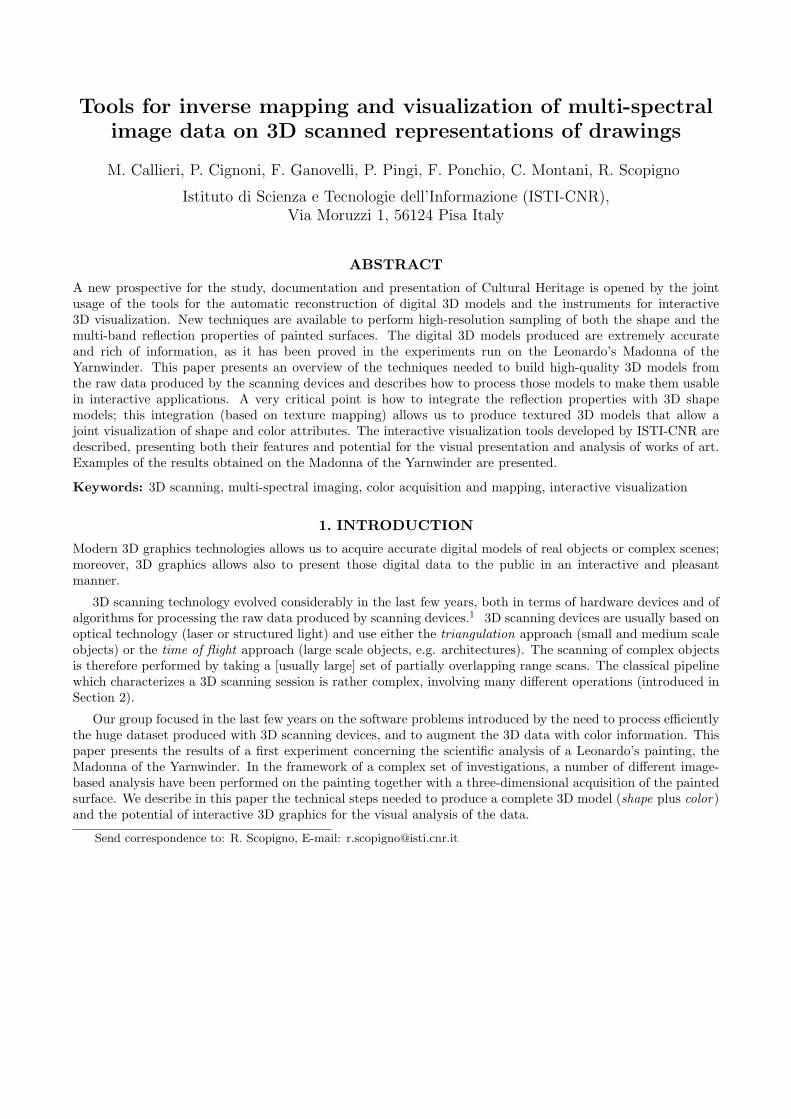
Figure 1. Mapping multiple images on a digital 3D model: the uneven color intensity between different sampled imageswhich maps on adjacent portions of the 3D model should be taken into account (see image on the left) and, if possible,smoothed as in the 3D model shown in the center, produced by using the technologies developed by ISTI-CNR. On theright, we show a digital model of the Minerva of Arezzo with color processed with our tools.
reflected by the surface when the image is grabbed. Therefore, the digital model produced is illumination-dependent, i.e. the sampled colors depend on the lighting conditions at acquisition time. It will not bepossible (unless a very crude approximation is sufficient) to re-light the digital model at visualization timein a photo-realistic manner. Moreover, commercial software solutions manage those color data by simplyintegrating the RGB images in a single texture (cutting and pasting parts of the photos on the geometry).The major problem of this approach, set aside the precision of mapping, is the color discontinuity (in colorintensity or hue) between different parts of the texture (see Figure 1). This discontinuity is originatedby the usual non-uniform illumination conditions while sampling the reflected color. More sophisticatedapproaches to acquire and process apparent color exist, as we will describe in the following.
• Albedo: ad-hoc imaging systems can be designed to acquire the albedo of the surface, i.e. a model of thereflection characteristics of each point of the surface based on the assumption that the material reflectsthe light with mostly a Lambertian reflection mode.8, 9 In this case, we have to design an ad-hoc lightingstage and some image-processing tools: to reconstruct the albedo, for each view we have to acquire multipleimages (five or six images replace the single view acquired in the case of the apparent color acquisition) andeach one of these images has to be acquired under a different lighting directions. Since we have multipleimages from the same view but under different known lighting (the position of the light with respect to theobject is computed by means of an initial calibration phase), we can invert the light reflection equation foreach pixel to compute the corresponding base color, independent of the Lambertian-based shading.
• Radiance (BRDF): by adopting a much more complex lighting and calibration systems, an approximationof the radiance of the surface (or more precisely its representation in terms of a Bidirectional ReflectanceDistribution Function (BRDF) model) can be calculated.10 This solution is much more complex to beimplemented and used, but at the same times gives the best results in terms of quality of the sampling.
In real applications, acquiring just the apparent color is still the most common solution. By the way, theapparent color can be acquired and processed in many different manners. Those results can be significantlyimproved in terms of quality if clever solutions are designed and used, ad described in the following.
A standard digital camera samples a large surface region with a single shot, but presents the known problemsof radial distortion, uneven sampling due to the perspective distortion and uneven distribution of light on thesurface. In the case of nearly planar surfaces (such as paintings) we can replace the standard photographic devicewith special purpose instruments, such as the one designed by INOA. The INOA scanner allows sampling thesurface step by step (by a computer-controlled XY translation); each parcel of the surface is sampled by tackinga point-wise measure of the reflected light (on a multi-band base). Advantages of this device are therefore theabsence of geometrical distortion and the controlled lighting (since each pixel is lighted by the same illuminant,located in the same relative position).
If the work of art under consideration is complex, we usually sample its color with multiple images/scans(this is the standard case for all-round 3D artworks, but may occur also in the case of paintings when the sizeof the painting is larger than the maximal working domain of the color scanning device). We have thereforethe problem of how to integrate and map on the digital 3D model those data, acquired in terms of multipleimages. ISTI-CNR has developed a tool supporting this need. Our texture weaving process starts form a set ofRGB images (or any other form of multi-spectral images) with known camera parameters (which can be eitherreturned by the 3D scanner or be calculated a posteriori11); the output produced is a textured 3D model (i.e. atriangle mesh with a mapped texture image). This process is subdivided in four phases9, 12: visibility calculation,patches generation over the 3D geometry, texture-patches packing and texture averaging :
• Visibility calculation. The first step is to find for each tiny triangular face of the digital 3D mesh thesubset of cameras (and images) from which this face is visible, and the relative angle of incidence of thecorresponding view direction.
• Patch generation. Visibility data are used to subdivide the 3D mesh in sections (patches), such that asingle image (or portion of an image) could be attached to each patch getting a good projection and colormapping.
• Sub-Texture packing. Once these geometric patches have been generated, the corresponding texture regionsare arranged in a new RGB texture, obtained as a patchwork of [portions of] the input texture patches.
• Improving color matching and continuity. The patchwork texture is averaged in two steps, to minimizecolor difference and discontinuities (see Figure 1).
4. VISUALIZATION OF 3D SCANNED DATA
Once we have reconstructed a digital 3D model, which represents both the shape and the reflection properties(color) of the work of art, we can convert this model in any one of the data format used by the potentialapplications. Visual inspection is one of these potential applications, and can be oriented either to the experts(art historians, restorers) or to the common public (museum visitors, students, etc.).
Some constraints on the functionalities and characteristics that an ideal visualization tool for Cultural Her-itage should satisfy are listed below:
• Interactivity, i.e. high efficiency of the rendering engine even in the case of highly complex digital 3Dmodels (such as the ones produced with 3D scanning tools);
• Color data management, since it should be possible to render the acquired color data on the 3D geometry;
• Support of measuring tools, to allow the user to take measures on the 3D geometry.
We present in the following the characteristics of our visualization tools: Easy3DView and Virtual Inspector.
4.1. Easy3DViewEasy3Dview is our standard visualization tool. It supports interactive visualization of moderately complex digitalmodels (up to 2-3 million triangular faces); it works on any standard PC with a 3D graphic board. Figures 2, 3show the interface and the main features of the system, described in the text below.
Figure 2. Visualization of the 3D model of the ”Madonna of the yarnwinder”: just the shape is rendered and all of thepainting surface is visible (image on the left); using the same rendering mode of the previous image, the user is zoomingtowards the painting (right image), the small corrugations of the surface are now visible.
Interactive selection of the view. The user can rotate the digital object, to look at it from any direction;he can zoom-in/zoom-out and pan to inspect any region with the requested magnification effect (Figures 2, 3).
Interactive virtual lighting. A virtual light can be moved by the user, to change the shading effect and toemulate digitally the “luce radente” (grazing light) effect which allows to give more evidence to the small scalefractures or bumps on the painted surface (Figure 4).
Selection of the surface specularity . The possibility to modify the surface specularity is very useful toamplify the perception of the small scale bumps or fractures in the painted surface, especially when the lightis interactively moved over the surface; more the surface is shiny, more we increase the capability to transmitvisually the small-scale shape features (Figure 3-left).
Selection of the rendering mode. The digital model can be visualized as a point set, in wire frame (onlythe triangle edges become visible), as a shaded surface (as in Figures 2, 3-left), or finally by presenting also theavailable color information (Figure 3-right).
Inspection of multiple models. If we have multiple digital 3D models of the same work of art, we caninspect those models side by side; any view or action activated on one model can be copied and executed on theother one by a simple Cut&Paste command. This allows, for example, the side by side inspection of differentimage-based surface sampling; as an example, we show in Figure 4 the coordinated visual analysis of RGB colorand X-Ray imaging over the 3D model.
Figure 3. The specularity of the surface can be increased, to allow a more clear visualization under grazing light(imageon the left); visualization of the color data (RGB sampling) mapped over the 3D model (right image).
Performing measures. An important resource could be the capability to take any linear measure directly onthe digital 3D model. Easy3Dview supports that by a simple interactive tool: to activate a measuring sessionthe user has to click over the measuring tape icon in the program bar, and to select the extremes of the measureof interest by simply clicking on the corresponding points of the digital mesh; the system returns the coordinatesof those points and the length of the segment joining them (Figure 5).
4.2. Virtual Inspector
Some issues arise from the impressive increase in data complexity (and richness) provided by the evolution of3D scanning technology: how to manage/visualize those data on low-cost computers; how to improve the ease ofuse of the visualization tools (as potential users are often not expert with interactive graphics); how to supportthe presentation of other multimedia information together with the visualization of complex 3D geometry. OurVirtual Inspector browser has been designed to give a solution to these issues.
Virtual Inspector is a new visualization system that allows naive users to inspect a large complex 3D modelat interactive frame rates on standard PC’s.13 To support the efficient manipulation of massive models, VirtualInspector adopts a multi-resolution approach that allows extracting on the fly view-dependent variable resolutionrepresentations.14 For each frame, the best-fit variable resolution LOD is selected according to the current viewfrustum and the requested visualization accuracy.
Virtual Inspector is mainly oriented to the visualization of single works of art (sculptures, paintings, pottery,architectures, etc.), and adopts a very intuitive approach to guide the virtual manipulation and inspection of thedigital replica, based on a straightforward metaphor: we provide a dummy representation of the artwork on aside of the screen, which can be rotated on its axe; to select any given view the user has just to point with themouse the corresponding point on the dummy (Figures 6,7). Virtual Inspector supports interactive modification
Figure 4. An example of coordinate visualization of the same 3D model with a mapping of two different attributes:X-Ray imaging on the left and standard RGB color on the right; we selected a lateral view to make evident that we arevisualizing a 3D model and not just images. Any view modification operated on one window can be replicated on theother one with just a Cut&Paste action.
of the lighting, to simulate in real time the grazing light effect that is usually used in real inspection to enhancethe visualization of small-scale surface detail.
Other important characteristics of Virtual Inspector we want to emphasize here are its flexibility and config-urability. All main parameters of the system can be easily specified via XML tags contained in an initializationfile, such as: which are the 3D models to be rendered, the application layout (i.e. how different models will bepresented on the screen), the rendering modes (e.g. standard Phong-shaded per-vertex colors or BRDF render-ing) and the interaction mode (e.g. model manipulation via a standard virtual trackball, via the dummy-based”point and click” interaction, or both).
If one wants to implement a museum kiosk, a professional graphic designer is usually hired to design thegraphic layout of the multimedia system. Consequently, the layout of the 3D visualizer, all icons and backgroundgraphics elements are usually redesigned. This can be done in Virtual Inspector by simply declaring in the XMLinitialization file all those new images and the location on the screen of all icons and elements of the GUI; neitherprogramming nor recompilations of Virtual Inspector are required to change its appearance. This is a task thatcan be easily assigned to an operator with very limited IT competence.
Finally, we have added to Virtual Inspector the support for hot-spots. Hot spots are a very handy resourceto associate multimedia data (e.g. html pages) to any point or region of a 3D model. This allows designinginteractive presentations where the 3D model is also a natural visual index to historical/artistic information,presented using standard HTML pages and browsers (see Figure 7).
Hot spot specification is extremely easy in Virtual Inspector and modifications to the 3D models are notrequired. We provide a simple 3D browser to the person in charge of the implementation of the multimediapresentation, which allows to query the 3D coordinates of any point on the surface of the artifact (by simplyclicking with the mouse on the corresponding point). Then, a new hot spot is specified by introducing a newXML tag in the Virtual Inspector specification file. The hot spot XML tag specifies basically the 3D locationand the action that has to be triggered when clicking on the hot spot (e.g. the name of the html file, if we wantto open a multimedia page). After activation, the control passes to the html browser, while Virtual Inspector
Figure 5. Since we are working with an accurate 3D model (and not with an image), we can easily compute any measureon the digital model. Here, as an example, the width of the Christ’s eye is computed (see the segment drawn betweenthe two selected points) and it is shown in the lower section of the application window (see the Distance value reported;since data are in microns, the length is 1.015 cm).
Figure 6. Interface of the Virtual Inspector system; the layout shown here is the one designed to present the mausoleumof Arrigo VII (Museum of the Cathedral, Pisa, Italy).13
remains sleeping in the background and regains automatically the control of the interaction whenever the htmlbrowser is closed.
Figure 7. Use of hot spots in Virtual Inspector to link multimedia information to the 3D mesh and allow interactivevisualization of those data.
5. CONCLUDING REMARKS
A written presentation can give only a very rough and incomplete description of interactive 3D graphics potentialfor both the study and dissemination of knowledge on Cultural Heritage. The progress with respect to thestandard photographic media is impressive, due to the incredibly richer capability to infer or transmit knowledgewith accurate digital 3D models. When high quality acquisition techniques are used to build up accurate 3Dmodels, those digital replicas can open to every people in the world those inspection capabilities that are usuallyrestricted to a very small number of privileged people (the owner, the museum curator or the restorer). Therefore,3D graphics technologies qualifies themselves as a major instrument for a mass-based fruition of art in all itscomplexity and beauty, with no risk for the work of art and no added costs (such as for example the ones involvedby the setup of a temporary exposition).
ACKNOWLEDGMENTS
We acknowledge the financial support of the EU IST Network of Excellence “EPOCH” (IST-2002-507382).All raw 2D images and raw 3D data of the Madonna of the Yarnwinder presented in this paper have been acquiredby the colleagues of INOA (Florence, Italy, seeteFonGamGre.etal05) and Siemens Italia, in the framework of ascientific cooperation project coordinated by the Opificio delle Pietre Dure (Florence, Italy).
REFERENCES1. F. Bernardini and H. E. Rushmeier, “The 3D Model Acquisition Pipeline,” Computer Graphics Forum 21,
pp. 149–172, March 2002.2. F. Bernardini and H. E. Rushmeier, “3D Model Acquisition,” in Eurographics 2000, State of the Art Reports
Proceedings, pp. 41–62, Eurographics Association, Aug. 24–25 2000.3. R. Fontana, M. C. Gambino, M. Greco, L. Marras, M. Materazzi, E. Pampaloni, A. Pelagotti, L. Pezzati,
P. Poggi, and C. Sanapo, “2D and 3D optical diagnostic techniques applied to “Madonna dei Fusi” byLeonardo da Vinci,” in Proc. Conf. on Optical Methods for Art and Archeology (Vol. 5857), R. Salimbeniand L. Pezzati, eds., p. (in press), SPIE, (Munich, D), June 13–14 2005.
4. P. J. Besl and N. D. McKay, “A method for registration of 3-D shapes,” IEEE Transactions on PatternAnalysis and machine Intelligence 14, pp. 239–258, Feb. 1992.
5. M. Levoy and S. Rusinkiewicz, “Efficient variants of the ICP algorithm,” in Third Int. Conf. on 3D DigitalImaging and Modeling (3DIM 2001), pp. 145–152, IEEE Comp. Soc., May 28th - June 1st 2001.
6. M. Callieri, P. Cignoni, F. Ganovelli, C. Montani, P. Pingi, and R. Scopigno, “VCLab’s tools for 3D rangedata processing,” in VAST 2003, A. C. D. Arnold and F. Niccolucci, eds., pp. 13–22, Eurographics, (Bighton,UK), Nov. 5-7 2003.
7. P. Cignoni, C. Montani, C. Rocchini, and R. Scopigno, “External memory management and simplificationof huge meshes,” IEEE Transactions on Visualization and Computer Graphics 9(4), pp. 525–537, 2003.
8. C. Rocchini, P. Cignoni, C. Montani, and R. Scopigno, “Multiple textures stitching and blending on 3dobjects,” in Rendering Techniques ’99, D. Lischinsky and G. Ward, eds., pp. 119–130, Springer-VerlagWien, 1999.
9. C. Rocchini, P. Cignoni, C. Montani, and R. Scopigno, “Acquiring, stitching and blending diffuse appearanceattributes on 3d models,” The Visual Computer 18(3), pp. 186–204, 2002.
10. H. P. A. Lensch, J. Kautz, M. Goesele, W. Heidrich, and H.-P. Seidel, “Image-based reconstruction of spatialappearance and geometric detail,” ACM Transaction on Graphics 22, pp. 234–257, Apr. 2003.
11. R. Tsai, “A versatile camera calibration technique for high accuracy 3D machine vision metrology usingoff-the-shelf TV cameras and lenses,” IEEE Journal of Robotics and Automation RA-3, Aug. 1987.
12. M. Callieri, P. Cignoni, and R. Scopigno, “Reconstructing textured meshes from multiple range rgb maps,”in 7th Int.l Fall Workshop on Vision, Modeling, and Visualization 2002, pp. 419–426, IOS Press, (Erlangen(D)), Nov. 20 - 22 2002.
13. C. Baracchini, A. Brogi, M. Callieri, L. Capitani, P. Cignoni, A. Fasano, C. Montani, C. Nenci, R. P. Novello,P. Pingi, F. Ponchio, and R. Scopigno, “Digital reconstruction of the Arrigo VII funerary complex,” in VAST2004, N. S. Y. Chrysanthou, K. Cain and F. Niccolucci, eds., pp. 145–154, Eurographics, (Bruxelles, BE),Dec. 7-10 2004.
14. P. Cignoni, F. Ganovelli, E. Gobbetti, F. Marton, F. Ponchio, and R. Scopigno, “Adaptive tetrapuzzles:Efficient out-of-core construction and visualization of gigantic multiresolution polygonal models,” ACMTrans. on Graphics (SIGGRAPH 2004) 23(3), pp. 796–803, 2004.