Page 1
Tools to Evaluate Runoff from Animal Confinement Areas
- A Pleasant Valley Watershed Case Study -
Wisconsin Land and Water Conservation Association Annual Meeting
March 10, 2015
John Panuska 1 and Laura Ward Good 2
1. Biological Systems Engineering Department 2. Department of Soil Science
UW - Madison
Page 2
The Pollutants - Measured at watershed the outlet -
Water flow - volume Sources: Rainfall runoff Snowmelt runoff Groundwater (base flow)
Sediment Sources: (all delivered via rainfall or snowmelt runoff):
Erosion from overland flow (Sheet/rill) Ephemeral channel erosion (ephemeral gullies) Channel erosion (stream banks, permanent gullies)
Phosphorus
Sources: Particulate P: Same as sediment Direct deposition by cattle
Dissolved P: Same as water flow Release from stream sediments Direct deposition by cattle Nitrate
Sources: Same as water flow, but groundwater predominant
Page 3
The Pollutants - Measured at watershed the outlet -
Water flow - volume Sources: Rainfall runoff Snowmelt runoff Groundwater (base flow)
Sediment Sources: (all delivered via rainfall or snowmelt runoff):
Erosion from overland flow (Sheet/rill) Ephemeral channel erosion (ephemeral gullies) Channel erosion (stream banks, permanent gullies)
Phosphorus
Sources: Particulate P: Same as sediment Direct deposition by cattle
Dissolved P: Same as water flow Release from stream sediments Direct deposition by cattle Nitrate
Sources: Same as water flow, but groundwater predominant
And for barnyards greater unit area loads ( lb/Ac.) of . . .
- Phosphorus - Total Nitrogen, Ammonia and Nitrate - BOD – Biochemical Oxygen Demand - Pathogens
Page 4
Sediment and P Sources
Upland Pastures
Stream Bank Erosion
Crop Lands
Barnyards & Exercise Lots
Cattle Access
Page 5
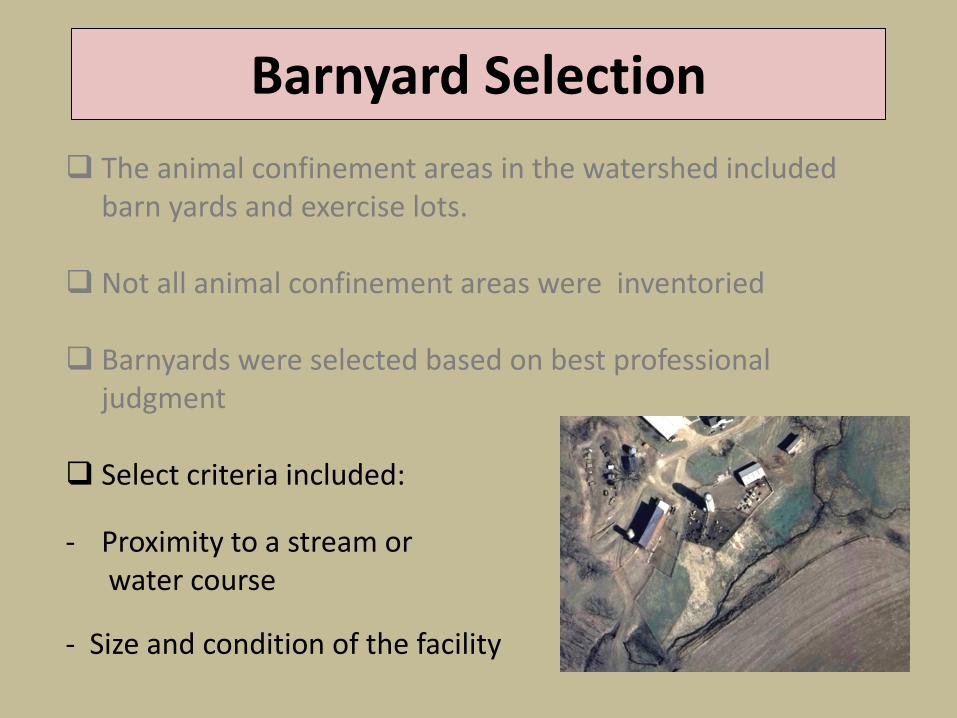
The animal confinement areas in the watershed included barn yards and exercise lots.
Not all animal confinement areas were inventoried
Barnyards were selected based on best professional judgment
Select criteria included:
- Proximity to a stream or water course
- Size and condition of the facility
Barnyard Selection
Page 6
The animal confinement areas in the watershed included barn yards and exercise lots.
Not all animal confinement areas were inventoried
Barnyards were selected based on best professional judgment
Select criteria included:
- Proximity to a stream or water course
- Size and condition of the facility
Barnyard Selection
Page 7
The animal confinement areas in the watershed included barn yards and exercise lots.
Not all animal confinement areas were inventoried
Barnyards were selected based on best professional judgment
Select criteria included:
- Proximity to a stream or water course
- Size and condition of the facility
Barnyard Selection
Page 8
Barnyard Selection
The animal confinement areas in the watershed included barn yards and exercise lots.
Not all animal confinement areas were inventoried
Barnyards were selected based on best professional judgment
Select criteria included:
- Proximity to a stream or water course
- Size and condition of the facility
Page 9
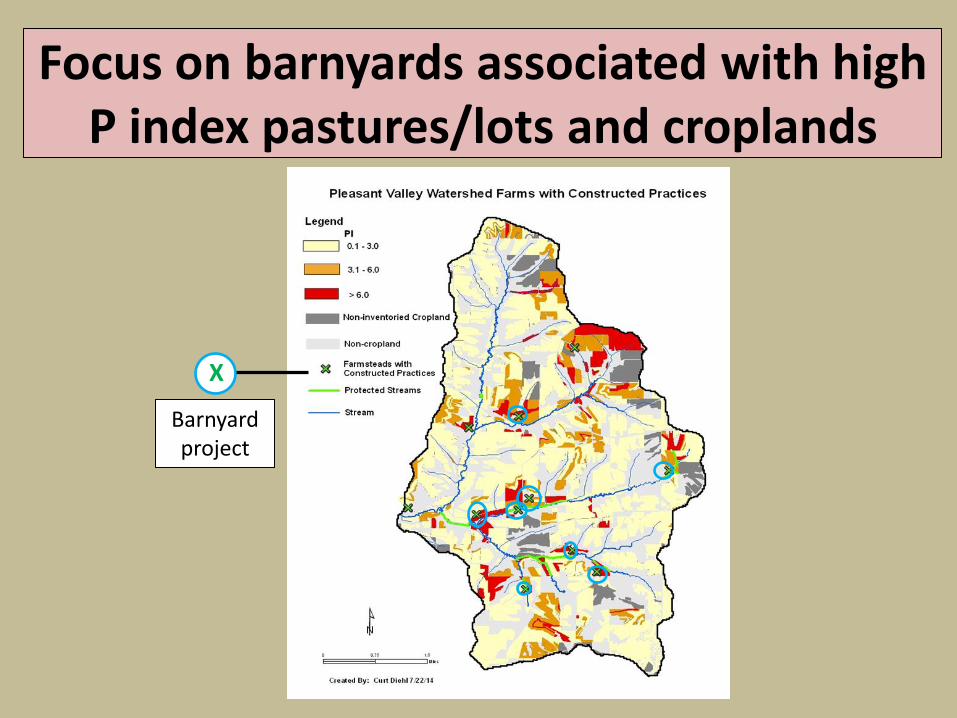
Focus on barnyards associated with high P index pastures/lots and croplands
X
Barnyard project
Page 10
Practices Applied
The Pleasant Valley watershed project completed 8 barnyard runoff control projects
Components:
Clean water diversion Heavy use area protection Vegetative treatment strips Fencing Roof runoff Animal trail and walkway Milk house waste treatment
Page 11
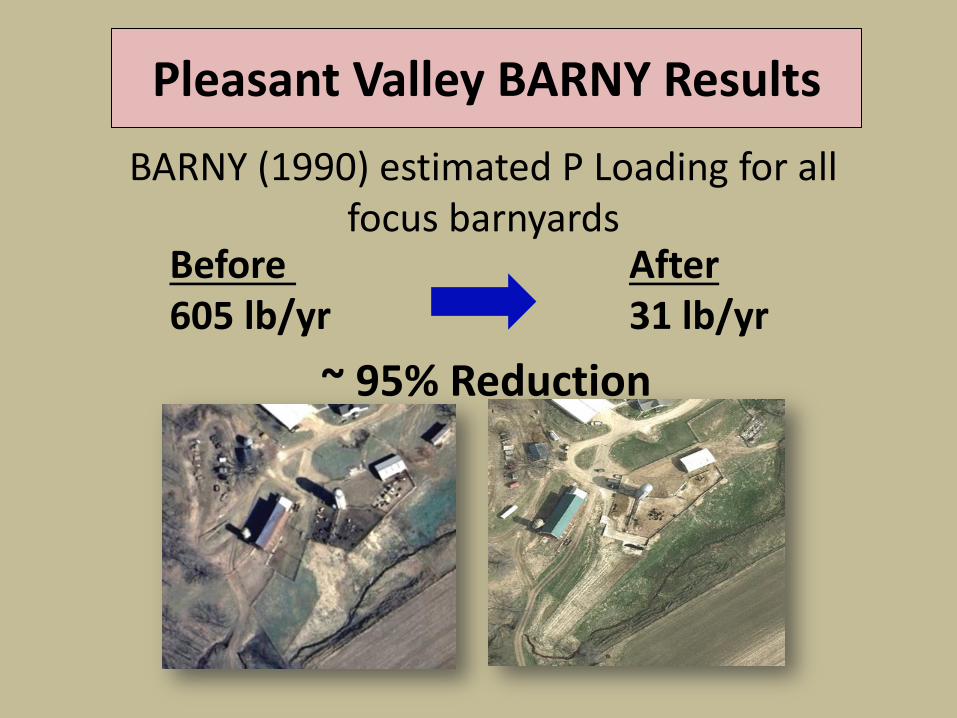
Pleasant Valley BARNY Results
BARNY (1990) estimated P Loading for all focus barnyards
Before After 605 lb/yr 31 lb/yr
~ 95% Reduction
Page 12
Pleasant Valley BARNY Results
BARNY estimated P Loading for all focus barnyards
Before After 605 lb/yr 31 lb/yr
574 lb/yr Reduction
Is this equivalent to 574 lb/yr reduction from P Index or P trade report assessments?
Page 13
Pleasant Valley Case Study Before Project
Lot area: 12,300 Sq. Ft. = 0.28 Ac
Lot type: Earth and concrete mixed
Animals: 100 slaughter steers
Vegetated Filter Area (VTA): None
Tributary Area: 14,010 Sq. Ft. = 0.32 Ac
After Project
Lot area: 12,300 Sq. Ft. = 0.28 Ac
Lot type: Paved with settling basin
Animals: 23 + cow – calf pairs
Vegetated Filter Area (VTA): 32 ft x 226 ft , 1.7 %
Tributary Area: 970 Sq. Ft. = 0.022 Ac
Page 14
Evaluation Tools
SNAP-Plus NM Planning Tool
Page 15
Evaluation Tools
Originally developed by USDA – ARS in the late 1970’s as a feedlot rating system. BARNY was created by cooperative effort of WDNR, SCS
(NRCS), WDATCP to agree to the parameters used in the model.
Last DOS version (2.5) was developed in1995. Spreadsheet versions available through NRCS and DATCP (NRCS Buffer Design Tool).
The BARNY Model
Page 16
Evaluation Tools APLE - Lots Model
APLE – Lots TP validation used 12 published studies with 35 site-years of data; r2 = 0.91.
Page 17
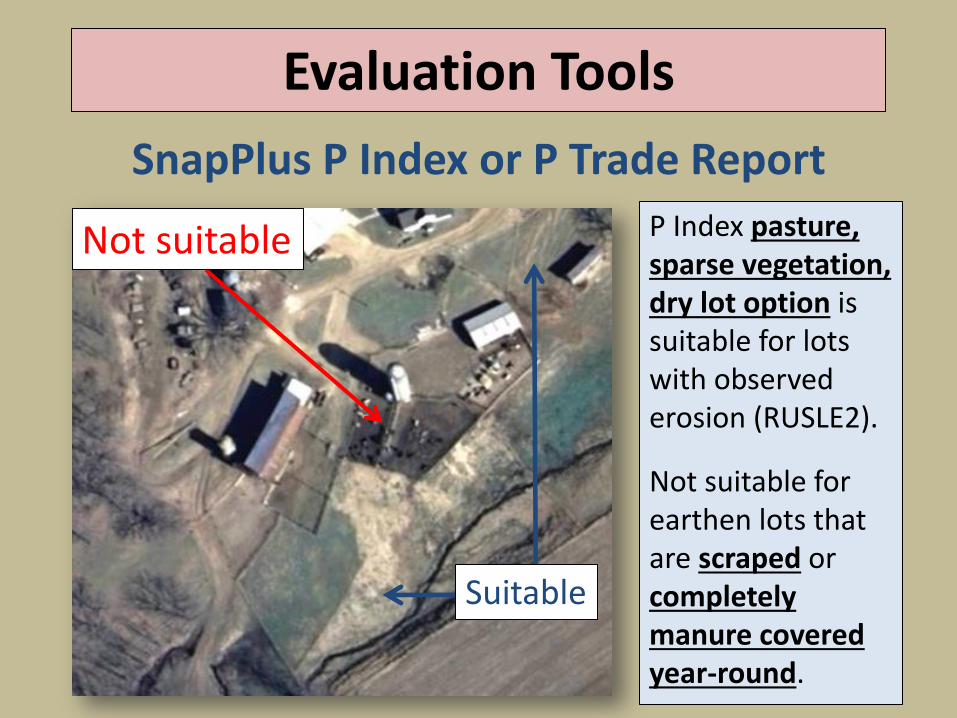
Evaluation Tools
SnapPlus P Index or P Trade Report
Not suitable
Suitable
P Index pasture, sparse vegetation, dry lot option is suitable for lots with observed erosion (RUSLE2).
Not suitable for earthen lots that are scraped or completely manure covered year-round.
Page 18
Pleasant Valley Case Study
Before
After
BARNY 2.5 (DOS)
88
85
BARNY (Spreadsheet)
80
56 1
APLE-Lots
105
81 2
Edge of Lot Phosphorus Loss (lb / yr)
1 Load reduction from removing tributary areas flowing into the lot. 2 Load reduction from regular cleaning of concrete lot.
Page 19
Pleasant Valley Case Study
Before
After With basin and
filter
BARNY 2.5 (DOS)
88
85
0
BARNY (Spreadsheet)
80
56 10
APLE-Lots
105
81
NA
Lot Runoff Phosphorus Loss (lb/yr)
Page 20
Phosphorus Loss Prioritization
The P Index / P Trade Report (SnapPlus) gives TP loss estimates similar the BARNY 2005
spreadsheet or APLE lots for cropland / pastures
- - - - - - -
These tools appear adequate for
prioritization
Page 21
Model Summary
There are several barnyard evaluation tools available. The BARNY DOS model is not supported and will not
run on newer operating systems. APLE-Lots (Vadas et. al., 2015) improves the algorithm
accuracy for lot P export from the original BARNY.
APLE-Lots does not account for tributary inflow or Buffer removal levels.
Page 22
Model Summary
There are several barnyard evaluation tools available. The BARNY DOS model is not supported and will not
run on newer operating systems. APLE-Lots (Vadas et. al., 2015) improves the algorithm
accuracy for lot P export from the original BARNY.
APLE-Lots does not account for tributary inflow or Buffer removal levels.
Page 23
Model Summary
There are several barnyard evaluation tools available. The BARNY DOS model is not supported and will not
run on newer operating systems. APLE-Lots (Vadas et. al., 2015) improves the algorithm
accuracy for lot P export from the original BARNY.
APLE-Lots does not account for tributary inflow or Buffer removal levels.
Page 24
Model Summary
There are several barnyard evaluation tools available. The BARNY DOS model is not supported and will not
run on newer operating systems. APLE-Lots (Vadas et. al., 2015) improves the algorithm
accuracy for lot P export from the original BARNY.
APLE-Lots does not account for tributary inflow or Buffer removal levels.
Page 25
Challenges Moving Forward
BARNY Spreadsheet, APLE-Lots, and SnapPlus/P Index (exercise lots) appear to be adequate at this time to prioritize remediation efforts.
TMDLs / pollutant trading will drive the need to improve loading estimates from all tools.
Model consistency and maintenance will be an ongoing challenge.
Efforts are needed to develop a single “best science” tool that is supported.
Page 26
Challenges Moving Forward
BARNY Spreadsheet, APLE-Lots, and SnapPlus/P Index (exercise lots) appear to be adequate at this time to prioritize remediation efforts.
TMDLs / pollutant trading will drive the need to improve loading estimates from all tools.
Model consistency and maintenance will be an ongoing challenge.
Efforts are needed to develop a single “best science” tool that is supported.
Page 27
Challenges Moving Forward
BARNY Spreadsheet, APLE-Lots, and SnapPlus/P Index (exercise lots) appear to be adequate at this time to prioritize remediation efforts.
TMDLs / pollutant trading will drive the need to improve loading estimates from all tools.
Model consistency and maintenance will be an ongoing challenge.
Efforts are needed to develop a single “best science” tool that is supported.
Page 28
Challenges Moving Forward
BARNY Spreadsheet, APLE-Lots, and SnapPlus/P Index (exercise lots) appear to be adequate at this time to prioritize remediation efforts.
TMDLs / pollutant trading will drive the need to improve loading estimates from all tools.
Model consistency and maintenance will be an ongoing challenge.
Efforts are needed to develop a single “best science” tool that is supported.