21
Industries, Inc. Tootsie Roll Annual Report 2014

Industries, Inc.Tootsie Roll
Annual Report 2014

On January 20, 2015, Melvin J. Gordon, Chairman of the Board of Directorsand Chief Executive Officer of Tootsie Roll Industries, passed away at theage of 95 after a brief illness. Mr. Gordon joined the board of what wasthen Sweets Company of America in 1952 and was elevated to the roles ofChairman and CEO in 1962. Sales at that time were $25 million, profitswere $1 million and our product line primarily consisted of Tootsie Rollsand Tootsie Pops.
Mr. Gordon, a man of great vision and drive, reshaped the Company overhis long tenure. Early on, he changed the Company’s name to Tootsie RollIndustries in recognition of the flagship brand and relocated the Companyto a large, centrally located facility in Chicago which remains theCompany’s headquarters and its largest plant. He expanded operationsinto Mexico and led the Company through a series of complementaryacquisitions which added Dots, Crows, Cella’s, Charms, Blow Pop, JuniorMints, Charleston Chew, Sugar Daddy, Sugar Babies, Fluffy Stuff, Andes,Dubble Bubble, Cry Baby and Nik-L-Nip to our portfolio of well-knownbrands.
Mr. Gordon embraced change and was quick to adopt rapidly evolvingtechnological developments in manufacturing, material handling andinformation technology. He also directed the development of new products
and package configurations to meet changing consumer preferences and evolving trade channels. Throughout his many years as Chairman,the Company saw great growth and success. Today Tootsie Roll is a leading confectioner with a diverse portfolio of well-known brands, sevenplants across the United States, Canada and Mexico, and sales in many countries throughout the world.
Mr. Gordon’s life represented the very highest values in business, wisdom, generosity, and integrity. His dedication to Tootsie Roll for over fiftyyears as Board Chair, his creativity, his optimism and his relentless determination to succeed were an inspiration to all who knew him.
Melvin J. Gordon1919 - 2015
Merrill Corp - Tootsie Roll 10-K ED [AUX] | 105914 | 02-Mar-15 09:16 | 15-2394-1.ba | Sequence: 1CHKSUM Content: 6671 Layout: 7220 Graphics: 8844 CLEAN
JOB: 15-2394-1 CYCLE#;BL#: 7; 0 TRIM: 11" x 8.5" COMPOSITECOLORS: Black, ~note-color 2, ~note-color 3 GRAPHICS: melvin_gordon_ED_4c_photo.eps V1.5

We believe that the differences among companies areattributable to the caliber of their people, and therefore we striveto attract and retain superior people for each job.
We believe that an open family atmosphere at work combinedwith professional management fosters cooperation and enableseach individual to maximize his or her contribution to theCompany and realize the corresponding rewards.
We do not jeopardize long-term growth for immediate, short-termresults.
We maintain a conservative financial posture in the deploymentand management of our assets.
We run a trim operation and continually strive to eliminate waste,minimize cost and implement performance improvements.
We invest in the latest and most productive equipment to deliverthe best quality product to our customers at the lowest cost.
We seek to outsource functions where appropriate and tovertically integrate operations where it is financiallyadvantageous to do so.
We view our well known brands as prized assets to beaggressively advertised and promoted to each new generationof consumers.
We conduct business with the highest ethical standards andintegrity which are codified in the Company’s “Code of BusinessConduct and Ethics.”
Corporate Principles
Financial Highlights December 31, 2014 2013 (in thousands except per share data)
Net Product Sales . . . . . . . . . . . . . . . $539,895 $539,627Net Earnings Attributable to Tootsie
Roll Industries, Inc. . . . . . . . . . . . 63,298 60,849Working Capital . . . . . . . . . . . . . . . . 200,162 179,990Net Property, Plant and
Equipment . . . . . . . . . . . . . . . . . . 190,081 196,916Shareholders’ Equity . . . . . . . . . . . . . 690,809 680,305Average Shares Outstanding* . . . . . 60,562 61,399Per Share Items*Net Earnings Attributable to Tootsie
Roll Industries, Inc. . . . . . . . . . . . $1.05 $0.99Cash Dividends Paid . . . . . . . . . . . . 0.32 0.24
*Adjusted for stock dividends.
Corporate ProfileTootsie Roll Industries, Inc. has been engaged in themanufacture and sale of confectionery products for 118 years.Our products are primarily sold under the familiar brand names:Tootsie Roll, Tootsie Roll Pops, Caramel Apple Pops, Child’sPlay, Charms, Blow Pop, Blue Razz, Cella’s chocolate coveredcherries, Tootsie Dots, Tootsie Crows, Junior Mints, JuniorCaramels, Charleston Chew, Sugar Daddy, Sugar Babies,Andes, Fluffy Stuff cotton candy, Dubble Bubble, Razzles,Cry Baby, Nik-L-Nip and EI Bubble.
Merrill Corp - Tootsie Roll 10-K ED [AUX] | 105969 | 27-Feb-15 18:27 | 15-2394-1.ba | Sequence: 2CHKSUM Content: 10175 Layout: 12193 Graphics: 6845 CLEAN
JOB: 15-2394-1 CYCLE#;BL#: 6; 0 TRIM: 11" x 8.5" COMPOSITECOLORS: Black, ~note-color 2, ~note-color 3 GRAPHICS: Tootsie_roll_candy_lrg_logo.eps V1.5

To Our Shareholders
1
Net product sales in 2014 were$539.9 million, as compared to2013 net product sales of$539.6 million. Most of our corebrands posted solid results, andHalloween was once again ourlargest selling season of the year.
Net earnings grew to $63.3 millionin 2014 from $60.8 million in 2013.Earnings per share were $1.05 in2014, up from $0.99 in the 2013,due to the combination of higherearnings and fewer sharesoutstanding in 2014.
The increase in earnings wasattributable to margin improvementsstemming from lower input costs in2014. We are pleased that we aremaking progress on restoring ourmargins to their historical levelsbefore the increases in commodityand other input costs in past years.In order to achieve our profit goalsand still deliver maximum value toour consumers, we are challengedto look for every feasible way tokeep our operations lean and costsin check.
As a value oriented confectioner,we deem it essential to be a lowcost producer. We actively pursueinvestments in the latesttechnology to keep us so. We takea long-term view of our businessand enact only those measuresthat improve our operating resultswithout jeopardizing the long-termstrength of the Company and itswell-known brands.
In this regard, capital expenditureswere $10.7 million in 2014. Inaddition to new state of the artmaterial handling and packagingequipment at a number of ourplants, a portion of this figure wasdirected toward a significantinformation technology project. Weremain committed to enhanceproductivity through the deploymentof leading edge business software.
During 2014, we paid cashdividends of 32 cents per shareand again distributed a 3% stockdividend. This was the seventy-second consecutive year theCompany has paid cash dividendsand the fiftieth consecutive yearthat a stock dividend wasdistributed. We also repurchasedshares of common stock on theopen market.
We ended 2014 with $224.0 millionin cash and investments net ofinterest bearing debt andinvestments that hedge deferredcompensation liabilities. We remain
poised to continue investing in ourbusiness, improving manufacturingproductivity and quality, supportingour brands, paying dividends andrepurchasing common stock. Wealso continue to seek appropriatecomplementary businessacquisitions.
Sales and MarketingOur diverse and highly recognizablebrand portfolio is popular across alltrade channels. We have a range ofofferings suitable for virtually everymajor consumer group and retailformat. During 2014, we again usedcarefully executed and channel-specific promotions to drive sales.These targeted initiatives, directedboth to the trade and to consumers,help to move our products intodistribution and subsequently tomove them off the retail shelf. Wefind that emphasizing highsell-through and attractive profitmargins to the trade and a highquality, attractive value to theconsumer is a winning strategy.
Halloween has long been ourlargest selling period, with thirdquarter sales nearly double those ofany other quarter in the year. Weposted strong results last Halloweenin all major trade classes includinggrocery, mass merchandisers,warehouse clubs, dollar stores anddrug chains. Especially popular areour large bags of Child’s Play andother mixed candy assortments,
Ellen R. Gordon, Chairman and Chief Executive Officer
Merrill Corp - Tootsie Roll 10-K ED [AUX] | 105969 | 27-Feb-15 18:27 | 15-2394-1.bc | Sequence: 1CHKSUM Content: 17732 Layout: 5093 Graphics: 49934 CLEAN
JOB: 15-2394-1 CYCLE#;BL#: 6; 0 TRIM: 11" x 8.5" COMPOSITECOLORS: Black, ~note-color 2, ~note-color 3 GRAPHICS: ellen_gordon_ED_4c_photo.eps V1.5

which are offered in a variety ofpack sizes and merchandisingpresentations including palletpacks, off-shelf displays and displayready cases.
The candy marketplace is highlycompetitive and we are vigilant inkeeping our products contemporaryeven as they remain iconic. Ourproduct line undergoes continualrefinement in order to retain itsappeal to ever-evolving preferencesand life styles.
Building on the success of ourCaramel Apple Pops, our Blow Popline was expanded with theaddition of Caramel Apple BlowPops. With a candy shell ofluscious caramel entwined with tartgreen apple hard candy and itsemblematic bubble gum center,this unique new confection is reallythree treats in one!
Caramel Apple Blow Pops
The selling power of floor standdisplays is well established, butsome smaller retail venues maylack the floor space or sales volumeto support a traditionally sizeddisplay. To meet this need, weintroduced a new one-eighth size
pallet of Tootsie Rolls and TootsiePops in bonus bags. This displayhas the dual attributes of increasingsales velocity for the retailer andattractive feature pricing for theconsumer.
1/8 Pallet Display
The addition of a new floor displayalso contributed added sales in ourpenny goods line. The half palletFrootie shipper consists of192 bags of the most popularflavors, Blue Razz, Fruit Punch,Green Apple and Strawberry, andwas well received in the Cash andCarry class of trade. The Frootieline was further expanded with theaddition of tart new Lemon-LimeFrooties.
Lemon Lime Frooties
For Dots lovers, the next big thing ishere—the BIG BOX! Featuring20.5 ounces of delicious fruitflavored Dots in a reclosable box,this eye-catching pack promiseslots of Dots for the whole family toshare!
Dots BIG BOX
We put some fizz in gumball funwith the introduction of DubbleBubble Fizzers. Pop one of fivefizzy soda flavors in your mouth andbite down for a unique effervescentexperience of bubble-blowing fun!
Dubble Bubble Fizzers
Consumers have becomeincreasingly concerned withprotecting the environment, andmanufacturers are seekinginnovative ways to minimizepackaging. One such solution thatwe implemented in 2014 was in ourgumball machine refill packs. Byreplacing bulky, rigid plastic jarswith lightweight resealable flexiblepouches, packaging weight wasreduced considerably withoutcompromising product freshness.
Gumball refill pouch
Our Andes Crème de Menthe thinshave a strong selling history during
2
Merrill Corp - Tootsie Roll 10-K ED [AUX] | 105969 | 27-Feb-15 18:27 | 15-2394-1.bc | Sequence: 2CHKSUM Content: 47156 Layout: 59002 Graphics: 52142 CLEAN
JOB: 15-2394-1 CYCLE#;BL#: 6; 0 TRIM: 11" x 8.5" COMPOSITECOLORS: Black, ~note-color 2, ~note-color 3 GRAPHICS: blow_pop_k_photo.eps, db_fizzers_bubble_k_photo.eps, dots_super_k_photo.eps, dubble_bubble_bag_k_photo.eps, frooties_lemon_k_photo.eps, tootsie_value_bags_k_photo.eps V1.5

4
Management’s Discussion and Analysis of Financial Condition and Results of Operations(in thousands except per share, percentage and ratio figures)
FINANCIAL REVIEW
This financial review discusses theCompany’s financial condition,results of operations, liquidity andcapital resources, significantaccounting policies and estimates,new accounting pronouncements,market risks and other matters. Itshould be read in conjunction withthe Consolidated FinancialStatements and related footnotesthat follow this discussion.
FINANCIAL CONDITION
The Company’s overall financialposition remains very strong as aresult of its improving 2014 grossprofit margins, higher net earningsand strong cash flows provided byoperating activities. Cash flowsfrom 2014 operating activitiestotaled $88,769 and were used topay cash dividends of $19,241,purchase and retire $25,020 of itsoutstanding shares, make capitalexpenditures of $10,704, and addto our marketable securitiesinvestments.
The Company’s net working capitalwas $200,162 at December 31,2014 compared to $179,990 atDecember 31, 2013 whichgenerally reflects higher cash andcash equivalents and short-terminvestments. As of December 31,2014, the Company’s aggregatecash, cash equivalents andinvestments, including all long-terminvestments in marketable
securities, was $303,137 comparedto $270,387 at December 31, 2013,an increase of $32,750. Theaforementioned includes $71,682and $63,215 in trading securities asof December 31, 2014 and 2013,respectively. The Company investsin trading securities to provide aneconomic hedge for its deferredcompensation liabilities, as furtherdiscussed herein and in Note 7 tothe Consolidated FinancialStatements.
Shareholders’ equity increased from$680,305 at December 31, 2013 to$690,809 as of December 31, 2014,principally reflecting 2014 netearnings of $63,298, less cashdividends of $19,241, sharerepurchases of $25,020, and anincrease in accumulated othercomprehensive loss during 2014.
The Company has a relativelystraight-forward financial structureand has historically maintained aconservative financial position.Except for an immaterial amount ofoperating leases, the Company hasno special financing arrangementsor “off-balance sheet” specialpurpose entities. Cash flows fromoperations plus maturities ofshort-term investments areexpected to be adequate to meetthe Company’s overall financingneeds, including capitalexpenditures, in 2015. Periodically,the Company considers possibleacquisitions, and if the Companywere to pursue and complete such
an acquisition, that could result inbank borrowings or other financing.
Results of Operations
2014 vs. 2013
Net product sales in fourth quarter2014 increased by 1.8% to$137,929, and twelve months netproduct sales increased by $268 or0.1% to $539,895 in 2014. Oursales results in the United Statesreflect the challenges of certain ofour retail customers regardingconsumer sales and consumerspending. Overall, 2014 salesvolumes in the United States wererelatively even with 2013, and therewere no significant changes inselling prices and price realization,or product mix. Lower sales inMexico and Canada, including theeffects of a weaker Mexican pesoand Canadian dollar, respectively,also adversely affected ourreported sales during these samecomparative periods.
Product cost of goods sold were$340,933 in 2014 compared to$350,960 in 2013, a decrease of$10,027 or 2.9%. Product cost ofgoods sold includes $1,140 and$2,457 in certain deferredcompensation expenses in 2014and 2013, respectively. Thesedeferred compensation expensesprincipally result from changes inthe market value of investments andinvestment income from tradingsecurities relating to compensationdeferred in previous years and are
not reflective of current operatingresults. Adjusting for theaforementioned, product cost ofgoods sold decreased from$348,503 in 2013 to $339,793 in2014, a decrease of $8,710 or2.5%. As a percent of net productsales, these adjusted costsdecreased from 64.6% in 2013 to62.9% in 2014, a favorabledecrease of 1.7% as a percent ofnet product sales. Although ouroverall comparative ingredientcosts are more favorable this year,certain key ingredient costs werehigher in 2014 compared to 2013.We are continuing our focus on costreductions and savings, includingcapital investments to achievemanufacturing efficiencies, and aremaking progress on restoring ourmargins to their historical levelsbefore the increases in commodityand other input costs in past years.
Selling, marketing andadministrative expenses were$117,722 in 2014 compared to$119,113 in 2013, a decrease of$1,391 or 1.2%. Selling, marketingand administrative expensesinclude $3,761 and $8,131 incertain deferred compensationexpenses in 2014 and 2013,respectively. These deferredcompensation expenses principallyresult from changes in the marketvalue of investments andinvestment income from tradingsecurities relating to compensationdeferred in previous years and arenot reflective of current operating
Merrill Corp - Tootsie Roll 10-K ED [AUX] | 105969 | 27-Feb-15 18:27 | 15-2394-1.ca | Sequence: 1CHKSUM Content: 56577 Layout: 49081 Graphics: No Graphics CLEAN
JOB: 15-2394-1 CYCLE#;BL#: 6; 0 TRIM: 11" x 8.5" COMPOSITECOLORS: Black, ~note-color 2, ~note-color 3 GRAPHICS: none V1.5
the Thanksgiving and ChristmasHoliday seasons. Andes has alsohad great success selling outsidethe candy aisle with Andes Crèmede Menthe Baking Chips, whichhave become the top selling mintbaking chip. In 2014, we promotedthe minty merriment of baking withAndes Recipe Contest. Visitwww.tootsie.com to check out thewinning entries and other deliciousAndes recipes!
Advertising and Public Relations
During 2014, we continued ourinitiative of engaging withconsumers through social media.Numerous game experiences,banner ads and prize contestentries on Facebook, Twitter,Instagram and Pinterest build andstrengthen connections to ourbrands and also provide a venuefor consumer feedback.
Mr. Owl and the long-standing“How Many Licks” Tootsie Popmessage are prominently featuredin our social media program and inour television advertisingcampaigns. This renowned themehas become part of Americana,ranging from crossword puzzles toscientific studies.
Most recently a group of NYUgraduate students developed amodel to analyze how fluidsdissolve various materials, andapplied it to the Tootsie Pop. Theiralgorithm concluded that it wouldtake precisely one thousand licks toget to the chewy Tootsie Roll center.We will add this data point to thethousands of estimates we havereceived over the many years.Nonetheless, we can only concludethat the answer to this riddle remains“the world may never know!”
PurchasingCost decreases in sugar, cornsyrup, cocoa powder, edible oilsand packaging were partially offsetby increases in coatings, dairyproducts and gum basecomponents. In packaging thedecrease was primarily due tolower corrugated prices.
Though the cost of many of thecommodities we use is lower thanrecent record highs, some remainwell above their historical levels andrestoring margins continues to beone of our objectives. Competitivebidding, selective hedging andleveraging our high volume ofpurchases are some of the meanswe use to mitigate input costs to thegreatest extent feasible.
Supply Chain
We continue to invest capital andresources in projects that keep ourproduction and distribution facilitiesas efficient as possible, supportevolving distribution patterns,improve quality and supportgrowing product lines. Much of thisinvestment is driven by continuingadvancements in automationtechnology that we can incorporateon the shop floor.
Considerable effort is made indesigning new installations tomaximize their flexibility so that wecan respond to evolving packageconfigurations or productassortments demanded by themarket. Incorporating such flexibilitycan add significant up-front costs.We are fortunate to have sufficientfinancial resources and are able tomake these necessary investments.
International
In Mexico we manufacture and sellproducts primarily under thetrademark Tutsi. Most of ourdomestic brands are also sold inCanada, though for certain itemsthey are offered in differentpackage configurations and atdifferent price points which aretailored to that market.
We also export our products tomany countries in Europe, Asia,and South and Central America.During 2014, we increased ourownership percentage in FleerEspanola, a Spanish manufacturerof sugared and sugar free gum. Weare currently rebranding a numberof their sugared offerings under theDubble Bubble umbrella and hopeto expand our presence in Europeand the Middle East.
In Appreciation
We wish to express ourappreciation to our many loyalemployees, customers, suppliers,sales brokers and distributorsthroughout the world for theirsupport in 2014. We also thank ourfellow shareholders as we remaincommitted to the pursuit ofexcellence in every aspect of ouroperations and face the increasingchallenges of today’s businessenvironment.
Ellen R. GordonChairman of the Board and Chief Executive Officer
3
Merrill Corp - Tootsie Roll 10-K ED [AUX] | 105969 | 27-Feb-15 18:27 | 15-2394-1.bc | Sequence: 3CHKSUM Content: 63384 Layout: 32257 Graphics: 10063 CLEAN
JOB: 15-2394-1 CYCLE#;BL#: 6; 0 TRIM: 11" x 8.5" COMPOSITECOLORS: Black, ~note-color 2, ~note-color 3 GRAPHICS: ellen_r_gordon_sig.eps V1.5
cited by Jeremy Siegel in his popular We also undertook a comprehensive We believe that our well knownInformation Technology andproducts, including the additions ofstudy to examine our supply chain inbook ‘‘The Future for Investors’’ as Internal ControlsDubble Bubble and other Concord2005. The focus was onhaving delivered the fourth highestbrands, offers a compelling andreengineering the network andreturn to our shareholders among allbroad assortment of items that canpatterns of distribution, As a result ofsurviving S & P 500 firms from the Our principal information technologybe extended to additional foreignthis study, certain changes wereoriginal index first published in 1957, efforts during 2005 were in supportmarkets.implemented in 2005 and otherand the highest among food of the Concord integration and the
recommendations that arose fromcompanies. We place a high value supply chain reengineering projects.this study are expected to beon ethics, corporate leadership and The former involved migrating
In Appreciationimplemented early in 2006. Wecreating shareholder value over the Concord onto all of our financial andanticipate cost savings, lowerlong-term, and are gratified to business systems, while the latterinventories and even better customerreceive distinctions such as these. required programming modifications We wish to thank our loyalfulfillment as a result of this project. to support the business process employees, customers, suppliers,
changes that were made. sales brokers, foreign distributorsIn one of the more unusual storiesand fellow shareholders for theirAs in all aspects of our business, wewe learned of in 2005, our El Bubblemany years of support. We are alsokeep a sharp focus on costbubble gum cigars were used by We consider state of the artgrateful to the many consumers whocontainment. Capital projects,astronaut Mike Fincke to celebrate information technology to be a keybuy and use our products forprocess reengineering and employeethe birth of his daughter, Tarali strategic tool to deliver informationmaking them a lasting part oftraining and development are all vitalPaulina. While El Bubble has long and support process refinementsAmericana.components of this process.been a fun and safe way to that enable the Company to remain
commemorate such a special competitive in today’s rapidlyoccasion, this marked the first time a evolving business environment. It isbaby was born to an astronaut while also a key component of our internalPurchasingin orbit-and the first time, to our control system, which wasknowledge, that one of our products successfully tested and audited
Although 2005 was another year ofwas brought aboard the international during 2005, our second year ofgenerally low inflation as measured compliance with the requirements ofspace station!by the Consumer Price Index, we Melvin J. GordonSection 404 of the Sarbanes-Oxley
Chairman of the Board andexperienced cost pressure in certain Act.Chief Executive Officeringredients, packaging,Manufacturing and Distribution transportation, fuel and energy. We
continue to use hedging programs to Internationalmoderate short-term commodityDuring 2005 we continued workingprice fluctuations and to useon key projects that were initiated incompetitive bidding, volume Our international sales increasedprior years, including thepurchasing and other means to during 2005 as a result of a full yearreengineering and start up of amitigate costs to the fullest extent of Concord foreign sales in additionmajor production line. We also Ellen R. Gordonpossible. to a strong year in Mexico. We President andapproved several new projects to
Chief Operating Officermanufacture and sell products inexpand capacity in support ofMexico under the Tutsi trademark.growing product categories in We also completed the integration ofWe also sell Tootsie, Charms andaddition to ongoing efforts to procurement activities related toConcord products to Canada andstreamline and automate existing Concord into our bidding processesover 75 other countries in Europe,processes at all of our plants, in and purchasing and MRP systems
during 2005. Asia and South and Central America.order to realize cost savings.
4

6
on approximately $5,400 and$11,000 of foreign subsidiaries’undistributed earnings as ofDecember 31, 2014 andDecember 31, 2013, respectively,because such earnings areconsidered to be permanentlyreinvested. The Company estimatesthat the federal income tax liabilityon such undistributed earningswould approximate 30% of theseamounts.
Net earnings attributable to TootsieRoll Industries, Inc. were $63,298 in2014 compared to $60,849 in 2013,and earnings per share were $1.05and $0.99 in 2014 and 2013,respectively, an increase of $0.06 or6.1%. Net earnings principallybenefited from improved grossprofit margins which are discussedabove. Net earnings for the prioryear 2013 benefited from a lowereffective income tax rate and acapital gain on the sale of aninvestment security (JeffersonCounty Warrants discussed above),both of which adversely affects thecomparison of 2014 net earnings tothose in 2013. Earnings per share in2014 benefited from the reductionin average shares outstandingresulting from purchases of theCompany’s common stock in theopen market by the Company.Average shares outstandingdecreased from 61,399 in 2013 to60,562 in 2014.
During first quarter 2014, theCompany gained operating controlof its two 50% owned Spanishcompanies when Companyemployee representatives assumedall positions on their boards ofdirectors. This was considered a
step acquisition, whereby theCompany remeasured thepreviously held investment to fairvalue in first quarter 2014. As aresult, the Company’s first quarter2014 net earnings include a netloss of $529, including an additionalincome tax provision of $2,350relating to deferred income taxes.During 2014, the Company furtherincreased its control and ownershipto 83% by purchasing andsubscribing to additional commonshares of its Spanish subsidiariesfor approximately $1,400 ($1,200was paid in 2014, and the balancewill be paid in 2015). TheseSpanish companies had operatinglosses for each of the years 2008through 2014. Companymanagement has restructured theSpanish operations and made otherchanges to its business plan, andmanagement believes that theyshould be nearing break-even cashflows from operating activities goingforward. Management believes thatthe business, competitive andeconomic challenges in Spain arelikely to continue, and therefore,additional cash financing of theseSpanish companies may berequired in the future. Otherincome, net in prior year 2013includes the results of theCompany’s 50% share of twoSpanish companies which wereaccounted for using the equityinvestment method in 2013. Equitymethod losses were $967 for 2013.In addition, a pre-tax impairmentcharge of $975 was recorded in2013 to write-down the Company’scarrying value of this equityinvestment to estimated fair value.
Beginning in 2012, the Companyreceived notices from the Bakery,Confectionery, Tobacco Workersand Grain Millers InternationalUnion (BC&T) Pension Plan (Plan),a multi-employer defined benefitpension plan for certain Companyunion employees. The noticesindicated that the Plan’s actuarycertified the Plan to be in criticalstatus, the “Red Zone”, as definedby the Pension Protection Act (PPA)and the Pension Benefit GuarantyCorporation (PBGC), and that aplan of rehabilitation was adoptedby the trustees of the Plan in fourthquarter 2012. The rehabilitationplan, which continues, requires thatemployer contributions include 5%compounded annual surchargeincreases each year for anunspecified period of timebeginning January 2013 (in additionto the 5% interim surcharge initiatedin June 2012) as well as certainplan benefit reductions. Under theplan of rehabilitation, the Plan isprojected to emerge from criticalstatus sometime beyond a 30 yearprojection period. In the event thata plan does not have the financialresources to ultimately pay benefitsat a level specified by law, then itmust apply to the PBGC forgovernment financial assistance.The Trustees have advised thatneither the PPA nor regulatoryguidance currently defines therehabilitation standards for a planthat is not designed to emerge fromcritical status within the prescribed10-year rehabilitation period.Recently enacted legislation(Multiemployer Pension Reform Actof 2014) may also affect the futureof this Plan.
The Company was previouslyadvised by the Plan that if theCompany had withdrawn from thePlan during 2012 its estimatedwithdrawal liability would have been$37,200. The Company wasrecently advised by the Plan that itswithdrawal liability would have been$56,400 if it had withdrawn from thePlan during 2014. The increasefrom 2012 to 2014 principallyreflects changes in key actuarialassumptions, principally the effectsof a lower interest rates proscribedby PBGC which were partially usedto determine the present value ofvested benefits, and a change to amore conservative mortality table.Based on the Company’s actuarialstudy and certain provisions inERISA relating to withdrawal liabilitypayments, management believesthat the Company’s liability wouldbe limited to twenty annualpayments of $2,999 which have apresent value of $35,193 based onthe minimum funding interest rate of6.5% used by the Plan. Should theCompany actually withdraw fromthe Plan at a future date, awithdrawal liability, which could behigher than the above discussedamounts, could be payable to thePlan.
The Company’s existing laborcontract with its BC&T local unioncommits the Company’sparticipation in this Plan throughthird quarter 2017. Pensionexpense, including surcharges, forthe BC&T Plan for 2014 and 2013was $2,588 and $2,231,respectively. The aforementionedexpense includes surchargeincreases of $342 and $242 in 2014and 2013, respectively, related to
Merrill Corp - Tootsie Roll 10-K ED [AUX] | 105969 | 27-Feb-15 18:27 | 15-2394-1.ca | Sequence: 3CHKSUM Content: 65070 Layout: 21341 Graphics: No Graphics CLEAN
JOB: 15-2394-1 CYCLE#;BL#: 6; 0 TRIM: 11" x 8.5" COMPOSITECOLORS: Black, ~note-color 2, ~note-color 3 GRAPHICS: none V1.5
5
results. Adjusting for theaforementioned, selling, marketingand administrative expensesincreased from $111,002 in 2013 to$113,961 in 2014, an increase of$2,959 or 2.7%. As a percent of netproduct sales, these adjustedexpenses increased slightly from20.6% of net product sales in 2013to 21.1% of net product sales in2014. Selling, marketing andadministrative expenses include$46,525 and $45,367 of freight,delivery and warehousing expensesin 2014 and 2013, respectively,which increased slightly from 8.4%of net product sales in 2013 to 8.6%of net product sales in 2014.
The Company believes that thecarrying values of its goodwill andtrademarks have indefinite lives asthey are expected to generate cashflows indefinitely. In accordancewith current accounting guidance,these indefinite-lived intangibleassets are assessed at leastannually for impairment as ofDecember 31 or whenever eventsor circumstances indicate that thecarrying values may not berecoverable from future cash flows.No impairments were recorded in2014 or 2013. The fair values oftrademarks are assessed each yearusing the present value ofestimated future cash flows andestimated royalties. Based on theCompany’s estimate atDecember 31, 2014, the individualfair values of the indefinite livedintangible assets exceed the netbook value by more than 10%. Forcertain trademarks, holding all otherassumptions constant at the testdate, a 100 basis point increase inthe discount rate or a 100 basis
point decrease in the royalty ratewould reduce the fair value ofcertain trademarks byapproximately 15% and 11%,respectively. Individually, a 100basis point increase in the discountrate would indicate a potentialimpairment of approximately $2,000as of December 31, 2014. However,if the royalty rate were decreasedby 100 basis points no impairmentwould be indicated as ofDecember 31, 2014.
Earnings from operations were$83,923 in 2014 compared to$72,353 in 2013, an increase of$11,570. Earnings from operationsinclude $4,901 and $10,588 incertain deferred compensationexpense in 2014 and 2013,respectively, which are discussedabove. Adjusting for these deferredcompensation expenses, earningsfrom operations increased from$82,941 in 2013 to $88,824 in 2014,an increase of $5,883 or 7.1%. Thisincrease in 2014 earnings fromoperations principally reflects morefavorable ingredient costs, plantefficiencies driven by capitalinvestments, and on-going costcontrol programs.
Management believes thecomparisons presented in thepreceding paragraphs, afteradjusting for changes in deferredcompensation, are more reflectiveof the underlying operations of theCompany.
Other income, net was $7,371 in2014 compared to $12,130 in 2013,a decrease of $4,759. Otherincome, net principally reflects$4,901 and $10,588 of aggregate
net gains and investment incomeon trading securities in 2014 and2013, respectively. These tradingsecurities provide an economichedge of the Company’s deferredcompensation liabilities; and therelated net gains and investmentincome were offset by a like amountof expense in aggregate productcost of goods sold and selling,marketing, and administrativeexpenses in the respective years asdiscussed above. Other income,net also includes foreign exchangelosses of $861 and $790 in 2014and 2013, respectively.
During fourth quarter 2013, theCompany sold its investment inJefferson County Alabama SewerRevenue Refunding Warrants for$10,840. This was an auction ratesecurity (ARS) originally purchasedfor $13,550 in 2008 with aninsurance-backed AAA rating.Because the Company recorded another-than-temporary pre-taximpairment of $5,140 in 2008 on thisARS investment which resulted in acarrying value of $8,410 at that time,a net gain of $2,430 was recordedon this sale in fourth quarter 2013.Since recording this initialimpairment in 2008, the Companycarried this ARS investment at itsestimated fair value utilizing avaluation model with Level 3 inputs,as defined by guidance, andresulting changes in the marketvalue from the date of the originalimpairment charge in 2008 to itssale in fourth quarter 2013 havebeen recorded as changes toaccumulated other comprehensiveincome (loss) each year.
The consolidated effective tax ratewas 31.1% and 28.0% in 2014 and
2013, respectively. This highereffective tax rate in 2014 reflects anadditional deferred income taxexpense of $2,350 relating theCompany’s step acquisition of itsSpanish subsidiaries which isdiscussed below. A reconciliation ofthe differences between the U.S.statutory rate and these effectivetax rates is provided in Note 4 tothe Consolidated FinancialStatements. At December 31, 2014,the Company’s deferred tax assetsinclude $10,880 of income taxbenefits relating to its Canadiansubsidiary tax loss carry-forwardswhich the Company expects torealize before their expiration dates(2027 through 2031). The Companyutilized approximately $600 and$400 of these tax carry-forwardbenefits in 2014 and 2013,respectively. The Company hasconcluded that it is more-likely-than-not that it would realize thesedeferred tax assets relating to itsCanadian tax operating losscarry-forwards because it isexpected that sufficient levels oftaxable income will be generatedduring the carry-forward periods.The Company has provided a fullvaluation allowance on its Spanishsubsidiaries’ tax loss carry-forwardbenefits of approximately $2,092 asof December 31, 2014 because theCompany has concluded that it isnot more-likely-than-not that theselosses will be utilized before theirexpiration dates. The Spanishsubsidiaries have a history of netoperating losses and it is not knownwhen and if they will generatetaxable income in the future. TheCompany has not provided for U.S.federal or foreign withholding taxes
Merrill Corp - Tootsie Roll 10-K ED [AUX] | 105969 | 27-Feb-15 18:27 | 15-2394-1.ca | Sequence: 2CHKSUM Content: 26966 Layout: 39916 Graphics: No Graphics CLEAN
JOB: 15-2394-1 CYCLE#;BL#: 6; 0 TRIM: 11" x 8.5" COMPOSITECOLORS: Black, ~note-color 2, ~note-color 3 GRAPHICS: none V1.5

8
effective tax rate, all of which arediscussed above. Earnings pershare benefited from the reductionin average shares outstandingresulting from purchases of theCompany’s common stock in theopen market by the Company.Average shares outstandingdecreased from 62,248 in 2012 to61,399 in 2013.
LIQUIDITY AND CAPITALRESOURCES
Cash flows from operating activitieswere $88,769, $109,823 and$101,418 in 2014, 2013 and 2012,respectively. The $21,054 decreasein cash flows from operatingactivities from 2013 to 2014primarily reflects increases ininventories and accountsreceivable in 2014, and changes inprepaid expenses and other assetsin the respective years. Theaforementioned increases ininventories and accountsreceivable principally reflect thetiming of fourth quarter sales andmanufacturing planning forinventories. The increase in cashflows from 2012 to 2013 primarilyreflects the 2012 increase in netearnings, as well as changes ininventories and prepaid expensesand other assets in the comparativeyears.
During fourth quarter 2014 and2013, the Company contributed$1,000 and $15,000 to a VEBAtrust, managed and controlled bythe Company, to fund the estimatedfuture costs of certain employeehealth, welfare and other benefits.The Company is using these fundsto pay the actual cost of such
benefits through 2017. AtDecember 31, 2014 and 2013, theVEBA trust held $10,845 and$13,991, respectively, of aggregatecash and cash equivalents. Thisasset value is included in prepaidexpenses and long-term otherassets in the Company’sConsolidated Statement of FinancialPosition. These assets arecategorized as Level 1 within thefair value hierarchy.
During fourth quarter 2013, theCompany restructured andamended its post-retirement healthbenefits plan provided to corporateoffice and management employees.These changes resulted in anegative plan amendment, asdefined by accounting guidance,resulting in a $10,425 reduction inthe Company’s benefit obligation asof December 31, 2013. The planchanges generally limited futureannual cost increases in healthbenefits to 3%, restricted thisbenefit to current employees withlong-term service with theCompany, required retirees to paythe full cost of life insurance, andeliminated all post-retirementbenefits for future employeeseffective April 1, 2014. Post-retirement benefits liabilities (asamended) were $12,300 and 8,857at December 31, 2014 and 2013,respectively. The aforementionedincrease reflects actuarial lossesrelating to an 86 basis pointdecrease in the discount rate(3.83% discount rate used atDecember 31, 2014) and an updateof the mortality table based on theSociety of Actuaries’ research thatindicates that retirees are livinglonger.
Cash flows from investing activitiesreflect capital expenditures of$10,704, $15,752, and $8,886 in2014, 2013 and 2012, respectively.The changes in amounts each yearprincipally reflects the timing ofexpenditures relating to plantmanufacturing projects. Thesecapital expenditures include$1,676, $1,775 and $830 relating tocomputer systems and softwareand implementations in 2014, 2013and 2012, respectively. Capitalexpenditures for 2015 are expectedto be in line with historical annualspending but actual expenditurescan vary due to the timing of largerprojects and payments. They are tobe funded from the Company’scash flow from operations andinternal sources.
Other than the bank loans and therelated restricted cash of theCompany’s Spanish subsidiarieswhich are discussed in Note 1 tothe consolidated financialstatements, the Company had nobank borrowings or repayments in2012, 2013, or 2014, and had nooutstanding bank borrowings as ofDecember 31, 2012 or 2013.Nonetheless, the Company wouldconsider bank borrowing or otherfinancing in the event that abusiness acquisition is completed.
Financing activities includeCompany common stockpurchases and retirements of$25,020, $23,143, and $23,803 in2014, 2013 and 2012, respectively.Cash dividends of $19,241,$14,282, and $52,431 (includes aspecial one-time dividend of$29,138 in 2012) were paid in 2014,2013 and 2012, respectively. The
fourth quarter 2012 included aspecial $0.50 per share cashdividend as well as an acceleratedpayment of the regular quarterlydividend of $0.08 per share whichhas historically been paid duringthe first week in January. Both werein response to the uncertaintysurrounding the future federal taxtreatment of dividends at that timeafter giving consideration to theCompany’s cash and investmentposition.
SIGNIFICANT ACCOUNTINGPOLICIES AND ESTIMATES
Preparation of the Company’sfinancial statements involvesjudgments and estimates due touncertainties affecting theapplication of accounting policies,and the likelihood that differentamounts would be reported underdifferent conditions or usingdifferent assumptions. TheCompany bases its estimates onhistorical experience and otherassumptions, as discussed herein,that it believes are reasonable. Ifactual amounts are ultimatelydifferent from previous estimates,the revisions are included in theCompany’s results of operations forthe period in which the actualamounts become known. TheCompany’s significant accountingpolicies are discussed in Note 1 tothe Consolidated FinancialStatements.
Following is a summary anddiscussion of the more significantaccounting policies whichmanagement believes to have asignificant impact on theCompany’s operating results,
Merrill Corp - Tootsie Roll 10-K ED [AUX] | 105969 | 27-Feb-15 18:27 | 15-2394-1.ca | Sequence: 5CHKSUM Content: 11742 Layout: 44105 Graphics: No Graphics CLEAN
JOB: 15-2394-1 CYCLE#;BL#: 6; 0 TRIM: 11" x 8.5" COMPOSITECOLORS: Black, ~note-color 2, ~note-color 3 GRAPHICS: none V1.5
7
the contribution increases requiredunder the plan of rehabilitation. TheCompany is currently unable todetermine the ultimate outcome ofthe above discussed matter andtherefore, is unable to determine theeffects on its consolidated financialstatements, but, the ultimateoutcome could be material to itsconsolidated results of operations inone or more future periods.
2013 vs. 2012
Net product sales were $539,627 in2013 compared to $545,985 in2012, a decrease of $6,358 or1.2%. The decline in 2013 salesreflects some special promotionalsales in 2012 that were notrepeated in 2013.
Product cost of goods sold were$350,960 in 2013 compared to$365,573 in 2012, a decrease of$14,613 or 4.0%. Product cost ofgoods sold includes $2,457 and$1,034 in certain deferredcompensation expenses in 2013and 2012, respectively. Thesedeferred compensation expensesprincipally result from changes inthe market value of investments andinvestment income from tradingsecurities relating to compensationdeferred in previous years and arenot reflective of current operatingresults. Adjusting for theaforementioned, product cost ofgoods sold decreased from$364,539 in 2012 to $348,503 in2013, a decrease of $16,036 or4.4%. As a percent of net productsales, these adjusted costsdecreased from 66.8% in 2012 to64.6% in 2013, a favorabledecrease of 2.2% as a percent of
net product sales. Although certainkey ingredient costs were higher in2013, our overall comparativeingredient costs are more favorablethis year; however, our packagingmaterials and manufacturing plantoperating costs did increase in2013 compared to 2012.
Selling, marketing andadministrative expenses were$119,133 in 2013 compared to$113,842 in 2012, an increase of$5,291 or 4.6%. Selling, marketingand administrative expensesinclude $8,131 and $3,582 incertain deferred compensationexpenses in 2013 and 2012,respectively. These deferredcompensation expenses principallyresult from changes in the marketvalue of investments andinvestment income from tradingsecurities relating to compensationdeferred in previous years and arenot reflective of current operatingresults. Adjusting for theaforementioned, selling, marketingand administrative expensesincreased from $110,260 in 2012 to$111,002 in 2013, an increase of$742 or 0.7%. As a percent of netproduct sales, these adjustedexpenses increased slightly from20.2% of net product sales in 2012to 20.6% of net product sales in2013. Selling, marketing andadministrative expenses include$45,367 and $45,072 of freight,delivery and warehousing expensesin 2013 and 2012, respectively,which increased slightly from 8.3%of net product sales in 2012 to 8.4%of net product sales in 2013.
Earnings from operations were$72,353 in 2013 compared to
$69,479 in 2012, an increase of$2,874. Earnings from operationsinclude $10,588 and $4,616 incertain deferred compensationexpense in 2013 and 2012,respectively, which are discussedabove. Adjusting for these deferredcompensation expenses, earningsfrom operations were $82,941 and$74,095 in 2013 and 2012,respectively, an increase of $8,846or 11.9%. This increase in 2013earnings from operations principallyreflects more favorable ingredientcosts, plant efficiencies driven bycapital investments, and on-goingcost control programs.
Management believes thecomparisons presented in thepreceding paragraphs afteradjusting for changes in deferredcompensation are more reflective ofthe underlying operations of theCompany.
Other income, net was $12,130 in2013 compared to $4,685 in 2012,an increase of $7,445. Otherincome, net principally reflects$10,588 and $4,616 of aggregatenet gains and investment incomeon trading securities in 2013 and2012, respectively. These net gainsand investment income were offsetby a like amount of expense inaggregate product cost of goodssold and selling, marketing, andadministrative expenses in therespective years as discussedabove. Other income, net alsoincludes foreign exchange gains(losses) of $(790) and $442 in 2013and 2012, respectively, and a netgain of $2,430 on the sale of itsinvestment in Jefferson County
Alabama Warrants as discussedabove.
Other income, net includes theresults of the Company’s 50% shareof two Spanish companies whichwere accounted for using the equitymethod. These equity methodlosses were $967 and $1,019 for2013 and 2012, respectively. Inaddition, pre-tax impairmentcharges of $975 and $850 wererecorded in 2013 and 2012,respectively, to write-down theCompany’s carrying value toestimated fair value.
The consolidated effective tax ratewas 28.0% and 29.9% in 2013 and2012, respectively; a reconciliationof the differences between the U.S.statutory rate and these effectivetax rates is provided in Note 4 tothe Consolidated FinancialStatements. At December 31, 2013,the Company’s deferred tax assetsinclude $12,512 of income taxbenefits relating to its Canadiansubsidiary tax loss carry-forwardswhich the Company expects torealize before their expiration dates(2026 through 2031). The Companyutilized approximately $400 and$3,000 of these carry-forward taxloss benefits in 2013 and 2012,respectively.
Net earnings were $60,849 in 2013compared to $52,004 in 2012, andearnings per share were $0.99 and$0.84 in 2013 and 2012,respectively, an increase of $0.15 or17.9%. Net earnings benefited fromimproved gross profit margins, aswell as a gain on the sale of itsJefferson County warrants, asdiscussed above, and a lower
Merrill Corp - Tootsie Roll 10-K ED [AUX] | 105969 | 27-Feb-15 18:27 | 15-2394-1.ca | Sequence: 4CHKSUM Content: 43558 Layout: 27221 Graphics: No Graphics CLEAN
JOB: 15-2394-1 CYCLE#;BL#: 6; 0 TRIM: 11" x 8.5" COMPOSITECOLORS: Black, ~note-color 2, ~note-color 3 GRAPHICS: none V1.5

10
Valuation of investments
Investments, primarily municipalbonds, mutual funds and equitymethod investments are reviewedfor impairment at each reportingperiod by comparing the carryingvalue or amortized cost to the fairmarket value. The Company mayutilize third-party professionalvaluation firms as necessary toassist in the determination of thevalue of investments that utilizeLevel 3 inputs as defined byguidance. In the event that aninvestment security’s fair value isbelow carrying value or amortizedcost, the Company will record another-than-temporary impairment ora temporary impairment based onaccounting guidance.
Other matters
In the opinion of management,other than contracts for foreigncurrency forwards and rawmaterials, including currency andcommodity hedges andoutstanding purchase orders forpackaging, ingredients, supplies,and operational services, allentered into in the ordinary courseof business, the Company does nothave any significant contractualobligations or future commitments.The Company’s outstandingcontractual commitments as ofDecember 31, 2014, all of whichare generally normal and recurringin nature, are summarized in thechart on page 12, which isincorporated by reference herein.
RECENT ACCOUNTINGPRONOUNCEMENTS
See Note 1 of the Company’sNote to Consolidated FinancialStatements.
MARKET RISKS
The Company is exposed to marketrisks related to commodity prices,interest rates, investments inmarketable securities, equity priceand foreign exchange.
The Company’s ability to forecastthe direction and scope of changesto its major input costs is impactedby significant volatility in crude oil,sugar, corn, soybean and edibleoils, cocoa and dairy productsmarkets. The prices of thesecommodities are influenced bychanges in global demand,changes in weather and cropyields, including the effects ofclimate change, changes ingovernments’ farm policies,including mandates for ethanol andbio-fuels, environmental matters,and fluctuations in the U.S. dollarrelative to dollar-denominatedcommodities in world markets. TheCompany believes that itscompetitors face the same orsimilar challenges.
In order to address the impact ofrising input and other costs, theCompany periodically reviews eachitem in its product portfolio toascertain if price realizationadjustments or other actions shouldbe taken. These reviews include anevaluation of the risk factors relatingto market place acceptance of suchchanges and their potential effecton future sales volumes. In addition,the estimated cost of packagingmodifications associated withweight changes is evaluated. TheCompany also maintains ongoingcost reduction and productivityimprovement programs underwhich cost savings initiatives are
encouraged and progressmonitored. The Company is notable to accurately predict theoutcome of these cost savingsinitiatives and their effects on itsfuture results.
Commodity future and foreigncurrency forward contracts
Commodity price risks relate toingredients, primarily sugar, cocoa,chocolate, corn syrup, dextrose,soybean and edible oils, milk, wheyand gum base ingredients. TheCompany believes its competitorsface similar risks, and the industryhas historically adjusted prices tocompensate for adversefluctuations in commodity costs.The Company, as well ascompetitors in the confectioneryindustry, has historically takenactions, including higher pricerealization to mitigate rising inputcosts for ingredients, energy, freightand delivery. Althoughmanagement seeks to substantiallyrecover cost increases over thelong-term, there is risk that higherprice realization cannot be fullypassed on to customers and, to theextent they are passed on, theycould adversely affect customerand consumer acceptance andresulting sales volume.
The Company utilizes commodityfutures contracts and commodityoptions contracts, as well as annualsupply agreements, to hedge andplan for anticipated purchases ofcertain ingredients, including sugar,in order to mitigate commodity costfluctuation. The Company also maypurchase forward foreign exchangecontracts to hedge its costs ofmanufacturing certain products in
Canada for sale and distribution inthe United States, and periodicallydoes so for purchases ofequipment or raw materials fromforeign suppliers. Such commodityfutures, commodity options andcurrency forward contracts arecash flow hedges and are effectiveas hedges as defined byaccounting guidance. Theunrealized gains and losses onsuch contracts are deferred as acomponent of accumulated othercomprehensive loss (or gain) andare recognized as a component ofproduct cost of goods sold whenthe related inventory is sold.
The potential change in fair value ofcommodity and foreign currencyderivative instruments held by theCompany at December 31, 2014,assuming a 10% change in theunderlying contract price, was$3,303. The analysis only includescommodity and foreign currencyderivative instruments and,therefore, does not consider theoffsetting effect of changes in theprice of the underlying commodityor foreign currency. This amount isnot significant compared with thenet earnings and shareholders’equity of the Company.
Interest rates
Interest rate risks primarily relate tothe Company’s investments in taxexempt marketable securities withmaturities or auction dates ofgenerally up to three years.
The majority of the Company’sinvestments, which are classified asavailable for sale, have historicallybeen held until they mature, whichlimits the Company’s exposure to
Merrill Corp - Tootsie Roll 10-K ED [AUX] | 105969 | 27-Feb-15 18:27 | 15-2394-1.ca | Sequence: 7CHKSUM Content: 241 Layout: 21435 Graphics: No Graphics CLEAN
JOB: 15-2394-1 CYCLE#;BL#: 6; 0 TRIM: 11" x 8.5" COMPOSITECOLORS: Black, ~note-color 2, ~note-color 3 GRAPHICS: none V1.5
9
financial position, cash flows andfootnote disclosure.
Revenue recognition
Revenue, net of applicableprovisions for discounts, returns,allowances and certain advertisingand promotional costs, isrecognized when products aredelivered to customers based on acustomer purchase order, andcollectability is reasonably assured.The accounting for promotionalcosts is discussed under“Customer incentive programs,advertising and marketing” below.
Provisions for bad debts arerecorded as selling, marketing andadministrative expenses. Write-offsof bad debts did not exceed 0.1%of net product sales in each of2014, 2013 and 2012, andaccordingly, have not beensignificant to the Company’sfinancial position or results ofoperations.
Intangible assets
The Company’s intangible assetsconsist primarily of goodwill andacquired trademarks. Alltrademarks have been assessed bymanagement to have indefinite livesbecause they are expected togenerate cash flows indefinitely. Inaccordance with accountingguidance, goodwill and otherindefinite-lived assets are notamortized, but are insteadsubjected to annual testing forimpairment unless certain triggeringevents or circumstances are noted.The Company performs its annualimpairment testing as ofDecember 31. The Company mayutilize third-party professional
valuation firms to assist in thedetermination of valuation of certaintrademarks.
With respect to impairment testingof goodwill, the first step comparesthe reporting unit’s estimated fairvalue with its carrying value. Weestimate a reporting unit’s fair valueusing projected discounted cashflows. If the carrying value of areporting unit’s net assets exceedsits fair value, the second step isapplied to measure the differencebetween the carrying value andimplied fair value of goodwill. If thecarrying value of goodwill exceedsits implied fair value, the goodwill isconsidered impaired and reducedto its implied fair value.
We test non-amortizable intangibleassets, trademarks, for impairmentby comparing the fair value ofeach trademark with its carryingvalue. We determine fair value oftrademarks using discounted cashflows and estimates of royaltyrates. If the carrying value exceedsfair value, the trademark isconsidered impaired and isreduced to fair value.
The cash flow projectionsdiscussed above requires us tomake assumptions and estimatesregarding our future plans,including sales projections andprofit margins, market baseddiscount rates, competitive factors,and economic conditions; and ouractual results and conditions maydiffer over time. A change in theassumptions relating to theimpairment analysis of goodwill andtrademarks, including but notlimited to a reduction in projectedcash flows, the use of a different
discount rate to discount futurecash flows or a different royalty rateapplied to the Company’strademarks, could causeimpairment in the future.
Customer incentive programs,advertising and marketing
Advertising and marketing costsare recorded in the period to whichsuch costs relate. The Companydoes not defer the recognition ofany amounts on its consolidatedbalance sheet with respect to suchcosts. Customer incentives andother promotional costs arerecorded at the time of sale basedupon incentive program terms andhistorical utilization statistics, whichare generally consistent from yearto year.
The liabilities associated with theseprograms are reviewed quarterlyand adjusted if utilization ratesdiffer from management’s originalestimates. Such adjustments havenot historically been material to theCompany’s operating results.
Split dollar officer life insurance
The Company provides split dollarlife insurance benefits to certainexecutive officers and records anasset principally equal to thecumulative premiums paid. TheCompany will fully recover thesepremiums in future years under theterms of the plan. The Companyretains a collateral assignment ofthe cash surrender values andpolicy death benefits payable toinsure recovery of these premiums.
Valuation of long-lived assets
Long-lived assets, primarilyproperty, plant and equipment are
reviewed for impairment as eventsor changes in businesscircumstances occur indicating thatthe carrying value of the asset maynot be recoverable. The estimatedcash flows produced by assets orasset groups, are compared to theasset carrying value to determinewhether impairment exists. Suchestimates involve considerablemanagement judgment and arebased upon assumptions aboutexpected future operatingperformance. As a result, actualcash flows could differ frommanagement’s estimates due tochanges in business conditions,operating performance, andeconomic and competitiveconditions.
Income taxes
Deferred income taxes arerecognized for future tax effects oftemporary differences betweenfinancial and income tax reportingusing tax rates in effect for theyears in which the differences areexpected to reverse. The Companyrecords valuation allowances insituations where the realization ofdeferred tax assets, including thoserelating to net operating tax losses,is not more-likely-than-not; and theCompany adjusts and releasessuch valuation allowances whenrealization becomes more-likely-than-not as defined by accountingguidance. The Companyperiodically reviews assumptionsand estimates of the Company’sprobable tax obligations and effectson its liability for uncertain taxpositions, using informed judgmentwhich may include the use of third-party consultants, advisors andlegal counsel, and historicalexperience.
Merrill Corp - Tootsie Roll 10-K ED [AUX] | 105969 | 27-Feb-15 18:27 | 15-2394-1.ca | Sequence: 6CHKSUM Content: 14392 Layout: 63953 Graphics: No Graphics CLEAN
JOB: 15-2394-1 CYCLE#;BL#: 6; 0 TRIM: 11" x 8.5" COMPOSITECOLORS: Black, ~note-color 2, ~note-color 3 GRAPHICS: none V1.5

Open Contractual Commitments as of December 31, 2014
Less than 1 to 3 3 to 5 More thanPayable in Total 1 Year Years Years 5 YearsCommodity hedges . . . . . . . $ 5,422 $ 5,422 $ — $ — $ —
Foreign currency hedges . . . . . . . 27,604 16,641 10,963 — —
Purchase obligations . . . . 8,406 8,406 — — —
Interest bearing debt . . . . . . . . . 7,500 — — — 7,500
Operating leases . . . . . . . . 1,428 978 449 1 —
Total . . . . . . . . . . $50,360 $31,447 $11,412 $ 1 $7,500
Note: Commodity hedges and foreign currency hedges reflect theamounts at which the Company will settle the related contracts. Theabove amounts exclude deferred income tax liabilities of $47,356,liabilities for uncertain tax positions of $8,584, postretirement healthcare benefits of $11,983 and deferred compensation and other liabilitiesof $78,674 because the timing of payments relating to these itemscannot be reasonably determined.
12
effects should the Company eithervoluntarily or involuntarily recall itsproduct(s) from the marketplace;(xvi) the risk that the market value ofCompany’s investments coulddecline including being classifiedas “other-than-temporary” asdefined; (xvii) the Company’sdependence on its enterpriseresource planning computer systemto manage its supply chain andcustomer deliveries, and the riskthat the Company’s informationtechnology systems fail to performadequately; (xviii) the adverseeffects if the Company is unable toprotect such information technologysystems against data corruption,cyber-based attacks or networksecurity breaches; (xix) thepotential adverse effects on theCompany as to changes to improvethe funding status of the Bakeryand Confectionery Union andIndustry Pension Plan, a multi-employer plan which covers certainCompany union employees; (xx) theadverse effects if restructuringefforts and changes in businessplans with respect to theCompany’s Spanish subsidiariesare not fully successful; and (xxi)the potential effects of current andfuture macroeconomic conditionsand geopolitical events.
Forward-looking statements
This discussion and certain othersections contain forward-lookingstatements that are based largelyon the Company’s currentexpectations and are madepursuant to the safe harbor
provision of the Private SecuritiesLitigation Reform Act of 1995.Forward-looking statements can beidentified by the use of words suchas “anticipated,” “believe,”“expect,” “intend,” “estimate,”“project,” and other words of similarmeaning in connection with adiscussion of future operating orfinancial performance and aresubject to certain factors, risks,trends and uncertainties that couldcause actual results andachievements to differ materiallyfrom those expressed in theforward-looking statements. Suchfactors, risks, trends anduncertainties which in someinstances are beyond theCompany’s control, include theoverall competitive environment inthe Company’s industry, changes inassumptions and judgmentsdiscussed above under theheading “Significant AccountingPolicies and Estimates”, and factorsidentified and referred to aboveunder the heading “Risk Factors.”
The risk factors identified andreferred to above are believed to besignificant factors, but notnecessarily all of the significantfactors that could cause actualresults to differ from thoseexpressed in any forward-lookingstatement. Readers are cautionednot to place undue reliance on suchforward-looking statements, whichare made only as of the date of thisreport. The Company undertakesno obligation to update suchforward-looking statements.
Merrill Corp - Tootsie Roll 10-K ED [AUX] | 105969 | 27-Feb-15 18:27 | 15-2394-1.ca | Sequence: 9CHKSUM Content: 27024 Layout: 8540 Graphics: No Graphics CLEAN
JOB: 15-2394-1 CYCLE#;BL#: 6; 0 TRIM: 11" x 8.5" COMPOSITECOLORS: Black, ~note-color 2, ~note-color 3 GRAPHICS: none V1.5
11
interest rate fluctuations. Theaccompanying chart summarizesthe maturities of the Company’sinvestments in debt securities atDecember 31, 2014.
Less than 1 year . . . . . $ 39,4361 – 2 years . . . . . . . . . . 42,4912 – 3 years . . . . . . . . . . 48,691Over 3 years . . . . . . . . 714
Total . . . . . . . . . . . . . . . $131,332
The Company’s outstanding debt atDecember 31, 2014 and 2013 was$7,500 in an industrial revenuebond in which interest rates reseteach week based on the currentmarket rate. Therefore, theCompany does not believe that ithas significant interest rate risk withrespect to its interest bearing debt.
Investment in marketable securities
As stated above, the Companyinvests primarily in tax exemptmarketable securities withmaturities or auction datesgenerally up to three years. TheCompany utilizes professionalmoney managers and maintainsinvestment policy guidelines whichemphasize quality and liquidity inorder to minimize the potential lossexposures that could result in theevent of a default or other adverseevent, including failed auctions. TheCompany continues to monitorthese investments and markets, aswell as its investment policies,however, the financial marketscould experience unanticipated orunprecedented events as it didbeginning in 2008, and futureoutcomes may be less predictablethan in the past.
Equity price
Equity price risk relates to theCompany’s investments in mutualfunds which are principally used tofund and hedge the Company’sdeferred compensation liabilities. AtDecember 31, 2014, the Companyhas investments in mutual funds,classified as trading securities, of$71,682. Any change in the fairvalue of these trading securities iscompletely offset by acorresponding change in therespective hedged deferredcompensation liability.
Foreign currency
Foreign currency risk principallyrelates to the Company’s foreignoperations in Canada, Mexico andSpain, as well as periodic purchasecommitments of machinery andequipment from foreign sources.
Certain of the Company’s Canadianmanufacturing costs, including localpayroll and plant operations, and aportion of its packaging andingredients are sourced in Canadiandollars. The Company maypurchase Canadian forwardcontracts to receive Canadiandollars at a specified date in thefuture and uses its Canadian dollarcollections on Canadian sales as apartial hedge of its overall Canadianmanufacturing obligations sourcedin Canadian dollars. The Companyalso periodically purchases andholds Canadian dollars to facilitatethe risk management of thesecurrency changes.
From time to time, the Companymay use foreign exchange forwardcontracts and derivativeinstruments to mitigate its exposure
to foreign exchange risks, as wellas those related to firmcommitments to purchaseequipment from foreign vendors.See Note 10, Fair ValueMeasurements, for outstandingforeign exchange forward contractsas of December 31, 2014.
RISK FACTORS
The Company’s operations andfinancial results are subject to anumber of risks and uncertaintiesthat could adversely affect theCompany’s operating results andfinancial condition. Significant riskfactors, without limitation, that couldimpact the Company, are thefollowing: (i) significant competitiveactivity, including advertising,promotional and price competition,and changes in consumer demandfor the Company’s products;(ii) fluctuations in the cost andavailability of commodities andingredients, including the effectsadverse weather and climatechange, and disease in west Africawhich could affect cocoa supplies;and the ability to recover costincreases through product salesprice increases; (iii) inherent risks inthe marketplace, includinguncertainties about trade andconsumer acceptance of productpricing changes and seasonalevents such as Halloween, theCompany’s largest sales season;(iv) the effect of acquisitions on theCompany’s results of operationsand financial condition; (v) theeffect of changes in foreigncurrencies on the Company’sforeign subsidiaries operatingresults, and the effect of thefluctuation of the Canadian dollar
on products manufactured inCanada and marketed and sold inthe United States in U.S. dollars;(vi) the Company’s reliance on thirdparty vendors for various goodsand services, includingcommodities used for ingredientsthat are primarily grown or sourcedfrom foreign locations; (vii) theCompany’s ability to successfullyimplement new productionprocesses and manufacturingautomation and computer systemswithout disruption or qualityproblems; (viii) the effect ofchanges in assumptions, includingdiscount rates, sales growth andprofit margins, which could affectthe Company’s impairment testingand analysis of its goodwill andtrademarks; (ix) changes in theconfectionery marketplaceincluding actions taken by majorretailers and customers;(x) customer, consumer andcompetitor response to marketingprograms and price and productweight adjustments, and newproducts; (xi) dependence onsignificant customers, including thevolume and timing of theirpurchases, availability of shelfspace, and competitive products;(xii) increases in energy costs,including freight and delivery, thatcannot be passed along tocustomers through increased pricerealization due to competitivereasons; (xiii) any significant laborstoppages, strikes or productioninterruptions; (xiv) changes ingovernmental laws or regulationsthat affect ingredients used inproducts, or taxes, tariffs or othergovernment restrictions onproducts sold; (xv) the adverse
Merrill Corp - Tootsie Roll 10-K ED [AUX] | 105969 | 27-Feb-15 18:27 | 15-2394-1.ca | Sequence: 8CHKSUM Content: 28925 Layout: 18343 Graphics: No Graphics CLEAN
JOB: 15-2394-1 CYCLE#;BL#: 6; 0 TRIM: 11" x 8.5" COMPOSITECOLORS: Black, ~note-color 2, ~note-color 3 GRAPHICS: none V1.5

14
CONSOLIDATED STATEMENTS OF
Comprehensive EarningsTOOTSIE ROLL INDUSTRIES, INC. AND SUBSIDIARIES (in thousands except per share data)
For the year ended December 31,
2014 2013 2012
Net earnings . . . . . . . . . . . . . . . . . . . . . . . . . . . . . . . . . . . . . . . . . . . . . . . . . . . . . . . . . $ 62,860 $ 60,849 $ 52,004
Other comprehensive income (loss), before tax:Foreign currency translation adjustments . . . . . . . . . . . . . . . . . . . . . . . . . . . . . . . . . . (4,453) (102) 1,303
Pension and postretirement reclassification adjustment:Unrealized gains (losses) for the period on postretirement and pension benefits . . (2,746) 20,037 1,066Less: reclassification adjustment for (gains) losses to net earnings . . . . . . . . . . (1,804) 671 1,036 Unrealized gains (losses) on postretirement and pension benefits . . . . . . . . . . . (4,550) 20,708 2,102
Investments:Unrealized gains (losses) for the period on investments . . . . . . . . . . . . . . . . . . . (606) 1,091 1,980Less: reclassification adjustment for (gains) losses to net earnings . . . . . . . . . . — (2,430) — Unrealized gains (losses) on investments . . . . . . . . . . . . . . . . . . . . . . . . . . . . . . (606) (1,339) 1,980
Derivatives:Unrealized gains (losses) for the period on derivatives . . . . . . . . . . . . . . . . . . . . (3,137) (2,107) (339)Less: reclassification adjustment for (gains) losses to net earnings . . . . . . . . . . 1,295 1,446 (243) Unrealized gains (losses) on derivatives . . . . . . . . . . . . . . . . . . . . . . . . . . . . . . . (1,842) (661) (582)
Total other comprehensive income (loss), before tax . . . . . . . . . . . . . . . . . . . . . . . . . . (11,451) 18,606 4,803Income tax benefit (expense) related to items of other comprehensive income . . . . . 2,991 (6,797) (1,297)
Total comprehensive earnings . . . . . . . . . . . . . . . . . . . . . . . . . . . . . . . . . . . . . . . 54,400 72,658 55,510Comprehensive earnings attributable to noncontrolling interests . . . . . . . . . . . . . . . . 438 — —
Total comprehensive earnings attributable to Tootsie Roll Industries, Inc. . . . . . . $ 54,838 $ 72,658 $ 55,510
Merrill Corp - Tootsie Roll 10-K ED [AUX] | 105969 | 27-Feb-15 18:28 | 15-2394-1.da | Sequence: 2CHKSUM Content: 17785 Layout: 10706 Graphics: No Graphics CLEAN
JOB: 15-2394-1 CYCLE#;BL#: 6; 0 TRIM: 11" x 8.5" COMPOSITECOLORS: Black, ~note-color 2, ~note-color 3 GRAPHICS: none V1.5
CONSOLIDATED STATEMENTS OF
Earnings and Retained EarningsTOOTSIE ROLL INDUSTRIES, INC. AND SUBSIDIARIES (in thousands except per share data)
For the year ended December 31,
2014 2013 2012
Net product sales . . . . . . . . . . . . . . . . . . . . . . . . . . . . . . . . . . . . . . . . . . . . . . . . . . . . . $539,895 $539,627 $545,985Rental and royalty revenue . . . . . . . . . . . . . . . . . . . . . . . . . . . . . . . . . . . . . . . . . . . . . . 3,630 3,756 3,885 Total revenue . . . . . . . . . . . . . . . . . . . . . . . . . . . . . . . . . . . . . . . . . . . . . . . . . . . . . . . . 543,525 543,383 549,870 Product cost of goods sold . . . . . . . . . . . . . . . . . . . . . . . . . . . . . . . . . . . . . . . . . . . . . 340,933 350,960 365,573Rental and royalty cost . . . . . . . . . . . . . . . . . . . . . . . . . . . . . . . . . . . . . . . . . . . . . . . . . 947 937 976 Total costs . . . . . . . . . . . . . . . . . . . . . . . . . . . . . . . . . . . . . . . . . . . . . . . . . . . . . . . . . . . 341,880 351,897 366,549 Product gross margin . . . . . . . . . . . . . . . . . . . . . . . . . . . . . . . . . . . . . . . . . . . . . . . . . . 198,962 188,667 180,412Rental and royalty gross margin . . . . . . . . . . . . . . . . . . . . . . . . . . . . . . . . . . . . . . . . . . 2,683 2,819 2,909 Total gross margin . . . . . . . . . . . . . . . . . . . . . . . . . . . . . . . . . . . . . . . . . . . . . . . . . . . . 201,645 191,486 183,321Selling, marketing and administrative expenses . . . . . . . . . . . . . . . . . . . . . . . . . . . . . 117,722 119,133 113,842 Earnings from operations . . . . . . . . . . . . . . . . . . . . . . . . . . . . . . . . . . . . . . . . . . . . . . . 83,923 72,353 69,479 Other income, net . . . . . . . . . . . . . . . . . . . . . . . . . . . . . . . . . . . . . . . . . . . . . . . . . . . . . 7,371 12,130 4,685 Earnings before income taxes . . . . . . . . . . . . . . . . . . . . . . . . . . . . . . . . . . . . . . . . . . . 91,294 84,483 74,164 Provision for income taxes . . . . . . . . . . . . . . . . . . . . . . . . . . . . . . . . . . . . . . . . . . . . . . 28,434 23,634 22,160 Net earnings . . . . . . . . . . . . . . . . . . . . . . . . . . . . . . . . . . . . . . . . . . . . . . . . . . . . . . . . . 62,860 60,849 52,004 Less: Net loss attributable to noncontrolling interests . . . . . . . . . . . . . . . . . . . . . . . . . 438 — —Net earnings attributable to Tootsie Roll Industries, Inc. . . . . . . . . . . . . . . . . . . . . . . . $ 63,298 $ 60,849 $ 52,004
Net earnings attributable to Tootsie Roll Industries, Inc. per share . . . . . . . . . . . . . . . $ 1.05 $ 0.99 $ 0.84Average number of shares outstanding . . . . . . . . . . . . . . . . . . . . . . . . . . . . . . . . . . . . 60,562 61,399 62,248
Retained earnings at beginning of period . . . . . . . . . . . . . . . . . . . . . . . . . . . . . . . . . . $ 73,109 $ 80,210 $114,269 Net earnings attributable to Tootsie Roll Industries, Inc. . . . . . . . . . . . . . . . . . . . . 63,298 60,849 52,004 Cash dividends . . . . . . . . . . . . . . . . . . . . . . . . . . . . . . . . . . . . . . . . . . . . . . . . . . . (19,199) (18,922) (47,729) Stock dividends . . . . . . . . . . . . . . . . . . . . . . . . . . . . . . . . . . . . . . . . . . . . . . . . . . . (52,281) (49,028) (38,334) Retained earnings at end of period . . . . . . . . . . . . . . . . . . . . . . . . . . . . . . . . . . . . . . . $ 64,927 $ 73,109 $ 80,210 (The accompanying notes are an integral part of these statements.)
13
Merrill Corp - Tootsie Roll 10-K ED [AUX] | 105969 | 27-Feb-15 18:28 | 15-2394-1.da | Sequence: 1CHKSUM Content: 16362 Layout: 63042 Graphics: No Graphics CLEAN
JOB: 15-2394-1 CYCLE#;BL#: 6; 0 TRIM: 11" x 8.5" COMPOSITECOLORS: Black, ~note-color 2, ~note-color 3 GRAPHICS: none V1.5

16
(in thousands except per share data)
Liabilities and Shareholders’ Equity December 31,
2014 2013
CURRENT LIABILITIES: Accounts payable . . . . . . . . . . . . . . . . . . . . . . . . . . . . . . . . . . . . . . . . . . . . . . . . . . . . . . . . . . . . . . . . . . . $ 11,641 $ 9,153 Bank loans . . . . . . . . . . . . . . . . . . . . . . . . . . . . . . . . . . . . . . . . . . . . . . . . . . . . . . . . . . . . . . . . . . . . . . . . . 124 — Dividends payable . . . . . . . . . . . . . . . . . . . . . . . . . . . . . . . . . . . . . . . . . . . . . . . . . . . . . . . . . . . . . . . . . . . 4,814 4,742 Accrued liabilities . . . . . . . . . . . . . . . . . . . . . . . . . . . . . . . . . . . . . . . . . . . . . . . . . . . . . . . . . . . . . . . . . . . . 46,482 45,580 Postretirement health care benefits . . . . . . . . . . . . . . . . . . . . . . . . . . . . . . . . . . . . . . . . . . . . . . . . . . . . . . 328 319 Income taxes payable . . . . . . . . . . . . . . . . . . . . . . . . . . . . . . . . . . . . . . . . . . . . . . . . . . . . . . . . . . . . . . . . 1,070 327
Total current liabilities . . . . . . . . . . . . . . . . . . . . . . . . . . . . . . . . . . . . . . . . . . . . . . . . . . . . . . . . . 64,459 60,121 NONCURRENT LIABILITIES: Deferred income taxes . . . . . . . . . . . . . . . . . . . . . . . . . . . . . . . . . . . . . . . . . . . . . . . . . . . . . . . . . . . . . . . . 47,356 54,939 Bank loans . . . . . . . . . . . . . . . . . . . . . . . . . . . . . . . . . . . . . . . . . . . . . . . . . . . . . . . . . . . . . . . . . . . . . . . . . 694 — Postretirement health care benefits . . . . . . . . . . . . . . . . . . . . . . . . . . . . . . . . . . . . . . . . . . . . . . . . . . . . . . 11,983 8,857 Industrial development bonds . . . . . . . . . . . . . . . . . . . . . . . . . . . . . . . . . . . . . . . . . . . . . . . . . . . . . . . . . . 7,500 7,500 Liability for uncertain tax positions . . . . . . . . . . . . . . . . . . . . . . . . . . . . . . . . . . . . . . . . . . . . . . . . . . . . . . . 8,584 7,167 Deferred compensation and other liabilities . . . . . . . . . . . . . . . . . . . . . . . . . . . . . . . . . . . . . . . . . . . . . . . 78,674 69,520
Total noncurrent liabilities . . . . . . . . . . . . . . . . . . . . . . . . . . . . . . . . . . . . . . . . . . . . . . . . . . . . . . 154,791 147,983 TOOTSIE ROLL INDUSTRIES, INC. SHAREHOLDERS’ EQUITY: Common stock, $.69-4/9 par value—120,000 shares authorized— 37,285 and 37,011, respectively, issued . . . . . . . . . . . . . . . . . . . . . . . . . . . . . . . . . . . . . . . . . . . . . . . . 25,892 25,702 Class B common stock, $.69-4/9 par value—40,000 shares authorized— 22,887 and 22,256, respectively, issued . . . . . . . . . . . . . . . . . . . . . . . . . . . . . . . . . . . . . . . . . . . . . . . . 15,894 15,455 Capital in excess of par value . . . . . . . . . . . . . . . . . . . . . . . . . . . . . . . . . . . . . . . . . . . . . . . . . . . . . . . . . . 599,186 572,669 Retained earnings . . . . . . . . . . . . . . . . . . . . . . . . . . . . . . . . . . . . . . . . . . . . . . . . . . . . . . . . . . . . . . . . . . . 64,927 73,109 Accumulated other comprehensive loss . . . . . . . . . . . . . . . . . . . . . . . . . . . . . . . . . . . . . . . . . . . . . . . . . . (13,098) (4,638) Treasury stock (at cost)—78 shares and 76 shares, respectively . . . . . . . . . . . . . . . . . . . . . . . . . . . . . . . (1,992) (1,992)
Total Tootsie Roll Industries, Inc. shareholders’ equity . . . . . . . . . . . . . . . . . . . . . . . . . . . . . . . . 690,809 680,305 Noncontrolling interests . . . . . . . . . . . . . . . . . . . . . . . . . . . . . . . . . . . . . . . . . . . . . . . . . . . . . . . . 327 — Total equity . . . . . . . . . . . . . . . . . . . . . . . . . . . . . . . . . . . . . . . . . . . . . . . . . . . . . . . . . . . . . . . . . . 691,136 680,305
Total liabilities and shareholders’ equity . . . . . . . . . . . . . . . . . . . . . . . . . . . . . . . . . . . . . . . . . . . . . . . . . . $910,386 $888,409
Merrill Corp - Tootsie Roll 10-K ED [AUX] | 105969 | 27-Feb-15 18:28 | 15-2394-1.da | Sequence: 4CHKSUM Content: 52961 Layout: 16569 Graphics: No Graphics CLEAN
JOB: 15-2394-1 CYCLE#;BL#: 6; 0 TRIM: 11" x 8.5" COMPOSITECOLORS: Black, ~note-color 2, ~note-color 3 GRAPHICS: none V1.5
15
CONSOLIDATED STATEMENTS OF
Financial PositionTOOTSIE ROLL INDUSTRIES, INC. AND SUBSIDIARIES (in thousands)
Assets December 31,
2014 2013
CURRENT ASSETS: Cash and cash equivalents . . . . . . . . . . . . . . . . . . . . . . . . . . . . . . . . . . . . . . . . . . . . . . . . . . . . . . . . . . . . $100,108 $ 88,283 Investments . . . . . . . . . . . . . . . . . . . . . . . . . . . . . . . . . . . . . . . . . . . . . . . . . . . . . . . . . . . . . . . . . . . . . . . . 39,450 33,572 Accounts receivable trade, less allowances of $1,968 and $2,042 . . . . . . . . . . . . . . . . . . . . . . . . . . . . . 43,253 40,721 Other receivables . . . . . . . . . . . . . . . . . . . . . . . . . . . . . . . . . . . . . . . . . . . . . . . . . . . . . . . . . . . . . . . . . . . . 3,577 4,616 Inventories: Finished goods and work-in-process . . . . . . . . . . . . . . . . . . . . . . . . . . . . . . . . . . . . . . . . . . . . . . . . . 44,549 37,012 Raw materials and supplies . . . . . . . . . . . . . . . . . . . . . . . . . . . . . . . . . . . . . . . . . . . . . . . . . . . . . . . . 25,830 24,844 Prepaid expenses . . . . . . . . . . . . . . . . . . . . . . . . . . . . . . . . . . . . . . . . . . . . . . . . . . . . . . . . . . . . . . . . . . . 6,060 5,581 Deferred income taxes . . . . . . . . . . . . . . . . . . . . . . . . . . . . . . . . . . . . . . . . . . . . . . . . . . . . . . . . . . . . . . . . 1,794 5,482
Total current assets . . . . . . . . . . . . . . . . . . . . . . . . . . . . . . . . . . . . . . . . . . . . . . . . . . . . . . . . . . . 264,621 240,111 PROPERTY, PLANT AND EQUIPMENT, at cost: Land . . . . . . . . . . . . . . . . . . . . . . . . . . . . . . . . . . . . . . . . . . . . . . . . . . . . . . . . . . . . . . . . . . . . . . . . . . . . . . 22,360 21,683 Buildings . . . . . . . . . . . . . . . . . . . . . . . . . . . . . . . . . . . . . . . . . . . . . . . . . . . . . . . . . . . . . . . . . . . . . . . . . . 113,279 111,044 Machinery and equipment . . . . . . . . . . . . . . . . . . . . . . . . . . . . . . . . . . . . . . . . . . . . . . . . . . . . . . . . . . . . . 350,929 340,405 Construction in progress . . . . . . . . . . . . . . . . . . . . . . . . . . . . . . . . . . . . . . . . . . . . . . . . . . . . . . . . . . . . . . 1,641 3,403 488,209 476,535 Less—Accumulated depreciation . . . . . . . . . . . . . . . . . . . . . . . . . . . . . . . . . . . . . . . . . . . . . . . . . . . . . . . 298,128 279,619
Net property, plant and equipment . . . . . . . . . . . . . . . . . . . . . . . . . . . . . . . . . . . . . . . . . . . . . . . 190,081 196,916 OTHER ASSETS: Goodwill . . . . . . . . . . . . . . . . . . . . . . . . . . . . . . . . . . . . . . . . . . . . . . . . . . . . . . . . . . . . . . . . . . . . . . . . . . . 73,237 73,237 Trademarks . . . . . . . . . . . . . . . . . . . . . . . . . . . . . . . . . . . . . . . . . . . . . . . . . . . . . . . . . . . . . . . . . . . . . . . . 175,024 175,024 Investments . . . . . . . . . . . . . . . . . . . . . . . . . . . . . . . . . . . . . . . . . . . . . . . . . . . . . . . . . . . . . . . . . . . . . . . . 163,579 148,532 Split dollar officer life insurance . . . . . . . . . . . . . . . . . . . . . . . . . . . . . . . . . . . . . . . . . . . . . . . . . . . . . . . . . 33,632 40,296 Prepaid expenses . . . . . . . . . . . . . . . . . . . . . . . . . . . . . . . . . . . . . . . . . . . . . . . . . . . . . . . . . . . . . . . . . . . 6,927 10,260 Restricted cash . . . . . . . . . . . . . . . . . . . . . . . . . . . . . . . . . . . . . . . . . . . . . . . . . . . . . . . . . . . . . . . . . . . . . 1,589 — Deferred income taxes . . . . . . . . . . . . . . . . . . . . . . . . . . . . . . . . . . . . . . . . . . . . . . . . . . . . . . . . . . . . . . . . 1,696 4,033
Total other assets . . . . . . . . . . . . . . . . . . . . . . . . . . . . . . . . . . . . . . . . . . . . . . . . . . . . . . . . . . . . . 455,684 451,382 Total assets . . . . . . . . . . . . . . . . . . . . . . . . . . . . . . . . . . . . . . . . . . . . . . . . . . . . . . . . . . . . . . . . . . . . . . . . $910,386 $888,409 (The accompanying notes are an integral part of these statements.)
Merrill Corp - Tootsie Roll 10-K ED [AUX] | 105969 | 27-Feb-15 18:28 | 15-2394-1.da | Sequence: 3CHKSUM Content: 41590 Layout: 1797 Graphics: No Graphics CLEAN
JOB: 15-2394-1 CYCLE#;BL#: 6; 0 TRIM: 11" x 8.5" COMPOSITECOLORS: Black, ~note-color 2, ~note-color 3 GRAPHICS: none V1.5

18
NOTE 1—SIGNIFICANT ACCOUNTING POLICIES:
Basis of consolidation:The consolidated financial statements include the accounts of Tootsie Roll Industries, Inc.
and its wholly-owned and majority-owned subsidiaries (the Company), which are primarilyengaged in the manufacture and sales of candy products. Non-controlling interests relating tomajority-owned subsidiaries are reflected in the consolidated financial statements and allsignificant intercompany transactions have been eliminated.
The preparation of financial statements in conformity with generally accepted accountingprinciples in the United States of America requires management to make estimates andassumptions that affect the reported amounts of assets and liabilities and disclosure ofcontingent assets and liabilities at the date of the financial statements and the reported amountsof revenues and expenses during the reporting period. Actual results could differ from thoseestimates.
Revenue recognition:Products are sold to customers based on accepted purchase orders which include quantity,
sales price and other relevant terms of sale. Revenue, net of applicable provisions for discounts,returns, allowances and certain advertising and promotional costs, is recognized when productsare delivered to customers and collectability is reasonably assured. Shipping and handlingcosts of $46,525, $45,367, and $45,072 in 2014, 2013 and 2012, respectively, are included inselling, marketing and administrative expenses. Accounts receivable are unsecured.
Cash and cash equivalents:The Company considers temporary cash investments with an original maturity of three months
or less to be cash equivalents.
Investments:Investments consist of various marketable securities with maturities of generally up to three
years. The Company classifies debt and equity securities as either available for sale or trading.Available for sale securities are not actively traded by the Company and are carried at fairvalue. The Company follows current fair value measurement guidance and unrealized gainsand losses on these securities are excluded from earnings and are reported as a separatecomponent of shareholders’ equity, net of applicable taxes, until realized or other-than-temporarily impaired. Trading securities relate to deferred compensation arrangements andare carried at fair value with gains or losses included in other income, net. The Company investsin trading securities to economically hedge changes in its deferred compensation liabilities.
The Company regularly reviews its investments to determine whether a decline in fair valuebelow the cost basis is other-than-temporary. If the decline in fair value is judged to be other-than-temporary, the cost basis of the security is written down to fair value and the amount of thewrite-down is included in other income, net. Further information regarding the fair value of theCompany’s investments is included in Note 10 to the Consolidated Financial Statements.
Derivative instruments and hedging activities:Authoritative guidance requires qualitative disclosures about objectives and strategies for
using derivatives, quantitative disclosures about fair value amounts of derivative instrumentsand related gains and losses, and disclosures about credit-risk-related contingent features inderivative agreements.
From time to time, the Company enters into commodity futures, commodity options contractsand foreign currency forward contracts. Commodity futures and options are intended and are
effective as hedges of market price risks associated with the anticipated purchase of certainraw materials (primarily sugar). Foreign currency forward contracts are intended and areeffective as hedges of the Company’s exposure to the variability of cash flows, primarily relatedto the foreign exchange rate changes of products manufactured in Canada and sold in theUnited States, and periodic equipment purchases from foreign suppliers denominated in aforeign currency. The Company does not engage in trading or other speculative use of derivativeinstruments. Further information regarding derivative instruments and hedging activities isincluded in Note 11 to the Consolidated Financial Statements.
Inventories:Inventories are stated at cost, not to exceed market. The cost of substantially all of the
Company’s inventories ($65,545 and $58,038 at December 31, 2014 and 2013, respectively)has been determined by the last-in, first-out (LIFO) method. The excess of current cost overLIFO cost of inventories approximates $18,117 and $20,926 at December 31, 2014 and 2013,respectively. The cost of certain foreign inventories ($4,834 and $3,818 at December 31, 2014and 2013, respectively) has been determined by the first-in, first-out (FIFO) method. Rebates,discounts and other cash consideration received from vendors related to inventory purchasesis reflected as a reduction in the cost of the related inventory item, and is therefore reflected incost of sales when the related inventory item is sold.
Property, plant and equipment:Depreciation is computed for financial reporting purposes by use of the straight-line method
based on useful lives of 20 to 35 years for buildings and 5 to 20 years for machinery andequipment. Depreciation expense was $20,758, $20,050 and $19,925 in 2014, 2013 and 2012,respectively.
Carrying value of long-lived assets:The Company reviews long-lived assets to determine if there are events or circumstances
indicating that the amount of the asset reflected in the Company’s balance sheet may not berecoverable. When such indicators are present, the Company compares the carrying value ofthe long-lived asset, or asset group, to the future undiscounted cash flows of the underlyingassets to determine if impairment exists. If applicable, an impairment charge would be recordedto write down the carrying value to its fair value. The determination of fair value involves the useof estimates of future cash flows that involve considerable management judgment and arebased upon assumptions about expected future operating performance. The actual cash flowscould differ from management’s estimates due to changes in business conditions, operatingperformance, and economic conditions. No impairment charges of long-lived assets wererecorded by the Company during 2014, 2013 and 2012.
Postretirement health care benefits:The Company provides certain postretirement health care benefits to corporate office and
management employees. The cost of these postretirement benefits is accrued duringemployees’ working careers. See Note 7 for changes to these benefits and the resulting effectsof the negative amendment, as defined by guidance. The Company also provides split dollarlife benefits to certain executive officers. The Company records an asset equal to the cumulativeinsurance premiums paid that will be recovered upon the death of covered employees or earlierunder the terms of the plan. No premiums were paid in 2014, 2013 and 2012. Certain splitdollar agreements were terminated during 2014 and 2013 which resulted in the full repaymentto the Company of all of the cumulative premiums previously paid on these policies. During2014 and 2013, the Company received $6,496 and $26,477, respectively, of such repaymentswhich were recorded as a reduction in the carrying value of Split Dollar Officer Life Insurance.
Notes to Consolidated Financial Statements ($ in thousands except per share data)
TOOTSIE ROLL INDUSTRIES, INC. AND SUBSIDIARIES
Merrill Corp - Tootsie Roll 10-K ED [AUX] | 105969 | 27-Feb-15 18:28 | 15-2394-1.ea | Sequence: 1CHKSUM Content: 506 Layout: 31688 Graphics: No Graphics CLEAN
JOB: 15-2394-1 CYCLE#;BL#: 6; 0 TRIM: 11" x 8.5" COMPOSITECOLORS: Black, ~note-color 2, ~note-color 3 GRAPHICS: none V1.5
17
CONSOLIDATED STATEMENTS OF
Cash FlowsTOOTSIE ROLL INDUSTRIES, INC. AND SUBSIDIARIES (in thousands)
For the year ended December 31,
2014 2013 2012 CASH FLOWS FROM OPERATING ACTIVITIES: Net earnings . . . . . . . . . . . . . . . . . . . . . . . . . . . . . . . . . . . . . . . . . . . . . . . . . . . . . $ 62,860 $ 60,849 $ 52,004 Adjustments to reconcile net earnings to net cash provided by operating activities: Depreciation . . . . . . . . . . . . . . . . . . . . . . . . . . . . . . . . . . . . . . . . . . . . . . . . . . 20,758 20,050 19,925 Net loss on step acquisition . . . . . . . . . . . . . . . . . . . . . . . . . . . . . . . . . . . . . . 529 — — Impairment of equity method investment . . . . . . . . . . . . . . . . . . . . . . . . . . . . — 975 850 Loss from equity method investment . . . . . . . . . . . . . . . . . . . . . . . . . . . . . . . — 967 1,019 Amortization of marketable security premiums . . . . . . . . . . . . . . . . . . . . . . . 3,261 3,035 1,770 Changes in operating assets and liabilities: Accounts receivable . . . . . . . . . . . . . . . . . . . . . . . . . . . . . . . . . . . . . . . . (2,007) 1,330 272 Other receivables . . . . . . . . . . . . . . . . . . . . . . . . . . . . . . . . . . . . . . . . . . 1,289 253 (2,720) Inventories . . . . . . . . . . . . . . . . . . . . . . . . . . . . . . . . . . . . . . . . . . . . . . . (7,329) 503 9,588 Prepaid expenses and other assets . . . . . . . . . . . . . . . . . . . . . . . . . . . . 9,524 14,922 11,295 Accounts payable and accrued liabilities . . . . . . . . . . . . . . . . . . . . . . . (1,268) 418 199 Income taxes payable and deferred . . . . . . . . . . . . . . . . . . . . . . . . . . . (1,024) 68 1,369 Postretirement health care benefits . . . . . . . . . . . . . . . . . . . . . . . . . . . . (1,289) 2,861 2,829 Deferred compensation and other liabilities . . . . . . . . . . . . . . . . . . . . . . 3,465 3,592 3,018 Net cash provided by operating activities . . . . . . . . . . . . . . . . . . . . . . . . . . . . . . 88,769 109,823 101,418 CASH FLOWS FROM INVESTING ACTIVITIES: Net cash acquired in step acquisition . . . . . . . . . . . . . . . . . . . . . . . . . . . . . . . . . 161 — — Change in restricted cash . . . . . . . . . . . . . . . . . . . . . . . . . . . . . . . . . . . . . . . . . . . 224 — — Capital expenditures . . . . . . . . . . . . . . . . . . . . . . . . . . . . . . . . . . . . . . . . . . . . . . . (10,704) (15,752) (8,886) Net sales (purchases) of trading securities . . . . . . . . . . . . . . . . . . . . . . . . . . . . . (3,567) (5,500) (2,994) Purchase of available for sale securities . . . . . . . . . . . . . . . . . . . . . . . . . . . . . . . . (54,882) (66,324) (39,016) Sale and maturity of available for sale securities . . . . . . . . . . . . . . . . . . . . . . . . . 38,309 39,613 10,461 Net cash used in investing activities . . . . . . . . . . . . . . . . . . . . . . . . . . . . . . . . . . . (30,459) (47,963) (40,435) CASH FLOWS FROM FINANCING ACTIVITIES: Shares purchased and retired . . . . . . . . . . . . . . . . . . . . . . . . . . . . . . . . . . . . . . . (25,020) (23,143) (23,803) Dividends paid in cash . . . . . . . . . . . . . . . . . . . . . . . . . . . . . . . . . . . . . . . . . . . . . (19,241) (14,282) (52,431) Repayment of bank loans . . . . . . . . . . . . . . . . . . . . . . . . . . . . . . . . . . . . . . . . . . . (403) — — Net cash used in financing activities . . . . . . . . . . . . . . . . . . . . . . . . . . . . . . . . . . (44,664) (37,425) (76,234) Effect of exchange rate changes on cash . . . . . . . . . . . . . . . . . . . . . . . . . . . . . . (1,821) (14) 501 Increase (decrease) in cash and cash equivalents . . . . . . . . . . . . . . . . . . . . . . . . . . . 11,825 24,421 (14,750) Cash and cash equivalents at beginning of year . . . . . . . . . . . . . . . . . . . . . . . . . . . . . 88,283 63,862 78,612 Cash and cash equivalents at end of year . . . . . . . . . . . . . . . . . . . . . . . . . . . . . . . . . . $100,108 $ 88,283 $ 63,862 Supplemental cash flow information: Income taxes paid . . . . . . . . . . . . . . . . . . . . . . . . . . . . . . . . . . . . . . . . . . . . . . . . . $ 26,599 $ 24,225 $ 21,312 Interest paid . . . . . . . . . . . . . . . . . . . . . . . . . . . . . . . . . . . . . . . . . . . . . . . . . . . . . $ 34 $ 21 $ 31 Stock dividend issued . . . . . . . . . . . . . . . . . . . . . . . . . . . . . . . . . . . . . . . . . . . . . . $ 52,165 $ 48,925 $ 38,236(The accompanying notes are an integral part of these statements.)
Merrill Corp - Tootsie Roll 10-K ED [AUX] | 105969 | 27-Feb-15 18:28 | 15-2394-1.da | Sequence: 5CHKSUM Content: 44647 Layout: 48602 Graphics: No Graphics CLEAN
JOB: 15-2394-1 CYCLE#;BL#: 6; 0 TRIM: 11" x 8.5" COMPOSITECOLORS: Black, ~note-color 2, ~note-color 3 GRAPHICS: none V1.5

Use of estimates:The preparation of consolidated financial statements in conformity with accounting principles
generally accepted in the U.S. requires management to make estimates and assumptions thataffect the amounts reported. Estimates are used when accounting for sales discounts,allowances and incentives, product liabilities, assets recorded at fair value, income taxes,depreciation, amortization, employee benefits, contingencies and intangible asset and liabilityvaluations. Actual results may or may not differ from those estimates.
Recent accounting pronouncements:In August 2014, the FASB issued ASU 2014-15 which provides guidance about management’s
responsibility to evaluate whether there is substantial doubt about an entity’s ability to continueas a going concern and to provide related footnote disclosures. This guidance will be effectivefor the annual period ending after December 15, 2016, and for annual periods and interimperiods thereafter. We do not expect the adoption of this guidance to have a significant impacton our condensed consolidated financial statements.
In May 2014, the Financial Accounting Standards Board (“FASB”) issued AccountingStandards Update (“ASU”) 2014-09 that introduces a new five-step revenue recognition modelin which an entity should recognize revenue to depict the transfer of promised goods or servicesto customers in an amount that reflects the consideration to which the entity expects to beentitled in exchange for those goods or services. This ASU also requires disclosures sufficientto enable users to understand the nature, amount, timing, and uncertainty of revenue and cashflows arising from contracts with customers, including qualitative and quantitative disclosuresabout contracts with customers, significant judgments and changes in judgments, and assetsrecognized from the costs to obtain or fulfill a contract. This standard is effective for fiscal yearsbeginning after December 15, 2016, including interim periods within that reporting period. TheCompany is currently evaluating the new guidance to determine the impact it may have on thecondensed consolidated financial statements.
In April 2014, the FASB issued ASU 2014-08, which includes amendments that change therequirements for reporting discontinued operations. The new guidance requires that the disposalof a component of an entity be reported as discontinued operations only if the action representsa strategic shift that will have a major effect on an entity’s operations and financial results, andwould require expanded disclosures. This guidance will be effective beginning in the first quarter2015. We do not expect the adoption of this guidance to have a significant impact on thecondensed consolidated financial statements.
NOTE 2—ACCRUED LIABILITIES:
Accrued liabilities are comprised of the following: December 31, 2014 2013 Compensation . . . . . . . . . . . . . . . . . . . . . . . . . . . . . . . . . . . . . . . . . . . . . . . . . . $ 9,788 $ 9,445Other employee benefits . . . . . . . . . . . . . . . . . . . . . . . . . . . . . . . . . . . . . . . . . . 7,185 7,825Taxes, other than income . . . . . . . . . . . . . . . . . . . . . . . . . . . . . . . . . . . . . . . . . 3,284 2,776Advertising and promotions . . . . . . . . . . . . . . . . . . . . . . . . . . . . . . . . . . . . . . . 19,805 19,133Other . . . . . . . . . . . . . . . . . . . . . . . . . . . . . . . . . . . . . . . . . . . . . . . . . . . . . . . . . 6,420 6,401 $46,482 $45,580
NOTE 3—INDUSTRIAL DEVELOPMENT BONDS:
Industrial development bonds are due in 2027. The average floating interest rate, which isreset weekly, was 0.1% and 0.2% in 2014 and 2013, respectively. See Note 10 to theConsolidated Financial Statements for fair value disclosures.
NOTE 4—INCOME TAXES:
The domestic and foreign components of pretax income are as follows: 2014 2013 2012 Domestic . . . . . . . . . . . . . . . . . . . . . . . . . . . . . . . . . . . . . . . . . $81,255 $73,362 $64,173Foreign . . . . . . . . . . . . . . . . . . . . . . . . . . . . . . . . . . . . . . . . . . 10,039 11,121 9,991 $91,294 $84,483 $74,164
The provision for income taxes is comprised of the following: 2014 2013 2012 Current: Federal . . . . . . . . . . . . . . . . . . . . . . . . . . . . . . . . . . . . . . . . . $25,173 $16,192 $24,312 Foreign . . . . . . . . . . . . . . . . . . . . . . . . . . . . . . . . . . . . . . . . . 549 219 231 State . . . . . . . . . . . . . . . . . . . . . . . . . . . . . . . . . . . . . . . . . . . 1,538 891 1,914 27,260 17,302 26,457 Deferred: Federal . . . . . . . . . . . . . . . . . . . . . . . . . . . . . . . . . . . . . . . . . (172) 4,286 (6,857) Foreign . . . . . . . . . . . . . . . . . . . . . . . . . . . . . . . . . . . . . . . . . 2,032 1,823 1,710 State . . . . . . . . . . . . . . . . . . . . . . . . . . . . . . . . . . . . . . . . . . . (686) 223 850 1,174 6,332 (4,297) $28,434 $23,634 $22,160
Significant components of the Company’s net deferred tax liability at year end were as follows: December 31, 2014 2013 Deferred tax assets: Accrued customer promotions . . . . . . . . . . . . . . . . . . . . . . . . . . . . . . . . . . . . $ 3,219 $ 3,156 Deferred compensation . . . . . . . . . . . . . . . . . . . . . . . . . . . . . . . . . . . . . . . . . 28,099 25,103 Postretirement benefits . . . . . . . . . . . . . . . . . . . . . . . . . . . . . . . . . . . . . . . . . 4,895 3,847 Other accrued expenses . . . . . . . . . . . . . . . . . . . . . . . . . . . . . . . . . . . . . . . . 7,660 6,158 Foreign subsidiary tax loss carry forward . . . . . . . . . . . . . . . . . . . . . . . . . . . 12,972 12,512 Tax credit carry forward . . . . . . . . . . . . . . . . . . . . . . . . . . . . . . . . . . . . . . . . . 1,530 1,243 Realized capital losses . . . . . . . . . . . . . . . . . . . . . . . . . . . . . . . . . . . . . . . . . — 581 Unrealized capital loss . . . . . . . . . . . . . . . . . . . . . . . . . . . . . . . . . . . . . . . . . . — — 58,375 52,600 Valuation allowance . . . . . . . . . . . . . . . . . . . . . . . . . . . . . . . . . . . . . . . . . . . . (2,478) (957) Total deferred tax assets . . . . . . . . . . . . . . . . . . . . . . . . . . . . . . . . . . . . . . . . $55,897 $51,643 Deferred tax liabilities: Depreciation . . . . . . . . . . . . . . . . . . . . . . . . . . . . . . . . . . . . . . . . . . . . . . . . . . $31,520 $33,129 Deductible goodwill and trademarks . . . . . . . . . . . . . . . . . . . . . . . . . . . . . . . 43,960 42,073 Accrued export company commissions . . . . . . . . . . . . . . . . . . . . . . . . . . . . 5,555 5,391 Employee benefit plans . . . . . . . . . . . . . . . . . . . . . . . . . . . . . . . . . . . . . . . . . 3,907 5,100 Inventory reserves . . . . . . . . . . . . . . . . . . . . . . . . . . . . . . . . . . . . . . . . . . . . . 3,422 1,646 Prepaid insurance . . . . . . . . . . . . . . . . . . . . . . . . . . . . . . . . . . . . . . . . . . . . . 867 785 Unrealized capital gain . . . . . . . . . . . . . . . . . . . . . . . . . . . . . . . . . . . . . . . . . 2,364 709 Deferred gain on sale of real estate . . . . . . . . . . . . . . . . . . . . . . . . . . . . . . . . 8,168 8,234 Total deferred tax liabilities . . . . . . . . . . . . . . . . . . . . . . . . . . . . . . . . . . . . . . . $99,763 $97,067 Net deferred tax liability . . . . . . . . . . . . . . . . . . . . . . . . . . . . . . . . . . . . . . . . . $43,866 $45,424
At December 31, 2014, the Company has recognized $386 of benefits related to its Mexicansubsidiary tax credit carry-forwards. The carry-forward credits expire in 2017. A valuation allowancehas been established for the carry-forward losses to reduce the future income tax benefits toamounts expected to be realized. The Company has also recognized $1,144 of benefits related tostate tax credit carry-forwards. The state credit carry-forward expires in 2021. The Company expectsthat these state credit carry-forwards will be utilized before their expiration.
20
Merrill Corp - Tootsie Roll 10-K ED [AUX] | 105969 | 27-Feb-15 18:28 | 15-2394-1.ea | Sequence: 3CHKSUM Content: 44516 Layout: 65305 Graphics: No Graphics CLEAN
JOB: 15-2394-1 CYCLE#;BL#: 6; 0 TRIM: 11" x 8.5" COMPOSITECOLORS: Black, ~note-color 2, ~note-color 3 GRAPHICS: none V1.5
Goodwill and indefinite-lived intangible assets:In accordance with authoritative guidance, goodwill and intangible assets with indefinite lives
are not amortized, but rather tested for impairment at least annually unless certain interimtriggering events or circumstances require more frequent testing. All trademarks have beenassessed by management to have indefinite lives because they are expected to generate cashflows indefinitely. Management believes that all assumptions used for the impairment tests areconsistent with those utilized by market participants performing similar valuations The Companyhas completed its annual impairment testing of its goodwill and trademarks at December 31 ofeach of the years presented. No impairments of intangibles, including goodwill were recordedin 2014, 2013 and 2012.
With respect to impairment testing of goodwill, the first step compares the reporting unit’sestimated fair value with its carrying value. Projected discounted cash flows are used todetermine the fair value of the reporting unit. If the carrying value of a reporting unit’s net assetsexceeds its fair value, the second step is applied to measure the difference between the carryingvalue and implied fair value of goodwill. If the carrying value of goodwill exceeds its implied fairvalue, the goodwill is considered impaired and reduced to its implied fair value. Non-amortizableintangible assets, trademarks, are tested for impairment by comparing the fair value of eachtrademark with its carrying value. The fair value of trademarks is determined using discountedcash flows and estimates of royalty rates. If the carrying value exceeds fair value, the trademarkis considered impaired and is reduced to fair value.
Income taxes:Deferred income taxes are recorded and recognized for future tax effects of temporary
differences between financial and income tax reporting. The Company records valuationallowances in situations where the realization of deferred tax assets is not more-likely-than-not.Federal income taxes are provided on the portion of income of foreign subsidiaries that isexpected to be remitted to the U.S. and become taxable, but not on the portion that isconsidered to be permanently reinvested in the foreign subsidiary.
Foreign currency translation:The U.S. dollar is used as the functional currency where a substantial portion of the subsidiary’s
business is indexed to the U.S. dollar or where its manufactured products are principally soldin the U.S. All other foreign subsidiaries use the local currency as their functional currency.Where the U.S. dollar is used as the functional currency, foreign currency remeasurements arerecorded as a charge or credit to other income, net in the statement of earnings. Where theforeign local currency is used as the functional currency, translation adjustments are recordedas a separate component of accumulated other comprehensive income (loss).
Equity method investment and majority-owned subsidiaries:The 2013 and 2012 financial results include the Company’s 50% interest in two Spanish
companies that was accounted for using the equity method. The Company recorded an increasein its investment to the extent of its share of earnings, and reduced its investment to the extentof losses and dividends received. No dividends were paid in 2013 and 2012.
As of December 31, 2013 and 2012, management determined that the carrying value of thisequity method investment was impaired as a result of accumulated losses from operations andreview of future expectations. The Company recorded a pre-tax impairment charge of $975and $850 in 2013 and 2012, respectively. The fair value was assessed primarily using thediscounted cash flow method and liquidation valuation. The key inputs to this method includeprojections of future cash flows, determinations of appropriate discount rates, and otherassumptions of the equity method investee which are considered reasonable and inherent in
the discounted cash flow analysis. The Company’s carrying value of this investment atDecember 31, 2013 was not significant.
During first quarter 2014, the Company gained operating control of its two 50% owned Spanishcompanies when Company employee representatives assumed all positions on their boards ofdirectors. This was considered a step acquisition, whereby the Company remeasured thepreviously held investment to fair value in first quarter 2014. As a result, the Company’s firstquarter 2014 net earnings include a net loss of $529, including an additional income taxprovision of $2,350 relating to deferred income taxes. During 2014, the Company furtherincreased its control and ownership to 83% by subscribing to additional common shares ofthese Spanish subsidiaries for approximately $1,400 ($1,200 was paid in 2014, and the balancewill be paid in 2015). The accompanying consolidated financial statements for the year endedDecember 31, 2014 include these Spanish companies and related minority interests. TheseSpanish subsidiaries are not material to the Company’s consolidated financial statements.
Restricted cash:
Restricted cash comprises certain cash deposits of the Company’s majority-owned Spanishsubsidiaries with international banks that are pledged as collateral for letters of credit and bankborrowings.
VEBA trust:
During fourth quarter 2014 and 2013, the Company contributed $1,000 and $15,000 to aVEBA trust, managed and controlled by the Company, to fund the estimated future costs ofcertain employee health, welfare and other benefits. The Company is using these funds to paythe actual cost of such benefits through 2017. At December 31, 2014 and 2013, the VEBA trustheld $10,845 and $13,991, respectively, of aggregate cash and cash equivalents. This assetvalue is included in prepaid expenses and long-term other assets in the Company’sConsolidated Statement of Financial Position. These assets are categorized as Level 1 withinthe fair value hierarchy.
Bank loans:
Long term bank loans comprise borrowings by the Company’s majority-owned Spanishsubsidiaries which are held by international banks. The average weighted interest rate in 2014was of 3.0% and maturity dates range from 1 to 4 years. Short term bank loans also relate tothe Company’s majority-owned Spanish subsidiaries.
Comprehensive earnings:
Comprehensive earnings includes net earnings, foreign currency translation adjustments andunrealized gains/losses on commodity and/or foreign currency hedging contracts, available forsale securities and certain postretirement benefit obligations.
Earnings per share:
A dual presentation of basic and diluted earnings per share is not required due to the lack ofpotentially dilutive securities under the Company’s simple capital structure. Therefore, allearnings per share amounts represent basic earnings per share.
The Class B Common Stock has essentially the same rights as Common Stock, except thateach share of Class B Common Stock has ten votes per share (compared to one vote per shareof Common Stock), is not traded on any exchange, is restricted as to transfer and is convertibleon a share-for-share basis, at any time and at no cost to the holders, into shares of CommonStock which are traded on the New York Stock Exchange.
19
Merrill Corp - Tootsie Roll 10-K ED [AUX] | 105969 | 27-Feb-15 18:28 | 15-2394-1.ea | Sequence: 2CHKSUM Content: 51371 Layout: 24359 Graphics: No Graphics CLEAN
JOB: 15-2394-1 CYCLE#;BL#: 6; 0 TRIM: 11" x 8.5" COMPOSITECOLORS: Black, ~note-color 2, ~note-color 3 GRAPHICS: none V1.5

NOTE 6—OTHER INCOME, NET:
Other income, net is comprised of the following: 2014 2013 2012 Interest and dividend income . . . . . . . . . . . . . . . . . . . . . . . . . . . . . . $1,582 $ 1,445 $ 1,369Gains on trading securities relating to deferred compensation plans . . . . . . . . . . . . . . . . . . . . . . . . . . . . 4,901 10,588 4,616Interest expense . . . . . . . . . . . . . . . . . . . . . . . . . . . . . . . . . . . . . . . . (99) (92) (137)Pretax gain on step acquisition . . . . . . . . . . . . . . . . . . . . . . . . . . . . 1,821 — —Impairment of equity investment . . . . . . . . . . . . . . . . . . . . . . . . . . . — (975) (850)Equity method investment loss . . . . . . . . . . . . . . . . . . . . . . . . . . . . . — (967) (1,019)Foreign exchange gains (losses) . . . . . . . . . . . . . . . . . . . . . . . . . . . (861) (790) 442Capital gains (losses) . . . . . . . . . . . . . . . . . . . . . . . . . . . . . . . . . . . . (219) 2,576 (59)Miscellaneous, net . . . . . . . . . . . . . . . . . . . . . . . . . . . . . . . . . . . . . . 246 345 323 $7,371 $12,130 $ 4,685
NOTE 7—EMPLOYEE BENEFIT PLANS:
Pension plans:The Company sponsors defined contribution pension plans covering certain non-union
employees with over one year of credited service. The Company’s policy is to fund pensioncosts accrued based on compensation levels. Total pension expense for 2014, 2013 and 2012approximated $4,391, $4,437 and $4,327, respectively. The Company also maintains certainprofit sharing and retirement savings-investment plans. Company contributions in 2014, 2013and 2012 to these plans were $1,117, $1,121 and $1,107, respectively.
The Company also contributes to a multi-employer defined benefit pension plan for certain ofits union employees under a collective bargaining agreement which is currently undernegotiation, as follows:
Plan name: Bakery and Confectionery Union and Industry International Pension FundEmployer Identification Number and plan number: 52-6118572, plan number 001Funded Status as of the most recent year available: 66.41% funded as of January 1, 2013The Company’s contributions to such plan: $2,588, $2,231 and $2,131 in 2014, 2013 and
2012, respectivelyPlan status: Critical as of December 31, 2013
Beginning in 2012, the Company received notices from the Bakery, Confectionery, TobaccoWorkers and Grain Millers International Union (BC&T) Pension Plan (Plan), a multi-employerdefined benefit pension plan for certain Company union employees. The notices indicated thatthe Plan’s actuary certified the Plan to be in critical status, the “Red Zone”, as defined by thePension Protection Act (PPA) and the Pension Benefit Guaranty Corporation (PBGC), and thata plan of rehabilitation was adopted by the trustees of the Plan in fourth quarter 2012. Therehabilitation plan, which continues, requires that employer contributions include 5%compounded annual surcharge increases each year for an unspecified period of time beginningJanuary 2013 (in addition to the 5% interim surcharge initiated in June 2012) as well as certainplan benefit reductions. Under the plan of rehabilitation, the Plan is projected to emerge fromcritical status sometime beyond a 30 year projection period. In the event that a plan does nothave the financial resources to ultimately pay benefits at a level specified by law, then it mustapply to the PBGC for government financial assistance. The Trustees have advised that neitherthe PPA nor regulatory guidance currently defines the rehabilitation standards for a plan that isnot designed to emerge from critical status within the prescribed 10-year rehabilitation period.Recently enacted legislation (Multiemployer Pension Reform Act of 2014) may also affect thefuture of this Plan.
The Company was previously advised by the Plan that if the Company had withdrawn fromthe Plan during 2012 its estimated withdrawal liability would have been $37,200. The Company
was recently advised by the Plan that its withdrawal liability would have been $56,400 if it hadwithdrawn from the Plan during 2014. The increase from 2012 to 2014 principally reflectschanges in key actuarial assumptions, principally the effects of a lower interest rates proscribedby PBGC which were partially used to determine the present value of vested benefits, and achange to a more conservative mortality table. Should the Company actually withdraw from thePlan at a future date, a withdrawal liability, which could be higher than the above discussedamounts, could be payable to the Plan.
The Company’s existing labor contract with its BC&T local union commits the Company’sparticipation in this Plan through third quarter 2017. Pension expense, including surcharges,for the BC&T Plan for 2014 and 2013 was $2,588 and $2,231, respectively. The aforementionedexpense includes surcharge increases of $342 and $242 in 2014 and 2013, respectively, relatedto the contribution increases required under the plan of rehabilitation. The Company is currentlyunable to determine the ultimate outcome of the above discussed matter and therefore, isunable to determine the effects on its consolidated financial statements, but, the ultimateoutcome could be material to its consolidated results of operations in one or more future periods.
Deferred compensation:The Company sponsors three deferred compensation plans for selected executives and other
employees: (i) the Excess Benefit Plan, which restores retirement benefits lost due to IRSlimitations on contributions to tax-qualified plans, (ii) the Supplemental Plan, which allows eligibleemployees to defer the receipt of eligible compensation until designated future dates and(iii) the Career Achievement Plan, which provides a deferred annual incentive award to selectedexecutives. Participants in these plans earn a return on amounts due them based on severalinvestment options, which mirror returns on underlying investments (primarily mutual funds).The Company economically hedges its obligations under the plans by investing in the actualunderlying investments. These investments are classified as trading securities and are carriedat fair value. At December 31, 2014 and 2013, these investments totaled $71,682 and $63,215,respectively. All gains and losses and related investment income from these investments, whichare recorded in other income, net, are equally offset by corresponding increases and decreasesin the Company’s deferred compensation liabilities.
Postretirement health care benefit plans:During fourth quarter 2013, the Company restructured and amended its post-retirement health
benefits plan provided to corporate office and management employees. These changes resultedin a negative plan amendment, as defined by accounting guidance, resulting in a $10,425reduction in the Company’s benefit obligation as of December 31, 2013. The plan changesgenerally limited future annual cost increases in health benefits to 3%, restricted this benefit tocurrent employees with long-term service with the Company, eliminated the Company providedlife insurance benefit and required retirees to pay the full cost of life insurance, and eliminatedall post-retirement benefits for future employees effective April 1, 2014. Post-retirement benefitsliabilities (as amended) were $12,311 and $9,176 at December 31, 2014 and 2013, respectively.The aforementioned increase reflects actuarial losses relating to an 86 basis point decrease inthe discount rate (3.83% discount rate used at December 31, 2014) which generally reflectslower market interest rates, and an update of the mortality table based on the Society ofActuaries’ research that indicates that retirees are living longer.
Amounts recognized in accumulated other comprehensive loss (pre-tax) at December 31,2014 are as follows:
Prior service credit . . . . . . . . . . . . . . . . . . . . . . . . . . . . . . . . . . . . . . . . . . . . . $ (9,449)Net actuarial loss . . . . . . . . . . . . . . . . . . . . . . . . . . . . . . . . . . . . . . . . . . . . . . (892) Net amount recognized in accumulated other comprehensive (gain) loss . . $(10,341)
The estimated actuarial loss (gain) and prior service credit (gain) to be amortized fromaccumulated other comprehensive loss (gain) into net periodic benefit cost during 2015 are$(101) and $(1,352), respectively.
22
Merrill Corp - Tootsie Roll 10-K ED [AUX] | 105969 | 27-Feb-15 18:28 | 15-2394-1.ea | Sequence: 5CHKSUM Content: 23746 Layout: 19628 Graphics: No Graphics CLEAN
JOB: 15-2394-1 CYCLE#;BL#: 6; 0 TRIM: 11" x 8.5" COMPOSITECOLORS: Black, ~note-color 2, ~note-color 3 GRAPHICS: none V1.5
At December 31, 2014, the tax benefits of the Company’s Canadian subsidiary tax loss carry-forwards expiring by year are as follows: $289 in 2027, $5,767 in 2028, $4,104 in 2029 and$720 in 2031. The Company expects that these carry-forwards will be realized before theirexpiration.
At December 31, 2014, the amounts of the Company’s Spanish subsidiary loss carry-forwardsexpiring by year are as follows: $304 in 2026, $64 in 2027, $223 in 2028, $110 in 2029, $341 in2030, $445 in 2031 and $605 in 2032. A full valuation allowance has been provided for theseSpanish loss carry-forwards as the Company expects that the losses will not be utilized beforetheir expiration.
The effective income tax rate differs from the statutory rate as follows: 2014 2013 2012 U.S. statutory rate . . . . . . . . . . . . . . . . . . . . . . . . . . . . . . . . . . . . . . . . . . 35.0% 35.0% 35.0%State income taxes, net . . . . . . . . . . . . . . . . . . . . . . . . . . . . . . . . . . . . . . 1.0 1.0 1.1Exempt municipal bond interest . . . . . . . . . . . . . . . . . . . . . . . . . . . . . . . (0.5) (0.4) (0.5)Foreign tax rates . . . . . . . . . . . . . . . . . . . . . . . . . . . . . . . . . . . . . . . . . . . (1.5) (2.0) (1.6)Qualified domestic production activities deduction . . . . . . . . . . . . . . . . (2.8) (2.2) (3.1)Tax credits receivable . . . . . . . . . . . . . . . . . . . . . . . . . . . . . . . . . . . . . . . (0.6) (0.9) (0.9)Adjustment of deferred tax balances . . . . . . . . . . . . . . . . . . . . . . . . . . . 1.9 (1.1) (0.5)Reserve for uncertain tax benefits . . . . . . . . . . . . . . . . . . . . . . . . . . . . . — (0.7) (0.3)Other, net . . . . . . . . . . . . . . . . . . . . . . . . . . . . . . . . . . . . . . . . . . . . . . . . . (1.4) (0.7) 0.7 Effective income tax rate . . . . . . . . . . . . . . . . . . . . . . . . . . . . . . . . . . . . . 31.1% 28.0% 29.9%
The Company has not provided for U.S. federal or foreign withholding taxes on $5,393 and$10,988 of foreign subsidiaries’ undistributed earnings as of December 31, 2014 andDecember 31, 2013, respectively, because such earnings are considered to be permanentlyreinvested. The Company estimates that the federal income tax liability on such remittanceswould approximate 30%. This foreign subsidiary holds $15,986 and $11,674 of cash and shortterm investments as of December 31, 2014 and 2013, respectively.
At December 31, 2014 and 2013, the Company had unrecognized tax benefits of $6,993 and$6,010, respectively. Included in this balance is $4,805 and $3,539, respectively, ofunrecognized tax benefits that, if recognized, would favorably affect the annual effective incometax rate. As of December 31, 2014 and 2013, $1,591 and $1,157, respectively, of interest andpenalties were included in the liability for uncertain tax positions.
A reconciliation of the beginning and ending balances of the total amounts of unrecognizedtax benefits is as follows: 2014 2013 2012 Unrecognized tax benefits at January 1 . . . . . . . . . . . . . . . . . . . . . . . . . . $ 6,010 $6,677 $6,804Increases in tax positions for the current year . . . . . . . . . . . . . . . . . . . . . . 1,827 1,163 727Increases in tax positions for new uncertain tax position . . . . . . . . . . . . . 609 — —Reductions in tax positions for lapse of statute of limitations . . . . . . . . . . (1,050) (867) (854)Reductions in tax positions relating to settlements with taxing authorities . . (403) (140) —Reductions in tax positions for effective settlements . . . . . . . . . . . . . . . . . — (823) — Unrecognized tax benefits at December 31 . . . . . . . . . . . . . . . . . . . . . . . $ 6,993 $6,010 $6,677
The Company recognizes interest and penalties related to unrecognized tax benefits in theprovision for income taxes on the Consolidated Statements of Earnings and Retained Earnings.
The Company is subject to taxation in the U.S. and various state and foreign jurisdictions.The Company remains subject to examination by U.S. federal and state and foreign taxauthorities for the years 2011 through 2013. With few exceptions, the Company is no longersubject to examinations by tax authorities for the years 2010 and prior.
The Company is currently subject to a federal income tax examination of tax years 2011 and2012. The Company’s Canadian subsidiary is currently subject to examination by the CanadaRevenue Agency for tax years 2005 and 2007. The Company’s Spanish subsidiaries arecurrently subject to a court hearing relating to a tax examination by the Spanish tax authorities.In addition, the Company is currently subject to various state tax examinations. Although theCompany is unable to determine the ultimate outcome of the ongoing examinations and courthearing, the Company believes that its liability for uncertain tax positions relating to thesejurisdictions for such years is adequate.
NOTE 5—SHARE CAPITAL AND CAPITAL IN EXCESS OF PAR VALUE:
Capital in Class B Excess Common Stock Common Stock Treasury Stock of Par
Shares Amount Shares Amount Shares Amount Value
(000’s) (000’s) (000’s) Balance at January 1, 2012 . . . . . . . . . . . . 36,479 $25,333 21,025 $14,601 71 $(1,992) $533,677Issuance of 3% stock dividend . . . . . . . . . 1,085 753 631 437 2 — 37,046Conversion of Class B common shares to common shares . . . . . . . . . . . . . . . . . . . . 29 20 (29) (20) — — —
Purchase and retirement of common shares . . . . . . . . . . . . . . . . . . . . . . . . . . . . (944) (656) — — — — (23,147)
Balance at December 31, 2012 . . . . . . . . . 36,649 25,450 21,627 15,018 73 (1,992) 547,576Issuance of 3% stock dividend . . . . . . . . . 1,095 761 648 450 3 — 47,714Conversion of Class B common shares to common shares . . . . . . . . . . . . . . . . . . . . 19 13 (19) (13) — — —
Purchase and retirement of common shares . . . . . . . . . . . . . . . . . . . . . . . . . . . . (752) (522) — — — — (22,621)
Balance at December 31, 2013 . . . . . . . . . 37,011 25,702 22,256 15,455 76 (1,992) 572,669Issuance of 3% stock dividend . . . . . . . . . 1,099 763 667 464 2 — 50,939Conversion of Class B common shares to common shares . . . . . . . . . . . . . . . . . . . . 36 25 (36) (25) — — —
Purchase and retirement of common shares . . (861) (598) — — — — (24,422)
Balance at December 31, 2014 . . . . . . . . . 37,285 $25,892 22,887 $15,894 78 $(1,992) $599,186
Average shares outstanding and all per share amounts included in the financial statementsand notes thereto have been adjusted retroactively to reflect annual three percent stockdividends.
While the Company does not have a formal or publicly announced Company Common Stockpurchase program, the Company’s board of directors periodically authorizes a dollar amountfor such share purchases.
Based upon this policy, shares were purchased and retired as follows:
Total Number of SharesYear Purchased (000’s) Average Price Paid Per Share
2014 . . . . . . . . . . . . . . . . . . . . . . . . . . . . . . . . . . . . . 861 $29.022013 . . . . . . . . . . . . . . . . . . . . . . . . . . . . . . . . 752 $30.732012 . . . . . . . . . . . . . . . . . . . . . . . . . . . . . . . . 944 $25.16
21
Merrill Corp - Tootsie Roll 10-K ED [AUX] | 105969 | 27-Feb-15 18:28 | 15-2394-1.ea | Sequence: 4CHKSUM Content: 937 Layout: 3919 Graphics: No Graphics CLEAN
JOB: 15-2394-1 CYCLE#;BL#: 6; 0 TRIM: 11" x 8.5" COMPOSITECOLORS: Black, ~note-color 2, ~note-color 3 GRAPHICS: none V1.5
Available for sale securities which utilize Level 2 inputs consist primarily of municipal andcorporate bonds, which are valued based on quoted market prices or alternative pricing sourceswith reasonable levels of price transparency.
A summary of the aggregate fair value, gross unrealized gains, gross unrealized losses,realized losses and amortized cost basis of the Company’s investment portfolio by major securitytype is as follows: December 31, 2014
Amortized Fair Unrealized Realized
Available for Sale: Cost Value Gains Losses Losses Municipal bonds . . . . . . . . . . . . . . . . . . . . . . $ 51,797 $ 51,804 $ 7 $ — $—Corporate bonds . . . . . . . . . . . . . . . . . . . . . . 72,587 72,075 — (512) —Government securities . . . . . . . . . . . . . . . . . . 2,450 2,446 (4) Certificates of deposit . . . . . . . . . . . . . . . . . . 5,014 5,007 (7) Mutual funds . . . . . . . . . . . . . . . . . . . . . . . . . 20 15 — (5) — $131,868 $131,347 $ 7 $(528) $—
December 31, 2013
Amortized Fair Unrealized Realized
Available for Sale: Cost Value Gains Losses Losses Municipal bonds . . . . . . . . . . . . . . . . . . . . . . $ 75,488 $ 75,622 $134 $ — $—Corporate bonds . . . . . . . . . . . . . . . . . . . . . . 37,258 37,214 — (44) —Certificates of deposit . . . . . . . . . . . . . . . . . . 5,796 5,794 (2) Mutual funds . . . . . . . . . . . . . . . . . . . . . . . . . 20 17 — (3) — $118,562 $118,647 $134 $ (49) $—
During the fourth quarter 2013, the Company sold its investment in Jefferson County AlabamaSewer Revenue Refunding Warrants for $10,840. This was an auction rate security (ARS)originally purchased for $13,550 in 2008 with an insurance-backed AAA rating. Because theCompany recorded an other-than-temporary pre-tax impairment of $5,140 in 2008 on this ARSinvestment which resulted in a carrying value of $8,410 at that time, a net gain of $2,430 wasrecorded on this sale in fourth quarter 2013. Since recording this initial impairment in 2008, theCompany has carried this ARS investment at its estimated fair value utilizing a valuation modelwith Level 3 inputs, as defined by guidance, and resulting changes in the market value sincethe original impairment charge in 2008 have been recorded as changes to accumulated othercomprehensive income (loss) each year.
The fair value of the Company’s industrial revenue development bonds at December 31, 2014and 2013 were valued using Level 2 inputs which approximates the carrying value of $7,500for both periods. Interest rates on these bonds reset weekly based on current market conditions.
NOTE 11—DERIVATIVE INSTRUMENTS AND HEDGING ACTIVITIES:
From time to time, the Company uses derivative instruments, including foreign currencyforward contracts, commodity futures contracts and commodity option contracts, to manageits exposures to foreign exchange and commodity prices. Commodity futures contracts andmost commodity option contracts are intended and effective as hedges of market price risksassociated with the anticipated purchase of certain raw materials (primarily sugar). Foreigncurrency forward contracts are intended and effective as hedges of the Company’s exposureto the variability of cash flows, primarily related to the foreign exchange rate changes of productsmanufactured in Canada and sold in the United States, and periodic equipment purchasesfrom foreign suppliers denominated in a foreign currency. The Company does not engage intrading or other speculative use of derivative instruments.
The Company recognizes all derivative instruments as either assets or liabilities at fair valuein the Consolidated Statements of Financial Position. Derivative assets are recorded in otherreceivables and derivative liabilities are recorded in accrued liabilities. The Company useseither hedge accounting or mark-to-market accounting for its derivative instruments. Derivativesthat qualify for hedge accounting are designated as cash flow hedges by formally documentingthe hedge relationships, including identification of the hedging instruments, the hedged itemsand other critical terms, as well as the Company’s risk management objectives and strategiesfor undertaking the hedge transaction.
Changes in the fair value of the Company’s cash flow hedges are recorded in accumulatedother comprehensive loss, net of tax, and are reclassified to earnings in the periods in whichearnings are affected by the hedged item. Substantially all amounts reported in accumulatedother comprehensive loss for commodity derivatives are expected to be reclassified to cost ofgoods sold. Substantially all amounts reported in accumulated other comprehensive loss forforeign currency derivatives are expected to be reclassified to other income, net.
The following table summarizes the Company’s outstanding derivative contracts and theireffects on its Consolidated Statements of Financial Position at December 31, 2014 and 2013: December 31, 2014 Notional Amounts Assets Liabilities Derivatives designated as hedging instruments: Foreign currency forward contracts . . . . . . . . . . . . . . . . . . . . . . $27,603 $— $(1,939) Commodity futures contracts . . . . . . . . . . . . . . . . . . . . . . . . . . . 5,422 23 (760) Total derivatives designated as hedging instruments: . . . . . . . . 23 (2,699) Derivatives not designated as hedging instruments: Commodity futures contracts . . . . . . . . . . . . . . . . . . . . . . . . . . . — — Total derivatives not designated as hedging instruments: . . . . . — — Total derivatives . . . . . . . . . . . . . . . . . . . . . . . . . . . . . . . . . . . . . . $23 $(2,699)
December 31, 2013 Notional Amounts Assets Liabilities Derivatives designated as hedging instruments: Foreign currency forward contracts . . . . . . . . . . . . . . . . . . . . . . $34,244 $— $ (684) Commodity futures contracts . . . . . . . . . . . . . . . . . . . . . . . . . . . 5,601 41 (191) Total derivatives designated as hedging instruments: . . . . . . . . 41 (875) Derivatives not designated as hedging instruments: Commodity futures contracts . . . . . . . . . . . . . . . . . . . . . . . . . . . 321 20 — Total derivatives not designated as hedging instruments: . . . . . 20 — Total derivatives . . . . . . . . . . . . . . . . . . . . . . . . . . . . . . . . . . . . . . $61 $ (875)
The effects of derivative instruments on the Company’s Consolidated Statement of Earnings,Comprehensive Earnings and Retained Earnings for years ended December 31, 2014 and2013 are as follows: For Year Ended December 31, 2014 Gain (Loss) Gain (Loss) on Amount Excluded Gain (Loss) Reclassified from from Effectiveness Recognized Accumulated OCI Testing Recognized in OCI into Earnings in Earnings Foreign currency forward contracts . . . . . . . . . . . . . . $(2,256) $(1,001) $—Commodity futures contracts . . . . . . . . . . . . . . . . . . . (881) (294) — Total . . . . . . . . . . . . . . . . . . . . . . . . . . . . . . . . . . . . . . $(3,137) $(1,295) $—
24
Merrill Corp - Tootsie Roll 10-K ED [AUX] | 105969 | 27-Feb-15 18:28 | 15-2394-1.ea | Sequence: 7CHKSUM Content: 56469 Layout: 39664 Graphics: No Graphics CLEAN
JOB: 15-2394-1 CYCLE#;BL#: 6; 0 TRIM: 11" x 8.5" COMPOSITECOLORS: Black, ~note-color 2, ~note-color 3 GRAPHICS: none V1.5
The changes in the accumulated postretirement benefit obligation at December 31, 2014 and2013 consist of the following: December 31, 2014 2013 Benefit obligation, beginning of year . . . . . . . . . . . . . . . . . . . . . . . . . . . . . . . . $ 9,176 $ 27,381Service cost . . . . . . . . . . . . . . . . . . . . . . . . . . . . . . . . . . . . . . . . . . . . . . . . . . . 342 1,036Interest cost . . . . . . . . . . . . . . . . . . . . . . . . . . . . . . . . . . . . . . . . . . . . . . . . . . . 423 1,060Plan amendments . . . . . . . . . . . . . . . . . . . . . . . . . . . . . . . . . . . . . . . . . . . . . . — (10,425)Actuarial (gain)/loss . . . . . . . . . . . . . . . . . . . . . . . . . . . . . . . . . . . . . . . . . . . . . 2,611 (9,734)Benefits paid . . . . . . . . . . . . . . . . . . . . . . . . . . . . . . . . . . . . . . . . . . . . . . . . . . (241) (142) Benefit obligation, end of year . . . . . . . . . . . . . . . . . . . . . . . . . . . . . . . . . . . . . $12,311 $ 9,176
Net periodic postretirement benefit cost included the following components: 2014 2013 2012 Service cost—benefits attributed to service during the period . . . . . . . $ 342 $1,036 $1,034Interest cost on the accumulated postretirement benefit obligation . . . 423 1,060 1,113Net amortization . . . . . . . . . . . . . . . . . . . . . . . . . . . . . . . . . . . . . . . . . . . (1,804) 671 1,036 Net periodic postretirement benefit cost (income) . . . . . . . . . . . . . . . . . $(1,039) $2,767 $3,183
The Company estimates future benefit payments will be $328, $367, $412, $451 and $501 in2015 through 2019, respectively, and a total of $3,119 in 2020 through 2024. As a result of theplan changes, the Company will no longer qualify for the Medicare Part D retiree drugs subsidywhich have historically not been significant.
NOTE 8—COMMITMENTS:
Rental expense aggregated $749, $793 and $967 in 2014, 2013 and 2012, respectively.Future operating lease commitments are not significant.
NOTE 9—SEGMENT AND GEOGRAPHIC INFORMATION:
The Company operates as a single reportable segment encompassing the manufacture andsale of confectionery products. Its principal manufacturing operations are located in the UnitedStates and Canada, and its principal market is the United States. The Company alsomanufactures and sells confectionery products in Mexico, and exports products to Canadaand other countries worldwide.
The following geographic data includes net product sales summarized on the basis of thecustomer location and long-lived assets based on their physical location: 2014 2013 2012 Net product sales: United States . . . . . . . . . . . . . . . . . . . . . . . . . . . . . . . . . . . $488,795 $495,082 $499,660 Canada and Other . . . . . . . . . . . . . . . . . . . . . . . . . . . . . . . 51,100 44,545 46,325 $539,895 $539,627 $545,985 Long-lived assets: United States . . . . . . . . . . . . . . . . . . . . . . . . . . . . . . . . . . . $153,444 $160,099 $161,504 Canada and Other . . . . . . . . . . . . . . . . . . . . . . . . . . . . . . . 36,637 36,817 39,786 $190,081 $196,916 $201,290
Sales revenues from Wal-Mart Stores, Inc. aggregated approximately 23.7%, 23.8%, and23.5% of net product sales during the years ended December 31, 2014, 2013 and 2012,respectively. Some of the aforementioned sales to Wal-Mart are sold to McLane Company, alarge national grocery wholesaler, which services and delivers certain of the Company products
to Wal-Mart and other retailers in the U.S.A. Net product sales revenues from McLane, whichincludes these Wal-Mart sales as well as sales and deliveries to other Company customers,were 15.3% in 2014 and 15.1% in 2013; such revenues from McLane were less than 10% in2012.
NOTE 10—FAIR VALUE MEASUREMENTS:
Current accounting guidance defines fair value as the price that would be received in thesale of an asset or paid to transfer a liability in an orderly transaction between market participantsat the measurement date. Guidance requires disclosure of the extent to which fair value is usedto measure financial assets and liabilities, the inputs utilized in calculating valuationmeasurements, and the effect of the measurement of significant unobservable inputs onearnings, or changes in net assets, as of the measurement date. Guidance establishes a three-level valuation hierarchy based upon the transparency of inputs utilized in the measurementand valuation of financial assets or liabilities as of the measurement date. Level 1 inputs includequoted prices for identical instruments and are the most observable. Level 2 inputs includequoted prices for similar assets and observable inputs such as interest rates, foreign currencyexchange rates, commodity rates and yield curves. Level 3 inputs are not observable in themarket and include management’s own judgments about the assumptions market participantswould use in pricing the asset or liability. The use of observable and unobservable inputs isreflected in the hierarchy assessment disclosed in the table below.
As of December 31, 2014 and 2013, the Company held certain financial assets that arerequired to be measured at fair value on a recurring basis. These include derivative hedginginstruments related to the foreign currency forward contracts and purchase of certain rawmaterials, investments in trading securities and available for sale securities. The Company’savailable for sale and trading securities principally consist of municipal bonds and mutual fundsthat are publicly traded.
The following tables present information about the Company’s financial assets and liabilitiesmeasured at fair value as of December 31, 2014 and 2013, and indicate the fair value hierarchyand the valuation techniques utilized by the Company to determine such fair value: Estimated Fair Value December 31, 2014 Total Input Levels Used
Fair Value Level 1 Level 2 Level 3 Cash and equivalents . . . . . . . . . . . . . . . . . . . . . $100,108 $100,108 $ — $—Available for sale securities . . . . . . . . . . . . . . . . . 131,347 2,446 128,901 —Foreign currency forward contracts . . . . . . . . . . . (1,939) — (1,939) —Commodity futures contracts, net . . . . . . . . . . . . (737) (737) — —Trading securities . . . . . . . . . . . . . . . . . . . . . . . . . 71,682 71,682 — — Total assets measured at fair value . . . . . . . . . . . $300,461 $173,499 $126,962 $—
Estimated Fair Value December 31, 2013 Total Input Levels Used
Fair Value Level 1 Level 2 Level 3 Cash and equivalents . . . . . . . . . . . . . . . . . . . . . $ 88,283 $ 88,283 $ — $—Available for sale securities . . . . . . . . . . . . . . . . . 118,647 — 118,647 —Foreign currency forward contracts . . . . . . . . . . . (684) — (684) —Commodity futures contracts, net . . . . . . . . . . . . (130) (130) — —Trading securities . . . . . . . . . . . . . . . . . . . . . . . . . 63,215 63,215 — — Total assets measured at fair value . . . . . . . . . . . $269,331 $151,368 $117,963 $—
23
Merrill Corp - Tootsie Roll 10-K ED [AUX] | 105969 | 27-Feb-15 18:28 | 15-2394-1.ea | Sequence: 6CHKSUM Content: 60559 Layout: 49095 Graphics: No Graphics CLEAN
JOB: 15-2394-1 CYCLE#;BL#: 6; 0 TRIM: 11" x 8.5" COMPOSITECOLORS: Black, ~note-color 2, ~note-color 3 GRAPHICS: none V1.5

26
To the Board of Directors and Shareholders of Tootsie Roll Industries, Inc.:
In our opinion, the accompanying consolidated statements of financial position and the related consolidated statements of earnings, comprehensive earnings and retainedearnings, and of cash flows present fairly, in all material respects, the financial position of Tootsie Roll Industries, Inc. and its subsidiaries at December 31, 2014 andDecember 31, 2013, and the results of their operations and their cash flows for each of the three years in the period ended December 31, 2014 in conformity with accountingprinciples generally accepted in the United States of America. Also in our opinion, the Company maintained, in all material respects, effective internal control over financialreporting as of December 31, 2014, based on criteria established in Internal Control—Integrated Framework (2013) issued by the Committee of Sponsoring Organizationsof the Treadway Commission (COSO). The Company’s management is responsible for these financial statements, for maintaining effective internal control over financialreporting and for its assessment of the effectiveness of internal control over financial reporting, included in Management’s Report on Internal Control over Financial Reportingon page 27 of the 2014 Annual Report to Shareholders. Our responsibility is to express opinions on these financial statements and on the Company’s internal control overfinancial reporting based on our integrated audits. We conducted our audits in accordance with the standards of the Public Company Accounting Oversight Board (UnitedStates). Those standards require that we plan and perform the audits to obtain reasonable assurance about whether the financial statements are free of material misstatementand whether effective internal control over financial reporting was maintained in all material respects. Our audits of the financial statements included examining, on a testbasis, evidence supporting the amounts and disclosures in the financial statements, assessing the accounting principles used and significant estimates made bymanagement, and evaluating the overall financial statement presentation. Our audit of internal control over financial reporting included obtaining an understanding ofinternal control over financial reporting, assessing the risk that a material weakness exists, and testing and evaluating the design and operating effectiveness of internalcontrol based on the assessed risk. Our audits also included performing such other procedures as we considered necessary in the circumstances. We believe that ouraudits provide a reasonable basis for our opinions.
A company’s internal control over financial reporting is a process designed to provide reasonable assurance regarding the reliability of financial reporting and the preparationof financial statements for external purposes in accordance with generally accepted accounting principles. A company’s internal control over financial reporting includesthose policies and procedures that (i) pertain to the maintenance of records that, in reasonable detail, accurately and fairly reflect the transactions and dispositions of theassets of the company; (ii) provide reasonable assurance that transactions are recorded as necessary to permit preparation of financial statements in accordance withgenerally accepted accounting principles, and that receipts and expenditures of the company are being made only in accordance with authorizations of management anddirectors of the company; and (iii) provide reasonable assurance regarding prevention or timely detection of unauthorized acquisition, use, or disposition of the company’sassets that could have a material effect on the financial statements.
Because of its inherent limitations, internal control over financial reporting may not prevent or detect misstatements. Also, projections of any evaluation of effectiveness tofuture periods are subject to the risk that controls may become inadequate because of changes in conditions, or that the degree of compliance with the policies orprocedures may deteriorate.
Chicago, ILFebruary 27, 2015
Report of Independent Registered Public Accounting Firm
Merrill Corp - Tootsie Roll 10-K ED [AUX] | 105969 | 27-Feb-15 18:28 | 15-2394-1.fa | Sequence: 1CHKSUM Content: 11428 Layout: 64242 Graphics: 17745 CLEAN
JOB: 15-2394-1 CYCLE#;BL#: 6; 0 TRIM: 11" x 8.5" COMPOSITECOLORS: Black, ~note-color 2, ~note-color 3 GRAPHICS: pwc_ed_k_sig.eps V1.5
For Year Ended December 31, 2013 Gain (Loss) Gain (Loss) on Amount Excluded Gain (Loss) Reclassified from from Effectiveness Recognized Accumulated OCI Testing Recognized in OCI into Earnings in Earnings Foreign currency forward contracts . . . . . . . . . . . . . . $(1,144) $ (460) $—Commodity futures contracts . . . . . . . . . . . . . . . . . . . (963) (986) — Total . . . . . . . . . . . . . . . . . . . . . . . . . . . . . . . . . . . . . . $(2,107) $(1,446) $—
For the years ended December 31, 2014 and 2013, the Company recognized a gain (loss) of$0 and $(42) in earnings, respectively, related to mark-to-market accounting for certaincommodity futures contracts that did not receive hedge accounting.
NOTE 12—COMPREHENSIVE EARNINGS (LOSS):
The following table sets forth information with respect to accumulated other comprehensiveearnings (loss):
AccumulatedForeign Foreign Postretirement Other
Currency Currency Commodity and Pension ComprehensiveTranslation Investments Derivatives Derivatives Benefits Earnings (Loss)
Balance at December 31, 2012 . . . . . . . $(13,406) $ 908 $ — $(111) $ (3,838) $(16,447) Other comprehensive earnings (loss) before reclassifications . . . . . . . . . . (121) (854) (730) (614) 12,777 10,458Reclassifications from accumulated other comprehensive loss . . . . . . . — — 294 629 428 1,351 Other comprehensive earnings (loss) net of tax . . . (121) (854) (436) 15 13,205 11,809 Balance at December 31, 2013 . . . . . . . $(13,527) $ 54 $(436) $ (96) $ 9,367 $ (4,638)
AccumulatedForeign Foreign Postretirement Other
Currency Currency Commodity and Pension ComprehensiveTranslation Investments Derivatives Derivatives Benefits Earnings (Loss)
Balance at December 31, 2013 . . . . . . . $(13,527) $ 54 $ (436) $ (96) $ 9,367 $ (4,638) Other comprehensive earnings (loss) before reclassifications . . . . . . . . . . (3,155) (386) (1,439) (562) (1,776) (7,318)Reclassifications from accumulated other comprehensive loss . . . . . . . (817) — 639 188 (1,152) (1,142) Other comprehensive earnings (loss) net of tax . . . (3,972) (386) (800) (374) (2,928) (8,460) Balance at December 31, 2014 . . . . . . . $(17,499) $(332) $(1,236) $(470) $ 6,439 $(13,098)
The amounts reclassified from accumulated other comprehensive income (loss) consistedof the following:
Year to Date EndedDetails about Accumulated Other December 31, December 31,Comprehensive Income Components 2014 2013 Location of (Gain) Loss Recognized in Earnings
Foreign currency derivatives . . . . . $ 1,001 $ 459 Other income, netCommodity derivatives . . . . . . . . . . 294 987 Product cost of goods soldForeign currency translation (1,298) — Other income, netPostretirement and pension Selling, marketing and administrative
benefits . . . . . . . . . . . . . . . . . . . . (992) 342 expensesPostretirement and pension
benefits . . . . . . . . . . . . . . . . . . . . (812) 329 Product cost of goods soldTotal before tax . . . . . . . . . . . . . . . . (1,807) 2,117Tax expense (benefit) . . . . . . . . . . . 665 (766)Net of tax . . . . . . . . . . . . . . . . . . . . . $ (1,142) $1,351
NOTE 13—GOODWILL AND INTANGIBLE ASSETS:
All of the Company’s intangible indefinite-lived assets are trademarks.
The changes in the carrying amount of trademarks for 2014 and 2013 were as follows: 2014 2013 Original cost . . . . . . . . . . . . . . . . . . . . . . . . . . . . . . . . . . . . . . . . . . . . . . . . . . . . . $193,767 $193,767Accumulated impairment losses as of January 1 . . . . . . . . . . . . . . . . . . . . . . . . . (18,743) (18,743) Balance at January 1 . . . . . . . . . . . . . . . . . . . . . . . . . . . . . . . . . . . . . . . . . . . . . . . $175,024 $175,024 Current year impairment losses . . . . . . . . . . . . . . . . . . . . . . . . . . . . . . . . . . . . . . . — — Balance at December 31 . . . . . . . . . . . . . . . . . . . . . . . . . . . . . . . . . . . . . . . . . . . . $175,024 $175,024 Accumulated impairment losses as of December 31 . . . . . . . . . . . . . . . . . . . . . . $ (18,743) $ (18,743)
The fair value of indefinite-lived intangible assets was primarily assessed using the presentvalue of estimated future cash flows and relief-from-royalty method.
The Company has no accumulated impairment losses of goodwill.
25
Merrill Corp - Tootsie Roll 10-K ED [AUX] | 105969 | 27-Feb-15 18:28 | 15-2394-1.ea | Sequence: 8CHKSUM Content: 16420 Layout: 3942 Graphics: No Graphics CLEAN
JOB: 15-2394-1 CYCLE#;BL#: 6; 0 TRIM: 11" x 8.5" COMPOSITECOLORS: Black, ~note-color 2, ~note-color 3 GRAPHICS: none V1.5
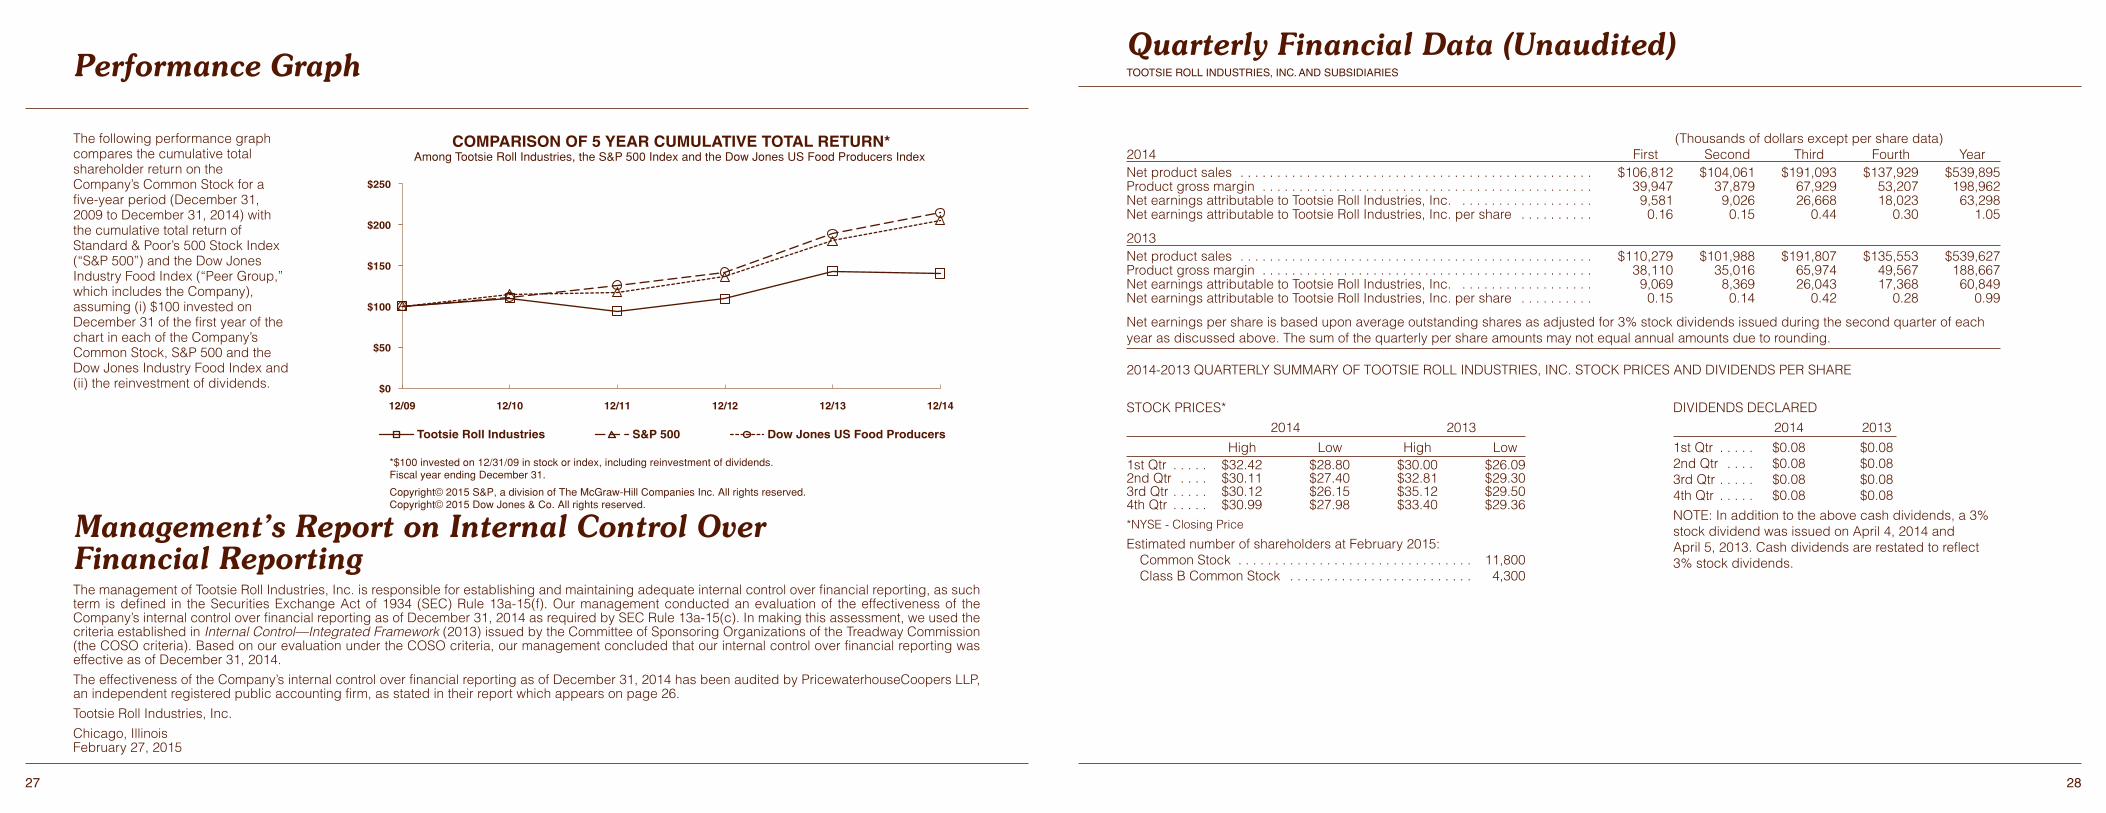
28
(Thousands of dollars except per share data)2014 First Second Third Fourth YearNet product sales . . . . . . . . . . . . . . . . . . . . . . . . . . . . . . . . . . . . . . . . . . . . . . . . $106,812 $104,061 $191,093 $137,929 $539,895Product gross margin . . . . . . . . . . . . . . . . . . . . . . . . . . . . . . . . . . . . . . . . . . . . . 39,947 37,879 67,929 53,207 198,962Net earnings attributable to Tootsie Roll Industries, Inc. . . . . . . . . . . . . . . . . . . 9,581 9,026 26,668 18,023 63,298Net earnings attributable to Tootsie Roll Industries, Inc. per share . . . . . . . . . . 0.16 0.15 0.44 0.30 1.05
2013Net product sales . . . . . . . . . . . . . . . . . . . . . . . . . . . . . . . . . . . . . . . . . . . . . . . . $110,279 $101,988 $191,807 $135,553 $539,627Product gross margin . . . . . . . . . . . . . . . . . . . . . . . . . . . . . . . . . . . . . . . . . . . . . 38,110 35,016 65,974 49,567 188,667Net earnings attributable to Tootsie Roll Industries, Inc. . . . . . . . . . . . . . . . . . . 9,069 8,369 26,043 17,368 60,849Net earnings attributable to Tootsie Roll Industries, Inc. per share . . . . . . . . . . 0.15 0.14 0.42 0.28 0.99
Net earnings per share is based upon average outstanding shares as adjusted for 3% stock dividends issued during the second quarter of eachyear as discussed above. The sum of the quarterly per share amounts may not equal annual amounts due to rounding.
2014-2013 QUARTERLY SUMMARY OF TOOTSIE ROLL INDUSTRIES, INC. STOCK PRICES AND DIVIDENDS PER SHARE
STOCK PRICES* 2014 2013 High Low High Low1st Qtr . . . . . $32.42 $28.80 $30.00 $26.092nd Qtr . . . . $30.11 $27.40 $32.81 $29.303rd Qtr . . . . . $30.12 $26.15 $35.12 $29.504th Qtr . . . . . $30.99 $27.98 $33.40 $29.36*NYSE - Closing Price
Estimated number of shareholders at February 2015:Common Stock . . . . . . . . . . . . . . . . . . . . . . . . . . . . . . . . 11,800Class B Common Stock . . . . . . . . . . . . . . . . . . . . . . . . . 4,300
DIVIDENDS DECLARED 2014 20131st Qtr . . . . . $0.08 $0.082nd Qtr . . . . $0.08 $0.083rd Qtr . . . . . $0.08 $0.084th Qtr . . . . . $0.08 $0.08NOTE: In addition to the above cash dividends, a 3%stock dividend was issued on April 4, 2014 andApril 5, 2013. Cash dividends are restated to reflect3% stock dividends.
Quarterly Financial Data (Unaudited)TOOTSIE ROLL INDUSTRIES, INC. AND SUBSIDIARIES
Merrill Corp - Tootsie Roll 10-K ED [AUX] | 105969 | 27-Feb-15 18:28 | 15-2394-1.ga | Sequence: 1CHKSUM Content: 10900 Layout: 48964 Graphics: No Graphics CLEAN
JOB: 15-2394-1 CYCLE#;BL#: 6; 0 TRIM: 11" x 8.5" COMPOSITECOLORS: Black, ~note-color 2, ~note-color 3 GRAPHICS: none V1.5
27
The following performance graphcompares the cumulative totalshareholder return on theCompany’s Common Stock for afive-year period (December 31,2009 to December 31, 2014) withthe cumulative total return ofStandard & Poor’s 500 Stock Index(“S&P 500”) and the Dow JonesIndustry Food Index (“Peer Group,”which includes the Company),assuming (i) $100 invested onDecember 31 of the first year of thechart in each of the Company’sCommon Stock, S&P 500 and theDow Jones Industry Food Index and(ii) the reinvestment of dividends. $0
$50
$100
$150
$200
$250
12/09 12/10 12/11 12/12 12/13 12/14
COMPARISON OF 5 YEAR CUMULATIVE TOTAL RETURN*Among Tootsie Roll Industries, the S&P 500 Index and the Dow Jones US Food Producers Index
Tootsie Roll Industries S&P 500 Dow Jones US Food Producers
*$100 invested on 12/31/09 in stock or index, including reinvestment of dividends.Fiscal year ending December 31.
Copyright© 2015 S&P, a division of The McGraw-Hill Companies Inc. All rights reserved.Copyright© 2015 Dow Jones & Co. All rights reserved.
Management’s Report on Internal Control OverFinancial ReportingThe management of Tootsie Roll Industries, Inc. is responsible for establishing and maintaining adequate internal control over financial reporting, as suchterm is defined in the Securities Exchange Act of 1934 (SEC) Rule 13a-15(f). Our management conducted an evaluation of the effectiveness of theCompany’s internal control over financial reporting as of December 31, 2014 as required by SEC Rule 13a-15(c). In making this assessment, we used thecriteria established in Internal Control—Integrated Framework (2013) issued by the Committee of Sponsoring Organizations of the Treadway Commission(the COSO criteria). Based on our evaluation under the COSO criteria, our management concluded that our internal control over financial reporting waseffective as of December 31, 2014.The effectiveness of the Company’s internal control over financial reporting as of December 31, 2014 has been audited by PricewaterhouseCoopers LLP,an independent registered public accounting firm, as stated in their report which appears on page 26.Tootsie Roll Industries, Inc.Chicago, IllinoisFebruary 27, 2015
Performance Graph
Merrill Corp - Tootsie Roll 10-K ED [AUX] | 105969 | 27-Feb-15 18:28 | 15-2394-1.fa | Sequence: 2CHKSUM Content: 63327 Layout: 53338 Graphics: 53003 CLEAN
JOB: 15-2394-1 CYCLE#;BL#: 6; 0 TRIM: 11" x 8.5" COMPOSITECOLORS: Black, ~note-color 2, ~note-color 3 GRAPHICS: 2394-1_total_return_k_line.eps V1.5

29
Five Year Summary of Earnings and Financial HighlightsTOOTSIE ROLL INDUSTRIES, INC. AND SUBSIDIARIES
(Thousands of dollars except per share, percentage and ratio figures)
(See management’s comments starting on page 4) 2014 2013 2012 2011 2010
Sales and Earnings Data (2)Net product sales . . . . . . . . . . . . . . . . . . . . . . . . . . . . . . $539,895 $539,627 $545,985 $528,369 $517,149Product gross margin . . . . . . . . . . . . . . . . . . . . . . . . . . . 198,962 188,667 180,412 163,144 167,815Interest expense . . . . . . . . . . . . . . . . . . . . . . . . . . . . . . . 99 92 137 121 142Provision for income taxes . . . . . . . . . . . . . . . . . . . . . . . 28,434 23,634 22,160 16,974 20,005Net earnings attributable to Tootsie Roll Industries, Inc. . 63,298 60,849 52,004 43,938 53,063
% of net product sales . . . . . . . . . . . . . . . . . . . . . . . 11.7% 11.3% 9.5% 8.3% 10.3%% of shareholders’ equity . . . . . . . . . . . . . . . . . . . . 9.2% 8.9% 8.0% 6.6% 8.0%
Per Common Share Data (1)(3)Net earnings attributable to Tootsie Roll Industries, Inc. . $ 1.05 $ 0.99 $ 0.84 $ 0.70 $ 0.83Cash dividends declared . . . . . . . . . . . . . . . . . . . . . . . . 0.32 0.32 0.82 0.32 0.32Stock dividends . . . . . . . . . . . . . . . . . . . . . . . . . . . . . . . 3% 3% 3% 3% 3%
Additional Financial Data (1)(2)Working capital . . . . . . . . . . . . . . . . . . . . . . . . . . . . . . . $200,162 $179,990 $136,476 $153,272 $176,662Net cash provided by operating activities . . . . . . . . . . . 88,769 109,823 101,418 51,098 82,495Net cash provided by (used in) investing activities . . . . (30,459) (47,963) (40,435) (51,157) (16,808)Net cash used in financing activities . . . . . . . . . . . . . . . (44,664) (37,425) (76,234) (36,597) (41,011)Property, plant & equipment additions . . . . . . . . . . . . . . 10,704 15,752 8,886 16,351 12,813Net property, plant & equipment . . . . . . . . . . . . . . . . . . 190,081 196,916 201,290 212,162 215,492Total assets . . . . . . . . . . . . . . . . . . . . . . . . . . . . . . . . . . . 910,386 888,409 846,737 857,856 857,959Long-term debt . . . . . . . . . . . . . . . . . . . . . . . . . . . . . . . 7,500 7,500 7,500 7,500 7,500Total Tootsie Roll Industries, Inc. shareholders’ equity . . 690,809 680,305 649,815 665,935 667,408Average shares outstanding . . . . . . . . . . . . . . . . . . . . . 60,562 61,399 62,248 63,111 63,904
(1) Per Common share data and average shares outstanding adjusted for annual 3% stock dividends.(2) Certain reclassifications have been made to prior year numbers to conform to current year presentation.(3) The fourth quarter 2012 includes a $0.50 special dividend.
Merrill Corp - Tootsie Roll 10-K ED [AUX] | 105969 | 27-Feb-15 18:28 | 15-2394-1.ga | Sequence: 2CHKSUM Content: 57827 Layout: 26903 Graphics: No Graphics CLEAN
JOB: 15-2394-1 CYCLE#;BL#: 6; 0 TRIM: 11" x 8.5" COMPOSITECOLORS: Black, ~note-color 2, ~note-color 3 GRAPHICS: none V1.5

Board of Directors
(1)Executive Committee (2)Audit Committee (3)Compensation Committee
Officers
Offices, Plants
Other Information
Ellen R. Gordon(1) Chairman of the Board and Chief Executive Officer
Richard P. Bergeman(2)(3) Retired Senior Vice President, BestfoodsLana Jane Lewis-Brent(2)(3) President, Paul Brent Designer, Inc.,
an art publishing, design and licensingcompany
Barre A. Seibert(2)(3) Retired First Vice President, Washington Mutual Bank
Ellen R. Gordon Chairman of the Board and Chief Executive Officer
G. Howard Ember, Jr. Vice President, Finance & ChiefFinancial Officer
John W. Newlin, Jr. Vice President, ManufacturingThomas E. Corr Vice President, Marketing & SalesJohn P. Majors Vice President, Physical DistributionBarry P. Bowen Treasurer & Assistant SecretaryRichard F. Berezewski Controller
Executive Offices 7401 S. Cicero Ave.Chicago, Illinois 60629www.tootsie.com
Plants/Warehouses IllinoisTennesseeMassachusettsPennsylvaniaWisconsinOntario, CanadaMexico City, MexicoBarcelona, Spain
Foreign Sales Offices Mexico City, MexicoOntario, CanadaBarcelona, Spain
Stock Exchange New York Stock Exchange, Inc.(Since 1922)
Stock Identification Ticker Symbol: TRCUSIP No. 890516 10-7
Stock Transfer Agent andStock Registrar
American Stock Transferand Trust CompanyOperations Center6201 15th AvenueBrooklyn, NY 112191-800-710-0932www.amstock.com
Independent RegisteredPublic Accounting Firm
PricewaterhouseCoopers LLPOne North WackerChicago, IL 60606
General Counsel Aronberg Goldgehn Davis & Garmisa330 North Wabash AvenueChicago, IL 60611
Annual Meeting May 4, 2015Mutual Building, Room 1200909 East Main StreetRichmond, VA 23219
Printed on recycled paper.30
Merrill Corp - Tootsie Roll 10-K ED [AUX] | 105969 | 27-Feb-15 18:29 | 15-2394-1.za | Sequence: 1CHKSUM Content: 54131 Layout: 22591 Graphics: 39181 CLEAN
JOB: 15-2394-1 CYCLE#;BL#: 6; 0 TRIM: 11" x 8.5" COMPOSITECOLORS: Black, Cyan, Magenta, Yellow, ~note-color 2, ~note-color 3 GRAPHICS: recycled_logo.eps, tootsie_com_4c_photo.eps, tr_listed_nyse_k_logo.eps V1.5

Industries, Inc.Tootsie Roll
Annual Report 2014


