63
Top Top - - 10 Economic Predictions for 2010 10 Economic Predictions for 2010 And Implications for Trade And Implications for Trade Nariman Behravesh, Chief Economist, IHS January 14, 2010

TopTop--10 Economic Predictions for 201010 Economic Predictions for 2010 And Implications for TradeAnd Implications for Trade
Nariman Behravesh, Chief Economist, IHS
January 14, 2010

Copyright © 2010 IHS Global Insight. All Rights Reserved.
2
Global Outlook
• The recession is over and the recovery has begun – unfortunately, for most developed economies, this recovery won’t feel like one in its early stages
• Strong tail winds (policy stimulus, improved financial conditions and pent-up demand) …
• … Are being partially neutralized by equally strong head winds (rising unemployment rates, lingering hangovers from housing bubbles and the financial crisis, and the winding down of fiscal stimulus)
• Global growth at 2.8% in 2010 will be well below the 3.5% to 4% trend rate of the last two decades

Copyright © 2010 IHS Global Insight. All Rights Reserved.
3
-12
-9
-6
-3
0
3
6
9
1972 1977 1982 1987 1992 1997 2002 2007 2012
Real GDP Industrial Production
(Percent change)
The World Economy Rebounds from the Worst Recession of the Postwar Era

Copyright © 2010 IHS Global Insight. All Rights Reserved.
4
-12
-8
-4
0
4
8
GDP PrivateConsumption
FixedInvestment
GovernmentConsumption
Exports
2008 2009 2010 2011
(Percent change)
The World’s Real Economic Growth by Sector
Copyright © 2010 IHS Global Insight. All Rights Reserved.
5
-15
-10
-5
0
5
10
15
1972 1977 1982 1987 1992 1997 2002 2007 2012
Real Exports Real GDP
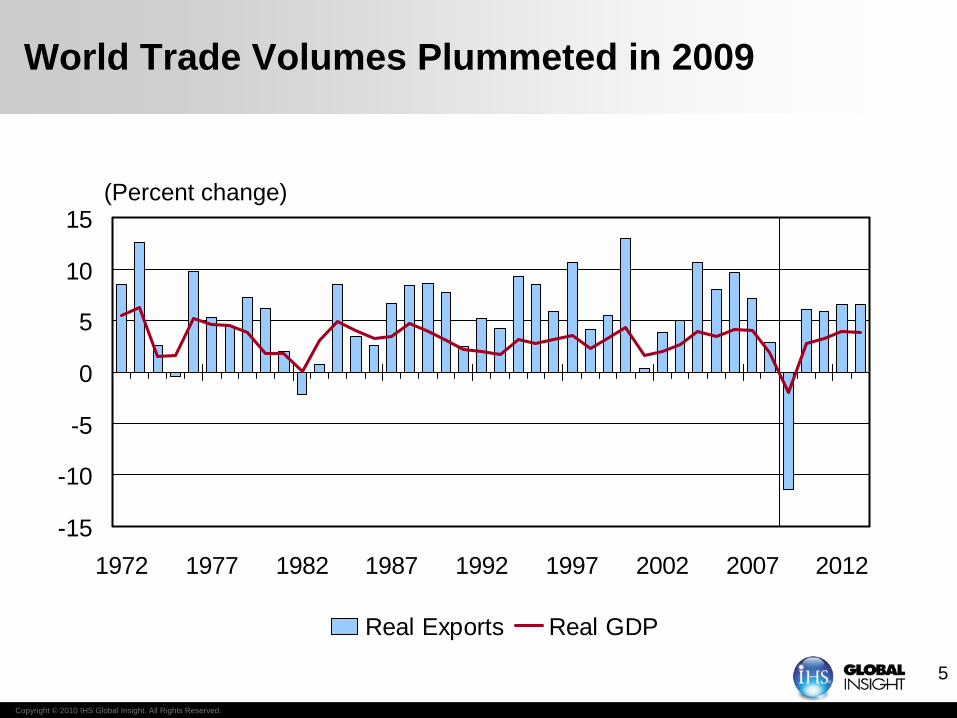
(Percent change)
World Trade Volumes Plummeted in 2009

Copyright © 2010 IHS Global Insight. All Rights Reserved.
6
1. The U.S. Recovery Will Start Slowly
• During much of 2010, growth will be stuck in the 2.0% to 2.5% range
• Consumer spending is being held back by the strong headwind of a rising unemployment rate – expected to peak at around 10.5% in the first quarter
• The housing recovery, business spending on equipment and inventory rebuilding will boost growth…
• …While non-residential construction and state-and-local spending will be a drag on the recovery
• Despite strong growth in exports, net trade will be a negative factor as imports will grow even faster

Copyright © 2010 IHS Global Insight. All Rights Reserved.
7
-8
-6
-4
-2
0
2
4
6
8
2001 2002 2003 2004 2005 2006 2007 2008 2009 2010 2011 20123
4
5
6
7
8
9
10
11
Real GDP Growth (Left scale) Unemployment Rate (Right scale)
(Annual percent change, 2005 dollars) (Percent)
U.S. Real GDP Is Recovering, But the Unemployment Rate Will Rise into 2010
Copyright © 2010 IHS Global Insight. All Rights Reserved.
8
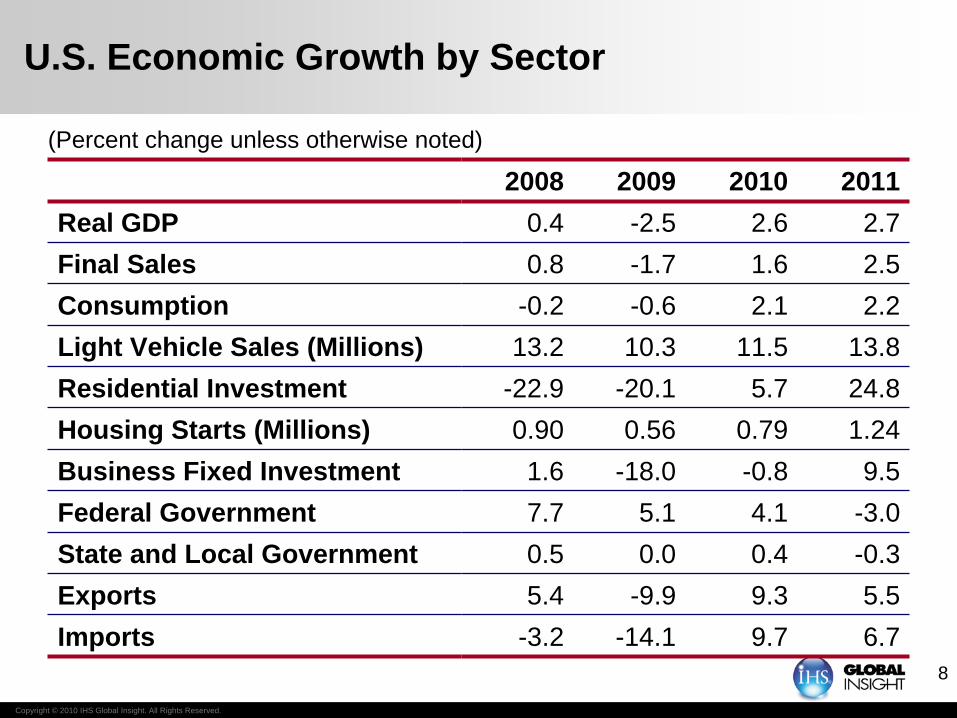
(Percent change unless otherwise noted)
U.S. Economic Growth by Sector
2008 2009 2010 2011Real GDP 0.4 -2.5 2.6 2.7Final Sales 0.8 -1.7 1.6 2.5Consumption -0.2 -0.6 2.1 2.2Light Vehicle Sales (Millions) 13.2 10.3 11.5 13.8Residential Investment -22.9 -20.1 5.7 24.8Housing Starts (Millions) 0.90 0.56 0.79 1.24Business Fixed Investment 1.6 -18.0 -0.8 9.5Federal Government 7.7 5.1 4.1 -3.0State and Local Government 0.5 0.0 0.4 -0.3Exports 5.4 -9.9 9.3 5.5Imports -3.2 -14.1 9.7 6.7

Copyright © 2010 IHS Global Insight. All Rights Reserved.
9
U.S. Inventory Adjustment Is Nearly Complete
(Inventory/shipments ratio, manufacturing and trade)
1.2
1.3
1.4
1.5
1.6
1992 1994 1996 1998 2000 2002 2004 2006 2008

Copyright © 2010 IHS Global Insight. All Rights Reserved.
10
U.S. Corporate Cash Flow Strengthening
8.0
8.5
9.0
9.5
10.0
10.5
11.0
1998 2000 2002 2004 2006 2008 2010
(Net corporate cash flow, excluding net capital transfers, percent of GDP)

Copyright © 2010 IHS Global Insight. All Rights Reserved.
11
-30
-20
-10
0
10
20
30
1998 2000 2002 2004 2006 2008 2010 2012
Equipment and Software Structures
(Year-over-year percent change, 2005 dollars)
Different Cycles in U.S. Business Capital Spending: Construction Lags

Copyright © 2010 IHS Global Insight. All Rights Reserved.
12
0
2
4
6
8
10
12
1980 1984 1988 1992 1996 2000 2004 2008 2012 20164.0
4.5
5.0
5.5
6.0
6.5
7.0
Saving Rate Household Net Worth/Disposable Income
(Percent of disposable income) (Ratio)
U.S. Households Have Increased Their Saving Rate in Response to the Decline in Net Worth

Copyright © 2010 IHS Global Insight. All Rights Reserved.
13
-20
-15
-10
-5
0
5
10
15
1998 2000 2002 2004 2006 2008 2010 2012
Real U.S. Exports Real U.S. Imports
(Year-over-year percent change, 2005 dollars)
U.S. Real Export and Import Growth Patterns Reflect the Business Cycle and Exchange Rates

Copyright © 2010 IHS Global Insight. All Rights Reserved.
14
0 2 4 6 8 10 12
Foods & Feeds
Consumer Goods
Industrial Materials
Aircraft
Other Capital Equipment
Autos & Parts
Computer Equipment
2003-08 2008-13
(Annual percent change, 2005 dollars)
Capital Goods Lead Growth in Real U.S. Exports

Copyright © 2010 IHS Global Insight. All Rights Reserved.
15
U.S. Housing: The Good, The Bad, and the Uncertain
• The Good• Housing affordability is at record highs• Single-family activity indicators are improving• Prices are showing signs of stabilizing
• The Bad• Foreclosure rate still rising• Overhang of empty homes• No improvement yet in multi-family indicators
• The Uncertain• How much payback after the new home-buyers’ credit expires?• What happens to mortgage rates when the Fed stops buying
MBS and agency debt?

Copyright © 2010 IHS Global Insight. All Rights Reserved.
16
-200
20406080
100
Jan-07 Jul-07 Jan-08 Jul-08 Jan-09 Jul-090
20406080
100
Jan-07 Jul-07 Jan-08 Jul-08 Jan-09 Jul-09
Source: Diffusion Indexes from Fed Senior Loan Officer Survey
Tightening Comm. & Ind. CreditTightening Comm. & Ind. Credit Tightening Comm. Mortgage CreditTightening Comm. Mortgage Credit
Tightening Cons. CreditTightening Cons. Credit Tightening Home Mortgage CreditTightening Home Mortgage Credit
0
20
40
60
80
Jan-07 Jul-07 Jan-08 Jul-08 Jan-09 Jul-09-20
020406080
Jan-07 Jul-07 Jan-08 Jul-08 Jan-09 Jul-09
Credit Cards
Other Loans
Prime Loans
Large & Medium Firms
U.S. Banks Still Tightening Credit Conditions
(Percent)

Copyright © 2010 IHS Global Insight. All Rights Reserved.
17
2. Europe and Japan Will Recover Even More Slowly Than the U.S.
• Second and third quarter growth rates in both Europe and Japan overstate the strength of the recovery
• Recent Eurozone data show a loss of momentum – how big of a risk is a W?
• While the worst of the financial crisis is over, there could be more aftershocks (including a possible sovereign default in the Eurozone), and credit remains tight
• Houses are still over-valued in some markets (Ireland, Spain, U.K. etc.) – how big of a vulnerability is this?
• Some European economies (including those of Iceland and Spain) will continue to contract in 2010
• The substantial downward revision of Japanese growth in the third quarter (from 4.8% to 1.3%) is troubling…
• …As is the sharp increase in the pace of deflation in recent months
• Recent attempts by the Japanese government to stimulate the economy are likely to disappoint
• Appreciating currencies are a major headwind for both the Eurozone and Japan
Copyright © 2010 IHS Global Insight. All Rights Reserved.
18
-5
-4
-3
-2
-1
0
1
2
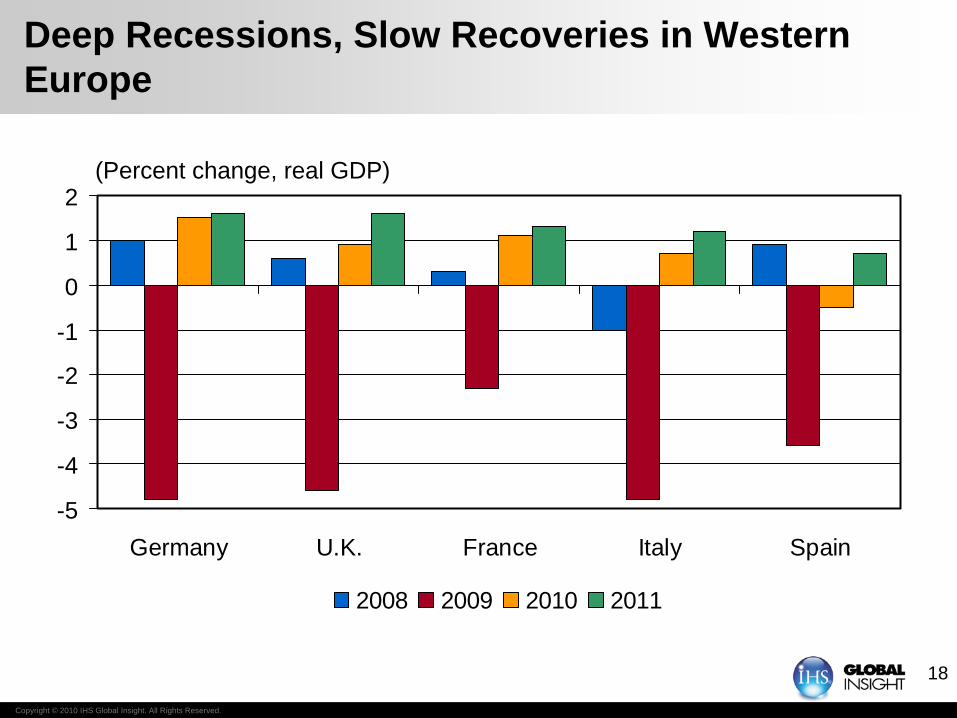
Germany U.K. France Italy Spain
2008 2009 2010 2011
(Percent change, real GDP)
Deep Recessions, Slow Recoveries in Western Europe

Copyright © 2010 IHS Global Insight. All Rights Reserved.
19
-6
-4
-2
0
2
4
6
8
1986 1989 1992 1995 1998 2001 2004 2007 2010 2013
(Percent change, real GDP)
Japan’s Economy Has Limited Growth Potential

Copyright © 2010 IHS Global Insight. All Rights Reserved.
20
3. Most Emerging Markets – Especially Asia – Will Outpace the Developed Economies
• Non-Japan Asia will be at the forefront, with a growth rate of over 7% next year
• Latin America, the Middle East, and Africa will see gains in the 3% to 4% range
• The laggard will be Emerging Europe, which will only grow between 1.5% and 2%
• Many emerging regions are benefitting from the sharp rebound in trade and the turn in the inventory cycle – can these be the basis for sustained growth?
• With the exception of Emerging Europe and some Gulf states, the impact of the financial crisis on the emerging markets has been modest
• Among the Big-6 emerging economies, China, India and Brazil will lead, while Russia, South Korea and Mexico will lag

Copyright © 2010 IHS Global Insight. All Rights Reserved.
21
-4
-2
0
2
4
6
8
1990 1992 1994 1996 1998 2000 2002 2004 2006 2008 2010 2012
World Advanced Countries Emerging Markets
(Percent change, real GDP)
Emerging Markets Lead the Global Recovery

Copyright © 2010 IHS Global Insight. All Rights Reserved.
22
01
23
45
67
NAFTA OtherAmericas
WesternEurope
EmergingEurope
Japan OtherAsia-
Pacific
Mideast &Africa
Sub-Saharan
Africa
1998-2008 2008-18 2018-28
(Real GDP, annual percent change)
Long-Term World Economic Growth by Region

Copyright © 2010 IHS Global Insight. All Rights Reserved.
23
-3
0
3
6
9
12
China India SouthKorea
Australia Taiwan Indonesia
2008 2009 2010 2011
(Percent change, real GDP)
Strong Rebound in Asia

Copyright © 2010 IHS Global Insight. All Rights Reserved.
24
-9
-6
-3
0
3
6
9
12
Brazil Argentina Venezuela Colombia Chile Peru Mexico
2008 2009 2010 2011
(Percent change, real GDP)
Respectable Recoveries in Latin America

Copyright © 2010 IHS Global Insight. All Rights Reserved.
25
-6
-4
-2
0
2
4
6
8
SaudiArabia
Iran SouthAfrica
UAE Israel Nigeria Kuwait
2008 2009 2010 2011
(Percent change, real GDP)
Real GDP Growth in the Middle East and Africa
Copyright © 2010 IHS Global Insight. All Rights Reserved.
26
-9
-6
-3
0
3
6
9
Russia Turkey Poland CzechRepublic
Hungary Romania
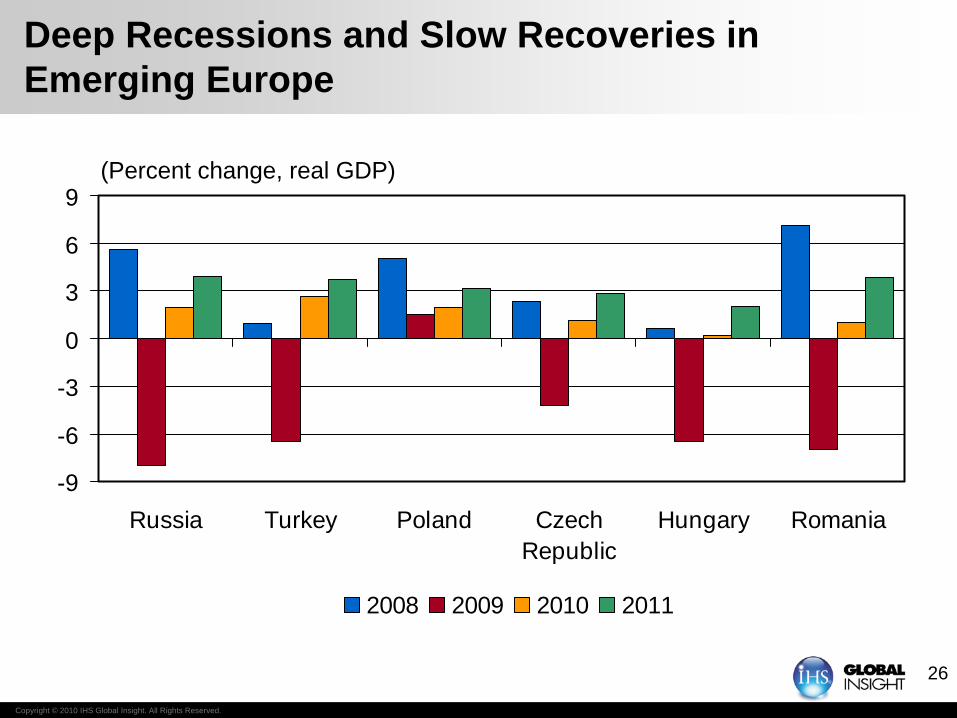
2008 2009 2010 2011
(Percent change, real GDP)
Deep Recessions and Slow Recoveries in Emerging Europe

Copyright © 2010 IHS Global Insight. All Rights Reserved.
27
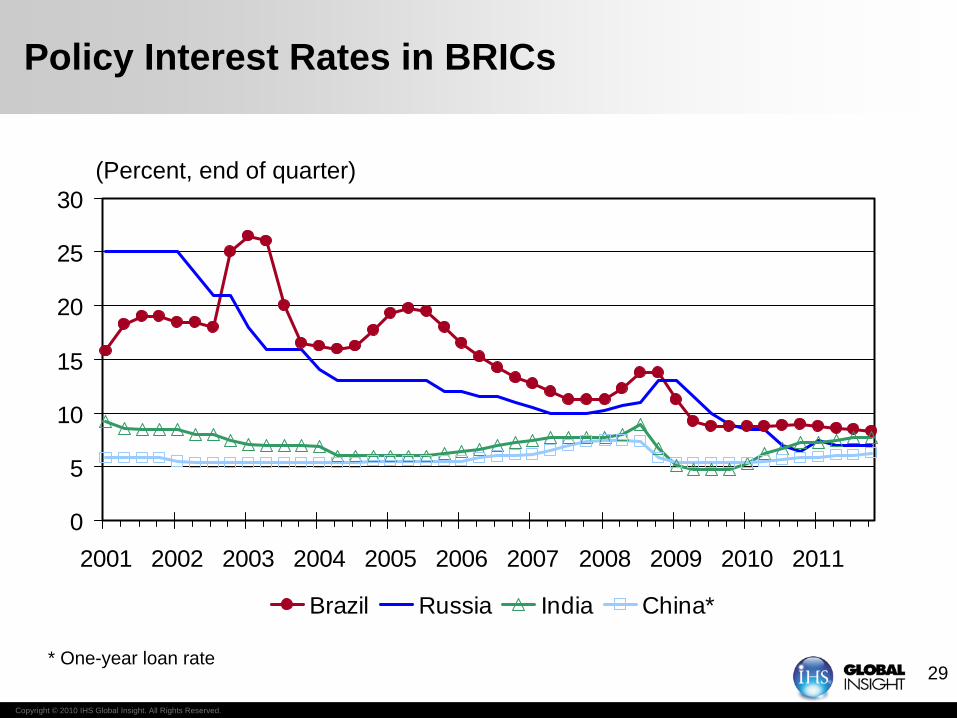
4. Interest Rates in the G-7 and the BRICs Will Remain Low
• Some central banks (notably Australia, Israel and Norway) have already started to raise rates
• The Fed, the ECB, the Bank of England and the Bank of Japan are unlikely to hike rates until the third quarter – although the “quantitative easing” measures will be phased out before then
• The G-7 central bankers are currently more worried about the fragility of the recovery and the aftershocks of the financial crisis than inflation
• Some Asian central banks (e.g., the Reserve Bank of India and the Peoples Bank of China) may pull the trigger in the first or second quarter, due to concerns about inflation and asset bubbles

Copyright © 2010 IHS Global Insight. All Rights Reserved.
28
0
1
2
3
4
5
6
2001 2002 2003 2004 2005 2006 2007 2008 2009 2010 2011
United States Eurozone Japan United Kingdom
(Percent, end of quarter)
Policy Interest Rates Will Stay Low into 2010
Copyright © 2010 IHS Global Insight. All Rights Reserved.
29
0
5
10
15
20
25
30
2001 2002 2003 2004 2005 2006 2007 2008 2009 2010 2011
Brazil Russia India China*
(Percent, end of quarter)
Policy Interest Rates in BRICs
* One-year loan rate

Copyright © 2010 IHS Global Insight. All Rights Reserved.
30
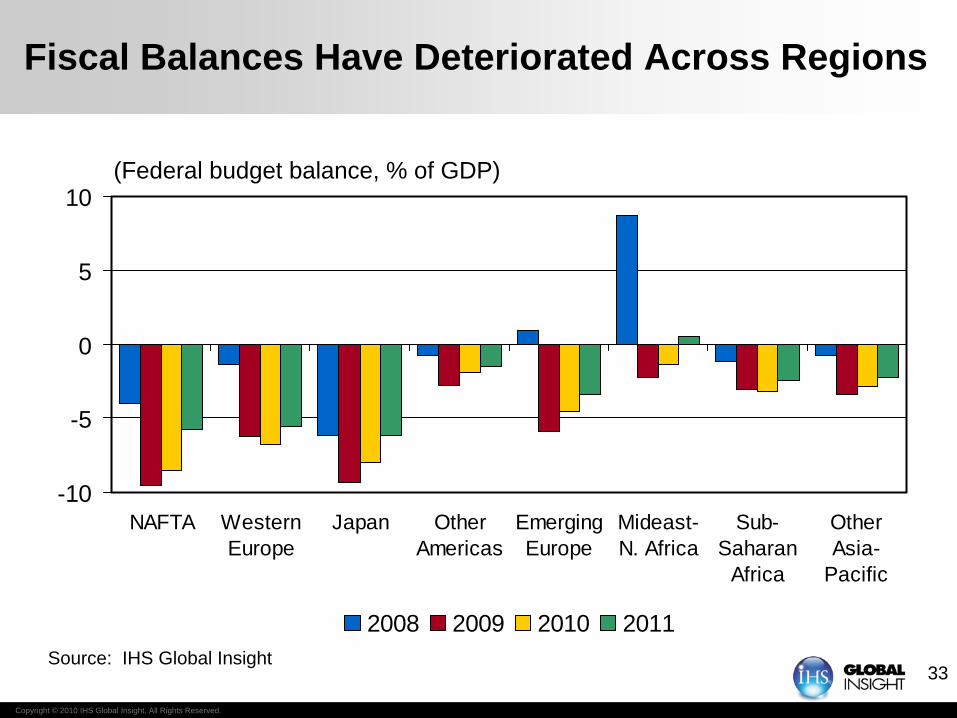
5. Fiscal Stimulus Will Begin to Ease
• Shaky public finances and voter unease severely limit the scope for any further stimulus – some countries will actually be tightening fiscal policy next year (e.g., the U.K.)
• Temporary measures (such as cash-for-clunker programs) have ended or will soon end
• The pressure on the U.S., European and Japanese governments to put in place credible deficit and debt reduction plans is likely to intensify
• The recently announced U.S. jobs program will only be feasible by using budgetary sleight of hand (i.e., TARP money)
• The biggest fiscal challenge in the medium- to long-term will be the pressure from public pensions and healthcare programs

Copyright © 2010 IHS Global Insight. All Rights Reserved.
31
-1,500
-1,000
-500
0
500
1980 1984 1988 1992 1996 2000 2004 2008 2012 2016-15
-10
-5
0
5
Unified Budget Deficit (Left scale) Deficit as % of GDP (Right scale)
(Billions of dollars, fiscal years) (Percent of GDP)
A Record U.S. Federal Budget Deficit in Fiscal 2009

Copyright © 2010 IHS Global Insight. All Rights Reserved.
32
(Annualized rate of growth)
U.S. Fiscal Stimulus Has Made A Difference
-8
-6
-4
-2
0
2
4
6
2007 2008 2009 2010 2011
Baseline No Fiscal Stimulus
Copyright © 2010 IHS Global Insight. All Rights Reserved.
33
-10
-5
0
5
10
NAFTA WesternEurope
Japan OtherAmericas
EmergingEurope
Mideast-N. Africa
Sub-Saharan
Africa
OtherAsia-
Pacific
2008 2009 2010 2011
(Federal budget balance, % of GDP)
Source: IHS Global Insight
Fiscal Balances Have Deteriorated Across Regions

Copyright © 2010 IHS Global Insight. All Rights Reserved.
34
0 50 100 150 200 250
Japan
Italy
United States
United Kingdom
France
Germany
Canada
2009 2014
(Gross Debt, Percent of GDP)
Public Debt Is Rising in Many Countries
Source: IMF

Copyright © 2010 IHS Global Insight. All Rights Reserved.
35
6. Commodity Prices Will Move Sideways
• The recent rises in commodity prices cannot be justified by market fundamentals – demand growth is weak and inventories are high
• Some of the increases of the past few months can be attributed to investment flows – is this the start of a new “bubble”?
• Most commodity prices are likely to soften in coming months – some already have in recent weeks
• A sustained rise in commodity prices is unlikely until the global recovery picks up steam at the end of 2010

Copyright © 2010 IHS Global Insight. All Rights Reserved.
36
(IHS Global Insight Indexes, 2002:1=1.0)
0
1
2
3
4
5
6
2000 2001 2002 2003 2004 2005 2006 2007 2008 2009
All Materials Chemicals Nonferrous Metals
A Rebound in Industrial Materials Prices

Copyright © 2010 IHS Global Insight. All Rights Reserved.
37
0
20
40
60
80
100
120
140
1998 2000 2002 2004 2006 2008 2010 2012 20140
2
4
6
8
10
12
14
Crude Oil (Left scale) Natural Gas (Right scale)
($/barrel, WTI) ($/million Btu, Henry Hub)
Crude Oil and Natural Gas Prices Diverge
Copyright © 2010 IHS Global Insight. All Rights Reserved.
38
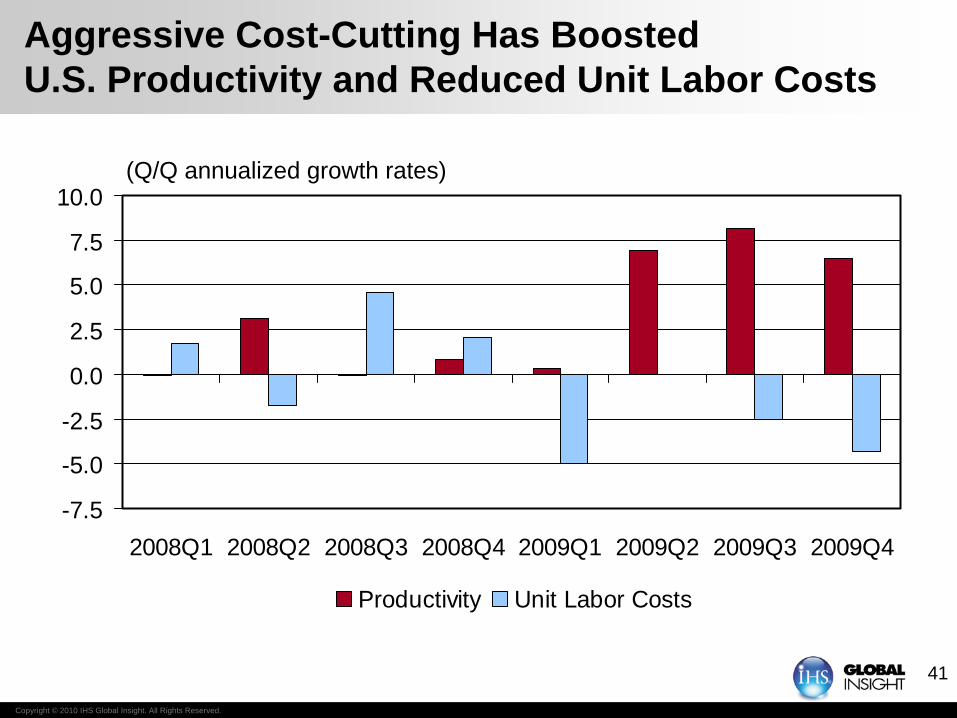
7. Inflation Will (Mostly) Not Be a Problem
• Historically-high levels of unemployment and excess capacity will limit both wage and price inflation – also strong productivity growth in the U.S. has been a powerful disinflationary force
• Central banks will most likely remove the excess liquidity sloshing around the global economy, before inflation expectations begin to rise much
• Strong growth in Asia will probably mean that inflationary pressures will be felt in that region first
• Also at risk of rising inflation are countries that peg (or strongly manage) their exchange rates to the dollar – mostly in Asia and the Middle East

Copyright © 2010 IHS Global Insight. All Rights Reserved.
39
0 5 10 15 20
JapanItaly
United KingdomGermany
CanadaChina
EurozoneUnited States
FranceSpain
(Unemployment rates, percent in October/November, 2009)
Labor Market Slack Will Limit Wage Inflation

Copyright © 2010 IHS Global Insight. All Rights Reserved.
40
40
-7
-6
-5
-4
-3
-2
-1
0
Japan United States Eurozone U.K. Germany
(Percent of potential GDP, 2009)
Source: OECD
Output Gaps Will Limit Price Inflation
Copyright © 2010 IHS Global Insight. All Rights Reserved.
41
Aggressive Cost-Cutting Has Boosted U.S. Productivity and Reduced Unit Labor Costs
-7.5
-5.0
-2.5
0.0
2.5
5.0
7.5
10.0
2008Q1 2008Q2 2008Q3 2008Q4 2009Q1 2009Q2 2009Q3 2009Q4
Productivity Unit Labor Costs
(Q/Q annualized growth rates)

Copyright © 2010 IHS Global Insight. All Rights Reserved.
42
-3
0
3
6
9
12
NAFTA WesternEurope
Japan OtherAmericas
EmergingEurope
Mideast-N. Africa
Sub-SaharanAfrica*
OtherAsia-
Pacific
2008 2009 2010 2011
(Percent change)
* Excluding Zimbabwe
Consumer Price Inflation Will Be Tame (Almost) Everywhere

Copyright © 2010 IHS Global Insight. All Rights Reserved.
43
8. After Improving for a While, Global Imbalances Will Worsen Again
• The recent sharp improvement in the U.S. current account is mostly due to the deep U.S. recession and the big drop in oil prices
• The less dramatic fall in the current account surpluses in other parts of the world reflects the sharp contraction in world exports and the drop in commodity prices
• The U.S. current account deficit will increase again, as the American recovery outpaces that of the other developed economies
• Likewise, continuing dependence on export-led growth in many large economies (e.g., Germany, China and the rest of Asia) will contribute to the worsening in global imbalances

Copyright © 2010 IHS Global Insight. All Rights Reserved.
44
The U.S. Current Account Deficit Will Widen Again
-1,000
-800
-600
-400
-200
0
200
1970 1974 1978 1982 1986 1990 1994 1998 2002 2006 2010-7.5
-6.0
-4.5
-3.0
-1.5
0.0
1.5
Current Account Deficit Deficit as a % of GDP
(Billions of dollars) (Percent of GDP)

Copyright © 2010 IHS Global Insight. All Rights Reserved.
45
-1,000
-750
-500
-250
0
250
500
750
1996 1998 2000 2002 2004 2006 2008 2010 2012 2014
United States Western Europe JapanAsia exc. Japan Middle East
(Billions of dollars)
Current Account Imbalances Remain Large

Copyright © 2010 IHS Global Insight. All Rights Reserved.
46
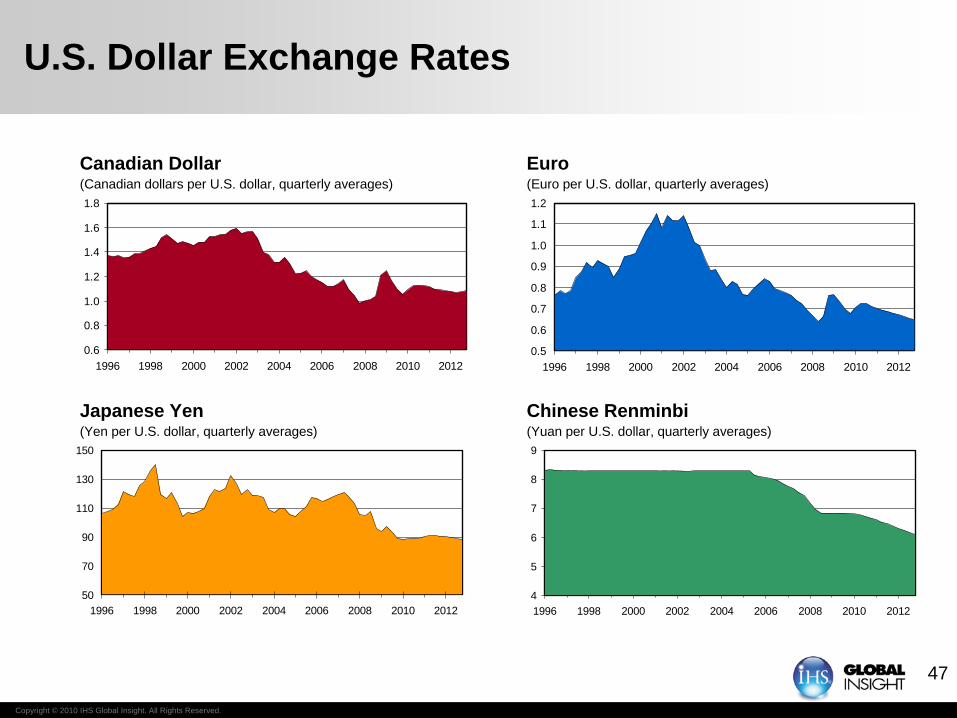
9. While the Dollar May Strengthen a Little, It Is on a Downward Glide Path
• The dollar is probably oversold relative to the euro and the yen, given the slightly better growth prospects of the U.S. economy – so a small appreciation in the next few months is likely
• Nevertheless, given that progress on the global imbalances has been temporary, the downward pressure on the dollar will continue
• The depreciation of the dollar is likely to be the largest vis-à-vis some emerging market currencies (especially the “floaters”)
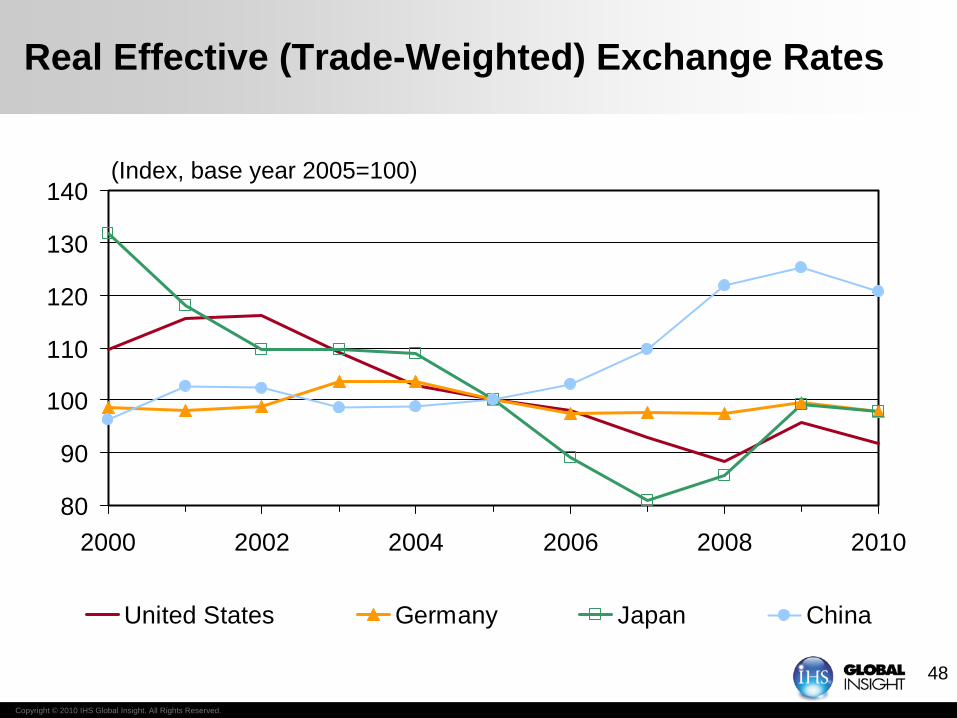
• Notwithstanding complaints about a weak dollar, many developed country currencies have been declining on an inflation-adjusted, trade-weighted basis – this is especially true of the yen
• Despite being fixed relative to the dollar, the Chinese renminbi, is sharply down against the euro and on a real trade-weighted basis
Copyright © 2010 IHS Global Insight. All Rights Reserved.
47
U.S. Dollar Exchange Rates
0.6
0.8
1.0
1.2
1.4
1.6
1.8
1996 1998 2000 2002 2004 2006 2008 2010 20120.5
0.6
0.7
0.8
0.9
1.0
1.1
1.2
1996 1998 2000 2002 2004 2006 2008 2010 2012
50
70
90
110
130
150
1996 1998 2000 2002 2004 2006 2008 2010 2012
Canadian Dollar Euro
Japanese Yen Chinese Renminbi
(Canadian dollars per U.S. dollar, quarterly averages) (Euro per U.S. dollar, quarterly averages)
(Yen per U.S. dollar, quarterly averages)
4
5
6
7
8
9
1996 1998 2000 2002 2004 2006 2008 2010 2012
(Yuan per U.S. dollar, quarterly averages)
Copyright © 2010 IHS Global Insight. All Rights Reserved.
48
80
90
100
110
120
130
140
2000 2002 2004 2006 2008 2010
United States Germany Japan China
(Index, base year 2005=100)
Real Effective (Trade-Weighted) Exchange Rates
Copyright © 2010 IHS Global Insight. All Rights Reserved.
49
10. The Risk of a “Hard W” Is Still Uncomfortably High
• The risk of a “hard W” is about one in five, and the list of possible triggers is long
• Fiscal and monetary policies could be tightened prematurely
• Consumer spending could collapse in the face of rising unemployment
• Oil prices could rise either because of a supply disruption or increased speculative activity
• A few large financial institutions could still fail
• It would probably take a combination of these factors to drag the global economy back into negative territory
• The good news is that the risks to global growth are evenly balanced, with upside risks including a quicker and stronger release of pent-up demand

Copyright © 2010 IHS Global Insight. All Rights Reserved.
50
(Annualized rate of growth)
U.S. Scenarios
-8
-6
-4
-2
0
2
4
6
8
2008 2009 2010 2011
Baseline (60%) Pessimistic Scenario (20%) Optimistic Scenario (20%)

Copyright © 2010 IHS Global Insight. All Rights Reserved.
51
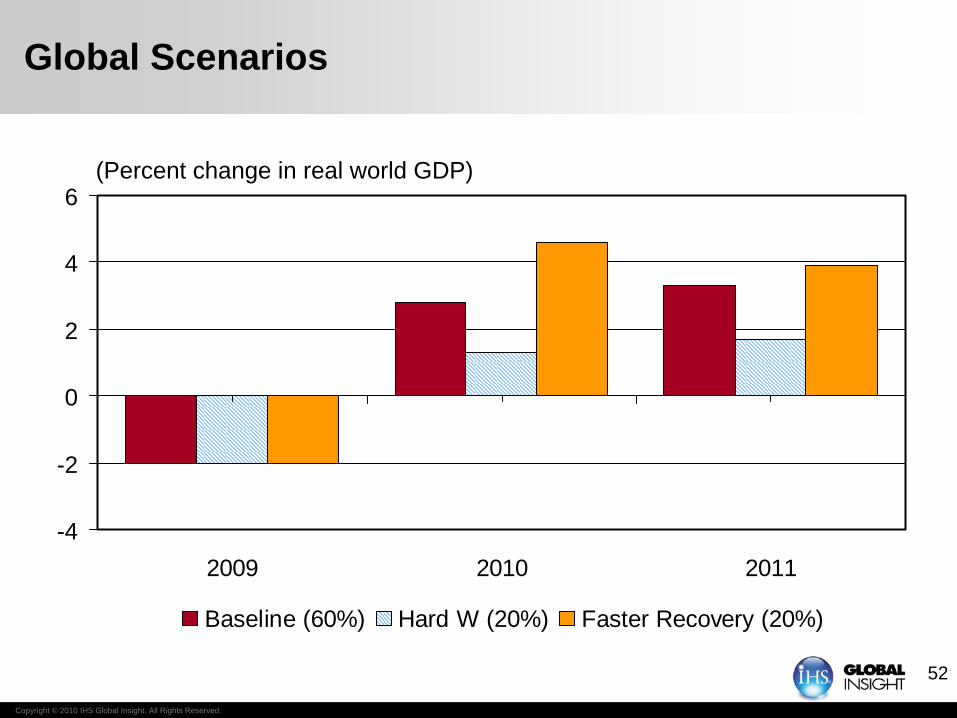
Risks on Both Sides
• Downside Risks
• Private demand not ready to take over when stimulus is withdrawn (perhaps a policy error is made)
• Productivity keeps booming—household incomes suffer, firms save the profits
• Commercial real estate woes reignite the financial crisis
• Policy fears—e.g. health care, cap-and-trade
• Upside Risks
• Massive fiscal and monetary stimulus still in the pipeline
• Pent-up demand is accumulating after the “panic” spending cuts during the end-08/early-09 economic free-fall
• Prolonged growth surge in Asia, weak dollar boost exports more than expected
Copyright © 2010 IHS Global Insight. All Rights Reserved.
52
Global Scenarios
-4
-2
0
2
4
6
2009 2010 2011
Baseline (60%) Hard W (20%) Faster Recovery (20%)
(Percent change in real world GDP)

Trade ImplicationsTrade Implications

Copyright © 2010 IHS Global Insight. All Rights Reserved.
54
World Trade Typically Grows Faster Than Real GDP
-14
-10
-6
-2
2
6
10
14
18
2005 2007 2009 2011 2013 2015 2017 2019 2021 2023 2025
GDP Trade
(Percent change)

Copyright © 2010 IHS Global Insight. All Rights Reserved.
55
U.S. International Trading Partners Are Shifting
0
5
10
15
20
25
30
2005 2010 2015 2020 2025
Latin America Asia Pacific Europe OtherSource: Global Insight World Trade Service
(Exports, trillions of U.S. dollars)

Copyright © 2010 IHS Global Insight. All Rights Reserved.
56
Growth in Global Merchandise Trade
050
100150200250300350400450
2005 2007 2009 2011 2013 2015 2017 2019 2021 2023 2025
Air Sea Land/OtherSource: Global Insight World Trade Service
(Trillions of U.S. dollars)
Copyright © 2010 IHS Global Insight. All Rights Reserved.
57
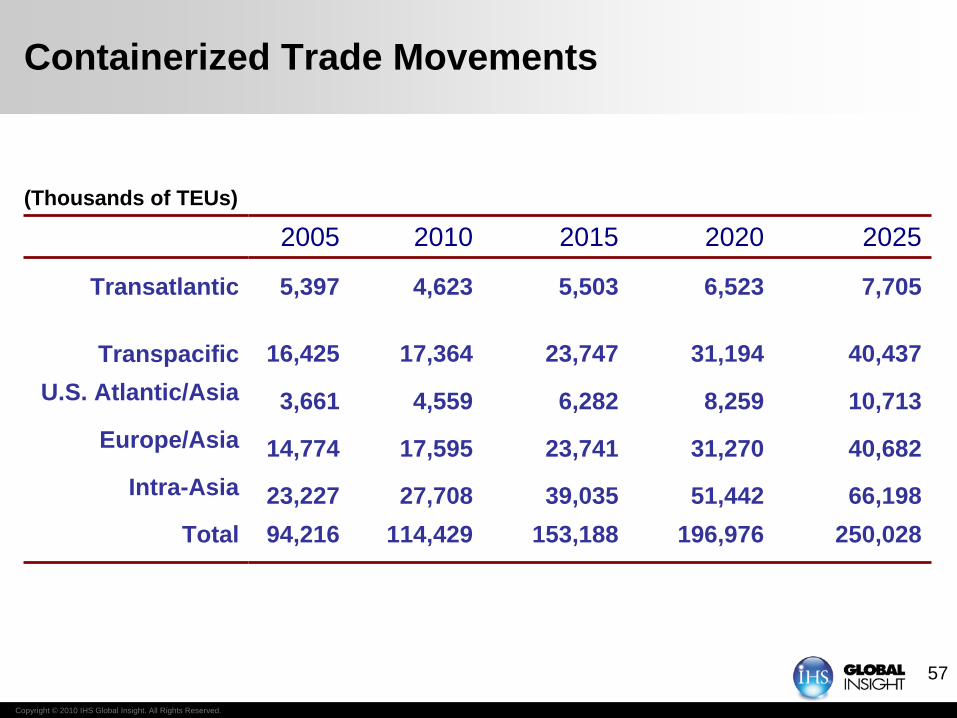
Containerized Trade Movements
(Thousands of TEUs)
2005 2010 2015 2020 2025
Transatlantic 5,397 4,623 5,503 6,523 7,705
Transpacific 16,425 17,364 23,747 31,194 40,437U.S. Atlantic/Asia 3,661 4,559 6,282 8,259 10,713
Europe/Asia 14,774 17,595 23,741 31,270 40,682Intra-Asia 23,227 27,708 39,035 51,442 66,198
Total 94,216 114,429 153,188 196,976 250,028

Copyright © 2010 IHS Global Insight. All Rights Reserved.
58
Transatlantic Container Trade
0
1
2
3
2005 2007 2009 2011 2013 2015 2017 2019 2021 2023 2025
North America to Europe Europe to North America
(Millions of TEUs)

Copyright © 2010 IHS Global Insight. All Rights Reserved.
59
Transpacific Container Trade
0
10
20
30
40
50
2005 2007 2009 2011 2013 2015 2017 2019 2021 2023 2025
Asia to North America North America to Asia
(Millions of TEUs)

Copyright © 2010 IHS Global Insight. All Rights Reserved.
60
Europe to Far East Container Trade
02468
10121416
2005 2007 2009 2011 2013 2015 2017 2019 2021 2023 2025
Europe to Far East Far East to Europe
(Millions of TEUs)

Copyright © 2010 IHS Global Insight. All Rights Reserved.
61
Container Growth Rates By U.S. Coast
-30
-20
-10
0
10
20
30
2006 2007 2008 2009 2010 2011 2012 2013 2014 2015Great Lakes Gulf North AtlanticNorth Pacific South Atlantic South Pacific
(Percent change in TEUs)

Copyright © 2010 IHS Global Insight. All Rights Reserved.
62
Implications for the Port
• The trade recovery from last year’s low has begun
• Pace of trade volume recovery is slow
• Export growth to Asia will be strong …
• … While European trade will remain weak
• This explains the East Coast/West Coast differences in container traffic
• Bottom line: it will get better but slowly