50
| Date post: | 19-Aug-2015 |
| Category: |
Travel |
| Upload: | troy-thompson |
| View: | 13,010 times |
| Download: | 1 times |


TRENDS

MOBILE
1

20.52%
1
The average destination receives
of total traffic from mobile.
Source: Mark Research Report / How Travelers are Engaging with Destinations on the Mobile Web / December 2012

1.7 days.
1
Travelers typically plan
Source: Mark Research Report / How Travelers are Engaging with Destinations on the Mobile Web / December 2012
in advance on a phone.

TABLET
2
10x
2The share of website visits from
tablets grew approximately
faster than the rate for smartphones.
Source: Adobe® Digital Index Report / May 2012
20 days.
2
Travelers typically plan
Source: Mark Research Report / How Travelers are Engaging with Destinations on the Mobile Web / December 2012
in advance on a tablet.

LOCAL
3

getlisted.org
3
Start your local efforts at

3

3

3

1/3
3
Source: Think With Google / Understanding Mobile Users
of mobile searches have local intent.
3
Graph SearchFacebook's
demands accurate, local content.

CUSTOMEROWNERSHIP
4

4
500,000Google's Field Trip app
has been downloaded nearly
times.
Source: Google Field Trip

4

4

SOCIAL SERVICE
5

5
17%One in five consumers,
has used social media at least oncein the last year to obtain acustomer service response.
Source: American Express® Global Customer Service Barometer
5
42%of consumers expect a social media
response within one hour.
Source: Edison Research / The Social Habit
5
15 peopleAmericans will tell an average of
about positive (customer service) experiences.
Source: American Express® Global Customer Service Barometer

HUMANIZATION
6

6

SPACE SHARING
7

7

7
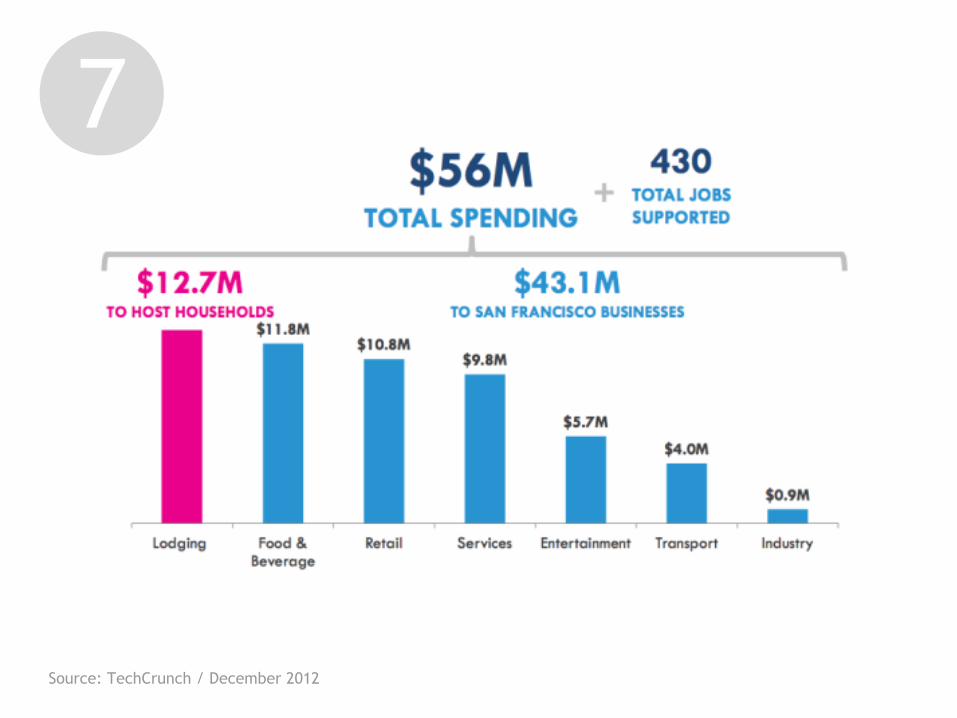
Hilton Hotels.Airbnb is filling more rooms nights than
Source: TechCrunch / December 2012
Source: TechCrunch / December 2012
7
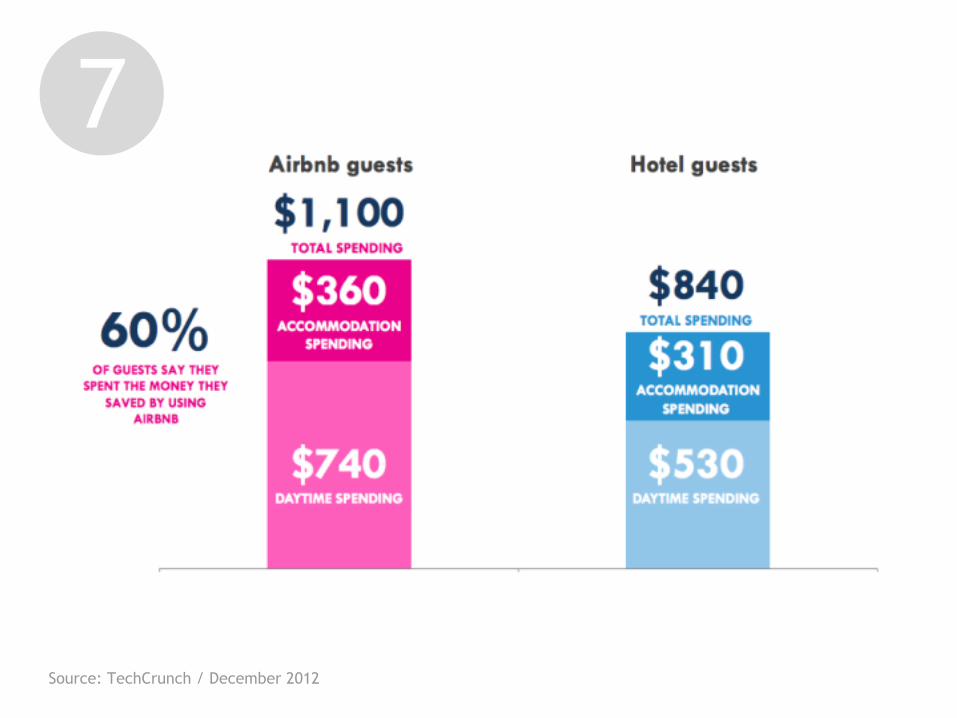
Source: TechCrunch / December 2012
7

Source: TechCrunch / December 2012
7

PHOTOS + VIDEO
8
8
40 millionphotos are posted to Instagram everyday.
Source: Instagram Press Center

8

CONTENTMARKETING
9

BASICS
10

BUZZWORDS

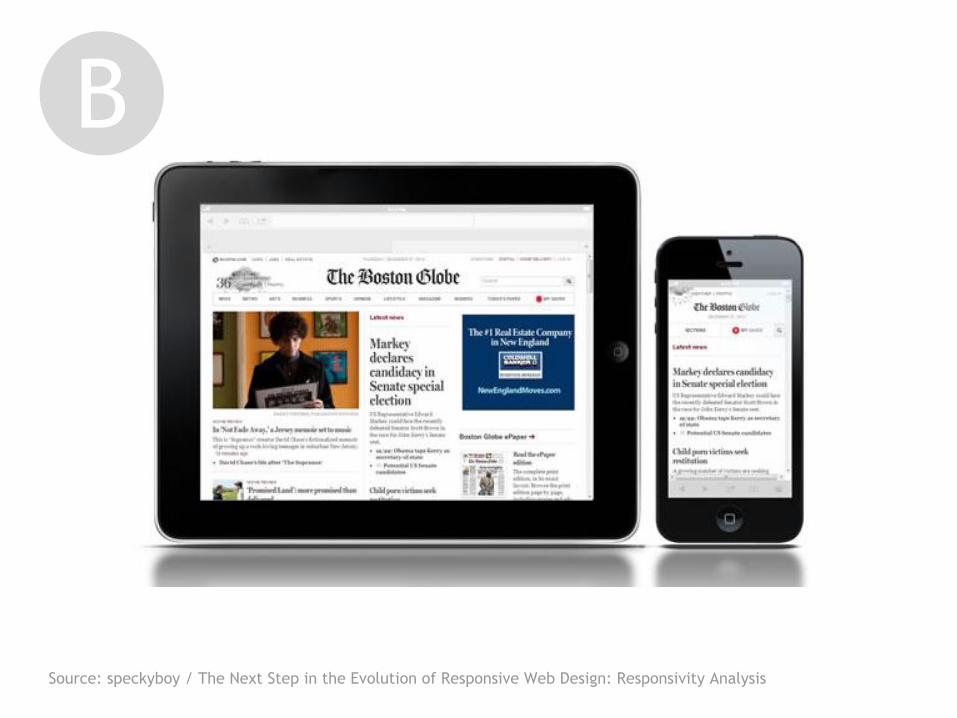
RESPONSIVE
B
B
Source: speckyboy / The Next Step in the Evolution of Responsive Web Design: Responsivity Analysis

B
Source: speckyboy / The Next Step in the Evolution of Responsive Web Design: Responsivity Analysis

NATIVE ADS
B

GRAPH SEARCH
B

Source: http://actualfacebookgraphsearches.tumblr.com/
B

Source: http://actualfacebookgraphsearches.tumblr.com/
B

BULLSH*T

QR CODES
*

BIG DATA
*

GAMIFICATION
*

ICONSdribbble.com/victorerixon


