Page 1
Int. J. Oil, Gas and Coal Technology, Vol. 5, No. 1, 2012 1
Copyright © 2012 Inderscience Enterprises Ltd.
Top-Down, Intelligent Reservoir
Modeling of Oil and Gas
Producing Shale Reservoirs; Case
Studies
Shahab D. Mohaghegh* Intelligent Solutions, Inc. and
Department of Petroleum & Natural Gas Engineering,
West Virginia University, Morgantown, West Virginia, 26506, USA
E-mail: [email protected]
*Corresponding author
Ognjen Gruic Saeed Zargari West Virginia University Colorado School of Mines
E-mail: [email protected] E-mail: [email protected]
Amirmasoud Kalantari Grant Bromhal West Virginia University U.S. Department of Energy, NETL
E-mail: [email protected] Email: [email protected]
Abstract: Producing hydrocarbon (both oil and gas) from Shale plays has attracted much
attention in recent years. Advances in horizontal drilling and multi-stage hydraulic
fracturing have made shale reservoirs a focal point for many operators. Our understanding
of the complexity associated with the flow mechanism in the natural fracture and its
coupling with the matrix and the induced fracture, impact of geomechanical parameters and
optimum design of hydraulic fractures has not necessarily kept up with our interest in these
prolific and hydrocarbon rich formations.
In this paper we discuss the application of a new reservoir modeling approach to history
matching, forecasting and analyzing oil and gas production from shale reservoirs. In this
new approach instead of imposing our understanding of the flow mechanism and the
production process on the reservoir model, we allow the production history, well log, and
hydraulic fracturing data to force their will on our model and determine its behavior. In
other words, by carefully listening to the data from individual wells and the reservoir as a
whole, we developed a data-driven model and history match the production process and
validate our model (using blind production history) from shale reservoirs. The validated,
history matched model is used to forecast future production from the field and to assist in
planning field development strategies. In the validation context, the “blind production
history” is referred to the last several months of production history that is not used during
the training and history matching process and has been used to validate the forecast of the
Top-Down Model (TDM).
This is a unique and innovative use of pattern recognition capabilities of Artificial
Intelligence and Data Mining (AI&DM) as a workflow to build a full field reservoir
simulation model for forecasting and analysis of oil and gas production from shale
formations. Examples of three case studies in Lower Huron and New Albany shale
formations (gas producing) and Bakken shale (oil producing) is presented in this article.
Keywords: Top-Down Modelling, Shale Reservoir, Reservoir Modelling, Reservoir Simulation.
Reference to this paper should be made as follows: Mohaghegh, S.D., Gruic, O., Zargari, S., Kalantari, M. (2011) „Top-Down, Intelligent Reservoir Modelling of Oil and Gas Producing Shale Reservoirs; Case Studies‟, Int. J. Oil, Gas, and Coal Technology, Vol. x, Nos. x/x/x, pp.xx–xx.
Page 2
12 S.D. MOHAGHEGH, O. GRUIC, S. ZARGARI, A. KALANTARI & G. BROMHAL
Biographical notes:
S.D. Mohaghegh received his PhD in Petroleum & Natural Gas Engineering from Penn State University in 1991. He is currently Professor at the Department of Petroleum & Natural Gas Engineering, West Virginia University. He is the president and founder of Intelligent Solutions, Inc. His current research interests include application of Artificial Intelligence & Data Mining (AI&DM) in smart fields, carbon sequestration and fluid flow in unconventional reservoirs.
O. Gruic received his MS degree in Petroleum and Natural Gas Engineering from West Virginia University in 2011. Currently he is a Reservoir Engineer with Stratagen Engineering. His current research interest includes application of Artificial intelligence and Data Mining (AI&DM) in smart fields, unconventional reservoir engineering, and well stimulation in unconventional reservoirs.
S. Zargari received Master of Science degree in Petroleum and Natural Gas Engineering from West Virginia University in 2010. He is currently a PhD student in Petroleum Engineering at Colorado School of Mines. His current research interests are Reservoir Characterization and Modeling in unconventional reservoirs.
A. Kalantari-Dahaghi received BS in petroleum engineering from Petroleum University of Technology and MS in Petroleum and Natural Gas Engineering from West Virginia University in 2010. Currently, he is a Ph.D. student at WVU. His current research interests include modelling and simulation of unconventional gas resources (especially shale gas reservoirs), applicability and simulation of CO2 sequestration in shale gas reservoirs, artificial Intelligence application in shale gas reservoir modelling.
G. S. Bromhal received bachelors‟ degrees in Civil Engineering and Mathematics from West Virginia University in 1995. He received a Masters from Carnegie Mellon in Civil and Environmental Engineering in 1997 and a PhD from Carnegie Mellon in Environmental Engineering in 2000. His research interests include modeling two-phase flow in porous media, from the pore level to the reservoir scale, modeling, experiments, and field research related to carbon sequestration and hydrocarbon recovery. He is the recipient of the 2007 Hugh Guthrie Award for Innovation at NETL, and the 2010 USGS Director‟s Award for Exemplary Service to the Nation.
1 INTRODUCTION
This article reviews a new reservoir simulation and
modeling technology called Top-Down, Intelligent
Reservoir Modeling (Top-Down Modeling - TDM) as it is
applied to shale formations with examples presented for
New Albany, Lower Huron and Bakken Shales. The natural
fractures in the shale contribute significantly to the
production as the main conduit for reservoir permeability.
Recent revival of interest in production from shale
formations can be attributed to multi-stage hydraulic
fractures. It is a known fact that success of these hydraulic
fracturing procedures is directly related to their ability to
reach and intersect the existing natural fractures in the shale
formation. Mapping of the natural fractures in the shale
formations have proven to be an elusive task. Even with
most advanced logging technologies one can only detect the
intersection of the natural fractures with the wellbore while
the extent of these fracture beyond the wellbore and how
they are distributed throughout the reservoir (between wells)
remains the subject of research.
Instead of modeling the discrete fracture networks and
mechanism of multi-stage hydraulic fractures, and then
trying to couple them, Top-Down Modeling attempts to
model the impact of hydraulic fractures and natural fractures
on the production from wells. While developing stochastic
realizations of natural fractures and their intersection with
the induced hydraulic fracturing are being studied using
stochastic and numerical reservoir modeling, TDM fills the
existing gap for a predictive model that can be built using
minimum amount of assumptions about the nature of the
reservoir and our understanding of its complexity. TDM
starts with a solid assumption that whatever the nature of the
natural fracture distribution and its interaction with the
induced hydraulic fractures may be, their impact is bound to
show itself in the amount of the hydrocarbon that each well
is able to produce. These signatures can be used in order to
build reservoir models, match the production history and
build a predictive model that can help us make reservoir
management decisions.
Top-Down Modeling (TDM) technology is an elegant
integration of traditional reservoir engineering methods with
pattern recognition capabilities of artificial intelligence and
Page 3
TOP-DOWN MODELING OF OIL & GAS PRODUCING SHALE RESERVOIRS; CASE STUDIES 13
data mining. Advantages of this new modeling technology
include its flexible data requirement, short development
time and ease of development and analysis. Its shortcoming
is that it can only be applied to brown fields where
reasonable amount of data from the field is accessible. The
data requirements for the Top-Down Modeling necessitate a
field with about 35 to 40 wells and about 5 years of
production history. As number of wells increases, the
amount of required production history may be reduced.
Traditional reservoir simulation and modeling is a bottom-
up approach. It starts with building a geological model of
the reservoir followed by adding engineering fluid flow
principles (Diffusivity equation, Darcy's law, Fick's law of
diffusion …) to arrive at a dynamic reservoir model. The
dynamic reservoir model is calibrated using the production
history of multiple wells and the history matched model is
used to strategize field development in order to improve
recovery.
Top-Down Modeling approaches the reservoir simulation
and modeling from an opposite angle by attempting to build
a realization of the reservoir starting with well production
behavior (history). The production history is augmented
with core, log, well test and seismic data (upon availability
of each) in order to increase the accuracy and fine tune the
Top-Down Model. The model is then calibrated (history
matched) using the most recent wells as blind dataset.
Although not intended as a substitute for the traditional
reservoir simulation of large, complex fields, this novel
approach to reservoir modeling can be used as an alternative
(at a fraction of the cost and time) to traditional numerical
reservoir simulation in cases where performing traditional
modeling is cost (and man-power) prohibitive, specifically
for shale formations. In cases where a conventional model
of a reservoir already exists, Top-Down Modeling should be
considered a complement to, rather than a competition for
the traditional technique. It provides an independent look at
the data coming from the reservoir/wells for optimum
development strategy and recovery enhancement.
Top-Down Modeling provides a unique perspective of the
field and the reservoir using actual measurements. It
provides qualitatively accurate reservoir characteristics
maps that can play a key role in making important and
strategic field development decisions.
Accuracy and validity of TDM have been demonstrated
against numerical reservoir simulation models and details of
this technology have been published extensively in several
recent articles and therefore will not be repeated here
(Gaskari 2007 – Mata 2007 – Mohaghegh 2009b – Gomez
2009 – Khazaeni, 2010).
2 TOP-DOWN MODELING OF SHALE RESERVOIRS
Top-Down Modeling is part of a larger class of reservoir
simulation models that are referred to as AI-Based
Reservoir Models (Mohaghegh, 2011). AI-Based Reservoir
Models consist of models that are built using data generated
by numerical reservoir simulators, also known as Surrogate
Reservoir Models (Mohaghegh 2008, Mohaghegh 2009a)
and models that are built using field data, also known as
Top-Down, Intelligent Reservoir Models that are the subject
of this paper and will be referenced in more detail
throughout this manuscript.
Traditional reservoir simulation is the industry standard for
reservoir management. It is used in all phases of field
development in the oil and gas industry and is now being
used on some but not all of the shale formations. The
routine of simulation studies calls for integration of static
and dynamic measurements into the reservoir model.
Traditional reservoir simulation and modeling is a bottom-
up approach that starts with building a geological (geo-
cellular or static) model of the reservoir. Using modeling
and geo-statistical manipulation of the data the geo-cellular
model is populated with the best available petrophysical and
geophysical information. Engineering fluid flow principles
are added and solved numerically to arrive at a dynamic
reservoir model. The dynamic reservoir model is calibrated
using the production history of multiple wells in a process
called history matching and the final history matched model
is used to strategize the field development in order to
improve recovery. Characteristics of the traditional reservoir
simulation and modeling include:
1. It takes a significant investment (time and money)
to develop a geological (geo-cellular, static) model
to serve as the foundation of the reservoir
simulation model.
2. Development and history matching of a reservoir
simulation model is not a trivial process and
requires modelers and geoscientists with
significant amount of experience.
3. It is an expensive and time consuming endeavor.
A prolific asset is required in order to justify a significant
investment that is required for a reservoir simulation model.
Top-Down Intelligent Reservoir Modeling (TDM) can serve
as an alternative or a complement to traditional reservoir
simulation and modeling. TDM is a process that follows the
following logic:
a. Perform individual well analysis using all the
available reservoir engineering techniques.
i. Static analysis using well logs.
ii. Dynamic analysis using production data.
b. Use data-driven modeling to model interference
between wells using the impact of offset wells on
the production of each individual well.
c. Couple the reservoir engineering analysis of
individual wells with the interference modeling
using pattern recognition technology in order to
develop a cohesive full field model.
Top-Down Modeling (TDM) starts with the well-known
reservoir engineering techniques such as Decline Curve
Analysis, Type Curve Matching, History Matching using
single well numerical reservoir simulation, Volumetric
Reserve Estimation and calculation of Recovery Factors for
all the wells (individually) in the field.
Page 4
12 S.D. MOHAGHEGH, O. GRUIC, S. ZARGARI, A. KALANTARI & G. BROMHAL
Using statistical techniques multiple Production Indicators
(3, 6, and 9 months cumulative production as well as 1, 3, 5,
and 10 year cumulative production) are calculated. The
reservoir engineering analyses along with the statistical data
form the basis for a comprehensive spatio-temporal
database. This database represents an extensive set of snap
shots of fluid flow in the shale formation. It is expected that
all the characteristics that governs the complexity of fluid
flow in the naturally fractured reservoir to be captured in
this extensive spatio-temporal database.
This large volume of data is processed using the state-of-
the-art in artificial intelligence and data mining (neural
modeling, genetic optimization and fuzzy pattern
recognition) in order to generate a complete and cohesive
model of the entire reservoir. This is accomplished by using
a set of discrete modeling techniques to generate production
related predictive models of well behavior, followed by
intelligent models that integrate the discrete models into a
cohesive model of the reservoir as a whole, using a
continuous fuzzy pattern recognition algorithms.
The Top-Down, Intelligent Reservoir Model is calibrated
using the most recent set of wells that have been drilled in
the field. The calibrated model is then used for field
development strategies to improve and enhance
hydrocarbon recovery. Top-Down Models are used in
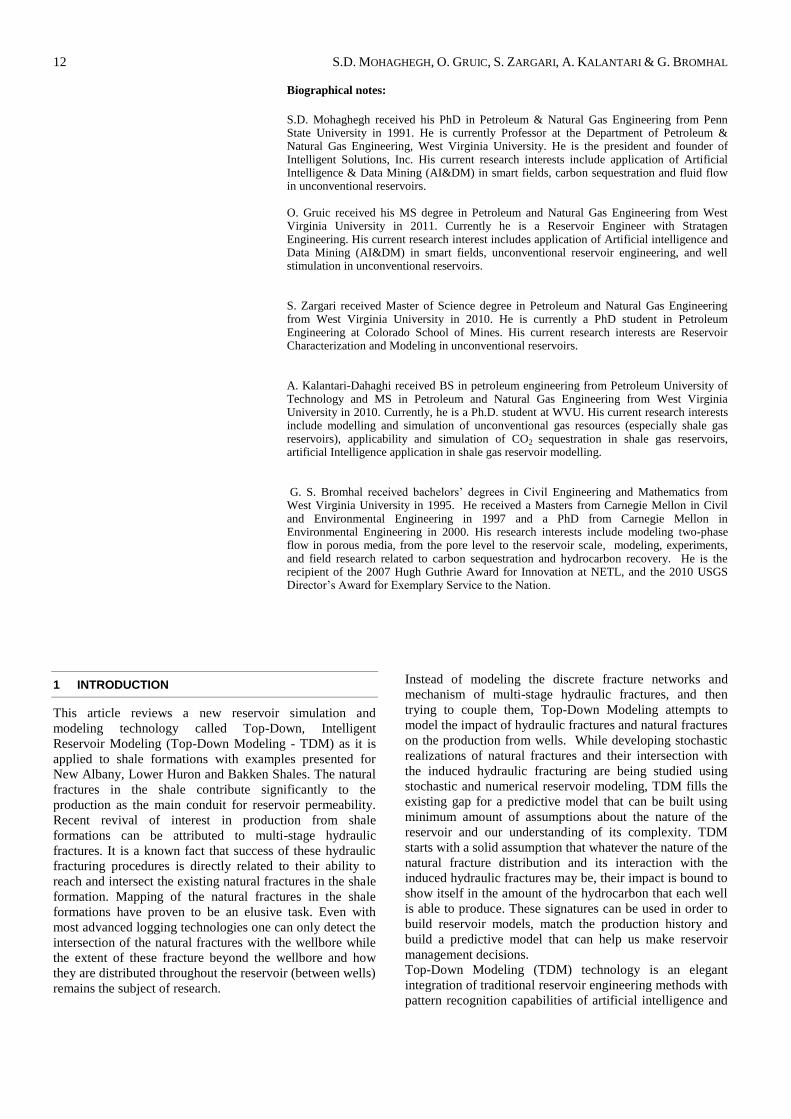
reservoir management workflows using the flowchart that is
shown in Figure 1.
Upon completion of the spatio-temporal database, which
proves to be one of the most important steps in development
of a Top-Down Model (TDM), the process of training and
history matching of the TDM is performed simultaneously.
It must be noted that a rigorous blind history matching is
required in this step of the process to ensure the robustness
of the Top-Down Model. Using the design tool that is part
of the TDM process, field development strategies are
planned and then using the history matched model (in
predictive mode) the plans are tested to see if they fulfill the
objectives of reservoir management. This process is
repeated, iteratively (by planning new wells to be drilled
and predicting their performance), until the reservoir
management objectives are met. Once the objective is
accomplished, the plan is forwarded to operation for
implementation.
Figure 1. Reservoir management workflow using Top-Down
Modeling.
The Top-Down Model, like any other reservoir model,
needs to be updated regularly, as shown in the flow chart in
Figure 1. It is noteworthy to mention that most of the work
presented in this paper has been performed on publicly
available data. Only for Lower Huron shale some
completion data was acquired from one of the operators in
the region.
In the following sections some of the results that have been
achieved from application of TDM to three shale formations
are briefly presented.
3 APPLICATION OF TOP-DOWN MODELING TO
LOWER HURON SHALE
While the details of the Top-Down Modelling application to
Lower Huron Shale can be found in a recently published
SPE paper (Grujic 2010) some new information on this
study are presented here. The Lower Huron Shale that is
sometimes referred to as the “Devonian Shale” is located in
extreme southeast Ohio, West Virginia and Northeast
Kentucky. It is a part of the Appalachian Basin which links
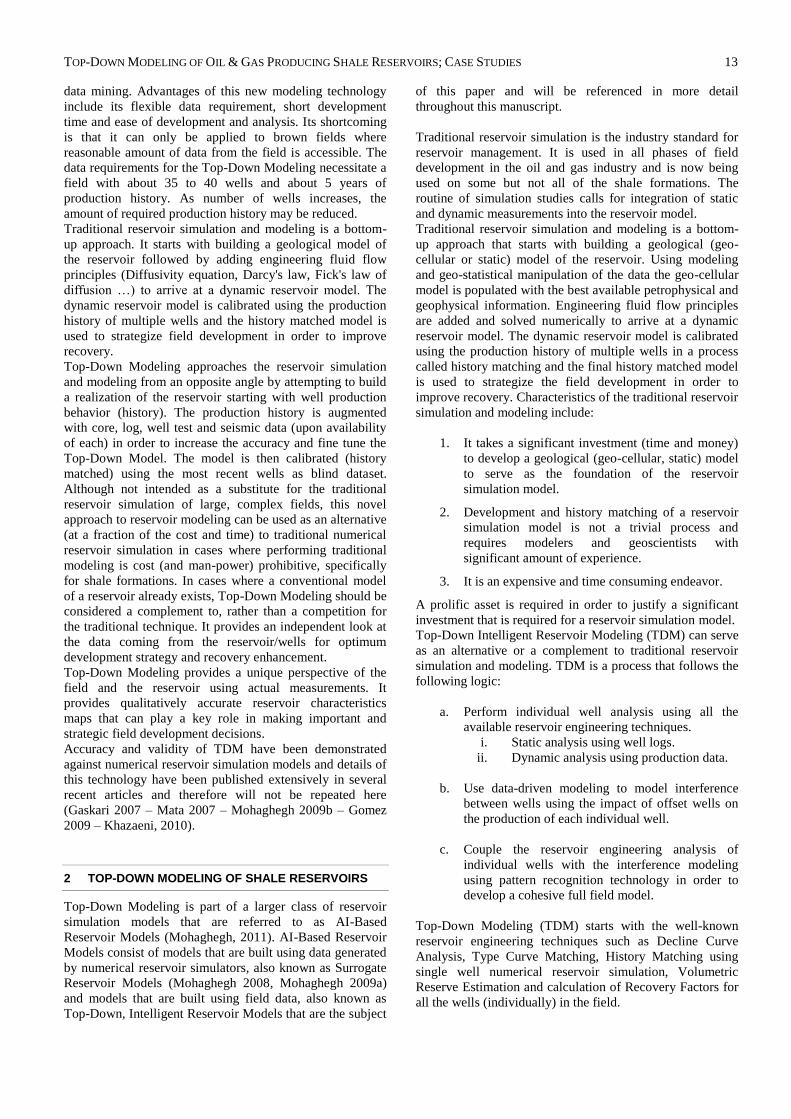
Chattanooga Shale and Marcellus Shale. The Lower Huron
Shale has a wide range of thickness, ranging from 200 to
2000 ft thick.
Figure 2. Shale distribution in Kentucky.
Thickness of the Lower Huron Shale in Kentucky is shown
in Figure 2, identifying the deeper and thicker shale
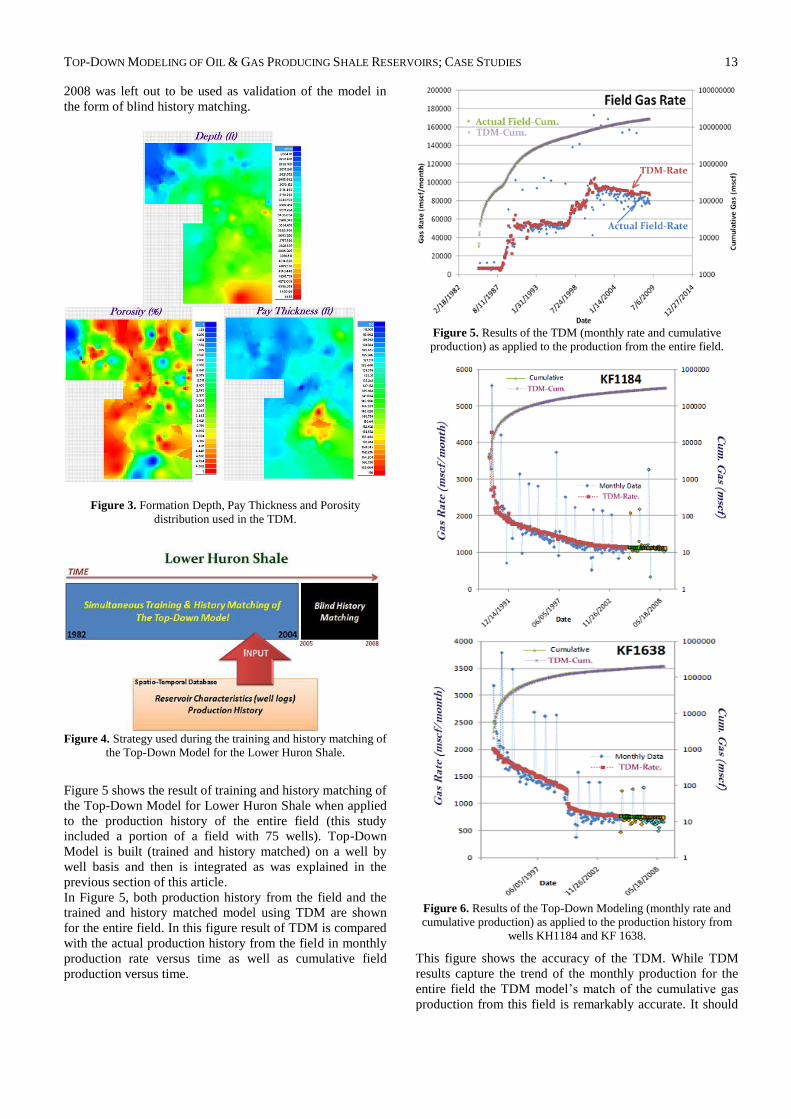
formations. Depth, formation thickness and porosity
distribution of the portion of the field that is the subject of
Top-Down Modelling is shown in Figure 3.
Following the flow chart that was presented in Figure 1, the
TDM for the Lower Huron Shale is trained and history
matched. During the TDM training and history matching
process usually the tail-end of the production is removed
from the model building process and is used as blind test in
order to check the validity of the reservoir model. The
quality of the TDM is usually judged based on its capability
to predict the part of the production history that has not been
used during the reservoir model training.
Figure 4 shows the strategy that was incorporated during the
Top-Down Model training, history matching and blind
history matching for the Lower Huron Shale. Production
history was available for this field from 1982 to 2008. The
Top-Down Model was trained and history matched with
data from 1982 to 2004 and production history from 2005 to
Page 5
TOP-DOWN MODELING OF OIL & GAS PRODUCING SHALE RESERVOIRS; CASE STUDIES 13
2008 was left out to be used as validation of the model in
the form of blind history matching.
Figure 3. Formation Depth, Pay Thickness and Porosity
distribution used in the TDM.
Figure 4. Strategy used during the training and history matching of
the Top-Down Model for the Lower Huron Shale.
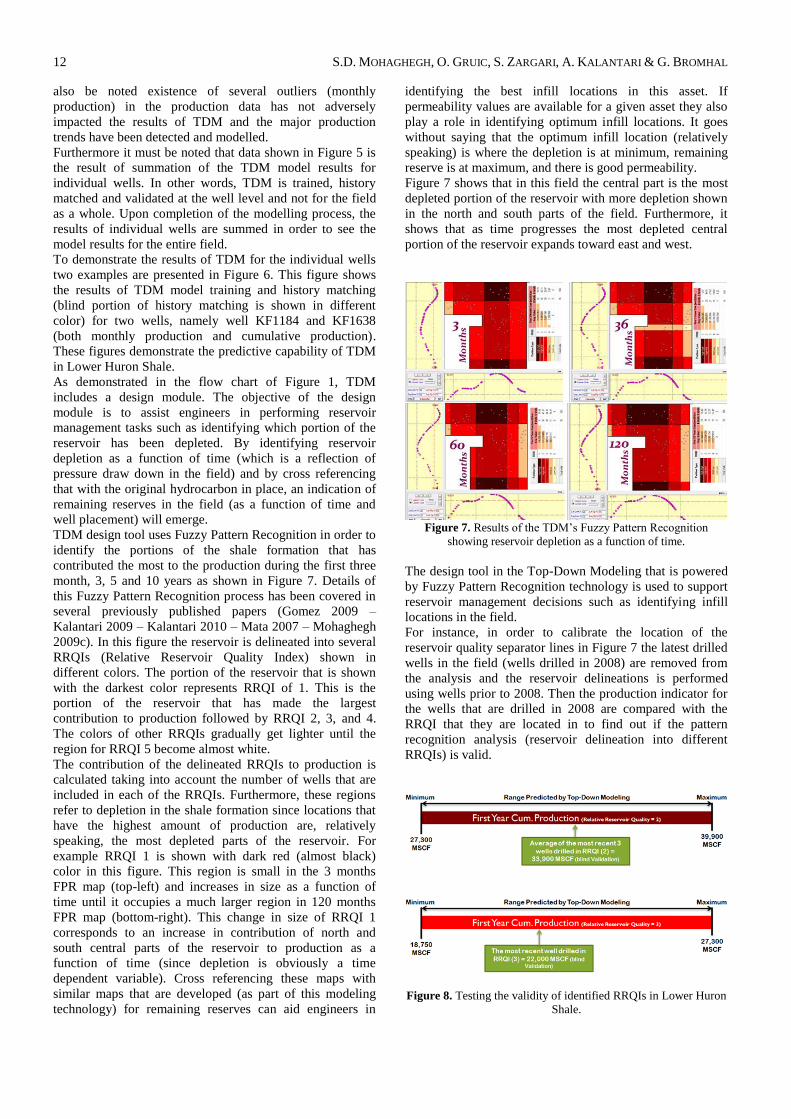
Figure 5 shows the result of training and history matching of
the Top-Down Model for Lower Huron Shale when applied
to the production history of the entire field (this study
included a portion of a field with 75 wells). Top-Down
Model is built (trained and history matched) on a well by
well basis and then is integrated as was explained in the
previous section of this article.
In Figure 5, both production history from the field and the
trained and history matched model using TDM are shown
for the entire field. In this figure result of TDM is compared
with the actual production history from the field in monthly
production rate versus time as well as cumulative field
production versus time.
Figure 5. Results of the TDM (monthly rate and cumulative
production) as applied to the production from the entire field.
Figure 6. Results of the Top-Down Modeling (monthly rate and
cumulative production) as applied to the production history from
wells KH1184 and KF 1638.
This figure shows the accuracy of the TDM. While TDM
results capture the trend of the monthly production for the
entire field the TDM model‟s match of the cumulative gas
production from this field is remarkably accurate. It should
Page 6
12 S.D. MOHAGHEGH, O. GRUIC, S. ZARGARI, A. KALANTARI & G. BROMHAL
also be noted existence of several outliers (monthly
production) in the production data has not adversely
impacted the results of TDM and the major production
trends have been detected and modelled.
Furthermore it must be noted that data shown in Figure 5 is
the result of summation of the TDM model results for
individual wells. In other words, TDM is trained, history
matched and validated at the well level and not for the field
as a whole. Upon completion of the modelling process, the
results of individual wells are summed in order to see the
model results for the entire field.
To demonstrate the results of TDM for the individual wells
two examples are presented in Figure 6. This figure shows
the results of TDM model training and history matching
(blind portion of history matching is shown in different
color) for two wells, namely well KF1184 and KF1638
(both monthly production and cumulative production).
These figures demonstrate the predictive capability of TDM
in Lower Huron Shale.
As demonstrated in the flow chart of Figure 1, TDM
includes a design module. The objective of the design
module is to assist engineers in performing reservoir
management tasks such as identifying which portion of the
reservoir has been depleted. By identifying reservoir
depletion as a function of time (which is a reflection of
pressure draw down in the field) and by cross referencing
that with the original hydrocarbon in place, an indication of
remaining reserves in the field (as a function of time and
well placement) will emerge.
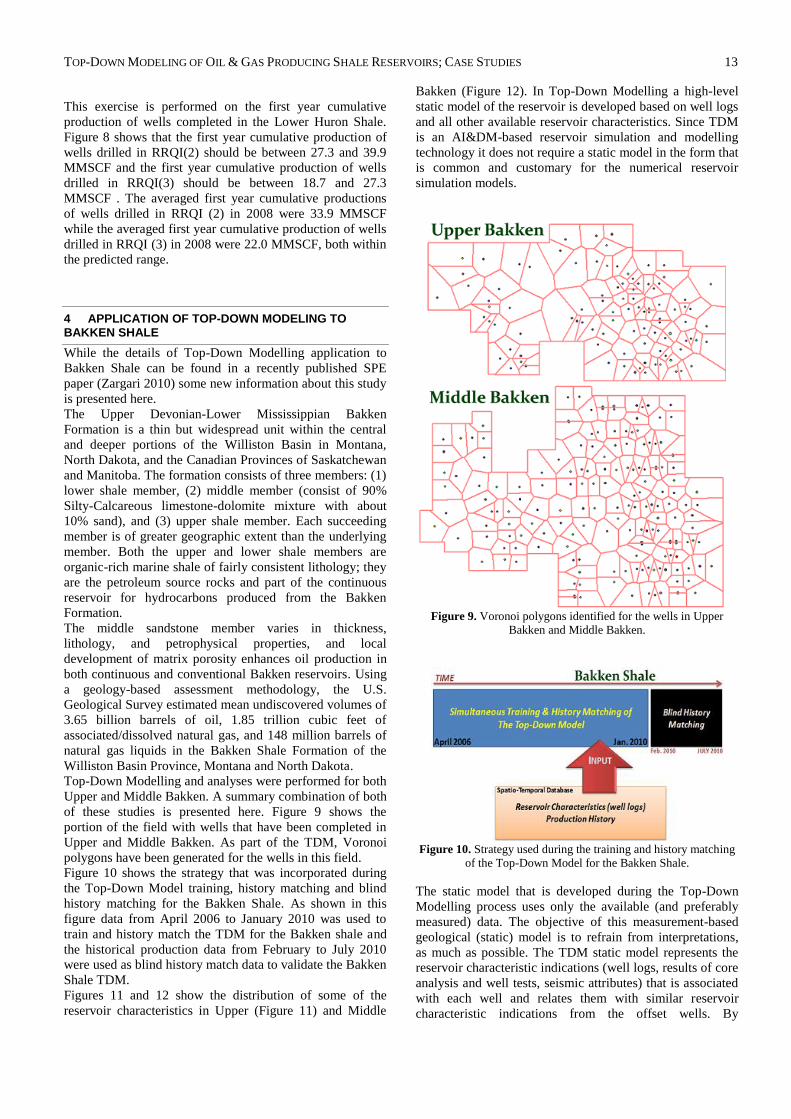
TDM design tool uses Fuzzy Pattern Recognition in order to
identify the portions of the shale formation that has
contributed the most to the production during the first three
month, 3, 5 and 10 years as shown in Figure 7. Details of
this Fuzzy Pattern Recognition process has been covered in
several previously published papers (Gomez 2009 –
Kalantari 2009 – Kalantari 2010 – Mata 2007 – Mohaghegh
2009c). In this figure the reservoir is delineated into several
RRQIs (Relative Reservoir Quality Index) shown in
different colors. The portion of the reservoir that is shown
with the darkest color represents RRQI of 1. This is the
portion of the reservoir that has made the largest
contribution to production followed by RRQI 2, 3, and 4.
The colors of other RRQIs gradually get lighter until the
region for RRQI 5 become almost white.
The contribution of the delineated RRQIs to production is
calculated taking into account the number of wells that are
included in each of the RRQIs. Furthermore, these regions
refer to depletion in the shale formation since locations that
have the highest amount of production are, relatively
speaking, the most depleted parts of the reservoir. For
example RRQI 1 is shown with dark red (almost black)
color in this figure. This region is small in the 3 months
FPR map (top-left) and increases in size as a function of
time until it occupies a much larger region in 120 months
FPR map (bottom-right). This change in size of RRQI 1
corresponds to an increase in contribution of north and
south central parts of the reservoir to production as a
function of time (since depletion is obviously a time
dependent variable). Cross referencing these maps with
similar maps that are developed (as part of this modeling
technology) for remaining reserves can aid engineers in
identifying the best infill locations in this asset. If
permeability values are available for a given asset they also
play a role in identifying optimum infill locations. It goes
without saying that the optimum infill location (relatively
speaking) is where the depletion is at minimum, remaining
reserve is at maximum, and there is good permeability.
Figure 7 shows that in this field the central part is the most
depleted portion of the reservoir with more depletion shown
in the north and south parts of the field. Furthermore, it
shows that as time progresses the most depleted central
portion of the reservoir expands toward east and west.
Figure 7. Results of the TDM‟s Fuzzy Pattern Recognition
showing reservoir depletion as a function of time.
The design tool in the Top-Down Modeling that is powered
by Fuzzy Pattern Recognition technology is used to support
reservoir management decisions such as identifying infill
locations in the field.
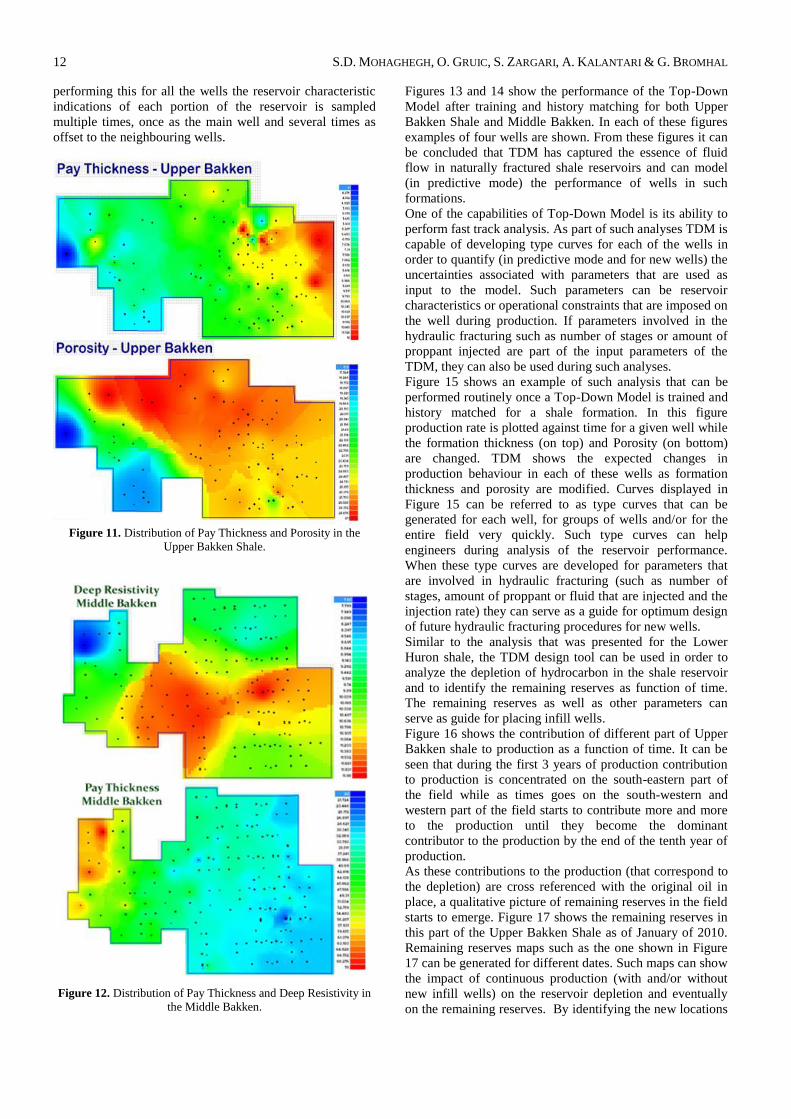
For instance, in order to calibrate the location of the
reservoir quality separator lines in Figure 7 the latest drilled
wells in the field (wells drilled in 2008) are removed from
the analysis and the reservoir delineations is performed
using wells prior to 2008. Then the production indicator for
the wells that are drilled in 2008 are compared with the
RRQI that they are located in to find out if the pattern
recognition analysis (reservoir delineation into different
RRQIs) is valid.
Figure 8. Testing the validity of identified RRQIs in Lower Huron
Shale.
Page 7
TOP-DOWN MODELING OF OIL & GAS PRODUCING SHALE RESERVOIRS; CASE STUDIES 13
This exercise is performed on the first year cumulative
production of wells completed in the Lower Huron Shale.
Figure 8 shows that the first year cumulative production of
wells drilled in RRQI(2) should be between 27.3 and 39.9
MMSCF and the first year cumulative production of wells
drilled in RRQI(3) should be between 18.7 and 27.3
MMSCF . The averaged first year cumulative productions
of wells drilled in RRQI (2) in 2008 were 33.9 MMSCF
while the averaged first year cumulative production of wells
drilled in RRQI (3) in 2008 were 22.0 MMSCF, both within
the predicted range.
4 APPLICATION OF TOP-DOWN MODELING TO BAKKEN SHALE
While the details of Top-Down Modelling application to
Bakken Shale can be found in a recently published SPE
paper (Zargari 2010) some new information about this study
is presented here.
The Upper Devonian-Lower Mississippian Bakken
Formation is a thin but widespread unit within the central
and deeper portions of the Williston Basin in Montana,
North Dakota, and the Canadian Provinces of Saskatchewan
and Manitoba. The formation consists of three members: (1)
lower shale member, (2) middle member (consist of 90%
Silty-Calcareous limestone-dolomite mixture with about
10% sand), and (3) upper shale member. Each succeeding
member is of greater geographic extent than the underlying
member. Both the upper and lower shale members are
organic-rich marine shale of fairly consistent lithology; they
are the petroleum source rocks and part of the continuous
reservoir for hydrocarbons produced from the Bakken
Formation.
The middle sandstone member varies in thickness,
lithology, and petrophysical properties, and local
development of matrix porosity enhances oil production in
both continuous and conventional Bakken reservoirs. Using
a geology-based assessment methodology, the U.S.
Geological Survey estimated mean undiscovered volumes of
3.65 billion barrels of oil, 1.85 trillion cubic feet of
associated/dissolved natural gas, and 148 million barrels of
natural gas liquids in the Bakken Shale Formation of the
Williston Basin Province, Montana and North Dakota.
Top-Down Modelling and analyses were performed for both
Upper and Middle Bakken. A summary combination of both
of these studies is presented here. Figure 9 shows the
portion of the field with wells that have been completed in
Upper and Middle Bakken. As part of the TDM, Voronoi
polygons have been generated for the wells in this field.
Figure 10 shows the strategy that was incorporated during
the Top-Down Model training, history matching and blind
history matching for the Bakken Shale. As shown in this
figure data from April 2006 to January 2010 was used to
train and history match the TDM for the Bakken shale and
the historical production data from February to July 2010
were used as blind history match data to validate the Bakken
Shale TDM.
Figures 11 and 12 show the distribution of some of the
reservoir characteristics in Upper (Figure 11) and Middle
Bakken (Figure 12). In Top-Down Modelling a high-level
static model of the reservoir is developed based on well logs
and all other available reservoir characteristics. Since TDM
is an AI&DM-based reservoir simulation and modelling
technology it does not require a static model in the form that
is common and customary for the numerical reservoir
simulation models.
Figure 9. Voronoi polygons identified for the wells in Upper
Bakken and Middle Bakken.
Figure 10. Strategy used during the training and history matching
of the Top-Down Model for the Bakken Shale.
The static model that is developed during the Top-Down
Modelling process uses only the available (and preferably
measured) data. The objective of this measurement-based
geological (static) model is to refrain from interpretations,
as much as possible. The TDM static model represents the
reservoir characteristic indications (well logs, results of core
analysis and well tests, seismic attributes) that is associated
with each well and relates them with similar reservoir
characteristic indications from the offset wells. By
Page 8
12 S.D. MOHAGHEGH, O. GRUIC, S. ZARGARI, A. KALANTARI & G. BROMHAL
performing this for all the wells the reservoir characteristic
indications of each portion of the reservoir is sampled
multiple times, once as the main well and several times as
offset to the neighbouring wells.
Figure 11. Distribution of Pay Thickness and Porosity in the
Upper Bakken Shale.
Figure 12. Distribution of Pay Thickness and Deep Resistivity in
the Middle Bakken.
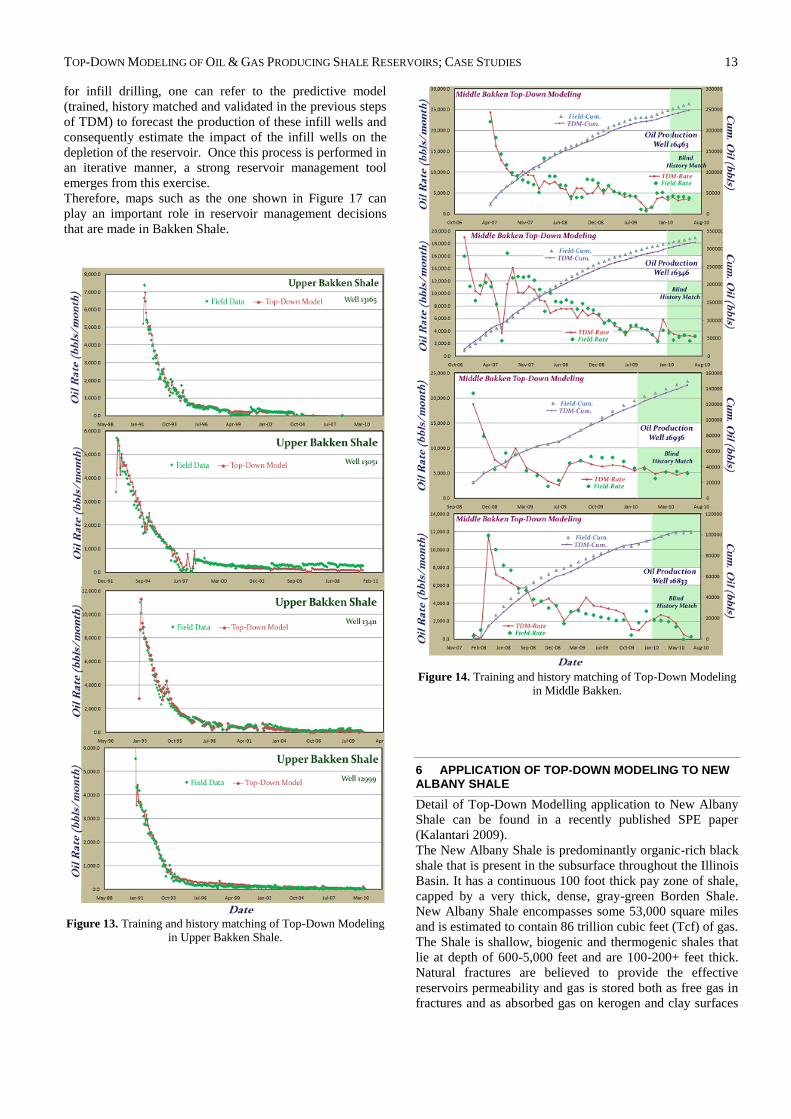
Figures 13 and 14 show the performance of the Top-Down
Model after training and history matching for both Upper
Bakken Shale and Middle Bakken. In each of these figures
examples of four wells are shown. From these figures it can
be concluded that TDM has captured the essence of fluid
flow in naturally fractured shale reservoirs and can model
(in predictive mode) the performance of wells in such
formations.
One of the capabilities of Top-Down Model is its ability to
perform fast track analysis. As part of such analyses TDM is
capable of developing type curves for each of the wells in
order to quantify (in predictive mode and for new wells) the
uncertainties associated with parameters that are used as
input to the model. Such parameters can be reservoir
characteristics or operational constraints that are imposed on
the well during production. If parameters involved in the
hydraulic fracturing such as number of stages or amount of
proppant injected are part of the input parameters of the
TDM, they can also be used during such analyses.
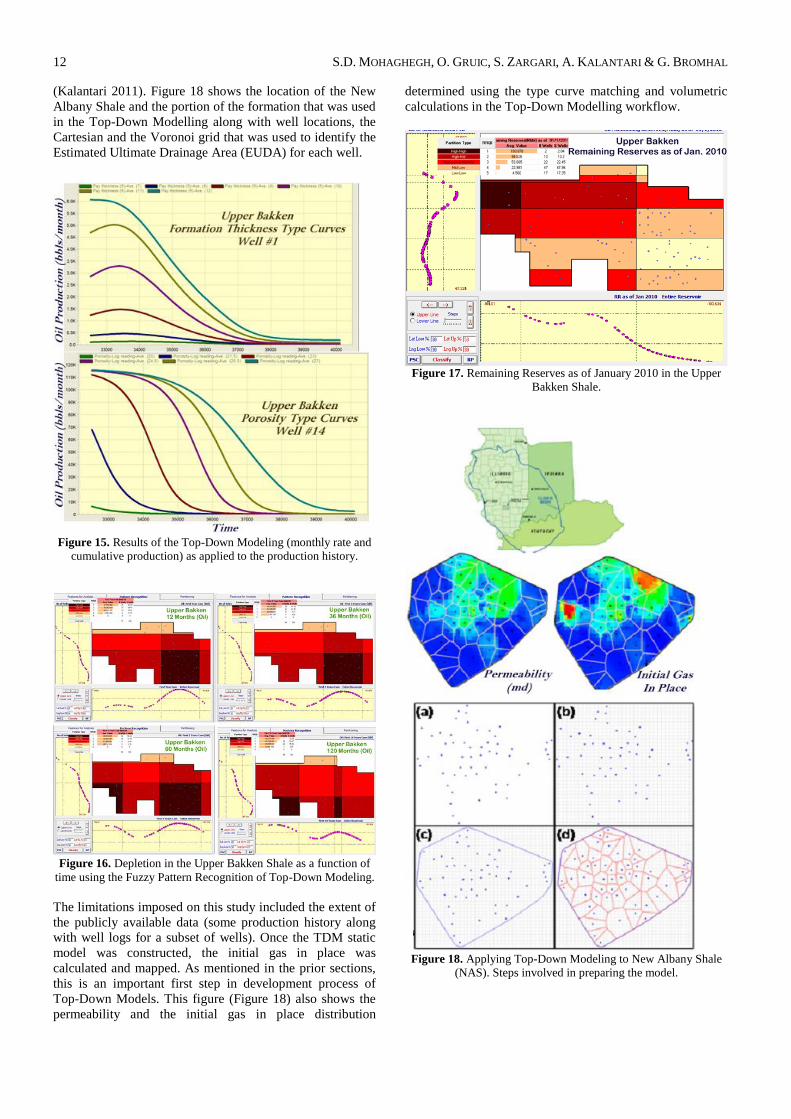
Figure 15 shows an example of such analysis that can be
performed routinely once a Top-Down Model is trained and
history matched for a shale formation. In this figure
production rate is plotted against time for a given well while
the formation thickness (on top) and Porosity (on bottom)
are changed. TDM shows the expected changes in
production behaviour in each of these wells as formation
thickness and porosity are modified. Curves displayed in
Figure 15 can be referred to as type curves that can be
generated for each well, for groups of wells and/or for the
entire field very quickly. Such type curves can help
engineers during analysis of the reservoir performance.
When these type curves are developed for parameters that
are involved in hydraulic fracturing (such as number of
stages, amount of proppant or fluid that are injected and the
injection rate) they can serve as a guide for optimum design
of future hydraulic fracturing procedures for new wells.
Similar to the analysis that was presented for the Lower
Huron shale, the TDM design tool can be used in order to
analyze the depletion of hydrocarbon in the shale reservoir
and to identify the remaining reserves as function of time.
The remaining reserves as well as other parameters can
serve as guide for placing infill wells.
Figure 16 shows the contribution of different part of Upper
Bakken shale to production as a function of time. It can be
seen that during the first 3 years of production contribution
to production is concentrated on the south-eastern part of
the field while as times goes on the south-western and
western part of the field starts to contribute more and more
to the production until they become the dominant
contributor to the production by the end of the tenth year of
production.
As these contributions to the production (that correspond to
the depletion) are cross referenced with the original oil in
place, a qualitative picture of remaining reserves in the field
starts to emerge. Figure 17 shows the remaining reserves in
this part of the Upper Bakken Shale as of January of 2010.
Remaining reserves maps such as the one shown in Figure
17 can be generated for different dates. Such maps can show
the impact of continuous production (with and/or without
new infill wells) on the reservoir depletion and eventually
on the remaining reserves. By identifying the new locations
Page 9
TOP-DOWN MODELING OF OIL & GAS PRODUCING SHALE RESERVOIRS; CASE STUDIES 13
for infill drilling, one can refer to the predictive model
(trained, history matched and validated in the previous steps
of TDM) to forecast the production of these infill wells and
consequently estimate the impact of the infill wells on the
depletion of the reservoir. Once this process is performed in
an iterative manner, a strong reservoir management tool
emerges from this exercise.
Therefore, maps such as the one shown in Figure 17 can
play an important role in reservoir management decisions
that are made in Bakken Shale.
Figure 13. Training and history matching of Top-Down Modeling
in Upper Bakken Shale.
Figure 14. Training and history matching of Top-Down Modeling
in Middle Bakken.
6 APPLICATION OF TOP-DOWN MODELING TO NEW ALBANY SHALE
Detail of Top-Down Modelling application to New Albany
Shale can be found in a recently published SPE paper
(Kalantari 2009).
The New Albany Shale is predominantly organic-rich black
shale that is present in the subsurface throughout the Illinois
Basin. It has a continuous 100 foot thick pay zone of shale,
capped by a very thick, dense, gray-green Borden Shale.
New Albany Shale encompasses some 53,000 square miles
and is estimated to contain 86 trillion cubic feet (Tcf) of gas.
The Shale is shallow, biogenic and thermogenic shales that
lie at depth of 600-5,000 feet and are 100-200+ feet thick.
Natural fractures are believed to provide the effective
reservoirs permeability and gas is stored both as free gas in
fractures and as absorbed gas on kerogen and clay surfaces
Page 10
12 S.D. MOHAGHEGH, O. GRUIC, S. ZARGARI, A. KALANTARI & G. BROMHAL
(Kalantari 2011). Figure 18 shows the location of the New
Albany Shale and the portion of the formation that was used
in the Top-Down Modelling along with well locations, the
Cartesian and the Voronoi grid that was used to identify the
Estimated Ultimate Drainage Area (EUDA) for each well.
Figure 15. Results of the Top-Down Modeling (monthly rate and
cumulative production) as applied to the production history.
Figure 16. Depletion in the Upper Bakken Shale as a function of
time using the Fuzzy Pattern Recognition of Top-Down Modeling.
The limitations imposed on this study included the extent of
the publicly available data (some production history along
with well logs for a subset of wells). Once the TDM static
model was constructed, the initial gas in place was
calculated and mapped. As mentioned in the prior sections,
this is an important first step in development process of
Top-Down Models. This figure (Figure 18) also shows the
permeability and the initial gas in place distribution
determined using the type curve matching and volumetric
calculations in the Top-Down Modelling workflow.
Figure 17. Remaining Reserves as of January 2010 in the Upper
Bakken Shale.
Figure 18. Applying Top-Down Modeling to New Albany Shale
(NAS). Steps involved in preparing the model.
Page 11
TOP-DOWN MODELING OF OIL & GAS PRODUCING SHALE RESERVOIRS; CASE STUDIES 13
The permeability distribution in this part of New Albany
Shale was calculated using a history matching process that
involved dynamic modelling of the production from some of
the wells using a stochastic discrete fracture network model.
Details of this procedure have been covered in a previously
published SPE paper (Kalantari 2009).
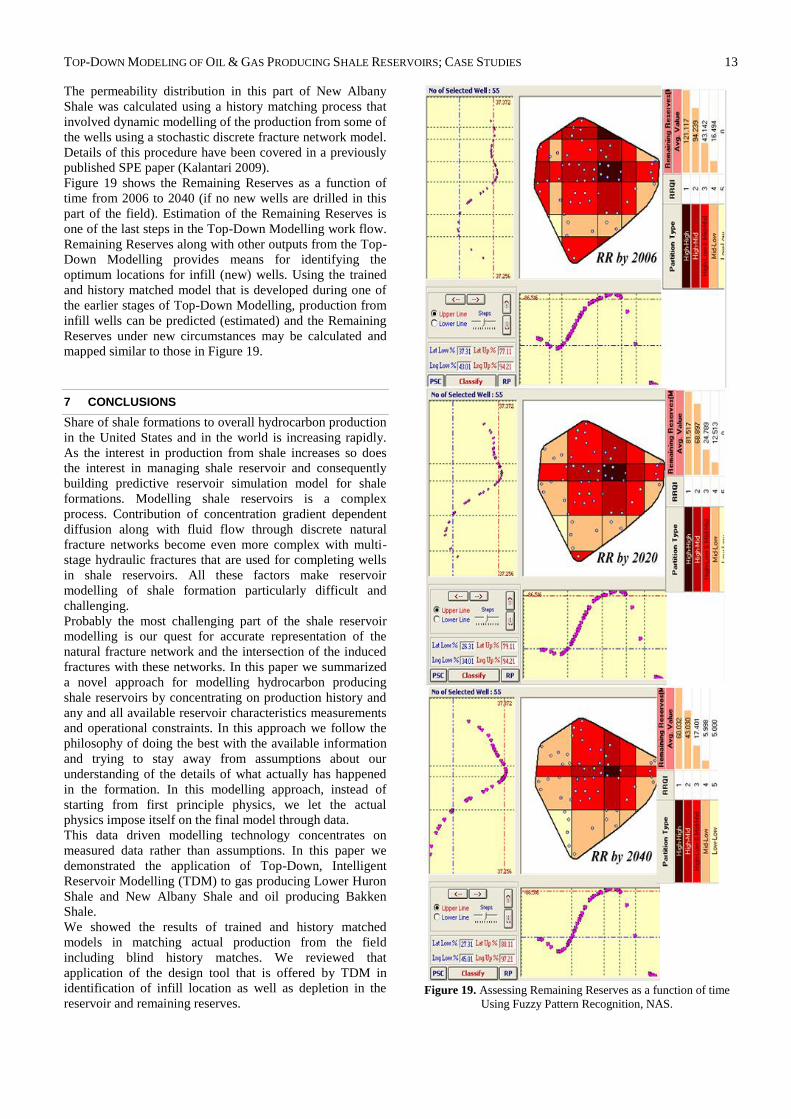
Figure 19 shows the Remaining Reserves as a function of
time from 2006 to 2040 (if no new wells are drilled in this
part of the field). Estimation of the Remaining Reserves is
one of the last steps in the Top-Down Modelling work flow.
Remaining Reserves along with other outputs from the Top-
Down Modelling provides means for identifying the
optimum locations for infill (new) wells. Using the trained
and history matched model that is developed during one of
the earlier stages of Top-Down Modelling, production from
infill wells can be predicted (estimated) and the Remaining
Reserves under new circumstances may be calculated and
mapped similar to those in Figure 19.
7 CONCLUSIONS
Share of shale formations to overall hydrocarbon production
in the United States and in the world is increasing rapidly.
As the interest in production from shale increases so does
the interest in managing shale reservoir and consequently
building predictive reservoir simulation model for shale
formations. Modelling shale reservoirs is a complex
process. Contribution of concentration gradient dependent
diffusion along with fluid flow through discrete natural
fracture networks become even more complex with multi-
stage hydraulic fractures that are used for completing wells
in shale reservoirs. All these factors make reservoir
modelling of shale formation particularly difficult and
challenging.
Probably the most challenging part of the shale reservoir
modelling is our quest for accurate representation of the
natural fracture network and the intersection of the induced
fractures with these networks. In this paper we summarized
a novel approach for modelling hydrocarbon producing
shale reservoirs by concentrating on production history and
any and all available reservoir characteristics measurements
and operational constraints. In this approach we follow the
philosophy of doing the best with the available information
and trying to stay away from assumptions about our
understanding of the details of what actually has happened
in the formation. In this modelling approach, instead of
starting from first principle physics, we let the actual
physics impose itself on the final model through data.
This data driven modelling technology concentrates on
measured data rather than assumptions. In this paper we
demonstrated the application of Top-Down, Intelligent
Reservoir Modelling (TDM) to gas producing Lower Huron
Shale and New Albany Shale and oil producing Bakken
Shale.
We showed the results of trained and history matched
models in matching actual production from the field
including blind history matches. We reviewed that
application of the design tool that is offered by TDM in
identification of infill location as well as depletion in the
reservoir and remaining reserves.
Figure 19. Assessing Remaining Reserves as a function of time
Using Fuzzy Pattern Recognition, NAS.
Page 12
12 S.D. MOHAGHEGH, O. GRUIC, S. ZARGARI, A. KALANTARI & G. BROMHAL
Top-Down, Intelligent Reservoir Modelling (TDM) is a
technically viable alternative to numerical reservoir
simulation that can be performed at a fraction of the cost
and man power in order to help engineers and geoscientists
learn more about shale formations and try to manage such
reservoirs.
8 ACKNOWLEDGEMENTS
Authors would like to acknowledge and thank U.S.
Department of Energy and National Energy Technology
Laboratory (NETL) through their RUA program, Gas
Technology Institute and Research Partnership to Secure
Energy for America (RPSEA) for their support of
application of Top-Down Modelling to shale formation in
the United States.
10 REFERENCES
Gaskari, S., Mohaghegh, S.D. and Jalali, J. 2007 “An Integrated
Technique for Production Data Analysis (PDA) with
Application to Mature Fields”. SPE Production and Operations
Journal, November 2007, Volume 22, Number 4, pp 403-416.
Gomez, Y., Khazaeni, Y., Mohaghegh, S.D., and Gaskari, R. 2009
"Top-Down Intelligent Reservoir Modeling (TDIRM)". SPE
124204, Proceedings, 2009 SPE Annual Conference &
Exhibition. New Orleans, Louisiana.
Grujic, O., Mohaghegh, S.D. and Bromhal, G. 2010 “Fast Track
Reservoir Modeling of Shale Formations in the Appalachian
Basin. Application to Lower Huron Shale in Eastern
Kentucky”. SPE 139101. Proceedings 2010 SPE Eastern
Regional Conference & Exhibition. 12-14 October 2010.
Morgantown, West Virginia.
Kalantari-Dahaghi, A.M., Mohaghegh, S.D. 2009 "Top-Down
Intelligent Reservoir Modeling of New Albany Shale". SPE
125859, Proceedings, 2009 SPE Eastern Regional Conference
& Exhibition. Charleston, West Virginia.
Kalantari-Dahaghi, A.M., Mohaghegh, S.D. and Khazaeni, Y.
2010 "New Insight into Integrated Reservoir Management
using Top-Down, Intelligent Reservoir Modeling Technique;
Application to a Giant and Complex Oil Field in the Middle
East". SPE 132621, Proceedings, 2010 SPE Western Regional
Conference & Exhibition. 27-29 May 2010. Anaheim,
California.
Kalantari-Dahaghi, A.M., Mohaghegh, S.D. “A New Practical
Approach in Modeling and Simulation of Shale Gas
Reservoirs: Application to New Albany Shale”. International
Journal of Oil, Gas and Coal Technology, Volume 4, No. 2,
2011. pp 104-133.
Khazaeni, Y., Mohaghegh, S.D. 2010 “Intelligent Time Successive
Production Modeling”. SPE 132643. Proceedings 2010 SPE
Western Regional Conference & Exhibition. 27-29 May 2010.
Anaheim, California.
Mata, D., Gaskari, R., Mohaghegh, S.D., 2007 "Field-Wide
Reservoir Characterization Based on a New Technique of
Production Data Analysis". SPE 111205, Proceedings, 2007
SPE Eastern Regional Conference & Exhibition. 17-19
October 2007. Lexington, Kentucky.
Mohaghegh, S.D. 2008 “Building the Foundation for Prudhoe Bay
Oil Production Optimization Using Neural Networks”.
International Journal of Oil, Gas and Coal Technology,
January 2008, Volume 1, Numbers 1&2. pp 65 - 80.
Mohaghegh, S.D. 2009a “Development of Surrogate Reservoir
Model (SRM) for Fast Track Analysis of a Complex
Reservoir”. International Journal of Oil, Gas and Coal
Technology, February 2009, Volume 2, Number 1. pp 2-23.
Mohaghegh, S.D. 2009b “An Intelligent System‟s Approach for
Revitalization of Brown Fields Using Only Production Rate
Data”. International Journal of Engineering. February 2009,
Volume 22, Number 1, pp 89-106.
Mohaghegh, S.D. 2009c "Top-Down Intelligent Reservoir
Modeling (TDIRM); A New Approach In Reservoir Modeling
By Integrating Classic Reservoir Engineering With Artificial
Intelligence & Data Mining Techniques". AAPG 2009 Annual
Convention and Exhibition. June 7-10, 2009. Denver,
Colorado.
Mohaghegh, S.D. 2011 "Reservoir Simulation and Modeling
Based on Pattern Recognition”. SPE 143179, SPE Digital
Energy Conference, The Woodlands, Texas, April 19-21,
2011.
Zargari, S., Mohaghegh, S.D. and Bromhal, G. 2010 “Field
Development Strategies for Bakken Shale Formation”. SPE
139032. Proceedings 2010 SPE Eastern Regional Conference
& Exhibition. 12-14 October 2010. Morgantown, West
Virginia.


![Short Communication Reservoir Performance Assessment Based ...€¦ · Reservoir Performance Assessment Based on Intelligent Well Technology ... applications in water flooding [6],](https://static.documents.pub/doc/80x56/5ebaf58ade91f4324e38a44b/short-communication-reservoir-performance-assessment-based-reservoir-performance.jpg)


