doi:10.1152/jn.00338.2014 113:1063-1076, 2015. First published 19 November 2014;J NeurophysiolVictor A. F. Lamme and Tobias H. DonnerNiels A. Kloosterman, Thomas Meindertsma, Arjan Hillebrand, Bob W. van Dijk,the stability of a perceptual illusionTop-down modulation in human visual cortex predicts
You might find this additional info useful...
78 articles, 25 of which can be accessed free at:This article cites /content/113/4/1063.full.html#ref-list-1
including high resolution figures, can be found at:Updated information and services /content/113/4/1063.full.html
can be found at:Journal of Neurophysiologyabout Additional material and information http://www.the-aps.org/publications/jn
This information is current as of February 27, 2015.
Top-down modulation in human visual cortex predicts the stability of aperceptual illusion
Niels A. Kloosterman,1,2 Thomas Meindertsma,1,3 Arjan Hillebrand,4 Bob W. van Dijk,5,6
Victor A. F. Lamme,1,2 and Tobias H. Donner1,2,7
1Department of Psychology, University of Amsterdam, Amsterdam, The Netherlands; 2Amsterdam Center for Brain andCognition, Institute for Interdisciplinary Studies, University of Amsterdam, Amsterdam, The Netherlands; 3Department ofNeurophysiology and Pathophysiology, University Medical Center Hamburg-Eppendorf, Hamburg, Germany; 4Department ofClinical Neurophysiology and Magnetoencephalography Center, Neuroscience Campus Amsterdam, VU University MedicalCenter, Amsterdam, The Netherlands; 5Department of Physics and Medical Technology, VU University Medical Center,Amsterdam, The Netherlands; 6Faculty of Movement Sciences, VU University, Amsterdam, The Netherlands; and 7BernsteinCenter for Computational Neuroscience, Charité-Universitätsmedizin, Berlin, Germany
Submitted 5 May 2014; accepted in final form 17 November 2014
Kloosterman NA, Meindertsma T, Hillebrand A, van Dijk BW,Lamme VA, Donner TH. Top-down modulation in human visualcortex predicts the stability of a perceptual illusion. J Neurophy-siol 113: 1063–1076, 2015. First published November 19, 2014;doi:10.1152/jn.00338.2014.—Conscious perception sometimes fluc-tuates strongly, even when the sensory input is constant. For example,in motion-induced blindness (MIB), a salient visual target surroundedby a moving pattern suddenly disappears from perception, only toreappear after some variable time. Whereas such changes of percep-tion result from fluctuations of neural activity, mounting evidencesuggests that the perceptual changes, in turn, may also cause modu-lations of activity in several brain areas, including visual cortex. Inthis study, we asked whether these latter modulations might affect thesubsequent dynamics of perception. We used magnetoencephalogra-phy (MEG) to measure modulations in cortical population activityduring MIB. We observed a transient, retinotopically widespreadmodulation of beta (12–30 Hz)-frequency power over visual cortexthat was closely linked to the time of subjects’ behavioral report of thetarget disappearance. This beta modulation was a top-down signal,decoupled from both the physical stimulus properties and the motorresponse but contingent on the behavioral relevance of the perceptualchange. Critically, the modulation amplitude predicted the duration ofthe subsequent target disappearance. We propose that the transforma-tion of the perceptual change into a report triggers a top-downmechanism that stabilizes the newly selected perceptual interpretation.
WHEN THE SENSORY INPUT to the brain is ambiguous, perceptionoften changes spontaneously, followed by periods of stableperception, a phenomenon called multistable perception (Blakeand Logothetis 2002; Deco and Romo, 2008; Leopold andLogothetis 1999; Sterzer et al. 2009). For example, in anillusion dubbed “motion-induced blindness” (MIB), a salientvisual target surrounded by a rotating mask suddenly disap-pears from perception for some time (see Fig. 1A) (Bonneh etal. 2001; Bonneh and Donner 2011). A hallmark of these MIBdisappearances (as well as of other multistable illusions) is thatthe duration of each percept varies widely and unpredictablyfrom one perceptual change to the next (see Fig. 1B). Intrigu-
ingly, the statistics of these perceptual dynamics correlate tothe dynamics of thought and exploratory decision-making(Leopold and Logothetis 1999; Carter and Pettigrew 2003).
Studies of the neural basis of multistable perception havereported transient modulations of activity during the perceptualswitches, in visual cortex (Donner et al. 2008; Haynes et al.2005; Lee et al. 2007; Leopold and Logothetis 1996; Polonskyet al. 2000; Tong and Engel 2001) as well as parietal andfrontal association cortex (Britz et al. 2011; Knapen et al. 2011;Lumer et al. 1998; Sterzer and Kleinschmidt 2007; Zaretskayaet al. 2010). Some of the switch-related modulations of corticalactivity appear to precede the switches and are absent whenswitches are evoked by the physical stimulus, in line with acausal role in prompting the switch (Britz et al. 2009; Donneret al. 2008; Lumer et al. 1998; Sterzer and Kleinschmidt 2007).Others, however, occur later in time and irrespective ofwhether the perceptual switches emerge spontaneously or areevoked by a stimulus change (Donner et al. 2008; Frassle et al.2014; Knapen et al. 2011). Specifically, functional magneticresonance imaging (fMRI) studies of MIB have identified aretinotopically widespread modulation in early visual cortex,which is decoupled from the cortical target representation(Donner et al. 2008, 2013; Hsieh and Tse 2009). This modu-lation is contingent on the behavioral report of target disap-pearance and absent during passive viewing (Donner et al.2008).
In the present study, we used whole head magnetoencepha-lography (MEG) recordings (Hamalainen et al. 1993) duringMIB to 1) characterize the electrophysiological signatures ofthe report-related transient modulations in visual cortex iden-tified with fMRI, and 2) to test whether they might shape thesubsequent perceptual dynamics. Subjects’ reports of percep-tual switches were accompanied by a transient modulation ofbeta-band (12–30 Hz) activity over visual cortex, which wasdecoupled from both the stimulus properties and motor re-sponse but strongly linked to the behavioral relevance of targetdisappearance. The amplitude of this modulation predicted (inthe case of MIB) the duration of the subsequent illusory targetdisappearance. We propose that behaviorally relevant changesof perception trigger an active top-down mechanism that sta-bilizes the internal state of visual cortex as well as perceptualsuppression.
Address for reprint requests and other correspondence: N. Kloosterman,Dept. of Psychology, Univ. of Amsterdam, Weesperplein 4, 1018 XA Am-sterdam, The Netherlands (e-mail: [email protected]).
J Neurophysiol 113: 1063–1076, 2015.First published November 19, 2014; doi:10.1152/jn.00338.2014.
We report data from two MEG experiments: a main experiment anda control experiment including high-resolution eye tracking to test fora dependence of the effects reported in this paper on microsaccades.
Main Experiment
Subjects. MEG data were acquired at the VU University MedicalCenter (Amsterdam) from 11 healthy subjects with normal or corrected-to-normal vision (4 women, age range: 23–37 yr). The experiment wasapproved by the local ethics committee, and each subject gave writteninformed consent. Each subject participated in several MEG sessionson different days of about 2-h duration each.
Stimulus. The target was a salient yellow disc (full contrast,diameter: 0.12° or 0.2° of visual angle) surrounded by a moving mask(square, equally spaced grid of 9 � 9 blue crosses, 17° width/length),both superimposed on a black background and centered on a fixationmark (red outline, white inside, 0.8° width and length) (Fig. 1A). Thetarget was located on one of the four visual field diagonals at aneccentricity of 3°. Target size and location (visual field quadrant) wereindividually selected for each subject before MEG, to yield a percent-age of target invisible time of at least 20%. The mask rotated aroundthe fixation square (speed: 120°/s). The target was separated from themask by a black “protection zone” subtending about 2° around thetarget (Bonneh et al. 2001).
Stimuli were presented using Presentation software (NeuroBehavioralSystems, Albany, CA) and projected via two mirrors onto the ceiling ofthe MEG scanner room by a liquid crystal display (LCD) projector(BarcoData 8200 LC; Barco Projection Systems, Kuurne, Belgium)with a pixel resolution of 800 � 600 and a 60-Hz refresh rate.Subjects were supine and viewed the stimuli projected onto the ceilingof the MEG room (field of view: 18° � 23°).
Behavioral tasks and design. All subjects participated in varioustasks designed to 1) determine the factors driving transient modula-tions of cortical activity around reports of perceptual switches and 2)identify the impact of these transient modulations on subsequentneural activity and perception.
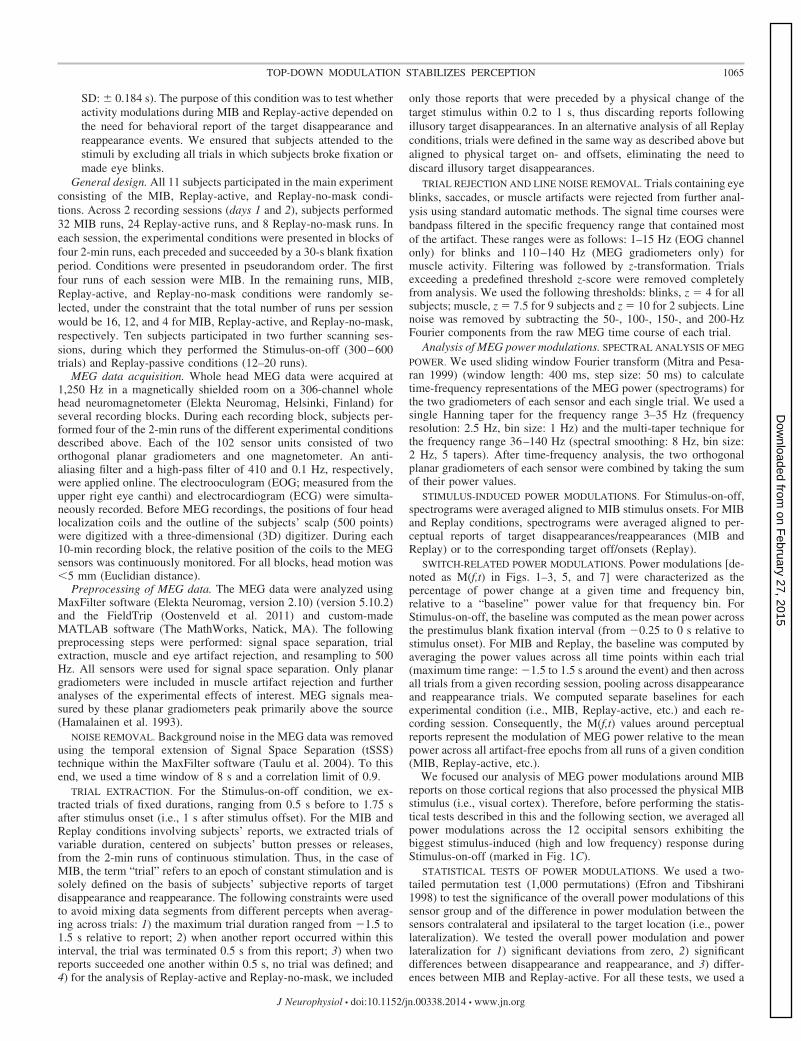
STIMULUS-ON-OFF CONDITION. On each trial, the complete MIBstimulus (target, mask, and fixation mark) was presented for 0.75 s,preceded and succeeded by fixation of an otherwise black screen. Thisstimulus duration was too short to induce MIB target disappearancebut sufficiently long to measure the stimulus-induced modulation ofcortical population activity (Fig. 1C). The subjects’ task was tomaintain stable fixation and passively view the stimulus.
MIB CONDITION. The MIB stimulus was continuously presented forseveral runs of 2-min duration each. The subjects’ task was tomaintain stable fixation and report the spontaneous disappearance andreappearance of the target by pressing or releasing a response buttonwith their index finger (left or right, counterbalanced across subjects).The mapping between perceptual switch and motor response was flippedbetween the 2 recording days (see Fig. 4A): button press for indicatingtarget disappearance (release for reappearance) on day 1, and buttonrelease for disappearance (press for reappearance) on day 2.
REPLAY CONDITIONS. In the three different Replay conditions, thetarget was physically removed from the screen in the same temporalsequence as it had previously disappeared during one of severalprevious MIB runs completed by the corresponding subject. Thephysical offsets and onsets of the target were always instantaneous,mimicking the typically abrupt quality of the perceptual switches inMIB for the small target used in this study. The general purpose of theReplay conditions was to test whether report-related, transient mod-ulations in cortical activity during MIB may have prompted thespontaneous perceptual switch (then they should be specific to MIB)or were driven by the perceptual switch (then they may also occurduring Replay-active). On the basis of previous fMRI results (Donneret al. 2008), we expected a retinotopically widespread modulation invisual cortex around behavioral report of target disappearance andreappearance, in both MIB and Replay.
• Replay-active: this condition was identical to MIB in all respectsexcept for the changes in the physical presence of the target.
• Replay-no-mask: this condition was identical to Replay-active,except that the target was presented without mask. The purposeof this condition was to test whether potential report-relatedmodulations during MIB and Replay-active may have reflected acontextual effect in the sensory processing of the mask stimulus:it is conceivable that the sensory processing of the mask differedbetween the (perceived or physical) presence and the (perceivedor physical) absence of the target. The Replay-no-mask conditionallowed us to differentiate between 1) contextual modulations ofthe sensory processing of the mask and 2) report-related, non-sensory modulations that were decoupled from the physical MIBstimulus: modulations should disappear during Replay-no-maskin the former case but should persist in the latter case.
• Replay-passive: this condition was identical to Replay-active,except that subjects did not report the target on- and offsets andthat target present and absent durations were drawn from Gauss-ian distributions (mean: 2.2 s for target on, 2 s for target off;
Target visibleTarget invisible
Percept duration (s)
Fra
ctio
n of
per
cept
s
2 4 60 8
0.05
0.1
0.15
0
A
BTargetMask
FixationPhysicalstimulus:
C
Stimulus:
Target:Mask:
Fixation:
0 0.5 1
10
20
30
Fre
quen
cy (
Hz)
50
75
100
125
M(f,t) (%)
10-10p < 0.05
Percept:
or
Time from stimulus onset (s)
n.s.
Fig. 1. Motion-induced blindness (MIB) stimulus, per-ceptual dynamics, and cortical stimulus response. A:schematic of the MIB illusion. Bottom, stimulus con-figuration. The small but salient target (yellow disc)was surrounded by a large moving mask (rotating bluegrid). The target was presented in different visual fieldquadrants for different subjects, at an eccentricity of3°. Top, alternating perception of the target. B: groupaverage frequency distributions of target invisible andtarget visible durations during magnetoencephalogra-phy (MEG; n � 11 subjects). Shaded areas indicateSE. C: cortical response to the MIB stimulus duringStimulus-on-off condition. Scalp maps show topogra-phy of 8- to 35-Hz and 60- to 90-Hz modulations(0.25–0.75 s after stimulus onset; see dashed outlineson time-frequency representations). Transparencylevel indicates clusters of significant modulation (P �0.05, 2-sided permutation test across subjects, cluster-corrected; n � 10 subjects). Highlighted symbols in-dicate MEG sensors showing the biggest stimulusresponse. These sensors are used for the subsequentanalyses of overall power modulations (triangles andsquares, sensors used for lateralization analyses; Fig.3). M(f,t), power modulation.
SD: � 0.184 s). The purpose of this condition was to test whetheractivity modulations during MIB and Replay-active depended onthe need for behavioral report of the target disappearance andreappearance events. We ensured that subjects attended to thestimuli by excluding all trials in which subjects broke fixation ormade eye blinks.
General design. All 11 subjects participated in the main experimentconsisting of the MIB, Replay-active, and Replay-no-mask condi-tions. Across 2 recording sessions (days 1 and 2), subjects performed32 MIB runs, 24 Replay-active runs, and 8 Replay-no-mask runs. Ineach session, the experimental conditions were presented in blocks offour 2-min runs, each preceded and succeeded by a 30-s blank fixationperiod. Conditions were presented in pseudorandom order. The firstfour runs of each session were MIB. In the remaining runs, MIB,Replay-active, and Replay-no-mask conditions were randomly se-lected, under the constraint that the total number of runs per sessionwould be 16, 12, and 4 for MIB, Replay-active, and Replay-no-mask,respectively. Ten subjects participated in two further scanning ses-sions, during which they performed the Stimulus-on-off (300–600trials) and Replay-passive conditions (12–20 runs).
MEG data acquisition. Whole head MEG data were acquired at1,250 Hz in a magnetically shielded room on a 306-channel wholehead neuromagnetometer (Elekta Neuromag, Helsinki, Finland) forseveral recording blocks. During each recording block, subjects per-formed four of the 2-min runs of the different experimental conditionsdescribed above. Each of the 102 sensor units consisted of twoorthogonal planar gradiometers and one magnetometer. An anti-aliasing filter and a high-pass filter of 410 and 0.1 Hz, respectively,were applied online. The electrooculogram (EOG; measured from theupper right eye canthi) and electrocardiogram (ECG) were simulta-neously recorded. Before MEG recordings, the positions of four headlocalization coils and the outline of the subjects’ scalp (500 points)were digitized with a three-dimensional (3D) digitizer. During each10-min recording block, the relative position of the coils to the MEGsensors was continuously monitored. For all blocks, head motion was�5 mm (Euclidian distance).
Preprocessing of MEG data. The MEG data were analyzed usingMaxFilter software (Elekta Neuromag, version 2.10) (version 5.10.2)and the FieldTrip (Oostenveld et al. 2011) and custom-madeMATLAB software (The MathWorks, Natick, MA). The followingpreprocessing steps were performed: signal space separation, trialextraction, muscle and eye artifact rejection, and resampling to 500Hz. All sensors were used for signal space separation. Only planargradiometers were included in muscle artifact rejection and furtheranalyses of the experimental effects of interest. MEG signals mea-sured by these planar gradiometers peak primarily above the source(Hamalainen et al. 1993).
NOISE REMOVAL. Background noise in the MEG data was removedusing the temporal extension of Signal Space Separation (tSSS)technique within the MaxFilter software (Taulu et al. 2004). To thisend, we used a time window of 8 s and a correlation limit of 0.9.
TRIAL EXTRACTION. For the Stimulus-on-off condition, we ex-tracted trials of fixed durations, ranging from 0.5 s before to 1.75 safter stimulus onset (i.e., 1 s after stimulus offset). For the MIB andReplay conditions involving subjects’ reports, we extracted trials ofvariable duration, centered on subjects’ button presses or releases,from the 2-min runs of continuous stimulation. Thus, in the case ofMIB, the term “trial” refers to an epoch of constant stimulation and issolely defined on the basis of subjects’ subjective reports of targetdisappearance and reappearance. The following constraints were usedto avoid mixing data segments from different percepts when averag-ing across trials: 1) the maximum trial duration ranged from �1.5 to1.5 s relative to report; 2) when another report occurred within thisinterval, the trial was terminated 0.5 s from this report; 3) when tworeports succeeded one another within 0.5 s, no trial was defined; and4) for the analysis of Replay-active and Replay-no-mask, we included
only those reports that were preceded by a physical change of thetarget stimulus within 0.2 to 1 s, thus discarding reports followingillusory target disappearances. In an alternative analysis of all Replayconditions, trials were defined in the same way as described above butaligned to physical target on- and offsets, eliminating the need todiscard illusory target disappearances.
TRIAL REJECTION AND LINE NOISE REMOVAL. Trials containing eyeblinks, saccades, or muscle artifacts were rejected from further anal-ysis using standard automatic methods. The signal time courses werebandpass filtered in the specific frequency range that contained mostof the artifact. These ranges were as follows: 1–15 Hz (EOG channelonly) for blinks and 110–140 Hz (MEG gradiometers only) formuscle activity. Filtering was followed by z-transformation. Trialsexceeding a predefined threshold z-score were removed completelyfrom analysis. We used the following thresholds: blinks, z � 4 for allsubjects; muscle, z � 7.5 for 9 subjects and z � 10 for 2 subjects. Linenoise was removed by subtracting the 50-, 100-, 150-, and 200-HzFourier components from the raw MEG time course of each trial.
Analysis of MEG power modulations. SPECTRAL ANALYSIS OF MEG
POWER. We used sliding window Fourier transform (Mitra and Pesa-ran 1999) (window length: 400 ms, step size: 50 ms) to calculatetime-frequency representations of the MEG power (spectrograms) forthe two gradiometers of each sensor and each single trial. We used asingle Hanning taper for the frequency range 3–35 Hz (frequencyresolution: 2.5 Hz, bin size: 1 Hz) and the multi-taper technique forthe frequency range 36–140 Hz (spectral smoothing: 8 Hz, bin size:2 Hz, 5 tapers). After time-frequency analysis, the two orthogonalplanar gradiometers of each sensor were combined by taking the sumof their power values.
STIMULUS-INDUCED POWER MODULATIONS. For Stimulus-on-off,spectrograms were averaged aligned to MIB stimulus onsets. For MIBand Replay conditions, spectrograms were averaged aligned to per-ceptual reports of target disappearances/reappearances (MIB andReplay) or to the corresponding target off/onsets (Replay).
SWITCH-RELATED POWER MODULATIONS. Power modulations [de-noted as M(f,t) in Figs. 1–3, 5, and 7] were characterized as thepercentage of power change at a given time and frequency bin,relative to a “baseline” power value for that frequency bin. ForStimulus-on-off, the baseline was computed as the mean power acrossthe prestimulus blank fixation interval (from �0.25 to 0 s relative tostimulus onset). For MIB and Replay, the baseline was computed byaveraging the power values across all time points within each trial(maximum time range: �1.5 to 1.5 s around the event) and then acrossall trials from a given recording session, pooling across disappearanceand reappearance trials. We computed separate baselines for eachexperimental condition (i.e., MIB, Replay-active, etc.) and each re-cording session. Consequently, the M(f,t) values around perceptualreports represent the modulation of MEG power relative to the meanpower across all artifact-free epochs from all runs of a given condition(MIB, Replay-active, etc.).
We focused our analysis of MEG power modulations around MIBreports on those cortical regions that also processed the physical MIBstimulus (i.e., visual cortex). Therefore, before performing the statis-tical tests described in this and the following section, we averaged allpower modulations across the 12 occipital sensors exhibiting thebiggest stimulus-induced (high and low frequency) response duringStimulus-on-off (marked in Fig. 1C).
STATISTICAL TESTS OF POWER MODULATIONS. We used a two-tailed permutation test (1,000 permutations) (Efron and Tibshirani1998) to test the significance of the overall power modulations of thissensor group and of the difference in power modulation between thesensors contralateral and ipsilateral to the target location (i.e., powerlateralization). We tested the overall power modulation and powerlateralization for 1) significant deviations from zero, 2) significantdifferences between disappearance and reappearance, and 3) differ-ences between MIB and Replay-active. For all these tests, we used a
cluster-based procedure (Oostenveld et al. 2011) to correct for mul-tiple comparisons. For time-frequency representations of power mod-ulations (see Figs. 1, 2, and 7), this was done across all time-frequencybins. Because the focus of the current study was on transient modu-lations of cortical activity around the perceptual switches, we aver-aged power modulations across the time window �0.3 to 0.3 s aroundreport (“transient” time window indicated by black bar in Fig. 2A) forall subsequent analyses before performing statistical tests (see Figs.3–7). For statistical tests of the spectra of transient power modulationsaround report (see Figs. 3–5 and 7), we performed the permutation testwith cluster-based multiple comparison correction across frequencybins. Because our focus was on the MIB illusion (with the Replayconditions as controls), we defined our frequency band for furtheranalyses on the basis of the significant cluster around disappearancereports during MIB (12–30 Hz; see Figs. 2A and 3A).
Correlation analysis. We intended to test whether the overallpower modulation in the beta band (12–30 Hz) that we observedduring the transient time window around subjects’ reports (�0.3 to0.3 s from report) predicted the duration (i.e., stability) of the percep-
tual suppression. To this end, we collapsed the single-trial powermodulation values across the transient time window around report andthe beta band. This yielded one scalar modulation value per trial.These scalar modulation values were then concatenated into a new(across trial) time series, which was submitted to piecewise lineardetrending to remove slow intrinsic dynamics from the cortical powerthat are unrelated to perceptual or cognitive processing (Donner et al.2009; Leopold et al. 2003). On the basis of the amplitude of thedetrended single-trial modulation values, we then grouped trials(within subjects) into 10 (or other numbers for control, see below)percentile bins (see Linkenkaer-Hansen et al. 2004 for an analogousprocedure).
Each trial was then associated with a transient beta-band modula-tion and with the duration of the preceding percept (target visible) andsucceeding percept (target invisible). After normalizing individualpercept durations by each subject’s median percept duration (sepa-rately for both percepts), we collapsed the normalized percept dura-tions per bin (based on transient beta modulation within subjects; seeabove) and, finally, computed the mean and normalized duration per
Mask:
Time from report (s)
Fre
quen
cy (
Hz)
10
20
30
−1 0 1
50
100
125 Transienttime window
75
−1 0 1 −1 0 1 −1 0 1 −1 0 1
Time from target offset (s)
Fre
quen
cy (
Hz)
10
20
30
50
100
125
75
Time from report (s)
10-10 10-10M(f,t) (%)p < 0.05 n.s.
Report:
Target:
Mask:
Time from report (s)−1 0 1 −1 0 1 −1 0 1 −1 0 1 −1 0 1
Time from target onset (s) Time from report (s)
Report:
Target:
Stimulus:
Stimulus:
A C DReplay-active
BReplay-passive MIB
EReplay-no-maskReplay-active
F H IG J
0.61 s
0.57 s
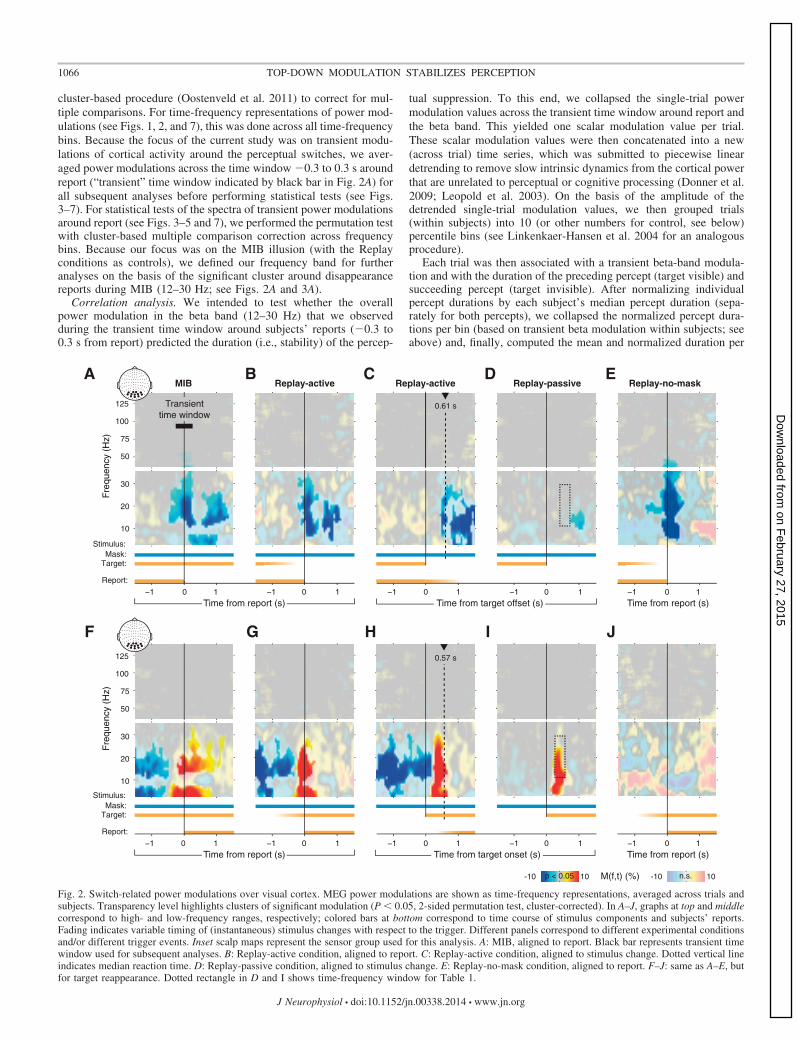
Fig. 2. Switch-related power modulations over visual cortex. MEG power modulations are shown as time-frequency representations, averaged across trials andsubjects. Transparency level highlights clusters of significant modulation (P � 0.05, 2-sided permutation test, cluster-corrected). In A–J, graphs at top and middlecorrespond to high- and low-frequency ranges, respectively; colored bars at bottom correspond to time course of stimulus components and subjects’ reports.Fading indicates variable timing of (instantaneous) stimulus changes with respect to the trigger. Different panels correspond to different experimental conditionsand/or different trigger events. Inset scalp maps represent the sensor group used for this analysis. A: MIB, aligned to report. Black bar represents transient timewindow used for subsequent analyses. B: Replay-active condition, aligned to report. C: Replay-active condition, aligned to stimulus change. Dotted vertical lineindicates median reaction time. D: Replay-passive condition, aligned to stimulus change. E: Replay-no-mask condition, aligned to report. F–J: same as A–E, butfor target reappearance. Dotted rectangle in D and I shows time-frequency window for Table 1.
bin across subjects. The normalization compensated for substantialinterindividual variability in the perceptual durations, thereby isolat-ing the trial-to-trial variability of percept durations. However, theresults reported in this article were qualitatively identical without thisnormalization (data not shown). We then correlated the bin ranknumber to normalized percept duration.
We used a permutation (shuffling) procedure (1,000 permutations)to test the significance of the correlations (Efron and Tibshirani 1998).Mapping the individual power modulation values into a commonrange of percentile bins before averaging them across subjects com-pensated for the interindividual variability in the power modulationvalues, which is caused by many factors other than neural activity(e.g., individual differences in head geometry and brain anatomy). Toassess the robustness of the observed correlations, we repeated theseanalyses for several different bin numbers (15, 30, and 60 bins).
A stabilizing effect of the transient beta-band modulation on theduration of perceptual suppression would predict 1) a significant andstrong correlation with the duration of the succeeding (target invisi-ble) percept during MIB, 2) no correlation with the duration of thepreceding (target visible) percept during MIB, and 3) no correlationwith the duration of the succeeding (target invisible) percept duringReplay, where the percept durations are largely determined by thephysical target on- and offsets. Thus we predicted significant differ-ences in the correlation coefficients for prediction 1 vs. prediction 2and for prediction 1 vs. prediction 3. To test for these two predicteddifferences in correlation, we again used a permutation procedure(1,000 permutations). Here, we permuted the labels (e.g., “preceding”vs. “succeeding”) of pairs of bin rank number and correspondingpercept durations.
Microsaccade Control Experiment
Subjects. MEG data and high-resolution (infrared) eye data weresimultaneously acquired at the Universitätsklinikum, Hamburg-Ep-pendorf, from 22 healthy subjects with normal or corrected-to-normalvision. The experiment was approved by the local ethics committee,and each subject gave written informed consent. One subject failed tocomplete the full experiment, and one subject had poor eye trackingdata quality. Both subjects were excluded. Thus 20 subjects (11women, age range: 20–54 yr) were included in the analysis.
Stimulus and behavioral task. The target was a full-contrast Gaborpatch (diameter: 2°, 2 cycles) surrounded by a rotating mask (17° �17° grid of white crosses), both superimposed on a gray backgroundand centered on a fixation mark (red outline, white inside, 0.8° widthand length) in the middle of the screen. The target was located ineither the lower left or lower right visual field quadrant (eccentricity:5°, counterbalanced between subjects). The mask rotated at a speed of160°/s and was separated from the target by a protection zone of 2°. Weused a Gabor target on a gray background in this experiment to eliminateany changes in perceived brightness during MIB for analyses of changesin pupil diameter that will be the focus of a separate report.
Stimuli were presented using Presentation software (NeuroBehavioralSystems). Stimuli were back-projected on a transparent screen using aSanyo PLC-XP51 projector with a resolution of 1,024 � 768 pixels at60 Hz.
Subjects were seated 58 cm from the screen in a whole head MEGscanner setup in a dimly lit room. The stimulus was continuouslypresented for 6 runs of 3-min duration each. During that time, subjectskept their gaze on the fixation mark and reported the spontaneoustarget disappearance and reappearance by pressing a response buttonwith their right index finger and right middle finger, respectively. Toselect the 25 sensors overlying visual cortex that showed the biggeststimulus-induced response, subjects additionally performed the Stim-ulus-on-off condition described above for the main experiment, butwith the grayscale MIB stimulus (see Stimulus-on-off condition).
Data acquisition. MEG data were acquired at 1,200 Hz on a275-channel whole head neuromagnetometer (CTF 275; VSM/CTF
Systems, Port Coquitlam, BC, Canada). Subjects were placed in aseated position inside the scanner. The location of the subjects’ headwas measured in real time using three fiducial markers placed in theboth ears and on the nasal bridge to control for excessive movement.The EOG and ECG were recorded to aid artifact rejection.
Concurrently with the MEG recordings, the position of the lefteye’s pupil was sampled at 1,000 Hz with an average spatial resolu-tion of 15–30= arc, using an MEG-compatible EyeLink 1000 LongRange Mount system (SR Research, Osgoode, ON, Canada) placed ona table under the stimulus presentation screen. The eye tracker wascalibrated before every block of four runs.
MEG and eye tracking data analysis. PREPROCESSING. Both theMEG and eye tracking data were analyzed using the FieldTrip(Oostenveld et al. 2011) and custom-made MATLAB software (TheMathWorks). The following preprocessing steps of the MEG data wereperformed as described for the main experiment above: trial extraction,muscle and eye artifact rejection, and resampling to 500 Hz.
To align the eye and MEG data, the continuous eye data was firstupsampled to 1,200 Hz to match the MEG sampling rate. The triggersof perceptual reports in the MEG and eye data were then used to alignthe two data sets. Periods of blinks in the eye data were detected usingthe EyeLink’s standard algorithms with default settings. Blinks wereremoved by linear interpolation of values measured just before andafter each identified blink (interpolation time window: from 0.1 sbefore until 0.1 s after blink). Trials in which the gaze was more than100 pixels from the fixation cross for more than 10% of the trial’sduration were excluded from further analysis. Finally, the eye trackingdata was downsampled to 250 Hz.
SPECTRAL ANALYSIS OF MEG POWER. Spectral analysis of MEGpower modulations was performed as described for the main experi-ment above. We used the 25 sensors over visual cortex showing thebiggest increase in gamma power during the Stimulus-on-off condi-tion for the analyses of power modulation during MIB (see Fig. 7,scalp map insets).
ANALYSIS OF MODULATIONS OF MICROSACCADE RATE. Microsac-cades were detected using the algorithm developed by Engbert andcolleagues (Engbert and Kliegl 2003, Engbert and Mergenthaler2006). Preprocessed eye data were first smoothed with a window of 20ms to optimize microsaccade extraction. The permitted amplituderange was 0.08°–2° of visual angle, with minimum duration of 16 ms;microsaccades outside these ranges were rejected. Microsaccades thatoccurred within 20 ms of one another were merged into one saccade.The algorithm yielded a binary time course of saccade occurrences(i.e., 1’s embedded in a stream of 0’s) for each trial. These timecourses were convolved with a Gaussian window (� � 0.1 s) (Bonnehet al. 2010; Martinez-Conde et al. 2004) and averaged across trials(separately for target disappearance and reappearance) and subjects.
CORRELATION BETWEEN MEG POWER AND MICROSACCADE RATE
CHANGE. One analysis tested whether changes in microsaccade ratearound perceptual switches in MIB (Bonneh et al. 2010) causemodulations of MEG power over visual cortex. To this end,we correlated the microsaccade rate change around perceptual reportto the MEG power modulation time courses M(f,t) on a trial-by-trialbasis. We calculated the microsaccade rate change for each trial bysubtracting the number of microsaccades during a time windowshowing the transient MEG power modulations (�0.35 to 0.25 srelative to report) from the number of saccades in the precedingwindow (�0.95 to �0.35 s relative to report). Because responses invisual cortex that are evoked in visual cortex must occur only aftersome delay, we shifted the first time window by 50 ms backward intime relative to the transient time window used to extract the transientMEG modulations analyzed in this study (�0.3 to 0.3 relative toreport). The presently reported results are robust with respect to thischoice and also occurred for other delays (including 0 ms; data notshown).
We then correlated this rate change with MEG power in targetdisappearance trials, separately for each time-frequency bin (interval�1 to 1 s around report in the 3- to 35-Hz frequency range). Theresulting time-frequency representations of correlation values werethen tested for significant clusters across subjects by using the cluster-based permutation procedure described above (see Statistical tests ofpower modulations).
ASSESSING MEG POWER MODULATIONS IN THE ABSENCE OF
MICROSACCADES. In a complementary analysis, we tested whether thetransient beta-band modulation was also evident in the absence of anymicrosaccades during the critical time window (�0.35 to 0.25 srelative to report) in which microsaccades could have evoked modu-lations in MEG power. Longer time windows would have yielded aninsufficient number of microsaccade-free trials (zero for most sub-jects). Only subjects who had more than 15 microsaccade-free trialsper condition were included in this analysis (n � 11 for disappearanceand n � 6 for reappearance). The results were qualitatively similarwhen an inclusion threshold of 5, 10, 20, or 25 trials was used (datanot shown).
RESULTS
Eleven healthy subjects viewed the continuous presentationof the MIB stimulus (Fig. 1A) during 32 runs (2 min each)while MEG activity was recorded (see MATERIALS AND
METHODS). The durations of MIB target disappearances andreappearances varied widely (Fig. 1B). In several control con-ditions, perceptual switches similar to MIB target disappear-ances and reappearances were exogenously triggered by phys-ically removing the target from the screen in the same temporalsequence as MIB disappearances in that same subject, thus“replaying” the subjective MIB illusion to the subject. Wetherefore collectively refer to these control conditions as Re-play. We used three different Replay conditions to disentanglethe relationships between physical stimulus components, per-ceptual switches, subjects’ behavioral reports, and the mea-sured modulations of cortical activity (see below). During theReplay-active condition, subjects reported target disappearanceand reappearance as during MIB. The Replay-passive condi-tion was identical to Replay-active, except that subjects did notreport the target disappearances. The Replay-no-mask condi-tion was identical to Replay-active, except that the target waspresented without the surrounding mask (see MATERIALS AND
METHODS and below for the motivation behind each condition).We focused our analyses on MEG sensors overlying occip-
ital cortex that were most strongly driven by the MIB stimuluswhen presented for 0.75 s in separate runs (Fig. 1C). Consistentwith previous studies (Donner and Siegel 2011; Fries 2009;Jensen and Mazaheri 2011), sensors overlying visual cortexshowed the strongest stimulus-induced enhancement of gam-ma-band (60–90 Hz) and suppression of low-frequency (8–35Hz) power. We computed the overall power across 12 sensorswith maximum stimulus-induced responses, as well as thelateralization (contralateral or ipsilateral) with respect to thevariable (left or right) visual hemifield position of the target.The corresponding sensors are highlighted on the topographi-cal maps in Fig. 1C.
Top-Down Modulation in Visual Cortex During Report ofPerceptual Change
We analyzed the switch-related modulations in these 12visually responsive sensors during the continuous viewing of
the stimulus in the MIB illusion and the three Replay condi-tions described above. This was done to test four predictionsabout the switch-related modulations, which were derived fromprevious studies (Donner et al. 2008; Wilke et al. 2006): thereshould be a widespread modulation over visual cortex that 1)exhibits opposite polarity for MIB target disappearance andre-appearance, 2) occurs also during Replay-active, 3) is con-tingent on the need for behavioral report of the perceptualchanges (i.e., absent during Replay-passive), and 4) is de-coupled from the MIB stimulus components (target, mask).More specifically, regarding prediction 4, we expected that themodulation would occur also in the absence of the mask(Replay-no-mask). The tests of these predictions are described inthe following and shown in Figs. 2 (all conditions) and 3 (focusingon MIB and Replay-active). A qualitative summary of the powermodulations in all conditions is provided in Table 1.
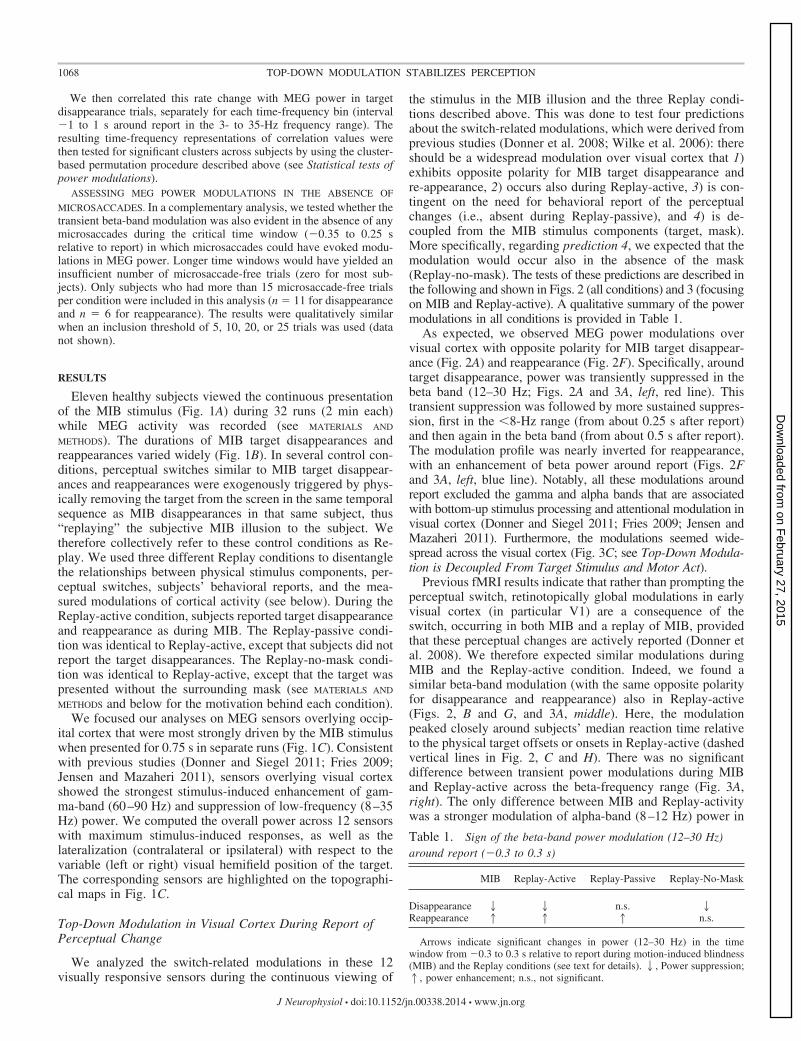
As expected, we observed MEG power modulations overvisual cortex with opposite polarity for MIB target disappear-ance (Fig. 2A) and reappearance (Fig. 2F). Specifically, aroundtarget disappearance, power was transiently suppressed in thebeta band (12–30 Hz; Figs. 2A and 3A, left, red line). Thistransient suppression was followed by more sustained suppres-sion, first in the �8-Hz range (from about 0.25 s after report)and then again in the beta band (from about 0.5 s after report).The modulation profile was nearly inverted for reappearance,with an enhancement of beta power around report (Figs. 2Fand 3A, left, blue line). Notably, all these modulations aroundreport excluded the gamma and alpha bands that are associatedwith bottom-up stimulus processing and attentional modulation invisual cortex (Donner and Siegel 2011; Fries 2009; Jensen andMazaheri 2011). Furthermore, the modulations seemed wide-spread across the visual cortex (Fig. 3C; see Top-Down Modula-tion is Decoupled From Target Stimulus and Motor Act).
Previous fMRI results indicate that rather than prompting theperceptual switch, retinotopically global modulations in earlyvisual cortex (in particular V1) are a consequence of theswitch, occurring in both MIB and a replay of MIB, providedthat these perceptual changes are actively reported (Donner etal. 2008). We therefore expected similar modulations duringMIB and the Replay-active condition. Indeed, we found asimilar beta-band modulation (with the same opposite polarityfor disappearance and reappearance) also in Replay-active(Figs. 2, B and G, and 3A, middle). Here, the modulationpeaked closely around subjects’ median reaction time relativeto the physical target offsets or onsets in Replay-active (dashedvertical lines in Fig. 2, C and H). There was no significantdifference between transient power modulations during MIBand Replay-active across the beta-frequency range (Fig. 3A,right). The only difference between MIB and Replay-activitywas a stronger modulation of alpha-band (8–12 Hz) power in
Table 1. Sign of the beta-band power modulation (12–30 Hz)around report (�0.3 to 0.3 s)
MIB Replay-Active Replay-Passive Replay-No-Mask
Disappearance 2 2 n.s. 2Reappearance 1 1 1 n.s.
Arrows indicate significant changes in power (12–30 Hz) in the timewindow from �0.3 to 0.3 s relative to report during motion-induced blindness(MIB) and the Replay conditions (see text for details).2, Power suppression;1, power enhancement; n.s., not significant.
Replay-active (P � 0.026, permutation test after collapsingacross the 9- to 12-Hz range). This enhanced alpha modulationduring Replay-active is consistent with attention capture by thetransient change of the physical stimulus. The similarity in thespectral profile and amplitude of the power modulations duringMIB and Replay-active is consistent with the beta-band mod-ulation being a consequence, not the cause, of the perceptualswitches during MIB.
Previous fMRI results showed that the global modulations inearly visual cortex occurred only when the target disappear-ance and reappearances were actively reported, whereas theywere absent during passive viewing (Donner et al. 2008).Similar observations were made for modulations of local fieldpotential power in monkey cortex and thalamus (Wilke et al.2006, 2009). Thus we expected the beta-band modulation to beabsent in the Replay-passive condition. Indeed, in line with thisprediction, there was no transient beta-power suppression dur-ing disappearance (Fig. 2D). The dashed rectangle in Fig. 2Dindicates the interval containing the significant transient mod-ulation in Replay-active (compare with Fig. 2C). During targetreappearance in Replay-passive, however, the power was en-hanced across a wider range including the beta band (Fig. 2H).Thus the beta suppression during target disappearance (but notthe beta enhancement during target reappearance) criticallydepended on the behavioral relevance of the perceptual change,possibly combined with the unpredictable timing of thechanges.
Finally, we tested whether the beta-band modulation wasindependent of the presence of the mask. Indeed, in the
Replay-no-mask condition the beta suppression during targetdisappearance was robust (Fig. 2E), and at least as strong as inMIB and Replay-active (with mask), implying that it did notrequire the presence of the mask. By contrast, there was nosignificant power enhancement during target reappearance(Fig. 2J). This might indicate that the power enhancement seenin the other conditions (Fig. 2, F–I) might reflect a “contextualmodulation” of the visual response to the mask by the reap-pearance of the target (Zipser et al. 1996). Such a contextualmodulation might occur, for example, because the target mightinterfere with the representation of the mask as a coherentsurface.
There was a double dissociation between beta-power mod-ulations during Replay-passive and Replay-no-mask condi-tions (cf. Fig. 2, D and E vs. I and J, and columns 3 vs. 4 inTable 1). This indicates that the beta suppression during targetdisappearance and the power enhancement during target reap-pearance are functionally distinct. The former, but not the latter,is consistent with a nonsensory modulation of population activity.This modulation does not reflect the cortical response to the MIBstimulus, but rather an endogenous signal originating within thebrain. In the following, we therefore refer to this signal duringtarget disappearance as a “top-down modulation.”
Top-Down Modulation is Decoupled From Target Stimulusand Motor Act
One well-characterized source of top-down modulation invisual cortex is spatial attention (Kastner and Ungerleider
BOverall power differencePower lateralization (contra - ipsi)
Mod
ulat
ion
diffe
renc
e (%
)
0
10
-10
20
p < 0.05
Frequency (Hz)
10 20 300 10 20 300 10 20 300
A
DisappearanceRe-appearance
0
10
-10
Mod
ulat
ion
(%)
20
10 20 300
p < 0.05
10 20 300
Frequency (Hz)
10 20 300
MIB Replay-active MIB - Replay-active
Disappearance Re-appearance
Disappearance — Re-appearance
12 - 30 Hz
Disappearance Re-appearance
Disappearance — Re-appearance
12 - 30 Hz10
-10
M(f,t) (%)
C Disappearance Re-appearance
Disappearance — Re-appearance
12 - 30 Hz
Fig. 3. Widespread beta-power transient over visualcortex encodes report. In A and B, graphs show spectraof mean low-frequency (�35 Hz) power modulationduring transient time window (�0.3 to 0.3 s; see Fig.2A) around report. Colored bars indicate clusters ofsignificant modulation (P � 0.05, 2-sided permutationtest, cluster-corrected). A: MIB, Replay-active, anddifference (MIB � Replay-active). Inset scalp maprepresents the sensor group used for this analysis.B: solid line indicates the reappearance � disappear-ance difference for overall power modulation (i.e.,difference between blue and red line in A). Dashed lineindicates lateralization contralateral vs. ipsilateral withrespect to target hemifield. Triangles and squares inscalp map represent the sensors used for lateralizationanalyses. Green solid bar represents clusters of signif-icant overall modulation; black bar represents clustersof significant difference between overall modulationand lateralization (P � 0.05, 2-sided permutation test,cluster-corrected). There is no significant frequencycluster for the lateralization. Shaded colored areasindicate SE (n � 11 subjects); shaded gray areasindicate the range of beta-band modulation duringMIB (12–30 Hz). C: topographical maps of transient12- to 30-Hz modulations and disappearance � reap-pearance differences.
2000). Spatial attention to visual targets contained in one visualhemifield induces a selective lateralization of MEG power,relative to the target, in different frequency bands (Jensen andMazaheri 2011; Siegel et al. 2008; Wyart and Tallon-Baudry2008). During MIB, power modulations reflecting spatial at-tention might be selective for the target, the perception ofwhich changes over time, as shown in an MIB study using onetarget per hemifield (Händel and Jensen 2014). In contrast tothe spatial attention prediction, we found that the beta-bandmodulation was not selective for target location during MIB(Fig. 3B, left) and Replay-active (Fig. 3B, middle). There wasno evidence for lateralization in the beta range, even for themost sensitive quantification of the beta-band modulation (dis-appearance � reappearance difference; dotted lines). Second,the overall power modulation (i.e., ipsilateral and contralateralsensors pooled; solid lines) was significantly stronger than thelateralization. Note that power suppression in the alpha band(around 10 Hz), in contrast, exhibited a trend to significantlateralization, in particular during MIB, in line with the resultsof Händel and Jensen (2014). In sum, the beta-band modulationduring perceptual changes is widespread across visual cortex,distinct from spatially selective attention signals that have beenmeasured with the use of similar techniques in other studies.Consequently, collapsing the beta-band modulation across sub-jects irrespectively of target location yielded a robust modula-tion (Figs. 2 and 3).
Given the strong link of the beta-band modulation to behav-ioral report, another possible source of the top-down modula-tion in visual cortex is the motor act (button presses/releases)used for report. Motor movements are commonly associatedwith a suppression of beta-band oscillations in the motorsystem (Donner et al. 2009; Pfurtscheller and Lopes da Silva1999). Indeed, we observed strong beta-power modulation overleft and right motor cortices during report (Figs. 3C and 4A).However, in line with previous studies (Donner et al. 2009;Pfurtscheller and Lopes da Silva 1999), this motor beta-powermodulation was stereotypically negative, irrespective of thetype of report, in sharp contrast to the beta modulation overvisual cortex (Fig. 3C). Furthermore, the amplitude of themotor beta suppression did not differ between disappearanceand reappearance reports (Fig. 4), again in sharp contrast to thevisual cortex beta modulation (Fig. 3).
The dissociation between the visual beta-band modulationand motor act was also evident in a separate analysis of the tworecording sessions, in which the mapping between perceptualswitch and motor response was flipped (Fig. 5). On day 1,subjects pressed the response button to indicate target disap-pearance and released the button to indicate target reappear-ance; on day 2, this mapping was reversed (Fig. 5A). Thebeta-band modulation in visual cortex was qualitatively iden-tical for both mappings, with a significant suppression of betapower for disappearance and an enhancement for reappearance(Fig. 5, B and C).
In sum, the beta-band modulation in visual cortex wasdecoupled from the target, and thus unlikely to reflect spatialattention, and it was also decoupled from activity in the motorcortex that was related to the behavioral report. A third possi-bility, which is consistent with all results presented in thisreport, is that the beta-power suppression during target disap-pearance is driven by the central process that transforms theperceptual change into behavioral report: the beta-band sup-
pression 1) is closely linked in time to the behavioral report, 2)occurs irrespective of whether this perceptual change is spon-taneous (MIB) or stimulus-evoked (Replay), and 3) is unaf-fected by large changes in the stimulus configuration (Replay-no-mask), but 4) is strongly affected by eliminating the needfor behavioral report (Replay-passive).
Top-Down Modulation Predicts Duration of PerceptualIllusion
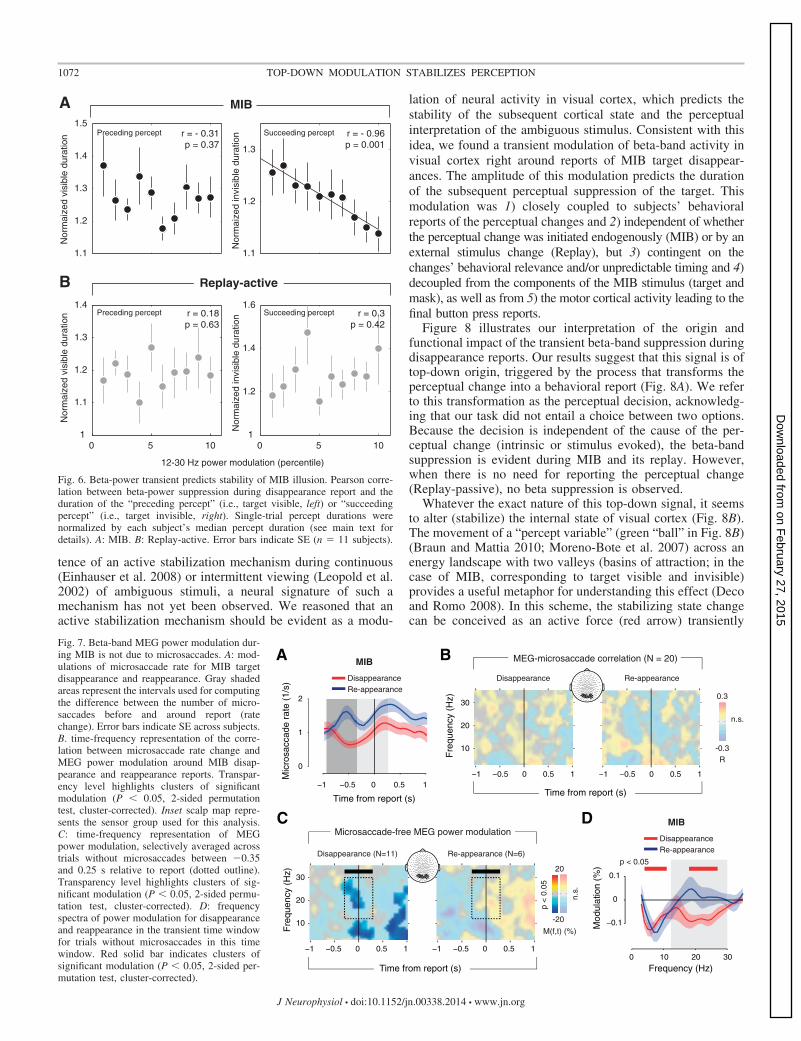
We next tested for a possible functional role of the transientmodulation in visual cortex: stabilization of the subsequentMIB illusion. To this end, we correlated the amplitude of thetransient beta suppression to the duration of the subsequentMIB target disappearance (i.e., using MIB duration as an indexof perceptual stability; see MATERIALS AND METHODS). Indeed,stronger beta suppressions (i.e., populating the lower rank bins)were followed by longer MIB durations (Fig. 6A, right). Thiscorrelation was highly significant across a range of differentbin sizes as well as without normalizing individual MIBdurations by the median per subject (data not shown).
There was no significant correlation to the preceding targetvisible duration (Fig. 6A, left) and a significant difference in thecorrelations for succeeding vs. preceding percept duration(P � 0.03, permutation test). Thus, as for the correlation tovariability of cortical activity, the correlation to MIB durationwas directed in time, specific for the succeeding target disap-pearance.
As shown in the previous sections, the beta suppression (andits relation to trial-to-trial variability) was indistinguishablebetween MIB and Replay-active. The key difference betweenboth conditions was the stability of perception: Target percep-tion was bistable in MIB (i.e., percept durations governed bycortical interactions) but stable during Replay (i.e., perceptdurations governed by the physical on- and offsets of the
A
Overall power differencePower lateralization (contra - ipsi)
B
Mod
ulat
ion
diffe
renc
e (%
)
0
10
-10
20
p < 0.05
0
10
-10
Mod
ulat
ion
(%)
20
10 20 300 10 20 300
Frequency (Hz)
Frequency (Hz)
10 20 300 10 20 300
MIB Replay-active
p < 0.05
DisappearanceRe-appearance
Fig. 4. Beta power over motor cortex does not encode report. A and B: sameas Fig. 3, A and B, but for sensors overlying motor cortex during MIB andReplay-active. A: frequency spectra of MEG power modulation. B: reappear-ance � disappearance difference for overall power modulation and lateraliza-tion contralateral vs. ipsilateral (contra � ipsi) with respect to hand used forreport.
target). Accordingly, as expected, there was no significantcorrelation during Replay-active (Fig. 6B), and the correlationwas significantly smaller (i.e., less negative) than during MIB(P � 0.002, permutation test).
Finally, the association between beta-band activity and MIBdisappearance duration was specific for the sensors overlyingvisual cortex. There was no significant correlation between thebeta-power suppression over motor cortex (which was evenstronger than that over visual cortex) during target disappear-ance and the subsequent MIB duration (r � �0.34, P � 0.34,permutation test; data not shown). In line with the findingsreported above, this indicates that the beta suppression duringtarget disappearance reports reflects a top-down process con-fined to visual cortex and distinct from the process suppressingbeta-band power over motor cortex.
Modulation is Not Due to Microsaccades
One potential concern is that the power modulation in visualcortex may have been due to subtle changes in fixational eyemovements during the perceptual switches (Bonneh et al.2010; Hsieh and Tse 2009). Specifically, target disappearancereports during MIB and Replay are accompanied by a reduc-tion in the rate of microsaccades (Bonneh et al. 2010). Thisreduction may have been associated with MEG power suppres-sion in the beta range.
This concern seems unlikely for two reasons. First, ouranalysis excluded all trials containing blinks and saccades thatwere detectable with EOG. Second, smaller microsaccadesduring sustained visual stimulation induce broadband (fromlow to high frequency) local field potential power enhance-ments in visual cortex (Bosman et al. 2009) and associated eyemovement artifacts in the extracranial EEG (Yuval-Greenberget al. 2008). A modulation of microsaccades, therefore, pre-dicts broadband power modulations, whereas the power mod-ulation reported here was confined to the beta band.
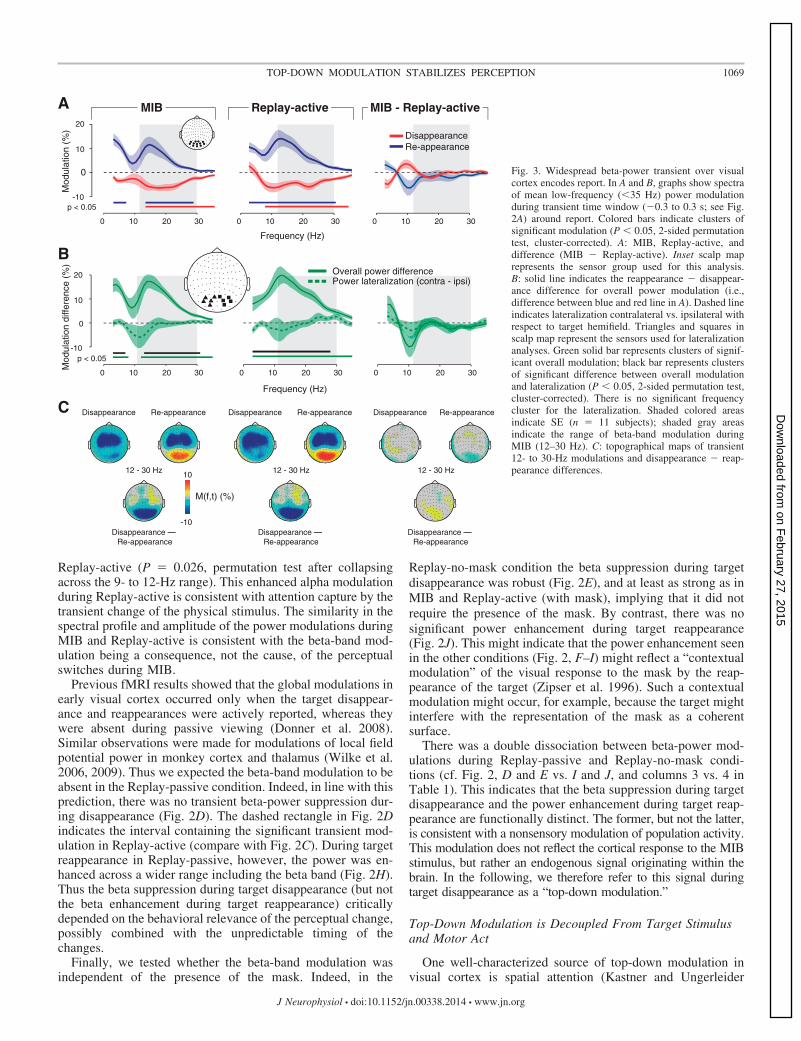
To conclusively rule out this concern, we performed anadditional control experiment in which we again measuredMEG power modulations over visual cortex while simultane-ously monitoring microsaccades with a high-resolution infra-red eye tracker (see MATERIALS AND METHODS). The microsac-cade rate exhibited similar modulations as previously reported(Bonneh et al. 2010), decreasing before MIB target disappear-ance and increasing before reappearance (Fig. 7A). However,during both target disappearance and reappearance, no time-frequency cluster of the MEG power modulation was significantlycorrelated with this change in microsaccade rate (Fig. 7B).
Finally, we tested whether the transient beta-band modula-tion was also evident in the absence of any microsaccades. Weselectively averaged MIB disappearance and reappearance tri-als that contained no microsaccades (specifically in the timewindow from �0.35 to 0.25 s relative to report in whichmicrosaccades could have evoked MEG power modulations)and found robust, statistically significant transient beta-bandsuppression for target disappearance (Fig. 7C, left) with afrequency profile similar to that in the main experiment (Fig.7D). Although beta-band modulation for reappearance wasagain enhanced (Fig. 7C, right), it did not reach statisticalsignificance, presumably because of the lower number ofsubjects that had a sufficient number of microsaccade-freetrials to be included in this analysis (see MATERIALS AND
METHODS). These findings replicate the main neurophysiologi-cal signature reported in this work in an independent group ofsubjects (on a different MEG system) and further rule out theconcern that this signature may be due to microsaccades.
DISCUSSION
We examined whether transient top-down modulations invisual cortex during perceptual changes in a multistable illu-sion may have an impact on the subsequent perceptual state.Although some previous indirect evidence points to the exis-
C
Disappearance
Re-appearance
Disappearance -
Re-appearance
Mapping 1 Mapping 2 Mapping 1 Mapping 2
MIB Replay-active
10
-10
M(f,t) (%)
Mod
ulat
ion
(%)
DisappearanceRe-appearance
10 20 300
Frequency (Hz)
0
10
-10
15
10 20 300
p < 0.05
0
10
-10
15
p < 0.05
B Mapping 1
MIB
Replay-active
Mapping 2
A
Mapping 1
Mapping 2
Percept:
Up
Buttonstate:
Time
Down
UpDown
Fig. 5. Beta-power transient over visual cortex is unrelated to motor act. A: opposite mappings of perceptual event to motor act on days 1 and 2. See main textfor details. B and C: same as Fig. 3, A and C, but separately for both mappings (i.e., recording days).
tence of an active stabilization mechanism during continuous(Einhauser et al. 2008) or intermittent viewing (Leopold et al.2002) of ambiguous stimuli, a neural signature of such amechanism has not yet been observed. We reasoned that anactive stabilization mechanism should be evident as a modu-
lation of neural activity in visual cortex, which predicts thestability of the subsequent cortical state and the perceptualinterpretation of the ambiguous stimulus. Consistent with thisidea, we found a transient modulation of beta-band activity invisual cortex right around reports of MIB target disappear-ances. The amplitude of this modulation predicts the durationof the subsequent perceptual suppression of the target. Thismodulation was 1) closely coupled to subjects’ behavioralreports of the perceptual changes and 2) independent of whetherthe perceptual change was initiated endogenously (MIB) or by anexternal stimulus change (Replay), but 3) contingent on thechanges’ behavioral relevance and/or unpredictable timing and 4)decoupled from the components of the MIB stimulus (target andmask), as well as from 5) the motor cortical activity leading to thefinal button press reports.
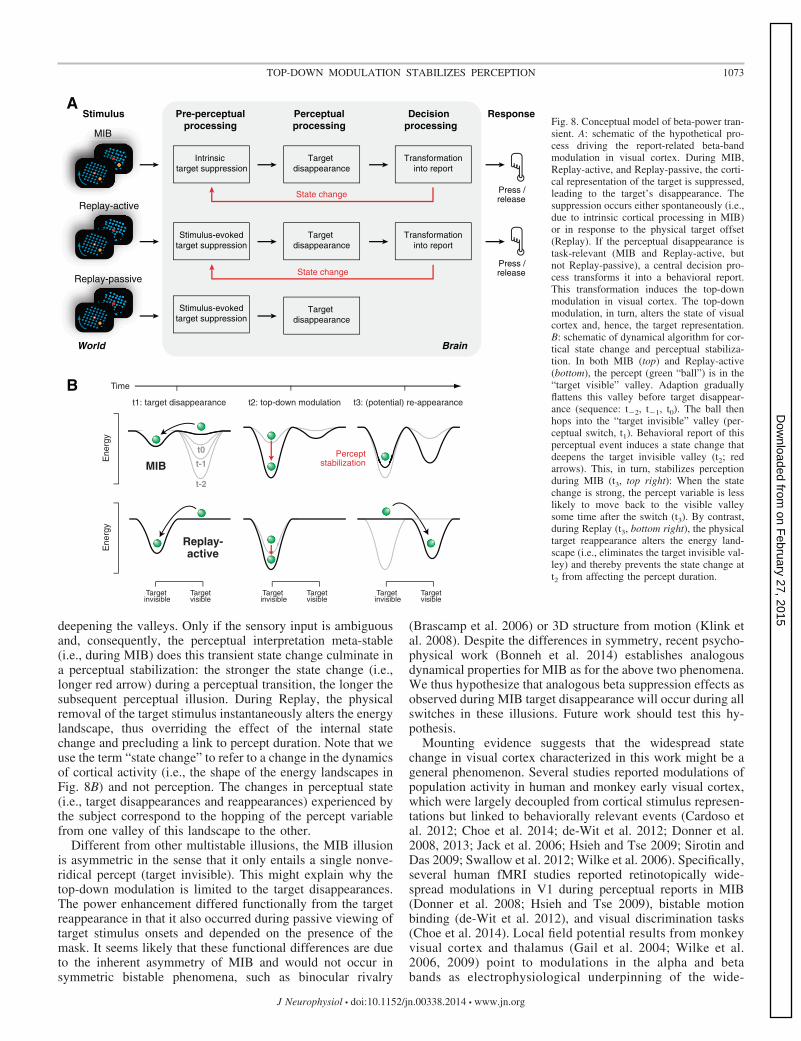
Figure 8 illustrates our interpretation of the origin andfunctional impact of the transient beta-band suppression duringdisappearance reports. Our results suggest that this signal is oftop-down origin, triggered by the process that transforms theperceptual change into a behavioral report (Fig. 8A). We referto this transformation as the perceptual decision, acknowledg-ing that our task did not entail a choice between two options.Because the decision is independent of the cause of the per-ceptual change (intrinsic or stimulus evoked), the beta-bandsuppression is evident during MIB and its replay. However,when there is no need for reporting the perceptual change(Replay-passive), no beta suppression is observed.
Whatever the exact nature of this top-down signal, it seemsto alter (stabilize) the internal state of visual cortex (Fig. 8B).The movement of a “percept variable” (green “ball” in Fig. 8B)(Braun and Mattia 2010; Moreno-Bote et al. 2007) across anenergy landscape with two valleys (basins of attraction; in thecase of MIB, corresponding to target visible and invisible)provides a useful metaphor for understanding this effect (Decoand Romo 2008). In this scheme, the stabilizing state changecan be conceived as an active force (red arrow) transiently
1.1
1.2
1.3
1.4
1.5
1.1
1.2
1.3
0 5 101
1.1
1.2
1.3
1.4
0 5 101
1.2
1.4
1.6
12-30 Hz power modulation (percentile)
MIB
Replay-active
r = 0.3p = 0.42
r = 0.18p = 0.63
r = - 0.96p = 0.001
r = - 0.31p = 0.37
Preceding percept Succeeding percept
Nor
mai
zed
visi
ble
dura
tion
Nor
mai
zed
invi
sibl
e du
ratio
n
Preceding percept Succeeding percept
Nor
mai
zed
visi
ble
dura
tion
Nor
mai
zed
invi
sibl
e du
ratio
n
B
A
Fig. 6. Beta-power transient predicts stability of MIB illusion. Pearson corre-lation between beta-power suppression during disappearance report and theduration of the “preceding percept” (i.e., target visible, left) or “succeedingpercept” (i.e., target invisible, right). Single-trial percept durations werenormalized by each subject’s median percept duration (see main text fordetails). A: MIB. B: Replay-active. Error bars indicate SE (n � 11 subjects).
1−1 −0.5 0 0.5
0
1
2
Time from report (s)
Mic
rosa
ccad
e ra
te (
1/s)
ADisappearanceRe-appearance
0 10 20 30
−0.1
0
0.1
Frequency (Hz)
10
20
30
Fre
quen
cy (
Hz)
−1 −0.5 0 0.5 1
MEG-microsaccade correlation (N = 20)B
DC
−1 −0.5 0 0.5 1
Fre
quen
cy (
Hz)
p < 0.05
−1 −0.5 0 0.5 1
Mod
ulat
ion
(%)
MIB
0.3
-0.3
n.s.
R
−1 −0.5 0 0.5 1
Disappearance Re-appearance
Microsaccade-free MEG power modulation
Disappearance (N=11) Re-appearance (N=6)
Time from report (s)
Time from report (s)
M(f,t) (%)
20
-20
p <
0.0
5
n.s.
DisappearanceRe-appearance
MIB
10
20
30
Fig. 7. Beta-band MEG power modulation dur-ing MIB is not due to microsaccades. A: mod-ulations of microsaccade rate for MIB targetdisappearance and reappearance. Gray shadedareas represent the intervals used for computingthe difference between the number of micro-saccades before and around report (ratechange). Error bars indicate SE across subjects.B. time-frequency representation of the corre-lation between microsaccade rate change andMEG power modulation around MIB disap-pearance and reappearance reports. Transpar-ency level highlights clusters of significantmodulation (P � 0.05, 2-sided permutationtest, cluster-corrected). Inset scalp map repre-sents the sensor group used for this analysis.C: time-frequency representation of MEGpower modulation, selectively averaged acrosstrials without microsaccades between �0.35and 0.25 s relative to report (dotted outline).Transparency level highlights clusters of sig-nificant modulation (P � 0.05, 2-sided permu-tation test, cluster-corrected). D: frequencyspectra of power modulation for disappearanceand reappearance in the transient time windowfor trials without microsaccades in this timewindow. Red solid bar indicates clusters ofsignificant modulation (P � 0.05, 2-sided per-mutation test, cluster-corrected).
deepening the valleys. Only if the sensory input is ambiguousand, consequently, the perceptual interpretation meta-stable(i.e., during MIB) does this transient state change culminate ina perceptual stabilization: the stronger the state change (i.e.,longer red arrow) during a perceptual transition, the longer thesubsequent perceptual illusion. During Replay, the physicalremoval of the target stimulus instantaneously alters the energylandscape, thus overriding the effect of the internal statechange and precluding a link to percept duration. Note that weuse the term “state change” to refer to a change in the dynamicsof cortical activity (i.e., the shape of the energy landscapes inFig. 8B) and not perception. The changes in perceptual state(i.e., target disappearances and reappearances) experienced bythe subject correspond to the hopping of the percept variablefrom one valley of this landscape to the other.
Different from other multistable illusions, the MIB illusionis asymmetric in the sense that it only entails a single nonve-ridical percept (target invisible). This might explain why thetop-down modulation is limited to the target disappearances.The power enhancement differed functionally from the targetreappearance in that it also occurred during passive viewing oftarget stimulus onsets and depended on the presence of themask. It seems likely that these functional differences are dueto the inherent asymmetry of MIB and would not occur insymmetric bistable phenomena, such as binocular rivalry
(Brascamp et al. 2006) or 3D structure from motion (Klink etal. 2008). Despite the differences in symmetry, recent psycho-physical work (Bonneh et al. 2014) establishes analogousdynamical properties for MIB as for the above two phenomena.We thus hypothesize that analogous beta suppression effects asobserved during MIB target disappearance will occur during allswitches in these illusions. Future work should test this hy-pothesis.
Mounting evidence suggests that the widespread statechange in visual cortex characterized in this work might be ageneral phenomenon. Several studies reported modulations ofpopulation activity in human and monkey early visual cortex,which were largely decoupled from cortical stimulus represen-tations but linked to behaviorally relevant events (Cardoso etal. 2012; Choe et al. 2014; de-Wit et al. 2012; Donner et al.2008, 2013; Jack et al. 2006; Hsieh and Tse 2009; Sirotin andDas 2009; Swallow et al. 2012; Wilke et al. 2006). Specifically,several human fMRI studies reported retinotopically wide-spread modulations in V1 during perceptual reports in MIB(Donner et al. 2008; Hsieh and Tse 2009), bistable motionbinding (de-Wit et al. 2012), and visual discrimination tasks(Choe et al. 2014). Local field potential results from monkeyvisual cortex and thalamus (Gail et al. 2004; Wilke et al.2006, 2009) point to modulations in the alpha and betabands as electrophysiological underpinning of the wide-
Fig. 8. Conceptual model of beta-power tran-sient. A: schematic of the hypothetical pro-cess driving the report-related beta-bandmodulation in visual cortex. During MIB,Replay-active, and Replay-passive, the corti-cal representation of the target is suppressed,leading to the target’s disappearance. Thesuppression occurs either spontaneously (i.e.,due to intrinsic cortical processing in MIB)or in response to the physical target offset(Replay). If the perceptual disappearance istask-relevant (MIB and Replay-active, butnot Replay-passive), a central decision pro-cess transforms it into a behavioral report.This transformation induces the top-downmodulation in visual cortex. The top-downmodulation, in turn, alters the state of visualcortex and, hence, the target representation.B: schematic of dynamical algorithm for cor-tical state change and perceptual stabiliza-tion. In both MIB (top) and Replay-active(bottom), the percept (green “ball”) is in the“target visible” valley. Adaption graduallyflattens this valley before target disappear-ance (sequence: t�2, t�1, t0). The ball thenhops into the “target invisible” valley (per-ceptual switch, t1). Behavioral report of thisperceptual event induces a state change thatdeepens the target invisible valley (t2; redarrows). This, in turn, stabilizes perceptionduring MIB (t3, top right): When the statechange is strong, the percept variable is lesslikely to move back to the visible valleysome time after the switch (t3). By contrast,during Replay (t3, bottom right), the physicaltarget reappearance alters the energy land-scape (i.e., eliminates the target invisible val-ley) and thereby prevents the state change att2 from affecting the percept duration.
spread fMRI signal modulations associated with bistableperceptual dynamics. By establishing the retinotopicallywidespread nature and functional consequences of theswitch-related beta-band modulations in the human brain,our current MEG results add critical new information to thisemerging body of evidence.
What is the source of the beta-band modulation in visualcortex? At the functional level, the modulation could be aphasic arousal signal depending on the task demands (thusabsent during passive viewing) and the timing of events thatdrive the modulation. It could also indicate that a response hasbeen made. Although these possibilities should be addressed infuture work, we find that the modulation is specific for the typeof the perceptual change (occurring specifically during targetdisappearance) and that it is dissociated from activity evidentover motor cortex. Thus our observations are inconsistent witha nonspecific task- or response-related mechanism, or a directcopy of activity from the motor cortex. At the neural level, thebeta-band modulation in visual cortex might originate fromhigher cortical areas (Nienborg and Cumming 2009; Siegel etal. 2012), the thalamus (Wilke et al. 2009), or neuromodulatorybrainstem centers (Aston-Jones and Cohen 2005; de Gee et al.2014; Einhauser et al. 2008; Hupe et al. 2009; Parikh et al.2007) or from a combination of cortical feedback and neuro-modulation (Noudoost and Moore 2011).
Indeed, neuromodulatory brainstem systems, such as thenoradrenergic locus coeruleus and the cholinergic basal fore-brain systems, also exhibit transient activity during perceptualreports, which can reflect the content of the report (Aston-Jones and Cohen 2005; de Gee et al. 2014; Einhauser et al.2008; Hupe et al. 2009; Parikh et al. 2007; also KloostermanNA, Meindertsma T, van Loon A, Bonneh Y, Lamme VA, andDonner TH, unpublished observations). Further evidence sug-gests that beta-band power modulations in visual cortex duringvisual stimulation might index changes in neuromodulatorystate (Belitski et al. 2008; Donner and Siegel 2011). If suchbeta-band modulation emerges from the interaction betweenneuromodulation and the bottom-up stimulus drive, this wouldexplain why the beta-band modulation colocalizes with theresponse to the MIB stimulus, despite the more widespreadneuromodulatory projections to the cortex. Finally, neuro-modulatory brain stem systems are in a position to stabilize theperceptual dynamics because they can dynamically alter keycortical circuit parameters in profound ways. In particular,neuromodulators suppress cortical variability (Polack et al.2013) and may amplify inhibitory interactions in cortical cir-cuits (Haider et al. 2013). In competitive networks underlyingmultistable perception (Braun and Mattia 2010; Moreno-Boteet al. 2007), a transient boost of mutual inhibition is equivalentinto the deepening of valleys shown in Fig. 7B.
The cerebral cortex continuously undergoes changes in in-ternal state (Harris and Thiele 2011; Lee and Dan 2012;Steriade 2000). Whereas these state changes have traditionallybeen associated with slow fluctuations of arousal level (Haideret al. 2013; Harris and Thiele 2011; Steriade 2000), some ofthese state changes co-occur with rapid cognitive processes(Aston-Jones and Cohen 2005; Gilbert and Sigman 2007;Parikh et al. 2007). Our current results are consistent with theidea that the active report of perceptual changes triggers acortical state change, which can stabilize an illusory percept.Future work should address whether the effect we have iden-
tified here for the MIB illusion generalizes to other perceptualphenomena (Fischer and Whitney 2014; Jazayeri and Movshon2007; Stocker and Simoncelli 2008), as well as to morecomplex decisions beyond the domain of perception (Festinger1957).
ACKNOWLEDGMENTS
We thank David Heeger, Tomas Knapen, Mike X. Cohen, Simon van Gaal,Tomas Knapen, Anouk van Loon, Sander Nieuwenhuis, Jan Brascamp, and allmembers of the Donner laboratory for comments on the manuscript.
GRANTS
This work was supported by the European Research Council DEFCON1Grant (to V. A. F. Lamme). T. H. Donner is supported by grants from theNetherlands Organization for Scientific Research (NWO; Dossier no. 406-14-016), the European Union 7th Framework Programme (FP7/2007-2013) underGrant Agreement no. 604102 (Human Brain Project), and the AmsterdamBrain and Cognition (ABC) Priority Program (ABC2014-01).
DISCLOSURES
No conflicts of interest, financial or otherwise, are declared by the authors.
AUTHOR CONTRIBUTIONS
N.A.K., V.A.L., and T.H.D. conception and design of research; N.A.K.,T.M., A.H., and B.W.v.D. performed experiments; N.A.K., T.M., A.H., andT.H.D. analyzed data; N.A.K., T.M., V.A.L., and T.H.D. interpreted results ofexperiments; N.A.K., T.M., and T.H.D. prepared figures; N.A.K. and T.H.D.drafted manuscript; N.A.K., T.M., and T.H.D. edited and revised manuscript;N.A.K., T.M., A.H., B.W.v.D., V.A.L., and T.H.D. approved final version ofmanuscript.
REFERENCES
Aston-Jones G, Cohen JD. An integrative theory of locus coeruleus-norepi-nephrine function: adaptive gain and optimal performance. Annu Rev Neu-rosci 28: 403–450, 2005.
Belitski A, Gretton A, Magri C, Murayama Y, Montemurro MA, Logo-thetis NK, Panzeri S. Low-frequency local field potentials and spikes inprimary visual cortex convey independent visual information. J Neurosci 28:5696–5709, 2008.
Bonneh YS, Donner TH, Sagi D, Fried M, Cooperman A, Heeger DJ,Arieli A. Motion-induced blindness and microsaccades: cause and effect. JVis 10: 22, 2010.
Bonneh YS, Donner TH, Cooperman A, Heeger DJ, Sagi D. Motion-induced blindness and Troxler fading: common and different mechanisms.PLoS One 9: e92894, 2014.
Bosman CA, Womelsdorf T, Desimone R, Fries P. A microsaccadic rhythmmodulates gamma-band synchronization and behavior. J Neurosci 29: 9471–9480, 2009.
Brascamp JW, van Ee R, Noest AJ, Jacobs RH, van den Berg AV. The timecourse of binocular rivalry reveals a fundamental role of noise. J Vis 6:1244–1256, 2006.
Braun J, Mattia M. Attractors and noise: twin drivers of decisions andmultistability. Neuroimage 52: 740–751, 2010.
Britz J, Landis T, Michel CM. Right parietal brain activity precedes percep-tual alternation of bistable stimuli. Cereb Cortex 19: 55–65, 2009.
Britz J, Pitts MA, Michel CM. Right parietal brain activity precedes percep-tual alternation during binocular rivalry. Hum Brain Mapp 32: 1432–1442,2011.
Cardoso MM, Sirotin YB, Lima B, Glushenkova E, Das A. The neuroim-aging signal is a linear sum of neurally distinct stimulus- and task-relatedcomponents. Nat Neurosci 15: 1298–1306, 2012.
Carter OL, Pettigrew JD. A common oscillator for perceptual rivalries?Perception 32: 295–305, 2003.
Choe KW, Blake R, Lee SH. Dissociation between neural signatures ofstimulus and choice in population activity of human V1 during perceptualdecision-making. J Neurosci 34: 2725–2743, 2014.
Churchland MM, Yu BM, Cunningham JP, Sugrue LP, Cohen MR,Corrado GS, Newsome WT, Clark AM, Hosseini P, Scott BB, BradleyDC, Smith MA, Kohn A, Movshon JA, Armstrong KM, Moore T,Chang SW, Snyder LH, Lisberger SG, Priebe NJ, Finn IM, Ferster D,Ryu SI, Santhanam G, Sahani M, Shenoy KV. Stimulus onset quenchesneural variability: a widespread cortical phenomenon. Nat Neurosci 13:369–378, 2010.
de Gee JW, Knapen T, Donner TH. Decision-related pupil dilation reflectsupcoming choice and individual bias. Proc Natl Acad Sci USA 111:E618–E625, 2014.
Deco G, Romo R. The role of fluctuations in perception. Trends Neurosci 31:591–598, 2008.
de-Wit LH, Kubilius J, Wagemans J, Op de Beeck HP. Bistable Gestaltsreduce activity in the whole of V1, not just the retinotopically predictedparts. J Vis 12: 12, 2012.
Donner TH, Sagi D, Bonneh YS, Heeger DJ. Opposite neural signatures ofmotion-induced blindness in human dorsal and ventral visual cortex. JNeurosci 28: 10298–10310, 2008.
Donner TH, Sagi D, Bonneh YS, Heeger DJ. Retinotopic patterns ofcorrelated fluctuations in visual cortex reflect the dynamics of spontaneousperceptual suppression. J Neurosci 33: 2188–2198, 2013.
Donner TH, Siegel M, Fries P, Engel AK. Buildup of choice-predictiveactivity in human motor cortex during perceptual decision making. CurrBiol 19: 1581–1585, 2009.
Donner TH, Siegel M. A framework for local cortical oscillation patterns.Trends Cogn Sci 15: 191–199, 2011.
Efron B, Tibshirani R. An Introduction to the Bootstrap. Boca Raton, FL:Chapman & Hall/CRC, 1998.
Einhauser W, Stout J, Koch C, Carter O. Pupil dilation reflects perceptualselection and predicts subsequent stability in perceptual rivalry. Proc NatlAcad Sci USA 105: 1704–1709, 2008.
Engbert R, Kliegl R. Microsaccades uncover the orientation of covert atten-tion. Vision Res 43: 1035–1045, 2003.
Engbert R, Mergenthaler K. Microsaccades are triggered by low retinalimage slip. Proc Natl Acad Sci USA 103: 7192–7197, 2006.
Festinger LA. A Theory of Cognitive Dissonance Stanford, CA: StanfordUniversity Press, 1957.
Fischer J, Whitney D. Serial dependence in visual perception. Nat Neurosci17: 738–743, 2014.
Frassle S, Sommer J, Jansen A, Naber M, Einhauser W. Binocular rivalry:frontal activity relates to introspection and action but not to perception. JNeurosci 34: 1738–1747, 2014.
Fries P. Neuronal gamma-band synchronization as a fundamental process incortical computation. Annu Rev Neurosci 32: 209–224, 2009.
Gail A, Brinksmeyer HJ, Eckhorn R. Perception-related modulations oflocal field potential power and coherence in primary visual cortex ofawake monkey during binocular rivalry. Cereb Cortex 14: 300 –313,2004.
Gilbert CD, Sigman M. Brain states: top-down influences in sensory pro-cessing. Neuron 54: 677–696, 2007.
Haider B, Hausser M, Carandini M. Inhibition dominates sensory responsesin the awake cortex. Nature 493: 97–100, 2013.
Hamalainen M, Hari R, Ilmoniemi RJ, Knuutila J, Lounasmaa OV.Magnetoencephalography – theory, instrumentation, and applications tononinvasive studies of the working human brain. Rev Mod Phys 65:413–497, 1993.
Händel BF, Jensen O. Spontaneous local alpha oscillations predict motion-induced blindness. Eur J Neurosci 40: 3371–3379, 2014.
Harris KD, Thiele A. Cortical state and attention. Nat Rev Neurosci 12:509–523, 2011.
Haynes JD, Deichmann R, Rees G. Eye-specific effects of binocular rivalryin the human lateral geniculate nucleus. Nature 438: 496–499, 2005.
Hsieh PJ, Tse PU. Microsaccade rate varies with subjective visibility duringmotion-induced blindness. PLoS One 4: e5163, 2009.
Hupe JM, Lamirel C, Lorenceau J. Pupil dynamics during bistable motionperception. J Vis 9: 10, 2009.
Jack AI, Shulman GL, Snyder AZ, McAvoy M, Corbetta M. Separatemodulations of human V1 associated with spatial attention and task struc-ture. Neuron 51: 135–147, 2006.
Jazayeri M, Movshon JA. A new perceptual illusion reveals mechanisms ofsensory decoding. Nature 446: 912–915, 2007.
Jensen O, Mazaheri A. Shaping functional architecture by oscillatory alphaactivity: gating by inhibition. Front Hum Neurosci 4: 186, 2011.
Kastner S, Ungerleider LG. Mechanisms of visual attention in the humancortex. Annu Rev Neurosci 23: 315–341, 2000.
Klink PC, van Ee R, van Wezel RJ. General validity of Levelt’s propositionsreveals common computational mechanisms for visual rivalry. PLoS One 3:e3473, 2008.
Knapen T, Brascamp J, Pearson J, van Ee R, Blake R. The role of frontaland parietal brain areas in bistable perception. J Neurosci 31: 10293–10301,2011.
Lee SH, Blake R, Heeger DJ. Hierarchy of cortical responses underlyingbinocular rivalry. Nat Neurosci 10: 1048–1054, 2007.
Lee SH, Dan Y. Neuromodulation of brain states. Neuron 76: 209–222, 2012.Leopold DA, Logothetis NK. Activity changes in early visual cortex
Leopold DA, Logothetis NK. Multistable phenomena: changing views inperception. Trends Cogn Sci 3: 254–264, 1999.
Leopold DA, Murayama Y, Logothetis NK. Very slow activity fluctuationsin monkey visual cortex: implications for functional brain imaging. CerebCortex 13: 422–433, 2003.
Leopold DA, Wilke M, Maier A, Logothetis NK. Stable perception ofvisually ambiguous patterns. Nat Neurosci 5: 605–609, 2002.
Lumer ED, Friston KJ, Rees G. Neural correlates of perceptual rivalry in thehuman brain. Science 280: 1930–1934, 1998.
Martinez-Conde S, Macknik SL, Hubel DH. The role of fixational eyemovements in visual perception. Nat Rev Neurosci 5: 229–240, 2004.
Mitra PP, Pesaran B. Analysis of dynamic brain imaging data. Biophys J 76:691–708, 1999.
Moreno-Bote R, Rinzel J, Rubin N. Noise-induced alternations in an attractornetwork model of perceptual bistability. J Neurophysiol 98: 1125–1139,2007.
Nienborg H, Cumming BG. Decision-related activity in sensory neuronsreflects more than a neuron’s causal effect. Nature 459: 89–92, 2009.
Noudoost B, Moore T. Control of visual cortical signals by prefrontaldopamine. Nature 474: 372–375, 2011.
Oostenveld R, Fries P, Maris E, Schoffelen JM. FieldTrip: open sourcesoftware for advanced analysis of MEG, EEG, and invasive electrophysio-logical data. Comput Intell Neurosci 2011: 156869, 2011.
Parikh V, Kozak R, Martinez V, Sarter M. Prefrontal acetylcholinerelease controls cue detection on multiple timescales. Neuron 56: 141–154, 2007.
Pfurtscheller G, Lopes da Silva FH. Event-related EEG/MEG synchroniza-tion and desynchronization: basic principles. Clin Neurophysiol 110: 1842–1857, 1999.
Polack PO, Friedman J, Golshani P. Cellular mechanisms of brain state-dependent gain modulation in visual cortex. Nat Neurosci 16: 1331–1339,2013.
Polonsky A, Blake R, Braun J, Heeger DJ. Neuronal activity in humanprimary visual cortex correlates with perception during binocular rivalry.Nat Neurosci 3: 1153–1159, 2000.
Siegel M, Donner TH, Engel AK. Spectral fingerprints of large-scale neuro-nal interactions. Nat Rev Neurosci 13: 121–134, 2012.
Siegel M, Donner TH, Oostenveld R, Fries P, Engel AK. Neuronal syn-chronization along the dorsal visual pathway reflects the focus of spatialattention. Neuron 60: 709–719, 2008.
Sirotin YB, Das A. Anticipatory haemodynamic signals in sensory cortex notpredicted by local neuronal activity. Nature 457: 475–479, 2009.
Steriade M. Corticothalamic resonance, states of vigilance and mentation.Neuroscience 101: 243–276, 2000.
Sterzer P, Kleinschmidt A. A neural basis for inference in perceptualambiguity. Proc Natl Acad Sci USA 104: 323–328, 2007.
Sterzer P, Kleinschmidt A, Rees G. The neural bases of multistable percep-tion. Trends Cogn Sci 13: 310–318, 2009.
Stocker AA, Simoncelli EP. A Bayesian model of conditioned perception.Adv Neural Inf Process Syst 20: 1409–1416, 2008.
Swallow KM, Makovski T, Jiang YV. Selection of events in time enhancesactivity throughout early visual cortex. J Neurophysiol 108: 3239–3252,2012.
Taulu S, Kajola M, Simola J. Suppression of interference and artifacts by theSignal Space Separation Method. Brain Topogr 16: 269–275, 2004.
Tong F, Engel SA. Interocular rivalry revealed in the human cortical blind-spot representation. Nature 411: 195–199, 2001.
Wilke M, Logothetis NK, Leopold DA. Local field potential reflects percep-tual suppression in monkey visual cortex. Proc Natl Acad Sci USA 103:17507–17512, 2006.
Wilke M, Mueller KM, Leopold DA. Neural activity in the visual thalamusreflects perceptual suppression. Proc Natl Acad Sci USA 106: 9465–9470,2009.
Wyart V, Tallon-Baudry C. Neural dissociation between visual awarenessand spatial attention. J Neurosci 28: 2667–2679, 2008.
Yuval-Greenberg S, Tomer O, Keren AS, Nelken I, Deouell LY. Transientinduced gamma-band response in EEG as a manifestation of miniaturesaccades. Neuron 58: 429–441, 2008.
Zaretskaya N, Thielscher A, Logothetis NK, Bartels A. Disrupting parietalfunction prolongs dominance durations in binocular rivalry. Curr Biol 20:2106–2111, 2010.
Zipser K, Lamme VA, Schiller PH. Contextual modulation in primary visualcortex. J Neurosci 16: 7376–7389, 1996.