Page 1
Top down or bottom up?
Volcanic architecture, climate,
and hydrologic evolution of
volcanic landscapes
Anne JeffersonUniversity of North Carolina at Charlotte
The Galápagos as a Laboratory for the Earth Sciences
AGU Chapman Conference- July 2011Photo by A. Jefferson
Page 2
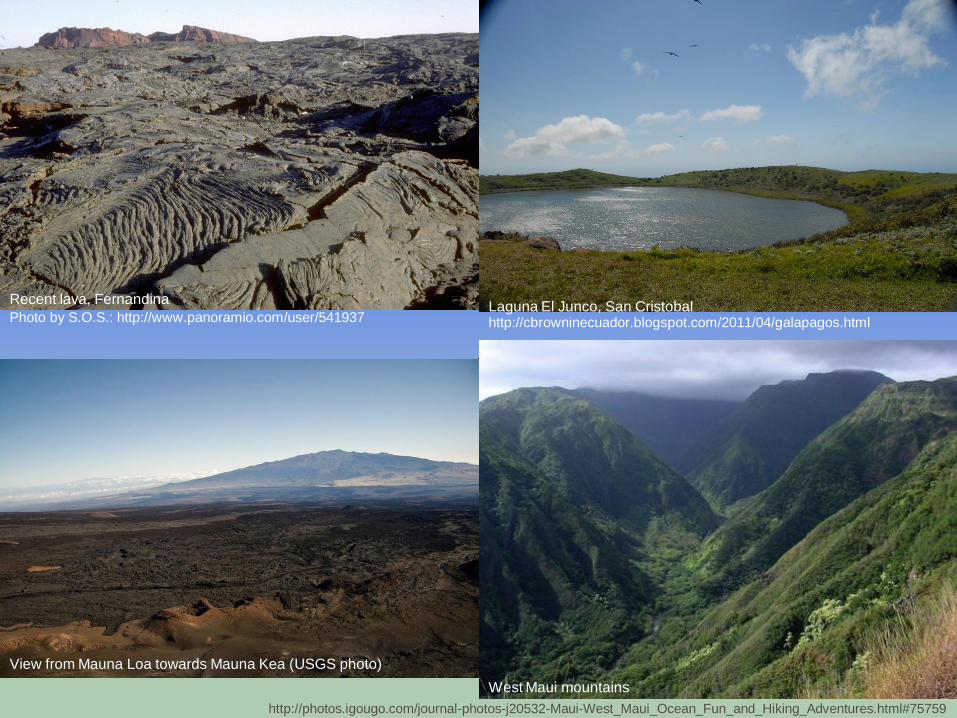
Recent lava, FernandinaLaguna El Junco, San Cristobal
View from Mauna Loa towards Mauna Kea (USGS photo)
West Maui mountains
Photo by S.O.S.: http://www.panoramio.com/user/541937 http://cbrowninecuador.blogspot.com/2011/04/galapagos.html
http://photos.igougo.com/journal-photos-j20532-Maui-West_Maui_Ocean_Fun_and_Hiking_Adventures.html#75759
Page 3
Oregon
High
Cascades
~0.18 Ma
~2.2 Ma
~0.02 Ma
Kilauea
(active)
Kohala
(~0.5 Ma)
West Maui
(1.5 Ma)
Kauai
(4.5 Ma)
Hawaii
(images from Porder & Vitousek)
(images by A. Jefferson)
Page 4
Volcano hydrology
Precipitation Evapotranspiration
Infiltration to Groundwater
Precipitation – Evapotranspiration =
Runoff + Groundwater
Partitioning between runoff and groundwater is
controlled by infiltration capacity or permeability
More runoff greater erosion of landscape
Page 5
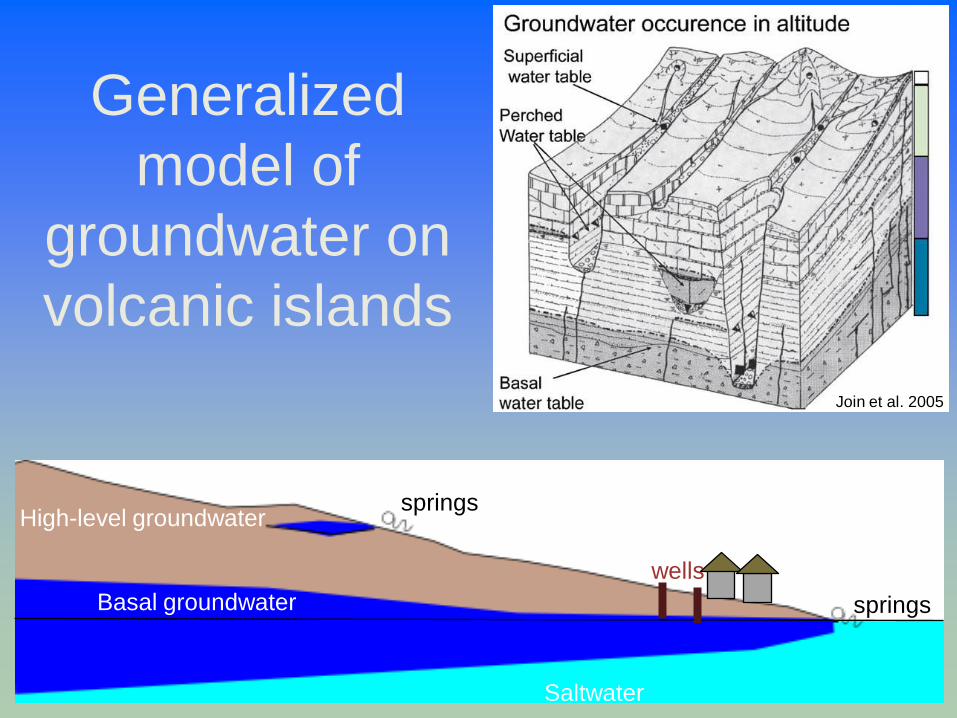
Generalized
model of
groundwater on
volcanic islands
Basal groundwater
Saltwater
High-level groundwater
Join et al. 2005
springs
springs
wells
Page 6
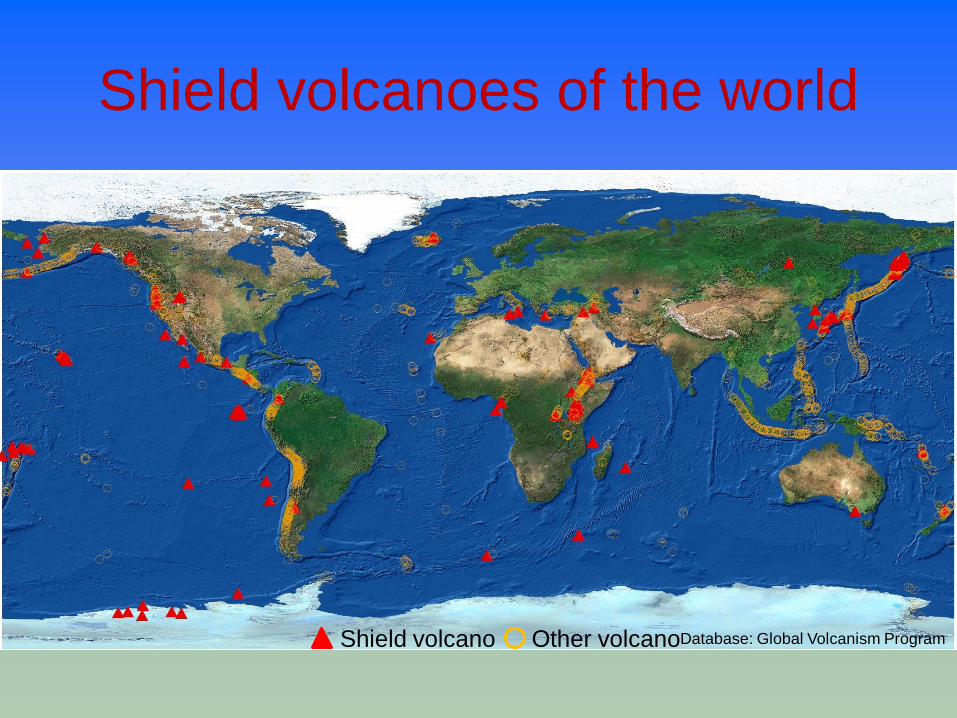
Shield volcanoes of the world
Shield volcano Other volcanoDatabase: Global Volcanism Program
Page 7
Hydrogeologically known shield volcanoes
Shield volcano Other volcanoDatabase: Global Volcanism Program
Reunion
Jeju Island
Hawaii
Cascades
Easter Island
AzoresMadeiraCanary
Galapagos
Samoa
Cape
Verde
Page 8
Time0 >5 Ma
Pre
cip
ita
tion
12 m/a
Complex and
highly altered
Lava
stack
0
Controls on
volcano
hydrology
Page 9
Image sources:
http://www.unavco.org/community_science/science_highlights/2008/sierra_negra.html
https://secure.wikimedia.org/wikipedia/en/wiki/File:Bora-Bora.png
http://www.galenfrysinger.com/cape_verde_islands.htm
http://www.madeira-island-holidays.info/
http://prochas.free.fr/reunion/Piton%20des%20neiges.jpg
Page 10
Tim
e
Pre
cip
ita
tion
Controls on
volcano
hydrology
“Bottom Up”
Processes
“Top Down”
Processes
Page 11
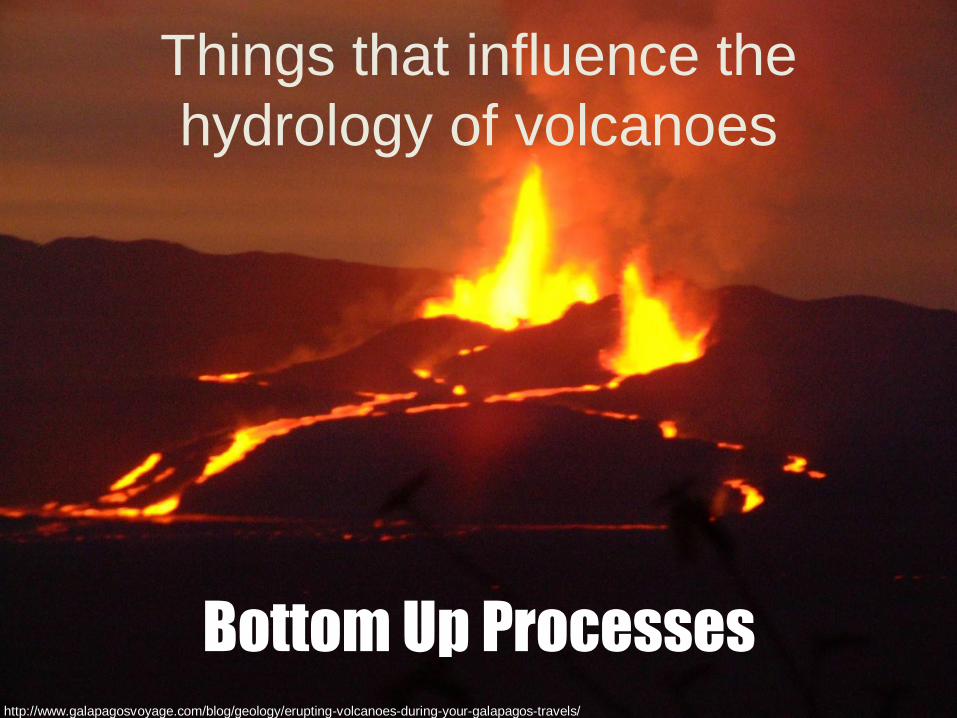
Things that influence the
hydrology of volcanoes
Bottom Up Processeshttp://www.galapagosvoyage.com/blog/geology/erupting-volcanoes-during-your-galapagos-travels/
Page 12
1. Eruption style and product
shield volcano stratovolcano
Pe
rme
ab
ility
Cin
der
cones
Tra
chyte
s
Tra
chybasalts
Sedim
enta
ry r
ocks
Ba
sa
lts
Jeju Island (Won et al., 2005)
Page 13
2. Composition
• Effusive volcanism is
dominated by basalt
• Silicic lavas generally less
permeable, because flows
more massive
Singhal and Gupta, 2010 after Walker, 1973
Andesite, Lascar (P. Francis)
Rhyolite, Newberry (E Klemetti)
Dacite, Chao (S. da Silva)
Basalt, Black Point lava flow (NASA)
Page 14
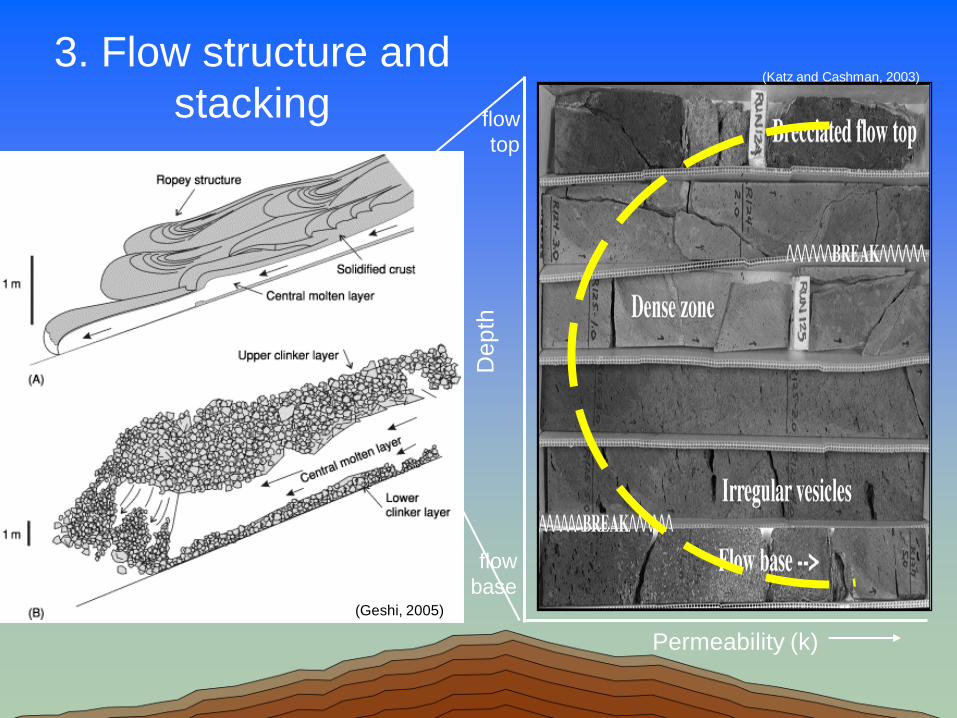
(Katz and Cashman, 2003)
Permeability (k)
Dep
th
flow
top
flow
base
3. Flow structure and
stacking
Permeability (k)
Dep
th
(Geshi, 2005)
Page 15
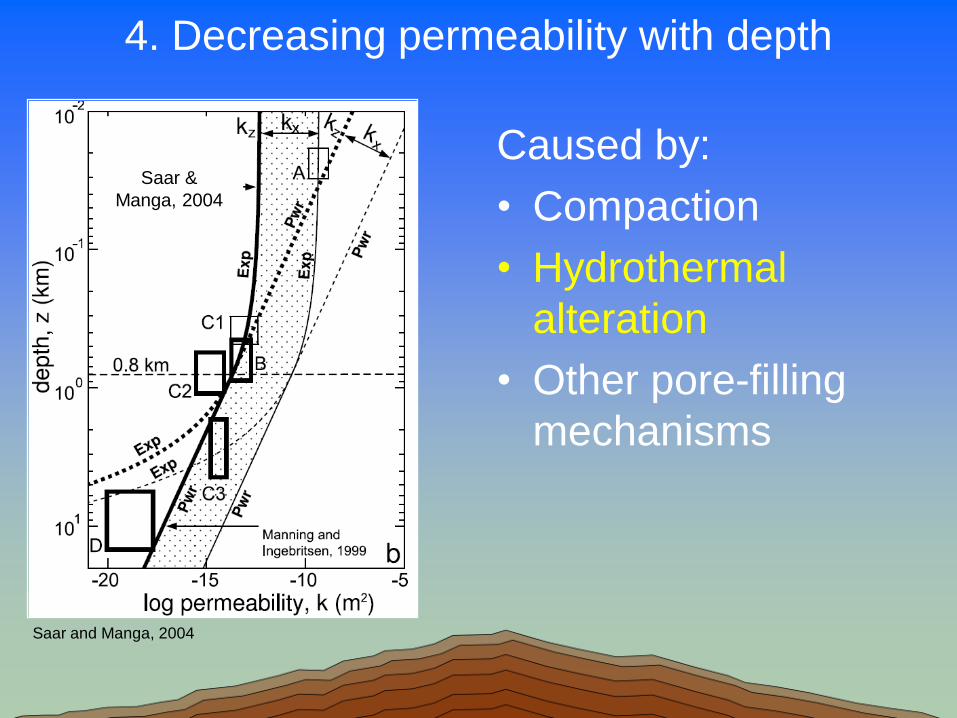
4. Decreasing permeability with depth
Caused by:
• Compaction
• Hydrothermal
alteration
• Other pore-filling
mechanisms
Permeability (k)
Depth
Saar &
Manga, 2004
Saar and Manga, 2004
Page 16
Hydrogeologic conceptual model of
volcanoes with decreasing permeability
Join et al. (2005) suggest that as volcanoes age, the
regional water table becomes progressively higher
and smoother – as permeability of both core and
surface decrease & erosion reduces relief
Join et al. 2005 (Reunion)
modified from Custodio et al. 1988 (Canary Is.)
k = 10-9 m2
k = 10-9 m2
k = 10-11 m2
k = 10-13 m2
Similar to Karthala & Mauritius
Page 17
5. Dikes and other intrusive bodies
“Conventional conceptual model” because of
early work in Hawaii
Modified from Gingerich and Oki 2000 (Oahu)
Similar to Kilauea (Scholl et al., 1996)
Appropriate for Madeira (Prada et al., 2005)
Lanai (Stearns, 1942)
Page 18
6. Faulting (& hydrothermal circulation)
Conduits for mixing
Locations of
hydrothermal alteration
Calderas may pond
surface water
Oregon Cascades
Jefferson et al., 2006, Ingebritsen et al., 1992, 1994
Kilauea
Conrad et al., 1997
Alcedo
Goff et al., 2000
Page 19
7. Magma-water interaction
• Good indicator of
hydrologic environment at
time of eruption:
lake, groundwater, ocean
• High water/magma ratios
produce fine grained
(low k) deposits– Low water/magma ratios
produce coarse (higher k)
deposits
• Faster alteration than
lava flows reduced k
Kilauea, 2008
Kilauea ocean entry, 4 June 2008 (USGS)
http://bigthink.com/ideas/23121
Page 20
8. Landslides
Consequences:
• Steepen slopes and
hydraulic gradients
• Expose new springs
• Unearth older rocks
• Create knickpoints that
drive stream erosion
and landscape
dissection
10 km
Mitchell, 2003Lamb et al. 2007
NPS map
Page 21
9. Ash fall • Ash has high
permeability, but
weathers quickly to
Andisols with high
water retention
• Fill pores at lava
surface & clogs
fractures
• Perched water
bodies occur above
weathered ash
layers
Location of valleys
on Hawaii
Location of surface
and near-surface
ash depositsGulick, 2005
Lassen (USGS 1890)
Page 22
1
2
3
4
5
0.001 0.01 0.1 1
Piton de la
Fournaise
Madeira
Sao
Vicente
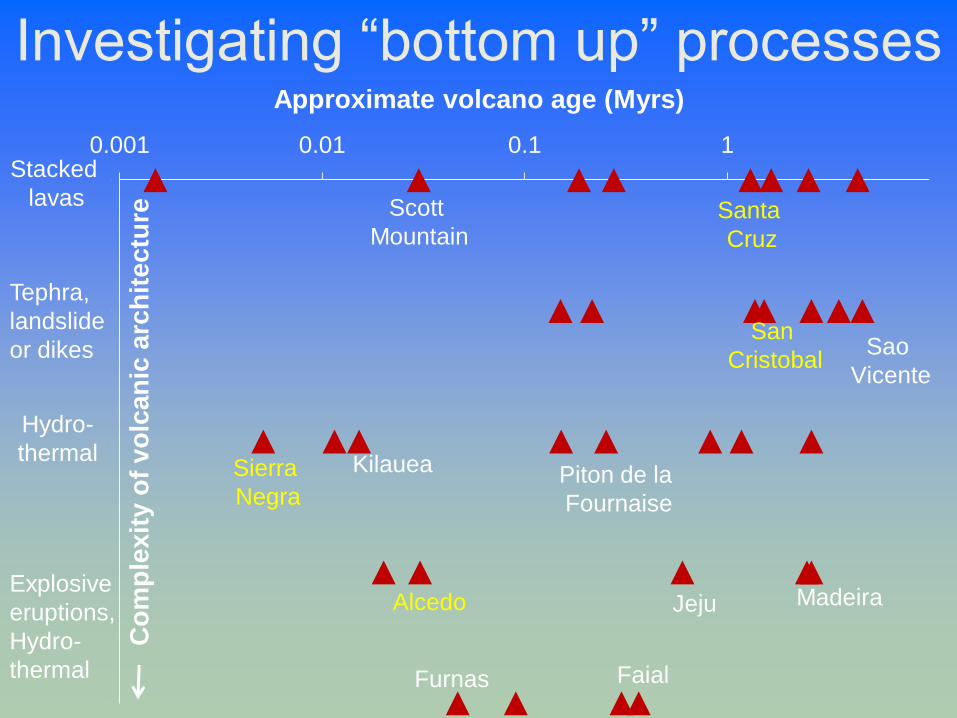
Investigating “bottom up” processes
Stacked
lavas
Tephra,
landslide
or dikes
Explosive
eruptions,
Hydro-
thermal
Hydro-
thermal
Approximate volcano age (Myrs)
Co
mp
lexit
y o
f v
olc
an
ic a
rch
itectu
re
Jeju
Kilauea
Alcedo
Sierra
Negra
Santa
Cruz
San
Cristobal
Scott
Mountain
Furnas Faial
Page 23
Top-down processes
Photo by A. Jefferson
Page 24
1. Loess and dust inputs• Loess and dust form
fine-grained mantle,
clog pores, fill swales
– smooth topography,
– promote drainage
development0.13 Ma
0.53 Ma 0.82 Ma
1.09 Ma
Drainage on
dust-covered
lava, Lunar
Crater, NV
(Dohrenwend
et al., 1987)
Kohala
Porder et al., 2007
Eppes and Harrison, 1999
Portrillo Volcanic Field, NM
Page 25
2. Glaciation
• Till has lower permeability than lava
• Glaciers may scour rubble, compact voids, and
erode troughs later used by liquid water
Collier lava flow (1600 years old)
Glacial till (~10,000 years old)
Photos from Hopson, 1946
Recent lava resting on glacially
grooved andesite
Page 26
3. Mechanical weathering• Rates usually exceed chemical weathering
• May smooth the land surface
• Material removed by surface drainage
0
2000
4000
6000
8000
10000
10 100 1000 10000
Ru
no
ff (
mm
/yr)
Approximate volcano age (kyrs)
Mechanical denudation (mm/kyr)
Data from Louvat and Allegre, 1997, 1998
Piton de la
Fournaise
Piton des
Neiges
Fogo
Furnas/
Povoacao Nordeste
Rivière de l'Est (Réunion)
Thierry Cailleux (on Flickr)
Page 27
4. Chemical weathering
• Basalts weather quickly relative to other
rocks, creating low k, clay-rich soils
• Promotes near surface lateral flow
• Possibly deep k reduction from groundwater if
high temperatures or long travel time (e.g., Rad et al., 2007, 2011)
Dessert et al., 2003
Basalt terrains
Porder et al., 2007
Hawaii
Page 28
5. Vegetation and soil development
• Plant roots initially
increase porosity
• Organic matter can
be a large fraction
of young lava soils
& has high water
retention
• Pahoehoe develops
plants & soils faster
than aa lava
High Cascades: Vegetation
density and soil depth
increase toward the edge of
lava flows
Page 29
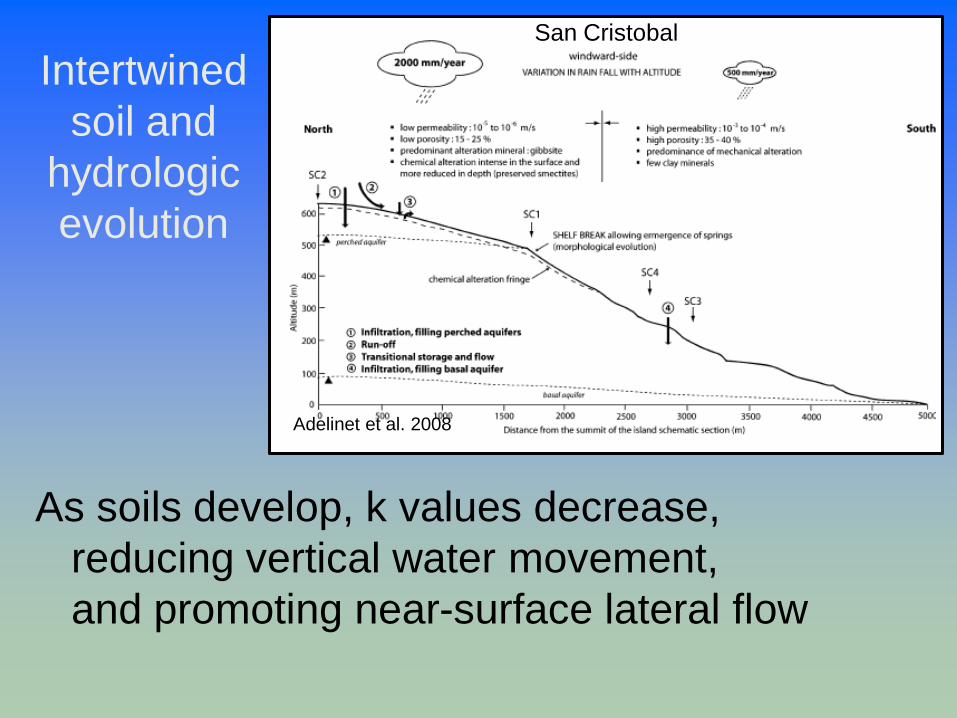
Intertwined
soil and
hydrologic
evolution
As soils develop, k values decrease,
reducing vertical water movement,
and promoting near-surface lateral flow
Adelinet et al. 2008
San Cristobal
Page 30
0
1
2
3
4
5
6
7
0.001 0.01 0.1 1 10
An
nu
al
Pre
cip
ita
tio
n (
m)
Age range of volcanic activity (Ma)
Reunion-Mauritius
Society
Samoa
Hawaii
MadeiraComoros
High CascadesAzores & Jeju
Austral & CookMarquesas
GalapagosEaster Island
Cape VerdeCanary
Investigating “top down” evolution
Page 31
Hydrologic
evolution of the
High Cascades
Tim
ePre
cip
itation
Limited
Faulting,
Dike injection,
hydrothermal alteration
Glaciation,
mechanical weathering,
chemical weathering,
vegetation & soil development
Photos by A. Jefferson
Page 32
Chronosequence
• 9 High Cascades
watersheds
(0.017 Ma to 2.2 Ma)
•Area: 6 – 238 km2
• Elevation: 432-3075 m
(mean: 974-1603 m)
• Precip: 1.9 to 2.7 m/yr
• 2 glacial troughs
Jefferson et al., 2010
Page 33
Hydrographs
evolve toward
greater seasonal
and event
response.
Jefferson et al., 2006, 2010
Page 34
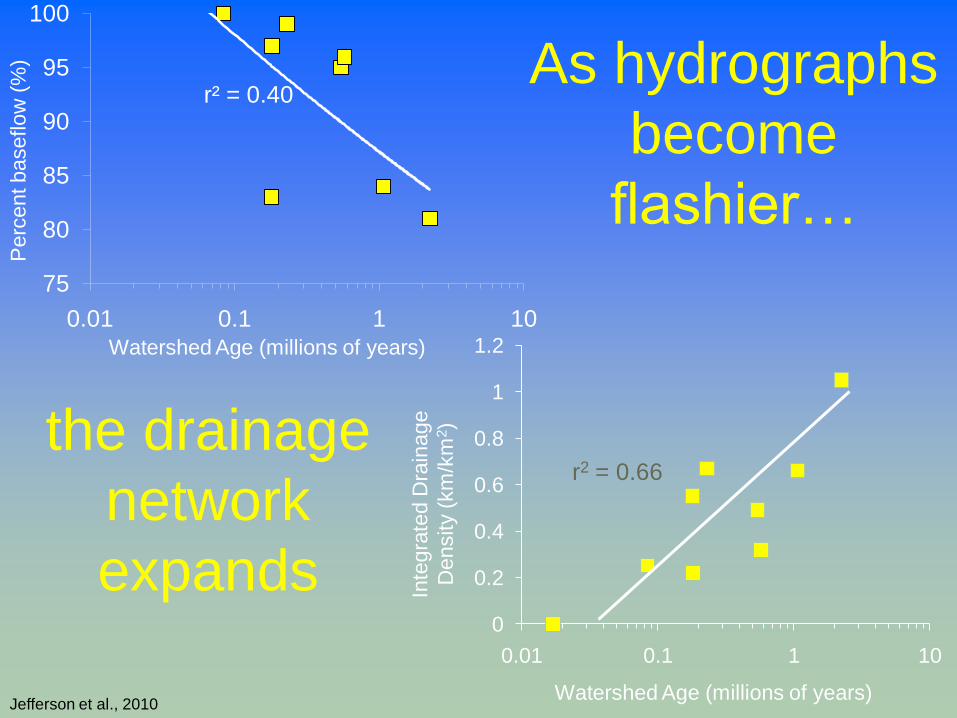
As hydrographs
become
flashier…
r² = 0.40
75
80
85
90
95
100
0.01 0.1 1 10
the drainage
network
expands
Watershed Age (millions of years)
0
0.2
0.4
0.6
0.8
1
1.2
0.01 0.1 1 10
Watershed Age (millions of years)
Inte
gra
ted D
rain
age
Density (
km
/km
2)
Perc
ent baseflo
w(%
)
r2 = 0.66
Jefferson et al., 2010
Page 35
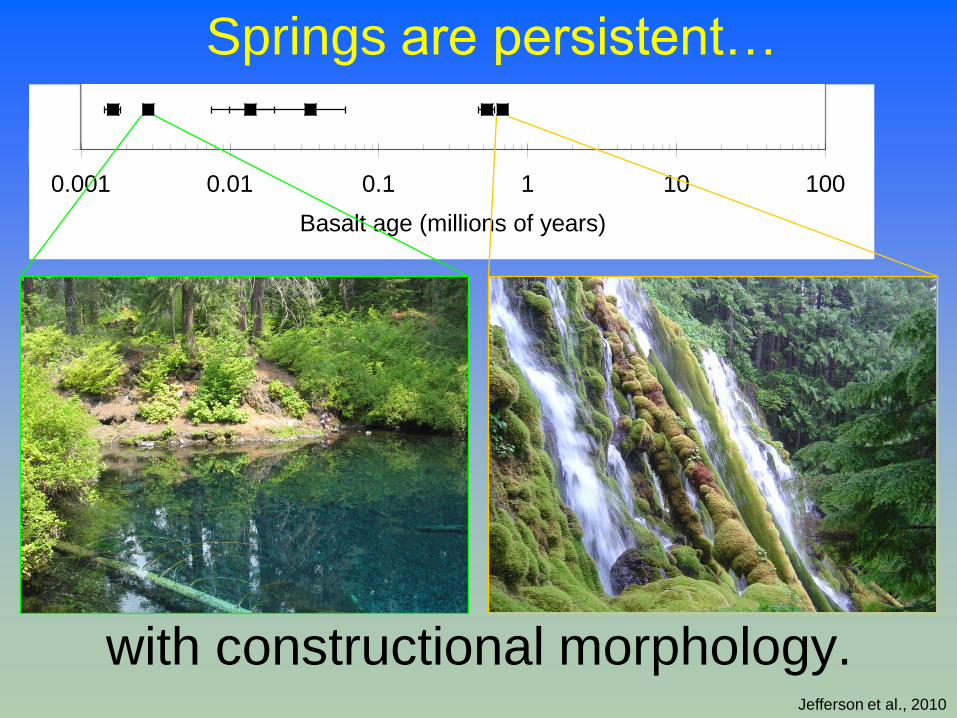
y = 0.0317Ln(x) + 0.4209
R2 = 0.77
0.0
0.1
0.2
0.3
0.4
0.5
0.6
0.001 0.01 0.1 1 10 100
Basalt age (millions of years)
Dra
inage d
ensity (
km
/km
2)
Springs are persistent…
with constructional morphology.Jefferson et al., 2010
Page 36
Spring-fed streams are
geomorphically ineffective.
• 1.55 m3/s
• 5 - 18 m wide
• 10 - 30 m deep valley
• 2.4 m3/s
• 3 m wide
• no valley
2 spring channels on same lava
Jefferson et al., 2010
Page 37
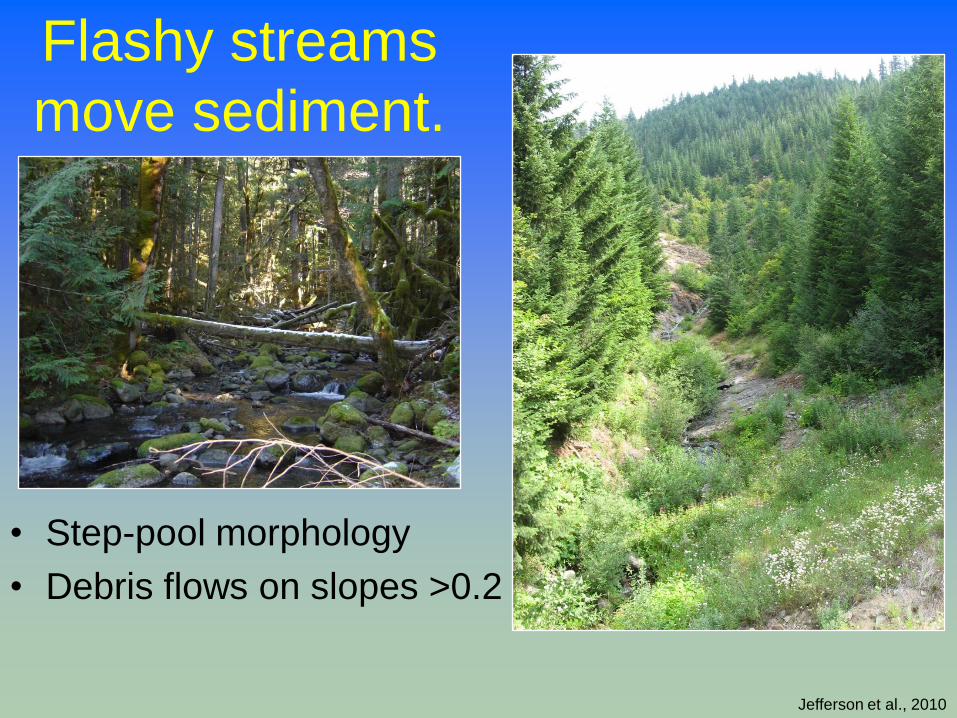
Flashy streams
move sediment.
• Step-pool morphology
• Debris flows on slopes >0.2
Jefferson et al., 2010
Page 38
Watershed topography is a
function of age.
Spring-fed (0.084 Ma)
Flashy (0.18 Ma)
Slo
pe
Dissected (2.2 Ma)
Constructional (0.017 Ma)
High Cascades
Jefferson et al., 2010
Page 39
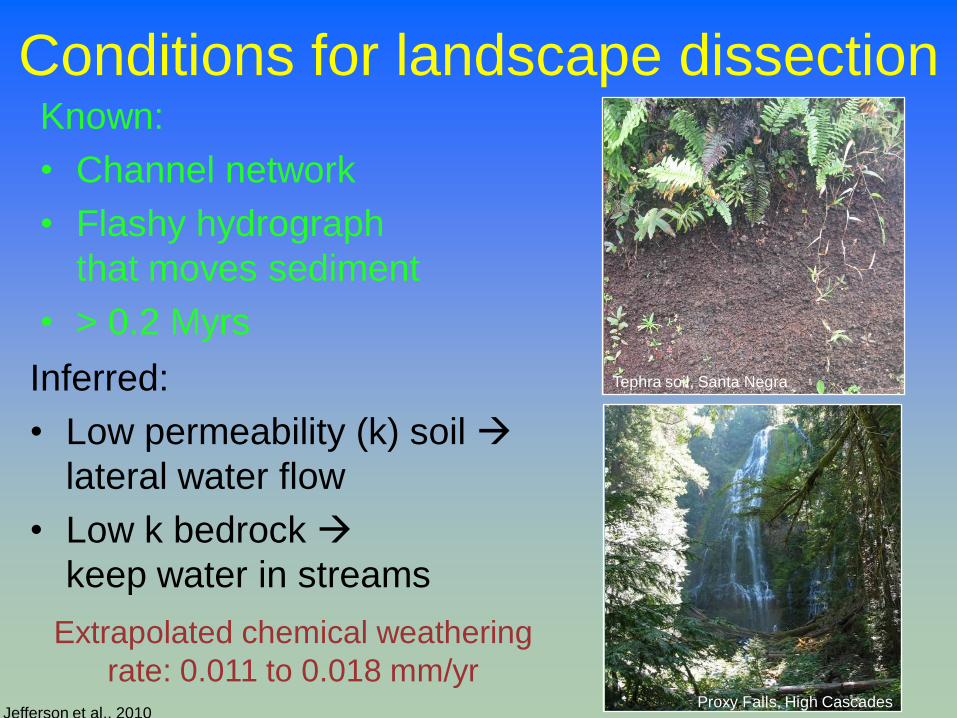
Conditions for landscape dissectionKnown:
• Channel network
• Flashy hydrograph
that moves sediment
• > 0.2 Myrs
Inferred:
• Low permeability (k) soil
lateral water flow
• Low k bedrock
keep water in streams
Extrapolated chemical weathering
rate: 0.011 to 0.018 mm/yrJefferson et al., 2010
Tephra soil, Santa Negra
Proxy Falls, High Cascades
Page 40
High k,
GW drainage
Low k
mantle
develops
Weathering
lowers
bedrock k
Channel
development
begins
GW flow
is blocked
Flashy
streams
incise
through
bedrock,
landscape
dissected
Coevolutionary sequence
Time
.01 – 0.1 Myr
0.2 – 0.8 Myr
1-2 Myr
Based on Jefferson et al., 2010
Page 41
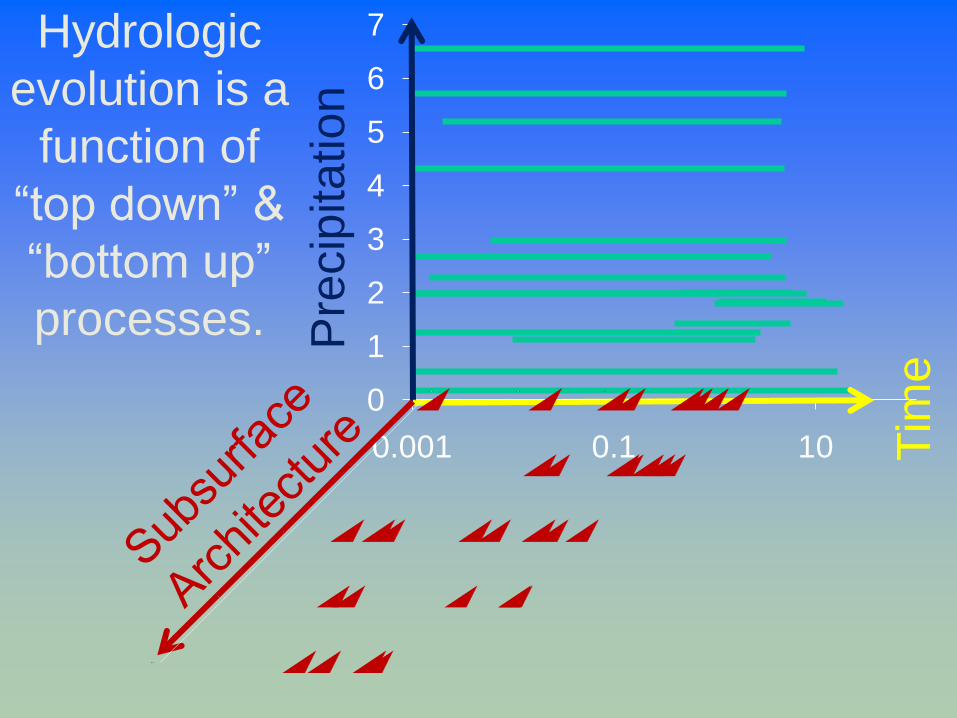
0
1
2
3
4
5
6
7
0.001 0.1 10 Tim
e
Pre
cip
ita
tion
Hydrologic
evolution is a
function of
“top down” &
“bottom up”
processes.
Page 42
• Hydrologic evolution is
quantifiable by surface and
subsurface hydrologic and
topographic parameters.
• Partitioning of water
between the surface and
subsurface has implications
for water resources
available to island
populations and for volcanic
hazards.
Bedrock channel, Santa Cruz
1979 or 2005 tephra, Santa Negra
Photos by A. Jefferson
Page 43
Open Questions
• What controls the relative importance of bottom
up versus top down processes?
• How do the trajectories and rates of hydrologic
evolution proceed in arid climates?
• What happens to submarine groundwater
discharge over time?
• How do we account for past climate variability?
• How do we move forward in data-sparse
environments?