INTRODUCTION A two years old boy was observing an eight months old toddler crawling happily on the floor. The boy then touched the toddlerÊs head and pulled his leg. The toddler stopped, looking at the boy and smiled. Suddenly, the boy said loudly „Cat‰ while pointing at the toddler who was crawling again. What was the boy doing? What made him call the toddler a cat? The boy was trying to understand his surroundings using his past experience. He observed and tried to understand the toddler using the information he had. These are the skills that we are going to explore in this topic, the basic science process skills. These skills occur naturally and we should help children develop their in-born skills. In this topic, you will learn about basic science process skills. This topic focuses on three of the basic science processes: observing; classifying and measuring; and LEARNING OUTCOMES By the end of this topic, you should be able to: 1. State the meaning of basic science process skills; 2. Describe the skill of observing; 3. Differentiate between qualitative and quantitative observations; 4. Describe the skill of classifying; 5. Discuss the binary classification system, the multistage binary classification and serial ordering; and 6. Describe the skill of measuring and using numbers. T T o o p p i i c c 2 2 BasicScience ProcessSkillsI
Transcript
� � ��������������������
� INTRODUCTION
A two years old boy was observing an eight months old toddler crawling happily on the floor. The boy then touched the toddlerÊs head and pulled his leg. The toddler stopped, looking at the boy and smiled. Suddenly, the boy said loudly „Cat‰ while pointing at the toddler who was crawling again. What was the boy doing? What made him call the toddler a cat? The boy was trying to understand his surroundings using his past experience. He observed and tried to understand the toddler using the information he had. These are the skills that we are going to explore in this topic, the basic science process skills. These skills occur naturally and we should help children develop their in-born skills. In this topic, you will learn about basic science process skills. This topic focuses on three of the basic science processes: observing; classifying and measuring; and
LEARNING OUTCOMES
By the end of this topic, you should be able to:
1. State the meaning of basic science process skills;
2. Describe the skill of observing;
3. Differentiate between qualitative and quantitative observations;
4. Describe the skill of classifying;
5. Discuss the binary classification system, the multistage binaryclassification and serial ordering; and
6. Describe the skill of measuring and using numbers.
TTooppiicc��
22 �Basic�Science�Process�Skills�I�
� TOPIC 2 BASIC SCIENCE PROCESS SKILLS I 12
using numbers. You will learn about what these skills are and carry out hands-on activities for each of them.
BASIC SCIENCE PROCESS SKILLS
When we interact with our surroundings, we are implementing processes such as observing, predicting, inferring, measuring, communicating and classifying. These basic science process skills form the foundation of the scientific method. It is the science teachersÊ responsibility to help children develop these skills. Basic science process skills will provide the foundation to master the integrated science process skills. Enhancing basic process skills helps children to become active learners. These skills enable them in formulating questions and help them in discovering the answers. Since problem solving is the essence of scientific investigations, developing basic science process skills among children is essential. Problem solving in science relies heavily on the use of these skills. The basic science process skills have been described in Table 1.2 in Topic 1.
1. List all the information that you are able to gather now in your classroom.
2. Which senses are you using to gather the information mentioned in (1).
TOPIC 2 BASIC SCIENCE PROCESS SKILLS I �
15
QUANTITATIVE AND QUALITATIVE OBSERVATION
Observations can either be qualitative or quantitative. What are qualitative observations and quantitative observations? Some examples of qualitative observations are given below:
(a) It is a hardcover book and yellow in colour
(b) He is the tallest boy in the class, thin and very fair
(c) It sounds like cats are fighting
(d) It tastes like durian
All of the questions above focus on qualitative observations � information or data obtained from your senses. Figure 2.3 shows how qualitative observations can be made.
�
Figure 2.3: Qualitative observations �
2.3
Qualitative observations are observations on the details that we can see, hear, smell, touch and taste. This type of observation gives us information on the colours, smells, textures, sounds, tastes and what is happening. Qualitative observations are made without using specific tools and the descriptions do not involve numbers.
� TOPIC 2 BASIC SCIENCE PROCESS SKILLS I 16
�� Some examples of quantitative observations are given below:
(a) There are 20 students in the bus � 12 boys, 8 girls
(b) The fridge is 1.5m high and 60cm wide
(c) There are three fish in the aquarium which is 60cm long, 40cm wide and 40cm deep
(d) There are two bottles of mineral water and six glasses on the table.
In quantitative observations, measurements are made using instruments such as rulers, balances and graduated cylinders which give us precise information.
USE YOUR SENSES LetÊs go outside. Look at a flower, a hibiscus for an example. Gather as much information as you can about this flower. Use all your senses (Caution: never taste anything unless you are certain that it is not dangerous). Get as much information as you can. Record your observations and state the sense you used for each of the observations.
Observation Sense used
1
2
3
4
Compare your observations with your friends.
ACTIVITY 2.2
Quantitative observations on the other hand uses math, or in other words, include numbers in the descriptions. It is a numerical measurement of a value or quantity. In this type of observation, we usually use tools to count or measure with standard units.
TOPIC 2 BASIC SCIENCE PROCESS SKILLS I �
17
Figure 2.4 shows how quantitative observations are made.
Figure 2.4: Quantitative observation
�
�
Get a magnet from the science room. Examine the magnet thoroughly. List the quantitative and qualitative observations about it. Record your observation and state the sense or the instrument you used for each of it. �
QUALITATIVE
� Observation Sense used
1
2
3
4
�QUANTITATIVE
Observation Instrument used
1
2 � �3 � �4 � �
Compare�your�observations�with�your�friends.�
ACTIVITY 2.3
� TOPIC 2 BASIC SCIENCE PROCESS SKILLS I 18
Some of the observations you might have made are given below:
QUALITATIVE
OObservation Sense used
1 Magnet is U- shaped Sight
2 Feels hard Touch
3 No distinctive odour Smell
4 Red in colour and both ends are white Sight
QUANTITATIVE
OObservation Instrument used
1 Length: 4cm Metric ruler
2 Thickness : 0.7mm Metric ruler
3 Mass : 45g Balance
4 Width: 3cm Metric ruler Observing Change Change happens every day. Objects and phenomena undergo physical or chemical changes over time. In science, description on changes should include statements of observations before, during and after the change occurs. Think about the changes we might observe when we put a cup of rice with two cups of water to simmer and come back after 30 minutes. Yes, definitely we know what will happen to the rice. Have you noticed that different types of rice taste differently and that the size doubles or triples when cooked? We can gather a lot of information using quantitative and qualitative observations throughout the 30 minutes while the rice is cooking. Observe what happens when you cook rice. Fill in your observations in the table below:
QQualitative Observations
Quantitative Observations
Before
During
After
TOPIC 2 BASIC SCIENCE PROCESS SKILLS I �
19
We will now do an activity to observe changes during the burning process of a candle. We have seen candles burning on many occasions, but not many of us have considered the burning of the candle from the scientistÊs point of view. Now get ready with the instruments you need for the following quantitative and qualitative observations.��
��
Now let us light a candle and observe the burning process.
Record your observations before and after the burning process.
Quantitative Observations
BBefore During the burning process
After
1� � �2� � �3� � �4� � �
� � �
Qualitative Observations
BBefore During the burning process
After
1� � � �2� � � �3� � � �4� � � �
� � � �Compare your observations with your friends.
ACTIVITY 2.4
� TOPIC 2 BASIC SCIENCE PROCESS SKILLS I 20
Below are some of the observations you might have made: �
Quantitative Observation
Before During the Process After
1. Mass: 15g
Mass: 13.5g
2. Diameter: 2cm Distance across wax at the widest point: 3cm
3. 15cm long Height of wax at highest point: 14cm
4. Wick extends 2mm above tip of cone
Exposed part of wick protrudes from the wick: 1.5cm
�Qualitative Observation
Before During (Burning) After
1. Colour: Green Wick turns black Colour: Green
2. Cylindrical Shape Flame is elliptical in shape
Solid irregular in shape
3. One end flat, the other end cone shaped with very small portion of white wick (string) at the highest end
Classifying is to arrange or organise according to class or category. When we arrange or organise our clothes, we are classifying them. As a science teacher or scientist, we are very interested in observing and collecting facts. Since there are overwhelming facts gathered, we divide them according to classes, subclasses and so forth. This is for us to comprehend the facts and to get better understanding of the objects and events. Classification is done by observing similarities, differences and interrelationships. The basic requirement of any grouping is that it must be useful. Think of the grouping or classification systems that are used in a school, library and a grocery shop. What if there is no classification system applied? Classifying is something that people do almost every day. Shops classify their goods to suit a specific purpose. We classify our students for the purpose of their learning. Scientists classify animals and plants for the purpose of study. Classification is the process skill central to concept formation. There are several methods of classification. We will now discuss three main types of classification systems that is the binary classification system, the multi-stage binary classification and serial ordering.
2.4.1 Binary Classification System
Binary or binomial classification is the task of classifying the members of a given set into two groups. The basis of classification is whether each member has or does not have a particular property. So, to do this, we have to identify a common property that only some of the members have and group them in one group and those without the property in another group. The classification can also be carried out using more than one property at once, where objects in one group must have all the specified properties to be grouped in the same group.
2.4
� TOPIC 2 BASIC SCIENCE PROCESS SKILLS I 22
ACTIVITY 2.6
Look at the set of mugs in Figure 2.5.
List at least four observable properties of the mugs in the table below. Observe their similarities and differences. In the Yes and No column, write the numbers of the mugs identified with or without the properties
��
Figure�2.5:�Different�types�of�mugs��
OObservable Properties Yes No
1 Example: Mug with pattern 1,2,3 4,5,6
2
3
4
TOPIC 2 BASIC SCIENCE PROCESS SKILLS I �
23
Below are some of the observations you might have made:
OObservable Properties Yes No
1 Mug with pattern 1,2,3 4,5,6
2 Cylindrical shaped 2,3,6 1,4,5
3 With one handle 1,2,3,5,6 4
4 With two handles 4 1,2,3,5,6
The table such as in Activity 2.6 is binary in nature. It sorts items into two groups according to whether the object has the characteristic or not.
(a) MMapping an Organisation Scheme Another way we can present the data is to use a graphic organiser or a map.
From the map we can see that the original set is split into two subsets. See Figure 2.6.
Figure 2.6: Binary classification of mugs
The property used to sort the mugs in this example is whether the mug has a pattern or not. Thus, we can indicate easily which mugs belong to which subset.���
� TOPIC 2 BASIC SCIENCE PROCESS SKILLS I 24
��
(b) UUsing Several (more than one) Properties at Once Instead of using one property or characteristic to classify objects or events,
we can also use more than one property to make a classification. Look at the shoes in Figure 2.7. Observe their similarities and differences.
Can you list down four observable properties of the shoes and group them using two characteristics?
Figure 2.7: Different types of shoes
Study Figure 2.8, which shows an example. What are the observable properties used to classify the shoes? �
ACTIVITY 2.7
1. Draw your own binary classification map to classify the mugs. Use a different property to do the sorting. Compare your map with your friendÊs map.
2. Get a set of six different pencils, bags or wallets. Identify the
properties of the objects. Construct your own binary classification map for the objects.
TOPIC 2 BASIC SCIENCE PROCESS SKILLS I �
25
�
Figure 2.8: Binary classification of shoes��
�
2.4.2 Multi-stage Binary Classification System
The same system used in binary classification system is used to develop a multi-stage classification scheme. The difference is that in a multi-stage binary classification, the subsets in the first layer will be divided again and again, resulting in a hierarchy of sets and subsets. The original set of mugs is divided into two sets as shown in Figure 2.9.
Figure 2.9: Binary classification of mugs
Now, in the first layer we have two sets of mugs: mugs with a pattern (1, 2, 3) and mugs not having a pattern (4, 5, 6). We can perform a binary classification on
Draw your own binary classification map using more than one property to classify the shoes. Use different properties of the shoes in Figure 2.8 to do the sorting.
Compare your map with your friendÊs map.
ACTIVITY 2.8
� TOPIC 2 BASIC SCIENCE PROCESS SKILLS I 26
these sets as what we did to the original set. We can sort the mugs in each set that have a particular property from those that do not have the property. Refer to the map in Figure 2.10 . In the first layer, we have two sets of mugs. In the second layer, we have four sets. Again, classification can be done for the new sets of mugs if we can identify the property that any of the mugs have and other mugs do not have.
Figure 2.10: Multi-stage classification of mugs
Listing all the properties that each object has will help us to classify easily. A multi-stage classification comes to the end when each object in the original set is separated into a category individually. You can make your own map using your own choice of properties to sort the mugs.
TOPIC 2 BASIC SCIENCE PROCESS SKILLS I �
27
2.4.3 Serial Ordering
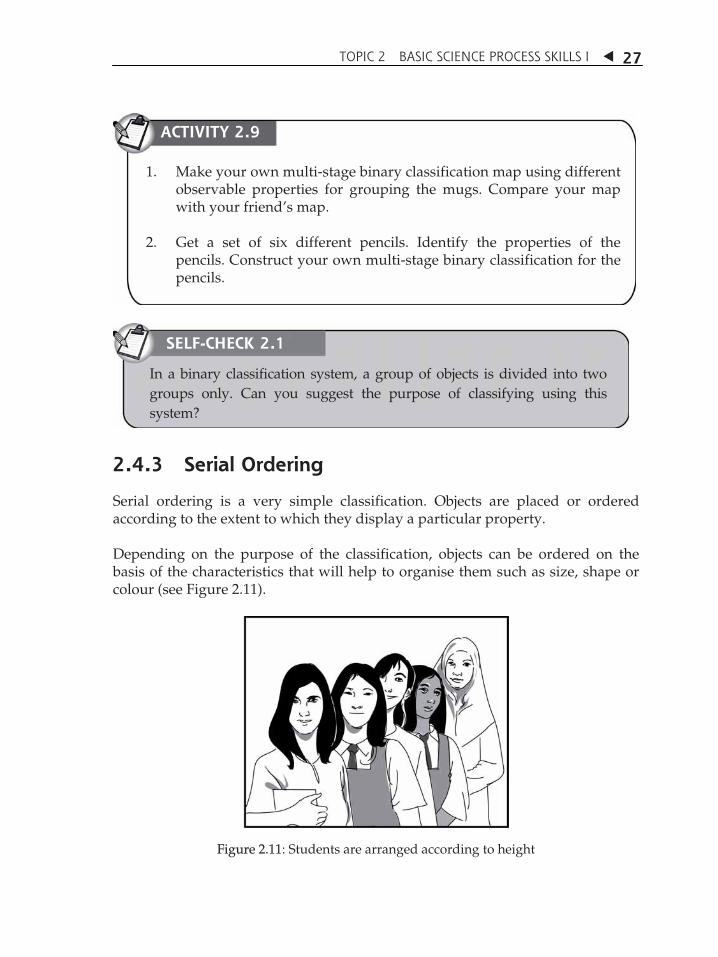
Serial ordering is a very simple classification. Objects are placed or ordered according to the extent to which they display a particular property. Depending on the purpose of the classification, objects can be ordered on the basis of the characteristics that will help to organise them such as size, shape or colour (see Figure 2.11).
Figure 2.11: Students are arranged according to height
SELF-CHECK 2.1
ACTIVITY 2.9
1. Make your own multi-stage binary classification map using differentobservable properties for grouping the mugs. Compare your mapwith your friendÊs map.
2. Get a set of six different pencils. Identify the properties of thepencils. Construct your own multi-stage binary classification for thepencils.
One way to graphically show a serial ordering is with an arrow that is labelled to indicate an increase or decrease in the extent to which items display a certain property. Figure 2.12 shows the serial ordering of the students according to height:
Figure 2.12: Serial order of students according to height
ACTIVITY 2.10
1. Get several packets of different cookies. Examine them and identifyproperties by which the cookies could be arranged in order. State theproperties which can be used to serial order the cookies (e.g: number of calories or amount of iron/calcium/protein per serving)
2. Serial order the cookies using one of the properties identified in (1).Represent the serial order on the arrow shown below:
�
TOPIC 2 BASIC SCIENCE PROCESS SKILLS I �
29
MEASURING AND USING NUMBERS
When we measure, we use numbers. „We ask how much, how many, what size and how long‰ and we need the answers to be in numbers. Measuring is a skill for quantitative observation. Measuring also helps us in classifying and communicating effectively. Measuring and using numbers is part of what we do almost every day. Before the 1970s, we used to measure distance in miles, length in feet and inches, mass in pounds and tons. Today we use the metric system, or Systeme Internationale dÊUnites (international system of units) usually known as SI. One of the advantages of using the metric system is it is a base-10 system and we human beings count in base 10. Multiplying and dividing by 10 is very easy. The metric system also uses prefixes to indicate larger or smaller quantities. Below are examples of frequently used prefixes.
Prefix Prefix Meaning
Tera 1012
Giga 109
Mega 106
Kilo 103
Hecto 102
Deka 10
Deci 10-1
Centi 10-2
Milli 10-3
Micro 10-6
Nano 10-9
Now let us look at how measurements are done for length, mass, volume, temperature and forces using the metric system.
2.5
� TOPIC 2 BASIC SCIENCE PROCESS SKILLS I 30
(a) MMeasuring Length Length is the distance between two points. The fundamental unit of distance, length or displacement is metre (m). Distances shorter or longer than one metre can be described by using the metre prefixes. If your estimates are close to your measurements, you are beginning to think Metric. Originally, the metre was designated as the distance between two scratches on a platinum bar put on display in Paris, France. Now, the metre is defined as the distance a beam of light travelling through a perfect vacuum in 3.33564095 billionths of a second (3.33564095 X 10⁻⁹ second).
(b) How to Read a Metre Ruler
Let us look at the metre rule. The metre is divided into 100 equal parts. Each is called a centimetre (cm). So a hundred centimetres make one metre (100cm = 1 m).
ACTIVITY 2.11
THINK METRIC
1. Get a metre ruler . Observe the length of one metre. Look around and try to locate anything that is about that length. Then use the metre stick to measure its actual length.
2. In pairs, estimate the following lengths to the nearest metre
(a) Length of your table
(b) Height of your table
(c) Height of your stool
(d) Distance from your table to the door
Record your estimates in a table and then measure each length to the nearest metre. Compare your estimates and measurements.
TOPIC 2 BASIC SCIENCE PROCESS SKILLS I �
31
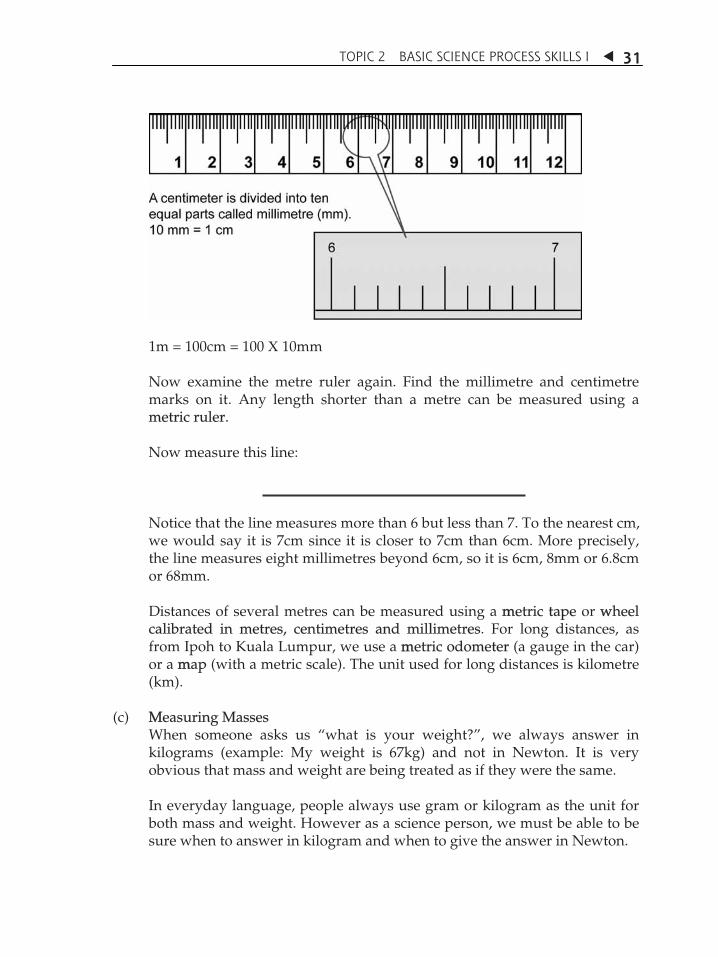
1m = 100cm = 100 X 10mm Now examine the metre ruler again. Find the millimetre and centimetre marks on it. Any length shorter than a metre can be measured using a metric ruler. Now measure this line:
Notice that the line measures more than 6 but less than 7. To the nearest cm, we would say it is 7cm since it is closer to 7cm than 6cm. More precisely, the line measures eight millimetres beyond 6cm, so it is 6cm, 8mm or 6.8cm or 68mm. Distances of several metres can be measured using a mmetric tape or wwheel calibrated in metres, centimetres and millimetres. For long distances, as from Ipoh to Kuala Lumpur, we use a mmetric odometer (a gauge in the car) or a mmap (with a metric scale). The unit used for long distances is kilometre (km).
(c) MMeasuring Masses When someone asks us „what is your weight?‰, we always answer in kilograms (example: My weight is 67kg) and not in Newton. It is very obvious that mass and weight are being treated as if they were the same. In everyday language, people always use gram or kilogram as the unit for both mass and weight. However as a science person, we must be able to be sure when to answer in kilogram and when to give the answer in Newton.
� TOPIC 2 BASIC SCIENCE PROCESS SKILLS I 32
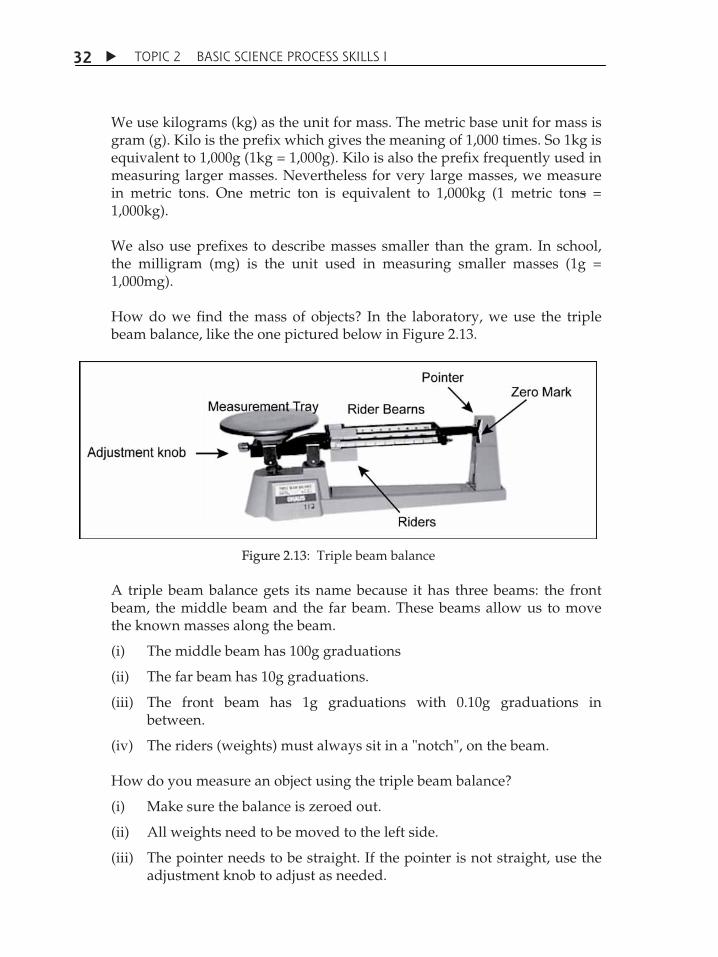
We use kilograms (kg) as the unit for mass. The metric base unit for mass is gram (g). Kilo is the prefix which gives the meaning of 1,000 times. So 1kg is equivalent to 1,000g (1kg = 1,000g). Kilo is also the prefix frequently used in measuring larger masses. Nevertheless for very large masses, we measure in metric tons. One metric ton is equivalent to 1,000kg (1 metric tons = 1,000kg). We also use prefixes to describe masses smaller than the gram. In school, the milligram (mg) is the unit used in measuring smaller masses (1g = 1,000mg). How do we find the mass of objects? In the laboratory, we use the triple beam balance, like the one pictured below in Figure 2.13.
Figure 2.13: Triple beam balance
A triple beam balance gets its name because it has three beams: the front beam, the middle beam and the far beam. These beams allow us to move the known masses along the beam.
(i) The middle beam has 100g graduations
(ii) The far beam has 10g graduations.
(iii) The front beam has 1g graduations with 0.10g graduations in between.
(iv) The riders (weights) must always sit in a "notch", on the beam. How do you measure an object using the triple beam balance?
(i) Make sure the balance is zeroed out.
(ii) All weights need to be moved to the left side.
(iii) The pointer needs to be straight. If the pointer is not straight, use the adjustment knob to adjust as needed.
TOPIC 2 BASIC SCIENCE PROCESS SKILLS I �
33
(iv) Put the object on the pan (measurement tray), and let the balance settle.
(v) Move the 100g weight to see if the object needs that much weight or more.
(vi) Go to the 10g beam and determine the weight needed.
(vii) Go to 1g beam to fine-tune the measurement.
(viii) Find the total mass of the object.
We use the triple beam balance in the laboratory to find the mass of small objects. But how about very large objects or very small objects? What types of balances do we use to find your own mass or the mass of a single vitamin pill?
ACTIVITY 2.12
Get four glass beakers with the capacity of 100ml, 150ml, 250ml and 400ml. Pick each one and try to estimate its mass. Record your estimate in the table. Check your estimates using the triple beam balance and record the actual mass in the table below: �
Beaker� Estimated�masses�
Measured�mass�
100ml� � �
150ml� � �
250ml� � �
400ml� � �
�
� TOPIC 2 BASIC SCIENCE PROCESS SKILLS I 34
Yes, we measure our mass using a scale, and we measure it in kilograms. For objects like cups and beakers we can use a triple beam balance and we measure it in grams. For very small objects like pills we use an equal-arm balance, (Figure 2.14) which is very sensitive, and we measure it in milligrams. Do you have an equal-arm balance in your laboratory?
Figure 2.14: Equal-arm balance
SELF-CHECK 2.2
With two or three of your friends, discuss how you can measure the masses of the following objects in the table.
If we want to measure We should use a Units used to measure
Our own mass (relatively large object)
Mass of a cup (relatively small object)
Mass of a vitamin pill (very small object)
TOPIC 2 BASIC SCIENCE PROCESS SKILLS I �
35
(d) MMeasuring Volumes Have you bought bottles of mineral water before? Can you compare the
different amount of water for different sizes of bottles, say 500ml, 1.5L or 2L? We can see that the litre (symbol l or L) is the unit we use to measure how
much liquid there is in a container. A litre is the amount of liquid that can be held in a container for instance 10cm X 10cm X 10cm.
How are your estimates? As usual, prefixes are used to show very large or very small quantities. In
school, most of the substances we use are relatively small and we always measure volume in terms of millilitres. Do you know how much a millilitre is?
Have you heard of a centicube?
If you filled this cube with water, we would have 1 millilitre of water. Can
you imagine how much a millilitre is now? The symbol for millilitre is mL or ml. 1 ml is equal to 1cm3 (1ml = 1cm3) Thus 1L = 1000cm3 and 1cm3 = 1mL Then 1L = 1000cm3 = 1000mL Now let us get a glass graduated cylinder and pour some water into it. Get another graduated cylinder made from plastic and pour some water into it too. Notice that the upper surface of the water in the glass graduated
� TOPIC 2 BASIC SCIENCE PROCESS SKILLS I 36
cylinder is curved or crescent-shaped. This curved surface is called the meniscus. However, the plastic cylinder will not have a meniscus (see Figure 2.15).
Figure 2.15: Measuring the volume of a liquid in a glass graduated cylinder
The litre is the unit used to measure how much liquid a container can hold. The basic unit to measure the volume of solids or space is the cubic metre or m3.
SELF-CHECK 2.3
How much liquid is contained in each of the following graduatedcylinders?
Answers: A = 6.6ml, B = 73ml, C = 36.5ml, D = 35ml
TOPIC 2 BASIC SCIENCE PROCESS SKILLS I �
37
Can you identify any objects in your room now that measures 1m x 1m x 1m or 1 cubic metre? Measure the volume of your kitchen cabinet and compare it with your friends. For smaller objects, we can use cubic centimetre or cm3. What do we do if we want to measure the volume of an eraser that is irregular in shape? It is almost impossible to measure its volume in cubic metres or to use a ruler to measure its volume. What we can do is to immerse the eraser into the water in a graduated cylinder. We would notice the water rising in the cylinder.
You must be very familiar with these thermometers (see Figure 2.14). The digital thermometer is the easiest to read, as it shows directly the temperature measured. Yet for thermometers B and C, we have to carefully examine the scale, whether they are calibrated in one degree interval or two degrees or five degrees. Both thermometers work using a liquid which will expand when heated, and contract when cooled. There are three temperature scales used today: the Celsius, Fahrenheit and Kelvin. As you can see in Figure 2.17, the digital thermometer, A, measures temperature in 0C (should be read as degrees Celsius), thermometer B and C measure temperature in degrees Fahrenheit and Celsius. The Kelvin scale is the international standard for scientific measurement. In schools, we always use the type C thermometers with a Celsius scale, to measure temperature. Make sure you give the thermometer a few seconds to adjust before reading it. If you use a beaker to heat water for your science activity, make sure that the beaker is safe to heat.
TOPIC 2 BASIC SCIENCE PROCESS SKILLS I �
39
Water boils at 1000C or 2120F and freezes at 00C or 32 0 F. Do you know what the normal body temperature is?
(f) MMeasuring Forces You must be familiar with these scales. What are they for?
Figure 2.18: Spring scales
Weight is a force and a force is measured in Newton (N). But what is a force? In everyday language, a force is either a pull or a push. When we pull a chair, we exert a force on it. When we push a grocery cart in a supermarket, we exert a force on it. Spring scales as shown in Figure 2.18 are used to measure forces. However most of the spring scales outside the science laboratory are calibrated for the accurate measurement of mass, in the location in which they are used. These scales will not give the same reading if they are on the moon. If you were to weigh yourself on scale C here on earth, and then take the same scale to the moon and weigh yourself there, your weight on the moon would be 1/6th your earth weight. Why? We are held on earth by gravity. The gravity pulling on our mass is our weight. Mass is how much stuff we are made of and it is the same wherever we are, but the amount of gravity that acts on us depends on where we are.
TOPIC 2 BASIC SCIENCE PROCESS SKILLS I �
41
That is why, although the mass is the same, the amount of gravity is different, so the force would not be the same. Can you imagine the force of 50N, 100N or 500N?
Are your estimates close to the actual measurements?
� Basic science process skills occur naturally. Observing is the most basic science process skill. The ability to observe is important to the development of other science process skills.
� Observing, is to become aware of, through careful attention the object being
observed using as many senses as we can � sight, hearing, smell, taste and touch.
� Different objects have different properties that characterise them and make
them different from other objects. This information is called evidence or data. � Evidence or data must be accurate and objective. They report exactly what
our senses tell us.
� Thorough observation usually leads to further investigation.
ACTIVITY 2.15
Take a mug, a book and a bunch of keys. Place the objects on your palm and estimate the force exerted by the objects. Record your estimates in the table. Choose a spring scale suitable to measure the weight of the objects and record the measurements in the table. �
Object� Estimated�force� Measured�force�
Mug� � �
Book� � �
A�bunch�of�keys� � �
� TOPIC 2 BASIC SCIENCE PROCESS SKILLS I 42
� Qualitative observations are observations on the details that we can see, hear, smell, touch and taste � giving us information on the colours, smells, textures, sounds, tastes and what is happening around us.
� Quantitative observation is a numerical measurement of a value or quantity.
Often, tools are used to make quantitative observations. � Description on changes should include statements of observations before,
during and after the change occurs. � Classifying, is to arrange or organise according to class or category. � Classification is the process skill central to concept formation. � Binary or binomial classification is the task of classifying the members of a
given set into two groups. The basis of the classification is whether each member has or does not have a particular property. It can also be carried out using more than one property at once.
� The same system used in binary classification system is used to develop
multi-stage classification scheme. � In multi-stage binary classification, the subsets in the first layer will be
divided again and again, resulting in a hierarchy of sets and subsets. � Serial ordering, is a very simple classification � items are arranged or placed
into rank order based on a certain property. � Measuring and using numbers is a skill for quantitative observation. It also
helps in classifying and communicating effectively. � Today we use metric system, or Systeme International dÊUnites which is
usually known as SI Unit. However, some units from other systems are still accepted as a matter of practicality, such as, the time unit of hour and the temperature unit of degree Celsius.
� Prefixes are used to show very large or very small quantities. � Length or displacement is measured in metre (m). � Mass is measured in gram (g).
TOPIC 2 BASIC SCIENCE PROCESS SKILLS I �
43
� Volume is always measured in litre (symbol l or L) not in m3 . A litre is the amount of liquid that can be held in a container 10cm X 10cm X 10cm (1000cm3 = 1L) .
� When measuring the volume of a liquid, line up your eyes with the bottom of
the meniscus. � There are three temperature scales used today: the Celsius, Fahrenheit and
Kelvin. The Kelvin scale is the international standard for scientific measurement.
� Force is measured in Newton (N).
Arrange
Binary classification
Celsius
Changes
Classifying
Count
Fahrenheit
Force
Hear
Kelvin
Length
Litre
Mass
Measure
Metric system
Multi-stage classification
Newton
Observable properties
Observing
Organise
Qualitative observations
Quantitative observations
Prefixes
Serial ordering
Smell
Taste
Temperature
Touch
Volume
� TOPIC 2 BASIC SCIENCE PROCESS SKILLS I 44
How Does a Candle Burn? (n.d) howstuffworks? Retrieved June 16, 2012 from http://home.hhowstuffworks.com/question267.htm Jones, E. & Childers, R. (2001). Contemporary college Physics. (3rd Ed). New
York: McGraw-Hill. Ministry of Education Malaysia (2002). Curriculum specification, Science Year 1. Kuala Lumpur: Pusat Perkembangan Kurikulum Rezba, R.J. et al. (1995). Learning and assessing Science Process Skills. (3rd Ed.). Dubuque, IA: Kendall/Hunt Publishing Company. Science Process Skills - Science Olympiad Student Center. (n.d) Retrieved June
18, 2012 from http://scioly.org/wiki/images/d/d6/Pslsl_training_ hammond04.pdf
Teaching Science Process Skills. Retrieved June 17, 2012, from http://www.nsta.
org/elementaryschool/connections/200712torreshandoutparentnstaconn.pdf Teaching The Science Process skills. Retrieved June 17, 2012, from