35
Larson & Farber, Elementary Statistics: Picturing the World, 3e 1 Topic -2 Probability

Larson & Farber, Elementary Statistics: Picturing the World, 3e 1
Topic -2
Probability

Larson & Farber, Elementary Statistics: Picturing the World, 3e 2
Experiment : An experiment is an act that can be repeated under given condition.
Probability Experiments
Example:Rolling a die and observing the number that is rolled in a probability experiment.
Outcome: The results of an experiment are known as outcome.Sample space: The set of all possible outcomes for an experiment is called sample space.
Example:The sample space when rolling a die has six outcomes.
{1, 2, 3, 4, 5, 6}

Larson & Farber, Elementary Statistics: Picturing the World, 3e 3
An event consists of one or more outcomes and is a subset of the sample space.
Events
Example:A die is rolled. Event A is rolling an even number.
A simple event is an event that consists of a single outcome.
Events are represented by uppercase letters.
Example:A die is rolled. Event A is rolling an even number. This is not a simple event because the outcomes of event A are ………?

Larson & Farber, Elementary Statistics: Picturing the World, 3e 4
Classical (or theoretical) probability is used when each outcome in a sample space is equally likely to occur. The classical probability for event E is given by
Classical Probability
Example 1:A die is rolled. Find the probability of Event A: rolling a 5.
Number of outcomes in event( ) .Total number of outcomes in sample spaceP E
There is one outcome in Event A: {5}1 0.1676 P(A) =
“Probability of Event A.”

Larson & Farber, Elementary Statistics: Picturing the World, 3e 5
Example 1Toss a fair coin twice. What is the probability of observing at least one head?
H1st Coin 2nd Coin Ei P(Ei)
H
T
T
H
T
HH
HT
TH
TT
1/4
1/4
1/4
1/4
P(at least 1 head)
= P(E1) + P(E2) + P(E3)
= 1/4 + 1/4 + 1/4 = 3/4

Larson & Farber, Elementary Statistics: Picturing the World, 3e 6
A bowl contains three M&Ms®, one red, one blue and one green. A child selects two M&Ms at random. What is the probability that at least one is red?
1st M&M 2nd M&M Ei P(Ei)RB
RG
BR
BG
1/61/61/61/61/61/6
P(at least 1 red)
= P(RB) + P(BR)+ P(RG) +P(GR)
= 4/6 = 2/3
m
m
m
mm
m
m
m
m GB
GR
Example 2

Larson & Farber, Elementary Statistics: Picturing the World, 3e 7
Example:1)An unbiased dice is rolled. Find the probability that is shows even number face. 2)Two unbiased dice are drawn simultaneously. Find the probability that sum of the faces is divisible by 3?
3)Two coins are tossed, find the probability that two heads are obtained.
Examples

Larson & Farber, Elementary Statistics: Picturing the World, 3e 8
Empirical (or statistical) probability is based on observations obtained from probability experiments. The empirical frequency of an event E is the relative frequency of event E.
Empirical Probability
Example:A travel agent determines that in every 50 reservations she makes, 12 will be for a cruise.What is the probability that the next reservation she makes will be for a cruise?
Frequency of Event ( ) Total frequencyEP E
12 0.2450 P(cruise) =
fn

Larson & Farber, Elementary Statistics: Picturing the World, 3e 9
Example:The blood groups of 200 people is distributed as follows: 50 have type A blood, 65 have B blood type, 70 have O blood type and 15 have type AB blood. If a person from this group is selected at random, what is the probability that this person has O blood type?
Empirical Probability Examples

Larson & Farber, Elementary Statistics: Picturing the World, 3e 10
Probabilities with Frequency Distributions
Example:The following frequency distribution represents the ages of 30 students in a statistics class. What is the probability that a student is between 26 and 33 years old?
50 – 57 234813
42 – 4934 – 4126 – 3318 – 25
Frequency, fAges
P (age 26 to 33) 830
0.267
30f

Larson & Farber, Elementary Statistics: Picturing the World, 3e 11
Subjective probability results from intuition, educated guesses, and estimates.
Subjective Probability
Example:A business analyst predicts that the probability of a certain union going on strike is 0.15.
Range of Probabilities RuleThe probability of an event E is between 0 and 1, inclusive. That is
0 P(A) 1.
Impossibleto occur
Certainto occurEven
chance
0.5

Larson & Farber, Elementary Statistics: Picturing the World, 3e 12
Complementary EventsThe complement of Event E is the set of all outcomes in the sample space that are not included in event E. (Denoted E′ and read “E prime.”)
P(E) + P (E′ ) = 1
Example:There are 5 red chips, 4 blue chips, and 6 white chips in a basket. Find the probability of randomly selecting a chip that is not blue.
P(E) = 1 – P (E′ ) P (E′ ) = 1 – P(E)
P (selecting a blue chip) 4 0.26715
P (not selecting a blue chip) 4 111 0.73315 15

Larson & Farber, Elementary Statistics: Picturing the World, 3e 13
The mn Rule
If an experiment is performed in two stages, with m ways to accomplish the first stage and n ways to accomplish the second stage, then there are mn ways to accomplish the experiment.This rule is easily extended to k stages, with the number of ways equal to
n1 n2 n3 … nk

Larson & Farber, Elementary Statistics: Picturing the World, 3e 14
Examples
Example: Toss three coins. The total number of simple events is:
Example: Toss two dice. The total number of simple events is:
Example: Toss two coins. The total number of simple events is:
2 2 2 = 8
6 6 = 36
2 2 = 4

Larson & Farber, Elementary Statistics: Picturing the World, 3e 15
Fundamental Counting PrincipleExample
A driver wants to go from city A to B, then to C. If from A to B there 5 different ways and B to C there 6 different ways. Totally are there how many different ways from A to C?
Solution: By mn rule, there are 30 different ways

Larson & Farber, Elementary Statistics: Picturing the World, 3e 16
Permutation
A permutation is an ordered arrangement of objects. Ex: Given 3 people, Bob, Mike and Sue, how many different ways can these three people be arranged
The number of permutations of n elements taken r at a time is
n rP# in the group
# taken from the group
! .( ) !n
n r
Larson & Farber, Elementary Statistics: Picturing the World, 3e 17
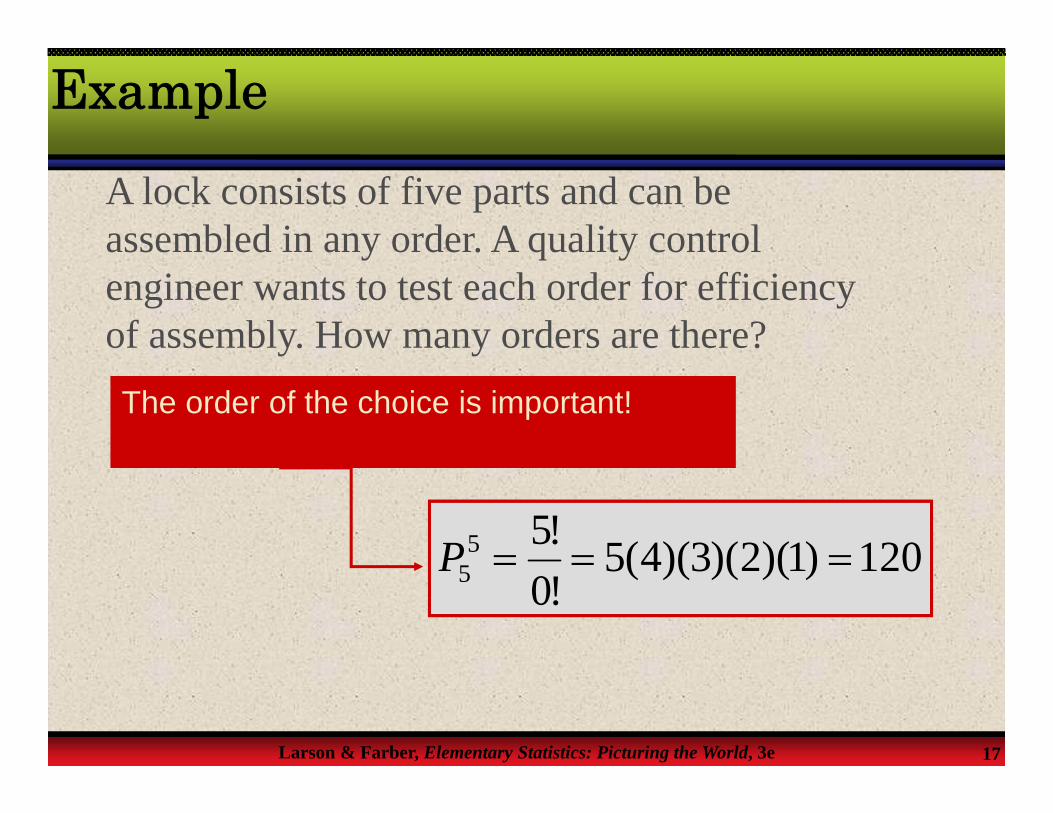
Example
A lock consists of five parts and can be assembled in any order. A quality control engineer wants to test each order for efficiency of assembly. How many orders are there?
120)1)(2)(3)(4(5!0!55
5 P 120)1)(2)(3)(4(5!0!55
5 P
The order of the choice is important!
Larson & Farber, Elementary Statistics: Picturing the World, 3e 18
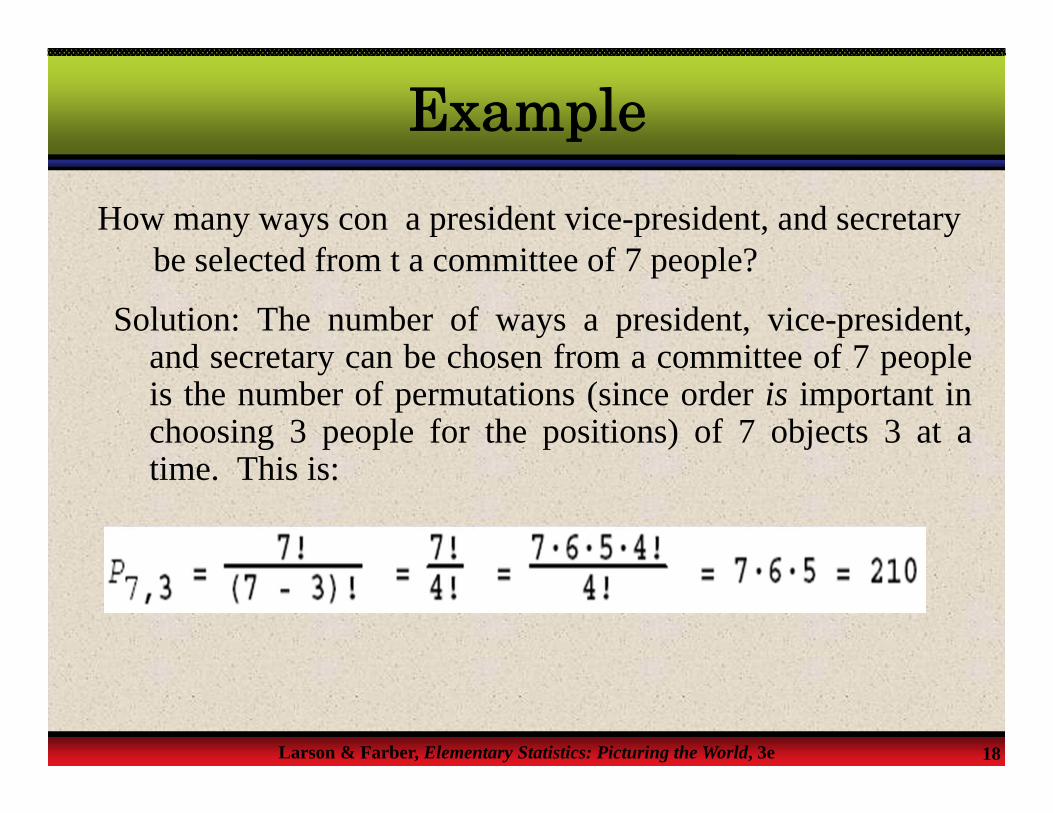
ExampleHow many ways con a president vice-president, and secretary
be selected from t a committee of 7 people?
Solution: The number of ways a president, vice-president,and secretary can be chosen from a committee of 7 peopleis the number of permutations (since order is important inchoosing 3 people for the positions) of 7 objects 3 at atime. This is:

Larson & Farber, Elementary Statistics: Picturing the World, 3e 19
Example:You are required to read 5 books from a list of 8. In how many different ways can you do so if the order doesn’t matter?
A combination is a selection of r objects from a group of n things when order does not matter. The number of combinations of r objects selected from a group of n objects is
Combination
! .( )! !n
n r rnC r# in the
collection # taken from the collection
8 58!= 3!5!C 8 7 6 5!= 3!5!
combinations= 56

Larson & Farber, Elementary Statistics: Picturing the World, 3e 20
Combination Example
How many ways can a 3-person subcommittee be selectedfrom a committee of a seven people?
Solution: The number of ways that a three-personsubcommittee can be selected from a seven membercommittee is the number of combinations (since order isnot important in selecting a subcommittee) of 7 objects 3at a time. This is:

Larson & Farber, Elementary Statistics: Picturing the World, 3e 21
A box contains six M&Ms®, four red and two green. A child selects two M&Ms at random. What is the probability that exactly one is red?
Example
The order of
the choice is
not important! Ms.&M 2 choose toways
15)1(2)5(6
!4!2!66
2 C
M.&Mgreen 1 choose toways
2!1!1!22
1 C
M.&M red 1 choose toways
4!3!1!44
1 C 4 2 =8 ways
to choose 1 red and 1 green M&M.
P( exactly one red) = 8/15

Larson & Farber, Elementary Statistics: Picturing the World, 3e 22
Problem: In a Box of eggs there is 2 bad eggs and 10 goodeggs. If a cake is made of 4 eggs randomly chosen from thebox, what is the probability that a) there are no bad eggs inthe cake b) at least one bad egg in the cake c) having exactly2 bad eggs?
Example:A bag contains 4 white and 6 black balls. If one ball is drawn at random from the bag, what is the probability that isi) black ii) white iii) white and black ?
Example

Larson & Farber, Elementary Statistics: Picturing the World, 3e 23
Independent Event:Two events are independent if the occurrence of one of the events does not affect the probability of the other event. Two events A and B are independent ifP (B |A) = P (B) or if P (A |B) = P (A). OR,Events that are not independent are dependent.Example: Consider tossing a single die 2 times, and define two events:A: Observe a 2 on the first toss; P(A)=1/6B: Observe a 2 on the second toss; P(B)=1/6
Independent Event
( ) ( ). ( )P A B P A P B

Larson & Farber, Elementary Statistics: Picturing the World, 3e 24
Examples which are NOT Independent
Problem: In a shipment of 20 computers, 3 are defective. Three computers are randomly selected and tested. What is the probability that all three are defective if the first and second ones are not replaced after being tested?
Solution:

Larson & Farber, Elementary Statistics: Picturing the World, 3e 25
A conditional probability is the probability of an event occurring, given that another event has already occurred.
P (B |A)
Conditional Probability
“Probability of B, given A”
Example:There are 5 red chips, 4 blue chips, and 6 white chips in a basket. Two chips are randomly selected. Find the probability that the second chip is red given that the first chip is blue. (Assume that the first chip is not replaced.)

Larson & Farber, Elementary Statistics: Picturing the World, 3e 26
Conditional ProbabilityExample:100 college students were surveyed and asked how many hours a week they spent studying. The results are in the table below. Find the probability that a student spends more than 10 hours studying given that the student is a male.
Less then 5 5 to 10 More
than 10 Total
Male 11 22 16 49Female 13 24 14 51Total 24 46 30 100

Larson & Farber, Elementary Statistics: Picturing the World, 3e 27
Example: In a class of 120 Students, 60 studying English,50 are studying French and 20 are studying both Englishand French. If a student is selected at random from thisclass, what is the probability that a) he is studying Englishif it is given that he is studying French?
60
E
20 English
and French50
F Total 120
Conditional Probability

Larson & Farber, Elementary Statistics: Picturing the World, 3e 28
The probability that two events, A and B will occur in sequence is
P (A and B) = P (A) · P (B |A). If event A and B are independent, then the rule can be simplified to P (A and B) = P (A) · P (B).
Multiplication Rule
Example:Two pens are selected, without replacement, from a box that contains 40 pens in which 10 are red and 30 green in color. Find the probability of selecting a red, and then selecting a red pen?.

Larson & Farber, Elementary Statistics: Picturing the World, 3e 29
Example:A die is rolled and two coins are tossed. Find the probability of rolling a 5, and flipping two tails.
Multiplication Rule

Larson & Farber, Elementary Statistics: Picturing the World, 3e 30
Mutually Exclusive
When two events are mutually exclusive or disjoint, theycannot both happen or cannot occur at the same time whenthe experiment is performed. Once event B has occurred,event A cannot occur, so that P(A|B)=0, or vice versa.
When two events are mutually exclusive or disjoint, ( ) 0 ( ) ( ) ( )P A B and P A B P A P B
( ) ( ). ( ) ( ) ( ) ( ) ( ). ( )P A B P A P B and P A B P A P B P A P BWhen two events are independent,

Larson & Farber, Elementary Statistics: Picturing the World, 3e 31
Mutually Exclusive EventsExample:Decide if the two events are mutually exclusive.
Event A: Roll a number less than 3 on a die. Event B: Roll a 4 on a die.
These events cannot happen at the same time, so the events are mutually exclusive.
A1
2
B4

Larson & Farber, Elementary Statistics: Picturing the World, 3e 32
A single letter is chosen at random from the word SCHOOL. Does the probability of choosing an S or an O mutually exclusive?Yes, these events are mutually exclusive since they cannot occur at the same time.
Example:
Mutually Exclusive Events

Larson & Farber, Elementary Statistics: Picturing the World, 3e 33
The Addition RuleThe probability that event A or B will occur is given by
P (A or B) = P (A) + P (B) – P (A and B ).If events A and B are mutually exclusive, then the rule can be simplified to P (A or B) = P (A) + P (B).
Example:You roll a die. Find the probability that you roll a number less than 3 or a 4.

Larson & Farber, Elementary Statistics: Picturing the World, 3e 34
Bayes’ Rule
Let S1 , S2 , S3 ,..., Sk be mutually exclusive events with prior probabilities P(S1), P(S2),…,P(Sk). If an event A occurs, the posterior probability of Si, given that A occurred is
,...k, i SAPSP
SAPSPASPii
iii 21for
)|()()|()()|(
,...k, i
SAPSPSAPSPASP
ii
iii 21for
)|()()|()()|(

Larson & Farber, Elementary Statistics: Picturing the World, 3e 35
ExampleExample: Suppose 49% of the population are female. Of the female patients, 8% are high risk for heart attack, while 12% of the male patients are high risk. A single person is selected at random and found to be high risk. What is the probability that it is a male?
Define H: high risk F: female M: male
61.)08(.49.)12(.51.
)12(.51.)|()()|()(
)|()()|(
FHPFPMHPMP
MHPMPHMP
61.)08(.49.)12(.51.
)12(.51.)|()()|()(
)|()()|(
FHPFPMHPMP
MHPMPHMPWe know:
P(F) =
P(M) =
P(H|F) =
P(H|M) = .12
.08
.51
.49


