Agenda: Toxics Use Reduction to Achieve Enhanced Pollution Prevention Michigan Department of Environmental Quality, August 20, 2015 Topic Description Approx Timing Objectives 1 Introduction to Toxics Use Reduction What is Toxics Use Reduction (TUR)? 45 min • Discuss the evolution and context for toxics use reduction (TUR) • Understand the central role of planning in achieving TUR • Differentiate between TUR, pollution prevention and pollution control, and understand why the differences are important • Identify TUR techniques, and discuss examples of how they can be implemented • Make connection to Michigan’s green chemistry initiatives Pollution Prevention vs Pollution Control Pollution Prevention Hierarchy Toxics Use Reduction Techniques Historical Context for TUR 1970s - Pollution Control and cleanup 1980s - Crisis Management, Liability, and Toxics 1990s - Pollution Prevention 2000s - Emphasis on Management Systems and Higher Hazard Substances TUR and Planning Group Discussion: How can Continual Improvement be Built into the Planning Process? 2 Process Characterization: Process Mapping Introduction to Process Characterization 60 min • Develop a visual representation of a production process • Assess a production process and determine the best way to divide it up into production units • Conduct a chemical pathway analysis of process • Understand units of product and their role in normalizing toxics use • Learn how to create pictorial representation of where toxics enter and leave processes Engaging with the Right Team Process Mapping Chemical Pathway Analysis Defining the Unit of Product Using Existing Process Maps Conducting a Walk-around Small Group Exercise: Creating a Process Flow Diagram for Acme Electronics Break 15 min
Transcript
Agenda: Toxics Use Reduction to Achieve Enhanced Pollution Prevention
Michigan Department of Environmental Quality, August 20, 2015
Topic Description Approx
Timing Objectives
1
Introduction to
Toxics Use
Reduction
What is Toxics Use Reduction (TUR)? 45 min • Discuss the evolution and context
for toxics use reduction (TUR)
• Understand the central role of
planning in achieving TUR
• Differentiate between TUR,
pollution prevention and
pollution control, and understand
why the differences are important
• Identify TUR techniques, and
discuss examples of how they can
be implemented
• Make connection to Michigan’s
green chemistry initiatives
Pollution Prevention vs Pollution
Control
Pollution Prevention Hierarchy
Toxics Use Reduction Techniques
Historical Context for TUR
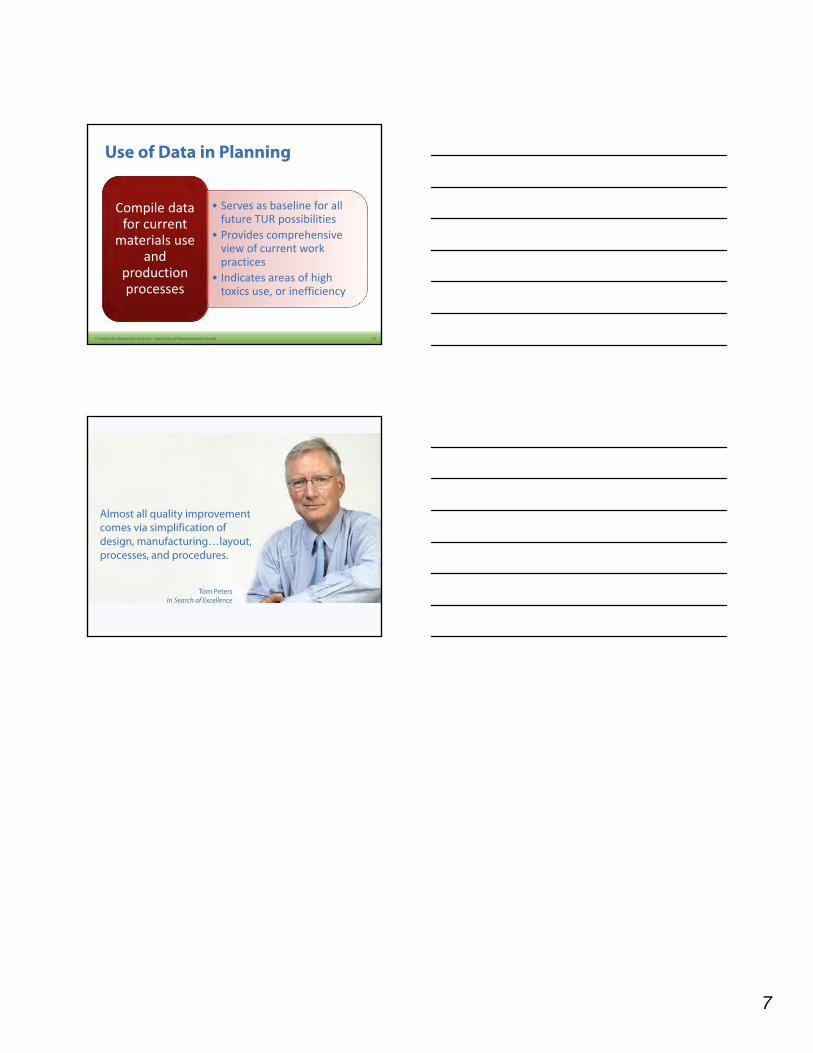
1970s - Pollution Control and cleanup
1980s - Crisis Management, Liability,
and Toxics
1990s - Pollution Prevention
2000s - Emphasis on Management
Systems and Higher Hazard
Substances
TUR and Planning
Group Discussion: How can
Continual Improvement be Built into
the Planning Process?
2
Process
Characterization:
Process Mapping
Introduction to Process
Characterization
60 min • Develop a visual representation of
a production process
• Assess a production process and
determine the best way to divide
it up into production units
• Conduct a chemical pathway
analysis of process
• Understand units of product and
their role in normalizing toxics use
• Learn how to create pictorial
representation of where toxics
enter and leave processes
Engaging with the Right Team
Process Mapping
Chemical Pathway Analysis
Defining the Unit of Product
Using Existing Process Maps
Conducting a Walk-around
Small Group Exercise: Creating a
Process Flow Diagram for Acme
Electronics
Break 15 min
Agenda: Toxics Use Reduction to Achieve Enhanced Pollution Prevention
Michigan Department of Environmental Quality, August 20, 2015
Topic Description Approx
Timing Objectives and Exercises
3
Process
Characterization:
Materials
Accounting
Quantitative Analysis 90 min • Determine how to assess
materials use in a process
• Identify appropriate units of
product
• Differentiate between byproduct
and emission
• Demonstrate and practice mass
balance and materials accounting
techniques
• Describe how to do an inventory
of toxic chemical use and account
for all of the toxic chemicals used
Byproducts and Emissions
Sources of Data/Information
Mass Balances
Materials Accounting Techniques
Individual Exercises: Various
Materials Accounting Scenarios
LUNCH 60 min
4
Identifying TUR
Options
Engaging with a Team 90 min • Understand why it is important to
generate a range of TUR options
• Learn tools and methods to help
you generate TUR options
Toxics Use Reduction Techniques
Sources of Information
Small Group Activity: Identifying
Options at Acme Electronics
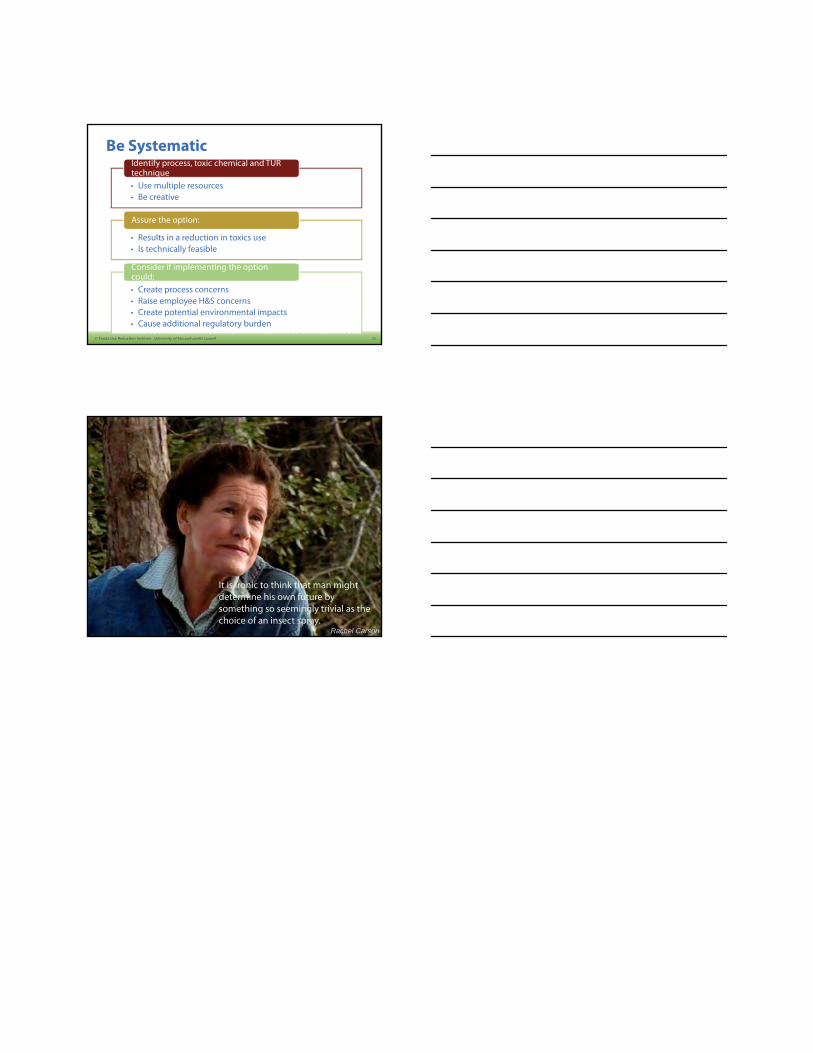
Being Systematic
5
TUR Options
Evaluation and
Alternatives
Assessment
Screening out Options 90 min
• Consider technical, environmental
and human health and safety, and
economic criteria when assessing
the feasibility of TUR options
• Develop appropriate screening
procedures for potential TUR
options
• Conduct appropriately thorough
evaluations of options, including
assessment of safer chemical
alternatives
• Develop systematic procedures
for choosing TUR options to
implement.
Assessing Chemical Substitutions
Safer Alternatives Assessment
Process
Gathering Data on Chemicals
Small Group Exercise: Characterizing
Flux Remover at Acme Electronics
Evaluating Technical Feasibility
Evaluating Economic Feasibility
Small Group Exercise: Performance
and Cost Evaluation of TUR Options at
Acme Electronics
Pilot Testing
The Business Case for
Implementation
Wrap up Group Discussion: How can you bring
TUR into your P2 technical assistance
activities?
30 min • Clarifying questions
• Class Evaluation
Toxics Use Reduction to Achieve Enhanced Pollution Prevention Success August 20, 2015 Massachusetts Toxics Use Reduction Institute University of Massachusetts Lowell 600 Suffolk St, Lowell, MA 01854 www.turi.org
Table of Contents 1 Introduction to Toxics Use Reduction 1
Why Reduce Toxic Chemicals? ................................................................................ 1 1.11.1.1 Potential Health Risks from Toxic Chemical Exposures ................................... 1
1.1.2 Chemicals in the Workplace .............................................................................. 1
What is Toxics Use Reduction? ................................................................................ 2 1.21.2.1 Pollution Prevention vs. Pollution Control ........................................................ 2
Historical Context for TUR ....................................................................................... 4 1.31.3.1 1970s – Pollution Control and Cleanup ............................................................. 4
1.3.4 2000s – Emphasis on Management Systems and Higher Hazard Substances ... 7
The Six TUR Techniques .......................................................................................... 7 1.4 TUR and Planning ..................................................................................................... 8 1.51.5.1 Continuous Improvement in TUR Planning ...................................................... 8
1.5.2 How can continual improvement be built into the planning process? ............... 9
2 Process Characterization: Process Mapping 9
2.1 Introduction to Process Characterization ....................................................................... 9
2.2 Process Mapping ..................................................................................................... 10
2.3 Chemical Pathway Analysis ................................................................................... 12
2.4 Defining the Product ............................................................................................... 14
2.5 Defining the Unit of Product ................................................................................... 14
Using Existing Process Maps .................................................................................. 16 1.62.7 Conducting a Walk-Around .................................................................................... 17
3 Process Characterization: Materials Accounting 18
Introduction to Materials Accounting ..................................................................... 18 3.1 Understanding Materials Accounting...................................................................... 18 3.2 Understanding Byproduct and Emissions ............................................................... 19 3.3 Materials Accounting Techniques ........................................................................... 21 3.43.4.1 Defining the System ......................................................................................... 21
3.4.2 Accounting for Accumulation.......................................................................... 23
3.4.4 Materials Accounting with Mixtures ............................................................... 26
3.4.5 Materials Accounting with Concentrations ..................................................... 27
Gathering Data ........................................................................................................ 28 3.53.5.1 Materials Procurement ..................................................................................... 30
3.5.2 Storage and Handling ....................................................................................... 30
3.5.3 Materials Use ................................................................................................... 30
3.5.4 Integral Recycling (Reuse) .............................................................................. 31
3.5.5 Materials as Byproducts and Emissions .......................................................... 31
3.5.6 Materials as Products ....................................................................................... 32
Chemical Tracking .................................................................................................. 33 3.64 Identifying TUR Opportunities 36
Identifying Options ................................................................................................. 36 4.14.1.1 Brainstorming TUR Options ............................................................................ 36
4.1.2 Information Sources for Alternatives............................................................... 38
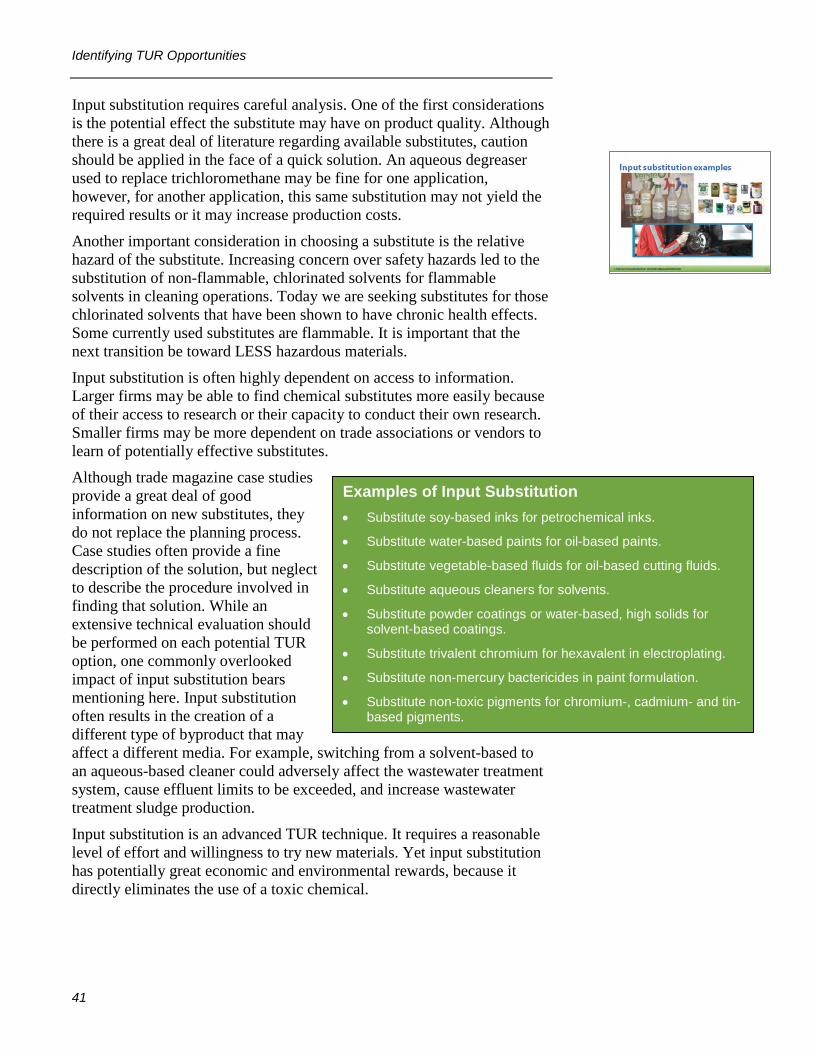
The Six TUR Techniques ........................................................................................ 39 4.24.2.1 Input Substitution ............................................................................................. 40
Being Systematic ..................................................................................................... 48 4.35 TUR Options Evaluation and Alternatives Assessment 48
5.1 Introduction to TUR Options Evaluation ................................................................ 49
5.2 Screening TUR Options .......................................................................................... 49
5.4.3 Pilot Testing TUR Options .............................................................................. 63
5.5 Making the Business Case for Implementing TUR Options ................................... 63
Introduction to Toxics Use Reduction
1
1 Introduction to Toxics Use Reduction
Objectives: After this module participants will be able to:
• Discuss the evolution and context for toxics use reduction (TUR)
• Understand the central role of planning in achieving TUR
• Differentiate between TUR, pollution prevention and pollution control, and understand why the differences are important
• List the six TUR techniques, and discuss examples of how they can be implemented
Why Reduce Toxic Chemicals? 1.11.1.1 Potential Health Risks from Toxic Chemical
Exposures Toxic chemicals used in the workplace have resulted in serious health impacts on workers, the ecosystem and our water, air and land environments. Toxic chemical exposure is not merely associated with chemical use in manufacturing. A few examples of other exposure scenarios include:
• Dry cleaning shops have used perchloroethylene, a carcinogen and reproductive and developmental toxicant, for years. Perchloroethylene releases from these operations have resulted in wide-scale contamination of drinking water resources.
• Methylene chloride has been used in a wide variety of industrial and non-industrial activities – in vapor degreasers, as a blowing agent for urethane foam, a solvent carrier for adhesives, and for paint stripping during refinishing of autos, furniture and other household products. At least 14 workers have died since 2000 just as a result of using methylene chloride-based strippers during refinishing of bathtubs.
• Workers in beauty salons are often exposed to an array of hazardous chemicals – including toluene, styrene, di-butyl phthalate and formaldehyde – that can cause everything from skin rashes and headaches to cancer and liver damage.
1.1.2 Chemicals in the Workplace Chemical production and use in the U.S. economy has expanded dramatically for decades. The Bureau of Labor Statistics estimates over a $1.2 trillion increase in the value of U.S. chemical output between 2000-
Introduction to Toxics Use Reduction
2
2020. In addition, the range and diversity of chemical products is expanding as companies innovate to meet commercial opportunities or requirements.
The strength of U.S. chemical production obviously provides major benefits to the economy in general. It is important to recognize, however, the hazards of chemicals for those working with them and for the environment. For some of the most toxic of these chemicals, the only adequate protection is a transition to safer alternatives.
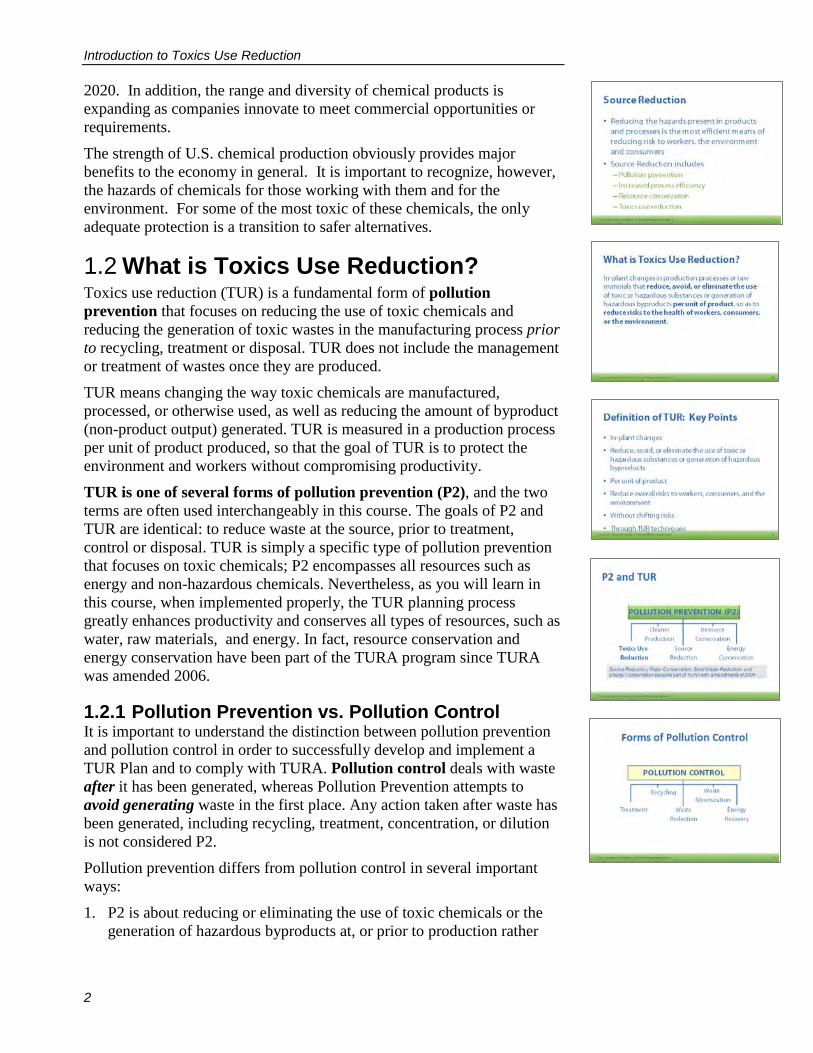
What is Toxics Use Reduction? 1.2Toxics use reduction (TUR) is a fundamental form of pollution prevention that focuses on reducing the use of toxic chemicals and reducing the generation of toxic wastes in the manufacturing process prior to recycling, treatment or disposal. TUR does not include the management or treatment of wastes once they are produced.
TUR means changing the way toxic chemicals are manufactured, processed, or otherwise used, as well as reducing the amount of byproduct (non-product output) generated. TUR is measured in a production process per unit of product produced, so that the goal of TUR is to protect the environment and workers without compromising productivity.
TUR is one of several forms of pollution prevention (P2), and the two terms are often used interchangeably in this course. The goals of P2 and TUR are identical: to reduce waste at the source, prior to treatment, control or disposal. TUR is simply a specific type of pollution prevention that focuses on toxic chemicals; P2 encompasses all resources such as energy and non-hazardous chemicals. Nevertheless, as you will learn in this course, when implemented properly, the TUR planning process greatly enhances productivity and conserves all types of resources, such as water, raw materials, and energy. In fact, resource conservation and energy conservation have been part of the TURA program since TURA was amended 2006.
1.2.1 Pollution Prevention vs. Pollution Control It is important to understand the distinction between pollution prevention and pollution control in order to successfully develop and implement a TUR Plan and to comply with TURA. Pollution control deals with waste after it has been generated, whereas Pollution Prevention attempts to avoid generating waste in the first place. Any action taken after waste has been generated, including recycling, treatment, concentration, or dilution is not considered P2.
Pollution prevention differs from pollution control in several important ways:
1. P2 is about reducing or eliminating the use of toxic chemicals or the generation of hazardous byproducts at, or prior to production rather
Introduction to Toxics Use Reduction
3
than limiting the discharge of wastes at the property line of an industrial facility.
2. P2 is about planning and goal setting with an eye toward the efficient use of materials in production rather than about regulations, permits and licenses, which may take time from designing efficient production systems.
3. P2 is about continuous improvement rather than about merely compliance with environmental regulations. It encourages firms to set reasonable goals, and after meeting them, to reset the goals for further improvements.
4. P2 is about real reductions of toxic chemical use and toxic chemical waste, rather than shifting the risk of chemical exposure between population groups (e.g. workers or consumers) or environmental media (air, water and soil).
P2 is about incorporating goals into an effective management system that includes:
• Defining responsibilities • Providing resources • Taking corrective actions if goals are not met • Reviewing periodically • Managing changes or new developments
1.2.2 Pollution Prevention Hierarchy In 1990, with the passage of the Pollution Prevention Act, the U.S. Environmental Protection Agency (EPA) developed a formal definition of pollution prevention and a strategy for making P2 a national priority. The strategy established a hierarchy to guide national policy:
• Pollution should be prevented or reduced at the source whenever feasible.
• Pollution that cannot be prevented should be recycled in an environmentally safe manner whenever feasible.
• Pollution that cannot be prevented or recycled should be treated in an environmentally safe manner whenever feasible.
• Disposal or other release into the environment should be employed only as a last resort and should be conducted in an environmentally safe manner.1
1 (Source: Henry F. Habicht II, Memorandum: EPA Definition of Pollution Prevention. U.S. Environmental Protection Agency, May 28, 1992.)
Introduction to Toxics Use Reduction
4
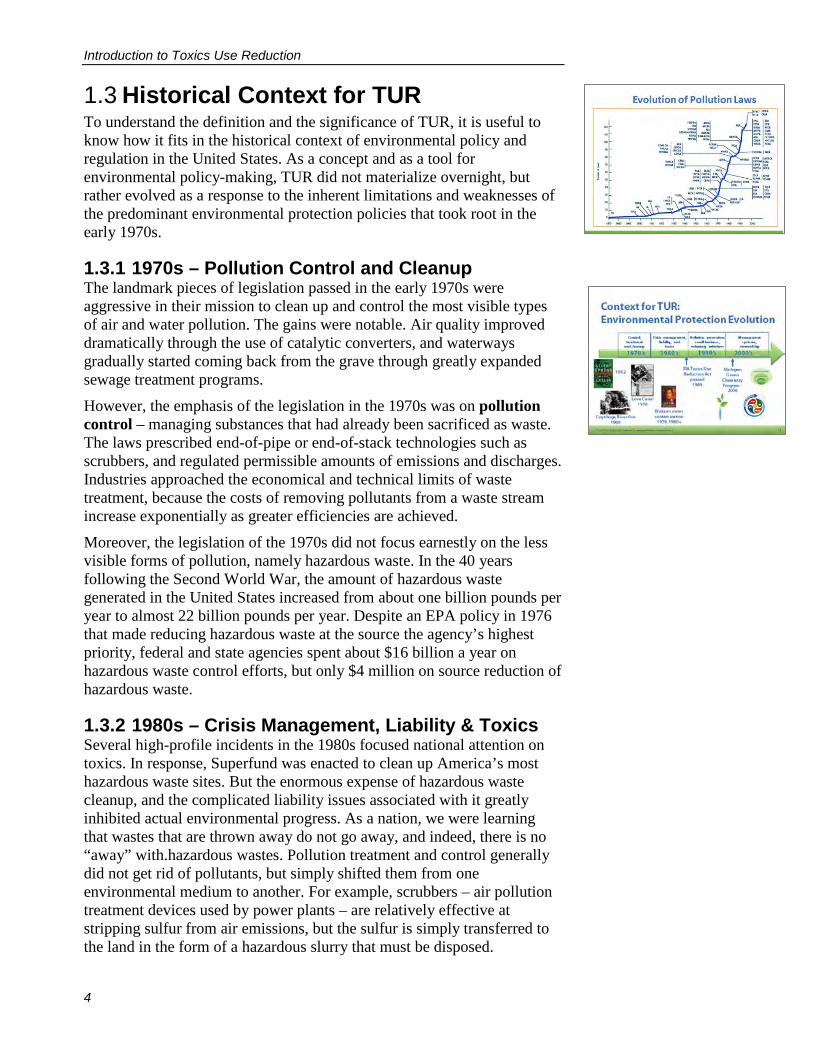
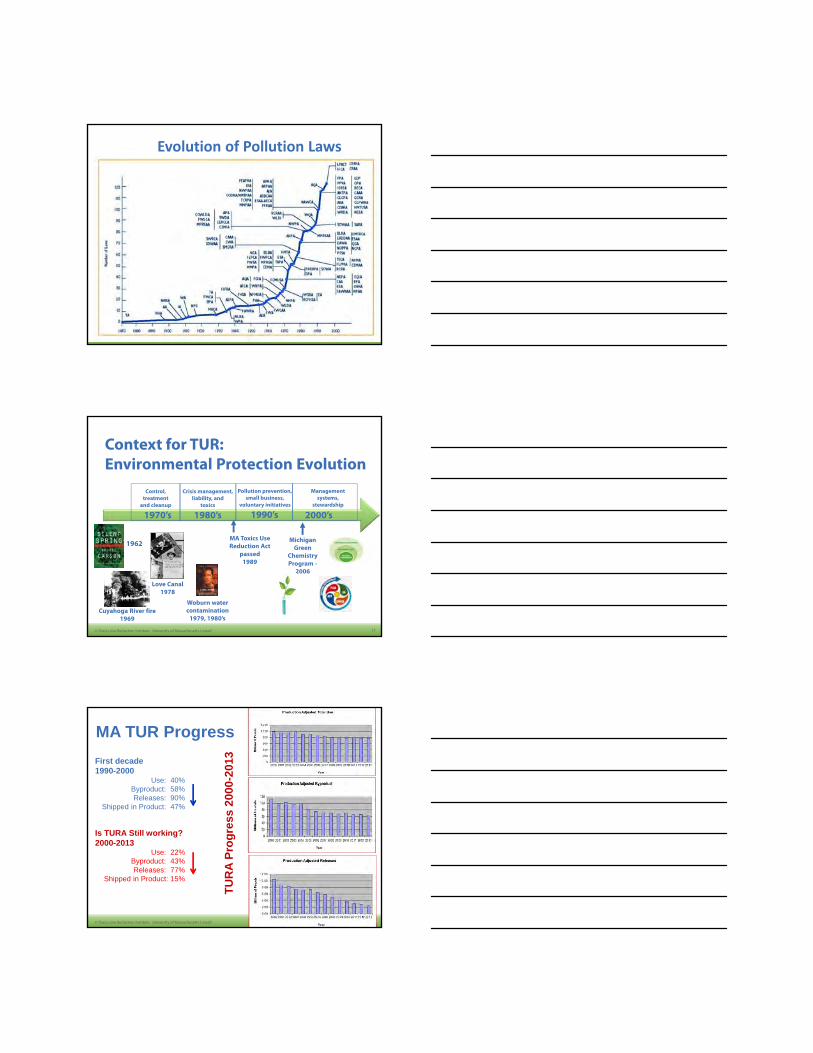
Historical Context for TUR 1.3To understand the definition and the significance of TUR, it is useful to know how it fits in the historical context of environmental policy and regulation in the United States. As a concept and as a tool for environmental policy-making, TUR did not materialize overnight, but rather evolved as a response to the inherent limitations and weaknesses of the predominant environmental protection policies that took root in the early 1970s.
1.3.1 1970s – Pollution Control and Cleanup The landmark pieces of legislation passed in the early 1970s were aggressive in their mission to clean up and control the most visible types of air and water pollution. The gains were notable. Air quality improved dramatically through the use of catalytic converters, and waterways gradually started coming back from the grave through greatly expanded sewage treatment programs.
However, the emphasis of the legislation in the 1970s was on pollution control – managing substances that had already been sacrificed as waste. The laws prescribed end-of-pipe or end-of-stack technologies such as scrubbers, and regulated permissible amounts of emissions and discharges. Industries approached the economical and technical limits of waste treatment, because the costs of removing pollutants from a waste stream increase exponentially as greater efficiencies are achieved.
Moreover, the legislation of the 1970s did not focus earnestly on the less visible forms of pollution, namely hazardous waste. In the 40 years following the Second World War, the amount of hazardous waste generated in the United States increased from about one billion pounds per year to almost 22 billion pounds per year. Despite an EPA policy in 1976 that made reducing hazardous waste at the source the agency’s highest priority, federal and state agencies spent about $16 billion a year on hazardous waste control efforts, but only $4 million on source reduction of hazardous waste.
1.3.2 1980s – Crisis Management, Liability & Toxics Several high-profile incidents in the 1980s focused national attention on toxics. In response, Superfund was enacted to clean up America’s most hazardous waste sites. But the enormous expense of hazardous waste cleanup, and the complicated liability issues associated with it greatly inhibited actual environmental progress. As a nation, we were learning that wastes that are thrown away do not go away, and indeed, there is no “away” with.hazardous wastes. Pollution treatment and control generally did not get rid of pollutants, but simply shifted them from one environmental medium to another. For example, scrubbers – air pollution treatment devices used by power plants – are relatively effective at stripping sulfur from air emissions, but the sulfur is simply transferred to the land in the form of a hazardous slurry that must be disposed.
Introduction to Toxics Use Reduction
5
In 1989 the EPA released the first reports from the Toxics Release Inventory (TRI), a national survey of industrial chemical releases established under the Emergency Planning and Community Right to Know Act of 1986. The data revealed a much larger volume of pollutants released to the environment than any of the previous estimates. One important point was becoming increasingly clear: it is better to prevent waste in the first place than to clean it up later.
1.3.3 1990s – Pollution Prevention By 1990, the concept of pollution prevention was catching on. Congress passed the Pollution Prevention Act (P2 Act) in 1990, which established an administrative base and information-tracking capacity for pollution prevention at the EPA. The P2 Act also provided funding for states to develop their own pollution prevention programs.
In 1989, Massachusetts passed the Toxics Use Reduction Act (TURA), a statute intended to promote safer and cleaner production, and enhance the economic viability of Massachusetts firms. TURA was the first law of its kind in the United States. Whereas traditional environmental regulations focused on controlling emissions and releases of pollutants to the environment, TURA promoted preventive strategies. Toxics use reduction (TUR) was predicated on the simple realization that it is better to avoid generating pollution in the first place than to try to treat it or manage it later.
In 1989, this was a bold, new way of thinking. It represented a fundamental shift in policy-making since 1970, when environmental regulations focused on specific pollutants after they were released to the environment.
By 1996, every state in the U.S. had at least one pollution prevention program to assist companies in reducing waste. Most P2 Programs provided outreach and developed technical resources to help companies reduce waste at the source. By the end of the 1990s, an impressive amount of useful pollution prevention information had been developed, most of which is accessible on the Internet.
The Advent of TUR – The term toxics use reduction was coined in Massachusetts during informal discussions among environmental advocates who were searching for a new policy approach to reducing the release of toxic chemicals. At the time, the Massachusetts Department of Environment Protection (MassDEP) estimated that Massachusetts firms generated 500 million pounds of toxic wastes each year. More than a thousand hazardous waste sites had been identified in the state, and more than fifty communities had lost part of their drinking water supplies to toxic chemical contamination.
Meanwhile, the costs of managing and disposing of hazardous wastes and the specter of future liability from mismanaged wastes were becoming an increasingly heavy burden for industry.
In 1989, Massachusetts became the first
state in the country to pass a law that
required companies to develop plans for reducing pollutants.
Introduction to Toxics Use Reduction
6
The concept of toxics use reduction was introduced in bills in both the 1987 and 1988 state legislative sessions. In 1989 members of the Massachusetts business community and representatives of the environmental and public health communities sat down to negotiate a bill that would be acceptable to all parties. After four and a half months of intensive negotiations, consensus was reached on a bill that was passed unanimously by both chambers of the Massachusetts legislature. The Governor signed the bill into law on July 24, 1989.
Today, TURA has become a model for pollution prevention legislation nation-wide and globally. Unlike most environmental legislation that typically mandates control technology and prescribes pollution “limits,” TURA facilitates reductions in toxics by providing mechanisms for companies to establish their own programs and their own reduction goals. Voluntary Prevention Programs – Throughout the 1990s, the EPA sought to encourage pollution prevention through various voluntary initiatives. One of the first voluntary programs was the 33/50 Program, an ambitious program that encouraged the nation’s largest polluters to cut their releases to 33% and then to 50% from 1988 levels by 1992 and 1995, respectively. The program was so successful it spurred other voluntary and public-private partnership approaches such as:
• Design for the Environment • Energy Star • National Environmental Performance Track • National Partnership for Environmental Priorities
Companies embraced the voluntary initiatives because they enjoyed the incentives – such as regulatory flexibility in achieving limits, and in some cases, public recognition – and they preferred the non-confrontational relationship with the EPA and other regulatory agencies. Meanwhile, parallel developments were taking place internationally. Several European countries established public-private programs focused on the development and adoption of “clean technologies” that use less or no toxic chemicals. The United Nations has established the International Cleaner Production Information Clearinghouse to disseminate the concepts of pollution prevention and clean technologies around the world.
Perhaps the most well known voluntary initiative from the 1990s was the International Organization for Standardization (ISO) 14001 standard, adopted in 1996 and updated in 2004. Companies can become ISO certified by developing, implementing and maintaining an Environmental Management System (EMS), a mechanism for tracking, assessing, and continually improving environmental performance. An EMS under ISO 14001 is just one type of environmental management system that companies can develop.
Increasing evidence shows that some toxics
can be dangerous to humans and the environment even in small quantities.
When implemented properly, the TUR
planning process not only results in a
reduction in the use of toxics, it can also enhance productivity
and conserve all types of resources.
Introduction to Toxics Use Reduction
7
Governments realized throughout the 1990s that, while the threat of regulatory enforcement was still necessary to protect the environment, it could be successfully augmented through effective voluntary initiatives.
1.3.4 2000s – Emphasis on Management Systems and Higher Hazard Substances
The trend toward voluntary initiatives still continues today. The environmental management system model encourages companies to go beyond basic regulatory requirements and even beyond TUR as they strive toward environmental sustainability, and to track their performance improvement.
Other state and foreign environmental policies have also been on the rise. California’s Proposition 65 has been a success in reducing the use toxic chemicals by requiring businesses to disclose information to the public if there are toxics in the product or service that the business is providing. European’s Registration, Evaluation, Authorisation and Restriction of Chemicals (REACH) is like no other environmental policy in the US, because REACH requires industry to register and evaluate their new chemical for a product or service before its use. In addition to REACH, Europe has the Restriction of Hazardous Substances Directive (RoHS), which deals with so-called e-waste, or discarded electronic and electrical products.
As a result of these trends, US companies should be aware of these regulations, because today it’s a global economy, and the TURplanning process can help.
The Six TUR Techniques 1.4How does a company reduce the use of toxics? There are six techniques for achieving toxics use reduction:
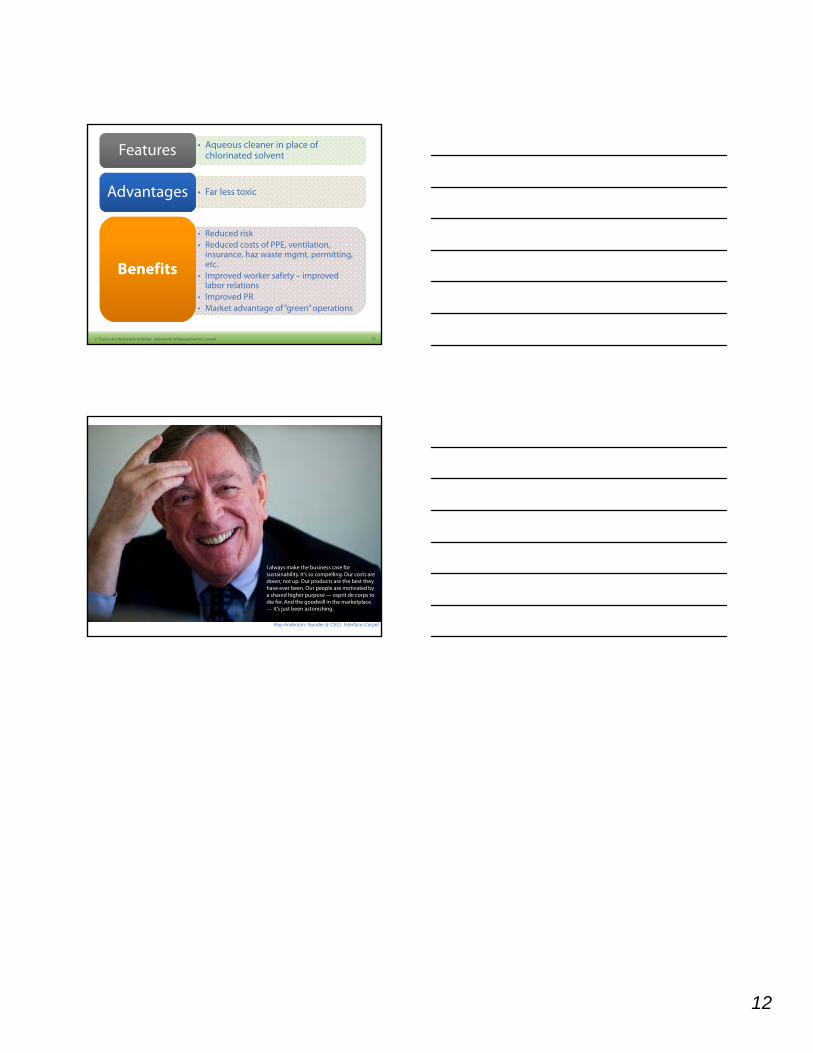
1. Input substitution: replacing a toxic substance or raw material used in a production unit with a non-toxic or less toxic substance. Examples include:
• Soy-based inks instead of oil-based inks in printing • Aqueous cleaners instead of solvents
2. Product reformulation: reformulating or redesigning end products to be nontoxic or less toxic upon use, release, or disposal. Examples include:
• Making latex paint instead of oil paint • Making unbleached paper instead of bleached paper
3. Production unit redesign or modification: using production units of a different design than those used previously. Examples include:
The TUR framework provides a useful
and logical foundation for companies to develop an
environmental management
system (EMS).
Introduction to Toxics Use Reduction
8
• Electrostatic paint spray instead of solvent-based paint • Ozonation instead of chlorine for corrosion control
4. Production unit modernization: upgrading or replacing production unit equipment or methods. Examples include:
• Continuous closed system instead of batch process • Counter-current rinsing instead of single rinse tank
5. Improved operation and maintenance: modifying existing equipment or methods by such steps as improved housekeeping, system adjustments, or process/product inspections. Examples include:
• Computerized inventory control, spill prevention program • Floating covers on heated baths to prevent evaporation
6. Integral recycling: using equipment or methods that are integral to the production unit. Examples include:
• Hard-piped recycling system • Closed-loop, refrigerated condensation of vapors
TUR and Planning 1.5TUR planning is a process that involves a team of employees representing various departments within a company, each with different responsibilities and/or areas of expertise. The planning process involves:
• Examining how toxic chemicals are manufactured, processed, or otherwise used, and how byproducts are generated.
• Identifying TUR techniques. • Evaluating the technical and economic feasibility of potential TUR
techniques. The TUR planning process is designed to complement a facility’s existing planning processes as much as possible. TURA does not specify how to plan, leaving companies free to develop whatever planning process and format works for them.
1.5.1 Continuous Improvement in TUR Planning There are four basic steps in a continual improvement process: plan, implement, evaluate, and review. The TUR planning process is not intended to be static. The review and update process is meant to facilitate further reductions in toxics use and byproduct generation through continual improvement. In this way, the cycle may be more appropriately viewed as an upward spiral, rather than a flat circle.
Introduction to Toxics Use Reduction
9
1.5.2 How can continual improvement be built into the planning process?
Continual improvement can be built into the planning process by: • Building and maintaining a strong TUR planning team. The
planning team should become a standing part of the ongoing management of the facility.
• Scheduling periodic reviews. A schedule should be established in the plan for periodic reviews and reports.
• Building in methods to evaluate and reevaluate performance. The performance of the TUR projects should be periodically assessed against the expected technical and financial returns. The results of these evaluations should not be couched in terms of successes or failures but, rather, in terms of lessons learned and future opportunities.
2 Process Characterization: Process Mapping
Objectives: After this module participants will be able to:
• Develop a visual representation of a production process
• Assess a production process and determine the best way to divide it up into production units
• Conduct a chemical pathway analysis of a process
• Distinguish between products, processes, and production units
2.1 Introduction to Process Characterization
The heart of the planning process is the process characterization.
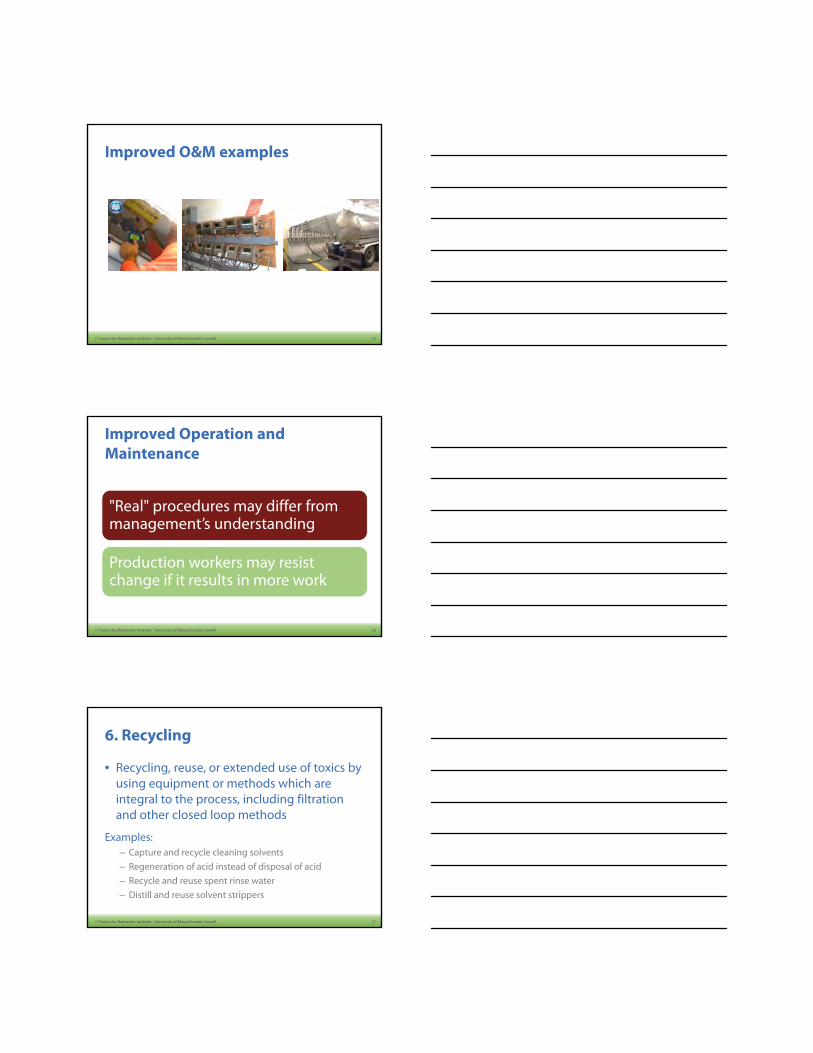
There are three steps to completing a process characterization: Process Mapping, Production Unit Information, and Materials Accounting. Process characterization is the basis for the rest of the TUR planning process, so it is crucial to be thorough in this area. If the processes are not carefully characterized from the outset, the planning process will be very difficult. The data developed in this stage will help determine the toxics used and the byproducts generated, thereby enabling the company to identify TUR opportunities.
Process Mapping
10
2.2 Process Mapping Aa process flow diagram is a visual representation of the movement of the toxic chemical through the processes within a facility. Process flow diagrams can vary considerably in their format and the level of detail they provide.
At a minimum, a process flow diagram must represent all the steps through which material inputs pass to form a product, and the point at which toxics enter the system and leave the production unit (for example, as product, byproduct, emissions, or releases, such as fugitive emissions). It can also include waste treatment activities and non-integral recycling. Process flow diagrams may also include information such as energy inputs, non-toxic material flow and labor inputs.
For most manufacturing processes, the simple process flow diagram may not be acceptable or useful because it is too general. It may not provide enough information about specific byproduct and emission releases. Also, the process flow diagram used in TUR planning should pay special attention to several steps often neglected in traditional process flow diagrams, such as:
• Materials storage and handling • Equipment maintenance and repair • Byproducts released to the environment as fugitive emissions,
spills and leaks
Process Flow Diagrams help foster a shared understanding of production processes that is comprehensive and intuitive. Most people find a graphical representation of production to be easier to understand. Thus, Process Flow Diagrams help facilitate discussion and decision making. TUR Process Flow Diagrams show immediately where toxic substances enter and leave the production process, create a basis for determining financial costs for toxics use, as well as forming the basis for planning improvements. Process Flow Diagrams are superior to other types of process documentation, such as checklists or outlines, because they readily indicate the sequence of operations and the relationships of process elements to one another.
Most production units are linear or continuous. Materials are introduced at one end, flow through the process, and emerge as finished products at the other end. Figure 2A presents a continuous-flow process flow diagram for one process in a pulp and paper production facility.
Process Mapping
11
Figure 2A. Process Flow Diagram for a Pulp and Paper Production Facility (continuous flow)
Digester
Shredder & Bin
Flash Tank
Washing &
Screening, Knotting, Beating
Washing & Screening
Decker (Thickener)
Refiner
Cleaner
Screen
Calender
Bleaching
Forming
Barker
Chipper
Press Section
Drier Section
Winding, Cutting & Trimming
Logs
Paper
Elect.
Elect.
Elect.
Elect.
Elect.
Elect.
Elect.
Elect.
Elect.
Elect.
Elect.
Elect.
Elect.
Elect.
Elect.
Waste Chips Steam
Chemicals Elect. Water Steam
Water
Water
Water
Water Chemical Additives
Air Steam
Waste Water
Waste Water
Water
White Water
Exhaust
Condensation
Condensation
Water & Chemicals
Water & Screen Rejects
Steam
Lime Kiln & Mud Concentrator
Fuel Flue Gas
Slaker Causticier
White Liquor
Direct Contact Evaporator
Multiple Evaporators
Flue Gas Steam
Water
Air
Black Liquor
Steam CW
Cond. Vapor
CW
Vapor
Process Mapping
12
Some productions, like paint making, occur in batch processes. Batch processing, where several operations are carried on in one container, require more careful attention in constructing a process flow diagram because the actual steps are not spatially separated. Figure 2B presents a process flow diagram for a simple paint manufacturing line.
2.3 Chemical Pathway Analysis TURA requires that a process flow diagram represent the movement of each toxic through the production unit. This is often referred to as chemical pathway analysis, and it involves tracing the flow of each toxic material from the point of introduction into the production unit through to the point it is released from the production unit, either as a product, byproduct or emission.
Figure 2B. Batch Process Flow Diagram: Paint Manufacturing Process
Spills
M M
Fill & Mix Empty & Clean
Paint Residues
To Recycle
F
Filling
Shipping/ Storage
Filtration
Product Container
Water Additives Solvents
Resins
Spills Spent Bag Filters
Process Mapping
13
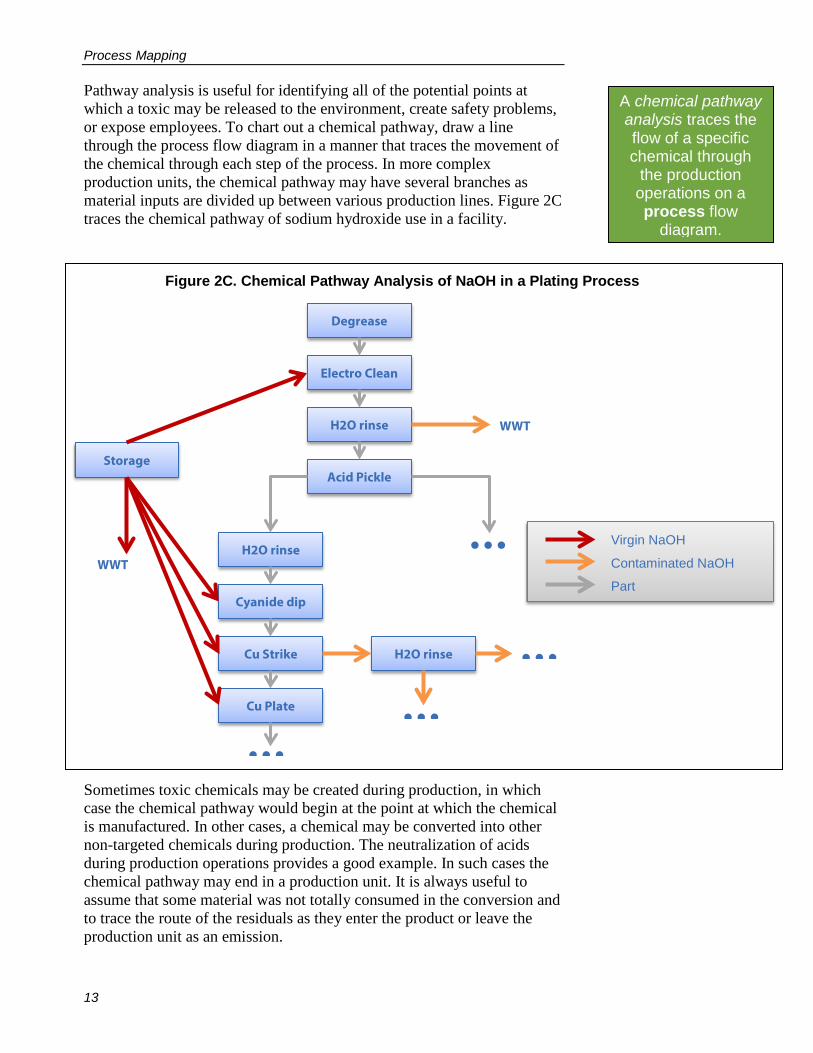
Pathway analysis is useful for identifying all of the potential points at which a toxic may be released to the environment, create safety problems, or expose employees. To chart out a chemical pathway, draw a line through the process flow diagram in a manner that traces the movement of the chemical through each step of the process. In more complex production units, the chemical pathway may have several branches as material inputs are divided up between various production lines. Figure 2C traces the chemical pathway of sodium hydroxide use in a facility.
Sometimes toxic chemicals may be created during production, in which case the chemical pathway would begin at the point at which the chemical is manufactured. In other cases, a chemical may be converted into other non-targeted chemicals during production. The neutralization of acids during production operations provides a good example. In such cases the chemical pathway may end in a production unit. It is always useful to assume that some material was not totally consumed in the conversion and to trace the route of the residuals as they enter the product or leave the production unit as an emission.
A chemical pathway analysis traces the flow of a specific chemical through
the production operations on a process flow
diagram.
Figure 2C. Chemical Pathway Analysis of NaOH in a Plating Process
Degrease
Electro Clean
H2O rinse
Acid Pickle
H2O rinse
Cyanide dip
Cu Strike
Cu Plate
Storage
H2O rinse
WWT
WWT
Virgin NaOH
Contaminated NaOH
Part
Process Mapping
14
2.4 Defining the Product The most fundamental unit of process characterization is the product. A product is the outcome of a production process. The easiest way to think of products is to list the items conventionally identified as such in the accounting, inventory, or manufacturing processes. Some products, such as fountain pens or dolls, are quite obvious. In other cases a product might be a service or a result, such as washed clothes or repaired measuring devices.
What is an intermediate product? An intermediate product is any item that leaves one production process bound for another. These include products shipped off-site, transferred between on-site production processes, or moved to storage as an intermediate step in the production of a final product. For instance, an object that has been primed and sent to storage before final painting could be identified as an intermediate product. In TURA reporting, intermediate products are simply considered as products.
What is a family of products?
In some cases product is defined in terms of families of either products, intermediate products, or results, where each use the same toxic chemicals, produce the same toxic chemicals in the waste stream, or are interchangeable; or, simply, where the firm considers all the results the same product.
A firm may identify a family of products as a product if it produces many different colors of paint or different sizes of switches (all products of the same processes using the same chemicals), or different types of cleaning (using the same chemicals). A firm may not consider as a family of products a group of transformers made on the same production line but containing different toxic constituents.
What is a result?
Some toxic chemical users do not produce products in the conventional sense. An industrial uniform dry cleaner produces a service or result: a cleaned uniform. A firm may annually clean its pipes with a toxic chemical. The cleaned pipe is a result of the cleaning process. Such results can in certain instances be considered a product.
2.5 Defining the Unit of Product When measuring toxics use reduction, the selected measure must be normalized against the level of production in order to guarantee that changes in chemical use reflect true toxics use reduction and not simply reductions due to decreases in the level of production. Therefore the
Process Mapping
15
output of a production unit needs to be represented by some metric that accurately reflects the level of production.
TURA requires that firms identify an appropriate unit of product in order to standardize these measures. A unit of product is some measure of product output that is directly related to the level of production.
The law leaves firms free to define their own unit of product. Careful attention should be given to defining an appropriate unit of product, because future efforts to report success in toxics use reduction will be affected by the unit of analysis you have selected. In selecting a unit of product, try to pick a measure of facility productivity that closely reflects all activities involving the listed toxic chemicals. Defining an appropriate unit of product is not always obvious. For instance, a plastic bag manufacturer may want to define the “number of plastic bags” as the unit of product. But if this manufacturer produces a variety of plastic bags ranging from thin ones made up of one layer of plastic film to others made up of many layers of plastic film, the firm may wish to define “pounds of plastic film” as the appropriate unit of product. A unit of product should be some kind of physical measure. A non-physical measure can be used as a unit of product, but care must be taken in normalizing all measures. For example, dollar sales as a unit of product should be corrected for the influence of inflation.
Good examples of units of product are: • Gallons of paint manufactured • Square centimeters of jewelry plated • Pounds of nails manufactured
In choosing a unit of product, the operative question should be: Is the magnitude of chemical use and byproduct generation per unit of product relatively constant for all products and production levels within the production unit? If the answer is yes, then the unit of product will serve as a reliable standard for measuring TUR progress. It will provide a measure that is unaffected by shifts in the rates at which various products are made.
Process Mapping
16
Using Existing Process Maps 1.6Many plants, particularly larger production facilities, have on-site process flow diagrams. These may be fairly comprehensive diagrams that were completed at the time the facility was built or they may be diagrams specific to a particular piece of equipment or production unit. Such diagrams may exist as:
• Vendor-supplied operating manuals • Process engineer’s layout diagrams • Architect’s facility plans • Piping and instrument diagrams • Critical path management diagrams, or work flow diagrams
Such “found” process flow diagrams can be of great benefit in characterizing production units. At the same time, these diagrams should never be trusted to reveal everything necessary to conduct effective TUR planning. Too often the diagrams are outdated by shop floor adaptations that have altered and improved the equipment or routines. Always validate
ILLUSTRATION: UNIT OF PRODUCT The Difficulty of Defining a Unit of Product
Semiconductor manufacturing offers complexities in determining the unit of product since most processing involves silicon wafers, not individual chips. Although there are numerous chips on a single wafer, not all the chips end up being functional. The quantity of substances used in semiconductor manufacturing relates more to the number of silicon wafers processed than to the number of chips produced. Thus, a decision can be made to use “silicon wafers processed” as a unit of product instead of “semiconductor chips produced.”
Unfortunately, the complexity is not resolved by using “silicon wafers processed” as the unit of product since there is variability in:
• wafer size—4-, 2-, 6-inch and • masking layers—10, 13, 20 Depending on the processing technology employed, the wafer size and number of masking layers changes. Also, the number of masking layers increases the amount of toxic chemicals used.
A Creative Solution The wafer size problem can be corrected by using “square inches of silicon processed” instead of number of wafers processed. The masking layer variable can be accounted for by using a complexity factor.
The complexity factor is directly related to the number of masking layers. As the technology becomes more advanced, more components can be put on a single chip. This requires more layers on a wafer and, in turn, more chemical usage per wafer. The complexity factor is multiplied by square inches of silicon to give a unit of product that relates more to the actual chemical usage.
Example: 10 layers ————— factor = 1.0
12 layers ————— factor = 1.2
(Adapted from a paper by Rose Sweeney, Dow Chemical)
Process Mapping
17
the “found” diagrams with an on-site review of the equipment or procedures.
2.7 Conducting a Walk-Around A walk-around review is a process by which the planning team gains visual familiarity with the plant and the production units of interest. A comprehensive walk around can provide several benefits to a planning team. These include opportunities:
• To bring all team members equally up-to-date on the plant operations
• To document and verify the process flow diagrams • To identify other plant personnel who might have specific
knowledge or options ideas • To identify potential options for toxics reduction
Carrying around copies of the relevant process flow diagrams may be useful during the walk-around in order to effectively associate the diagrams with the equipment and to verify the diagrams with the actual operations. It may be useful to schedule several walk-throughs to account for shift or seasonal variations in production and to review cleaning, maintenance, or repair procedures as well as direct production operations.
Schedule the initial walk-around when all or most all of the production units are in operation. Carefully check the diagrams against the layout and functioning of the equipment. Take notes on problem areas that appear as well as ideas that occur to you on options to reduce the use of toxic chemicals.
Talk to those with shop floor experience. Employees often have ideas or information that can be highly useful in properly characterizing production units or identifying options to reduce risk.
It may be useful to include some employees or shop stewards as you con-duct the tour. Ask employees about maintenance and repair procedures and schedules. Seek information about length of time materials are in stockrooms or storage areas. Carefully chart how materials and products are transported about the facility.
At the conclusion of the walk-around, have someone write up the findings of the tour. Note the areas where questions arose so as to identify further information needs. Also note the spontaneous ideas that arose about how to reduce the use of toxic chemicals or how to improve the efficiencies of material or energy use.
In larger facilities conducting a couple of walk-arounds at different times may be useful to assure a solid understanding of the production processes.
Materials Accounting
18
3 Process Characterization: Materials Accounting
Objectives: At the end of this chapter participants will be able to:
• Determine how to assess materials use in a production unit
• Differentiate between a byproduct and an emission
• Demonstrate mass balance and materials accounting techniques
• Describe how to do an inventory of toxic chemical use and account for all of the toxic chemicals used
Introduction to Materials Accounting 3.1The quantitative aspect of process characterization is known as materials accounting.
Materials accounting quantifies the total inputs and outputs of a given toxic chemical in the production unit and, ultimately, facility-wide usage. Input data generally describes the quantity of chemical used in the production unit. Output data describes the amount of a toxic chemical that leaves as product, is lost as byproduct, is treated on-site, and is released or transferred off-site..
Understanding Materials Accounting 3.2Materials accounting helps you understand where and how substances are used, where opportunities exist for reductions in use and how to quantify the costs of using toxic chemicals. Using materials accounting techniques, you can determine how much of each toxic chemical was used, where it was used, and its fate – whether it was shipped in or as product, if it was destroyed (or created) in the process or if it became byproduct.
Materials Accounting vs. Mass Balance The terms materials accounting and mass balance are sometimes used interchangeably. They are related, but they have slightly different meanings.
Materials accounting simply means tracking carefully the amount and location of material entering or leaving a system, such as a production unit or the facility as a whole.
A mass balance is a mathematical technique frequently used to achieve materials accounting. It is based on the principle that, in a closed system, “in” must equal “out;” it often involves solving several simultaneous equations to find an unknown quantity. An example of a mass balance calculation is provided in this module.
Materials Accounting
19
Understanding Byproduct and 3.3Emissions
Three things can happen to a reportable chemical after it enters a production unit:
1. It can become a product or part of one.
2. It can be consumed or transformed in the process.
3. It can become a byproduct.
A byproduct is any non-product output before handling, transfer, treatment or release. Generally, byproduct can be thought of as waste from the process.
An emission is a release to the environment or a transfer to an off-site location of a toxic substance. In other words, an emission is a byproduct that crosses the facility boundary. Figure 3A is a process flow diagram of a plating operation that illustrates this concept. Byproducts A1, S1, S2, and W2 become emissions when they cross the facility boundary.
While all emissions are byproducts before they cross the facility boundary, not all byproducts become emissions. For example, in Figure 3A, the byproduct in W1 is not necessarily equal to the total byproduct in W2 and S2. Byproduct can be created or destroyed in a treatment process. The following three examples represent possible scenarios for a process involving wastewater treatment such as in Figure 3A.
Scenario #1: The wastewater treatment for this plating operation is a dewatering process. In this case, byproduct is neither created nor destroyed. Therefore, the byproduct in W1 is equal to the byproduct in W2 and S2.
Scenario #2: In this scenario, the plating process involves a cyanide bath and W1 contains cyanide byproduct. The treatment process includes the addition of cyanide destruct water treatment chemicals. As a result of the destruction of cyanide byproduct, the byproduct in W2 and S2 is less than the byproduct in W1.
Scenario #3: The wastewater treatment process in this scenario results in the creation of nitrates and therefore the byproduct in W2 and S2 is greater than the byproduct in W1.
Materials Accounting
20
Figure 3B is a process flow diagram of a production unit with non-integral recycling, such as the simple distillation of solvent. During simple distillation, solvent wastes (R1) are heated, driving off the solvent in vapor form. The vapor is reverted back to liquid form in the condenser, collected and reused. The still bottoms, or waste remaining in the bottom of the still, are then collected and sent off-site for treatment or disposal (R2). R1 is greater than R2, so the total solvent byproduct generated is greater than the emissions of solvent. Simple distillation units are run in batches. Therefore, it is necessary to record the batch size and the number of batches per year in order to calculate the quantity of byproduct R1.
Figure 3A. Byproduct Example: Production Unit with Waste Water T reatment
S2 (byproduct)
Rinse Tank Solvent tank Plating tank
Facility boundary
Production Unit A
A1 (emission)
Product
A1 (byproduct)
S1 (emission) S1 (byproduct)
R2 (emission)
Figure 3B. Byproduct Example: Production Unit with Non - Integral Recycling
Recycle Unit
R1 (byproduct)
R2 (byproduct) R1 > R2
Materials Accounting
21
Figure 3C illustrates a production unit with integral recycling of solvent, such as with a hard-piped thin film evaporator. Thin film evaporators distill by running a thin film of dirty solvent down a heated cylindrical vessel where it is vaporized. The vapors are collected and condensed back into liquid form for reuse. Thin film evaporators are generally suited for use in high volume, continuous processes.
In this integral recycling example, byproduct R1 is not counted because a hard-piped, continuous recycling process is used. The still bottoms (R2) are counted as byproduct and emission.
Materials Accounting Techniques 3.4A mass balance is an accounting technique that equates the materials put into a process with the materials released by the same process. A mass balance is represented by the mass conservation principle:
3.4.1 Defining the System To conduct a mass balance, a system must first be identified and encircled by an imaginary envelope. A “system” may range in size from a single tank in a plating line, to a production unit, or to the entire facility. Then all materials that pass into or out of the envelope are identified and accounted for over a specified period of time. At the close of the time period the materials that remain accumulated inside the envelope are measured.
No matter how large or small the envelope, the material “in” must equal the material “out” plus accumulated material inside the defined system. Any discrepancy between inputs and outputs plus accumulation indicates unaccounted material flows or errors in measurements.
Materials In = Materials Out + Materials Accumulated
Rinse Tank Solvent tank Plating tank
Facility boundary
Production Unit A
A1 (emission)
Product
A1 (byproduct)
S1 (emission) S1 (byproduct)
R2 (emission)
Figure 3C. Byproduct Example: Production Unit with Integral Recy cling
Recycle Unit
R1 (byproduct)
R2 (byproduct) R1 > R2
Materials Accounting
22
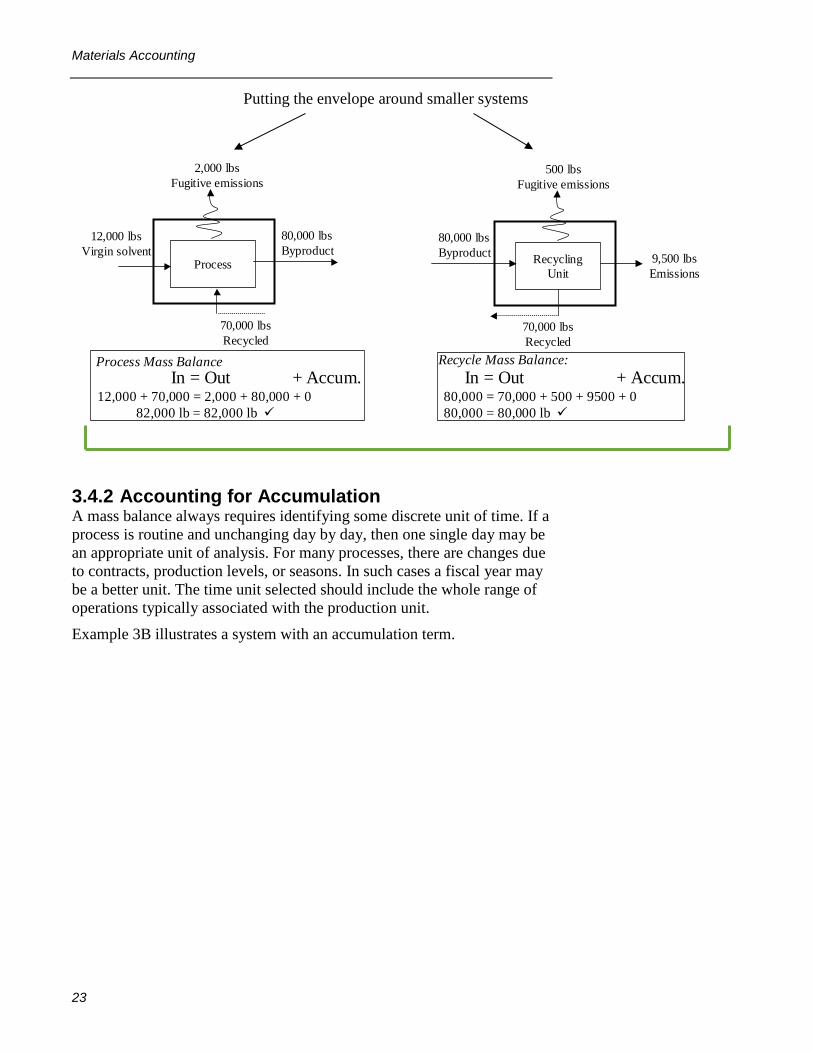
Example 3A illustrates the basic principles of a mass balance “envelope.” In this example, the envelope is first drawn around a production unit, then individually around the “process” and “recycling” steps of the production unit. In all three cases, the mass of material “in” equals the mass of material “out.” This must always be the case when accumulation is zero. It is important not to confuse the amount of material being recycled as being “accumulated;” nothing is being accumulated in this system since the amounts entering and leaving the envelope are equal.
When conducting a mass balance, it is important to define the mass balance envelope carefully. The envelope should be drawn around the process rather than a larger group of areas or a building that may contain functional elements unrelated to the process.
Process Recycling Unit
Production Unit A
500 lbs Fugitive emissions
12,000 lbs Virgin solvent 9,500 lbs
Emissions
70,000 lbs Recycled
80,000 lbs Byproduct
2,000 lbs Fugitive emissions
In = Out + Accum . 12,000 = 2,000 + 500 + 9500 + 0 12,000 lb = 12,000 lb
Production Unit Mass Balance:
Example 3A. Mass Balance: Defining the System
Materials Accounting
23
3.4.2 Accounting for Accumulation A mass balance always requires identifying some discrete unit of time. If a process is routine and unchanging day by day, then one single day may be an appropriate unit of analysis. For many processes, there are changes due to contracts, production levels, or seasons. In such cases a fiscal year may be a better unit. The time unit selected should include the whole range of operations typically associated with the production unit.
Example 3B illustrates a system with an accumulation term.
Process
12,000 lbsVirgin solvent
70,000 lbsRecycled
80,000 lbsByproduct
2,000 lbsFugitive emissions
In = Out + Accum.12,000 + 70,000 = 2,000 + 80,000 + 0
82,000 lb = 82,000 lb
Process Mass Balance
RecyclingUnit
500 lbsFugitive emissions
9,500 lbsEmissions
70,000 lbsRecycled
80,000 lbsByproduct
In = Out + Accum.80,000 = 70,000 + 500 + 9500 + 080,000 = 80,000 lb
Recycle Mass Balance:
Putting the envelope around smaller systems
Materials Accounting
24
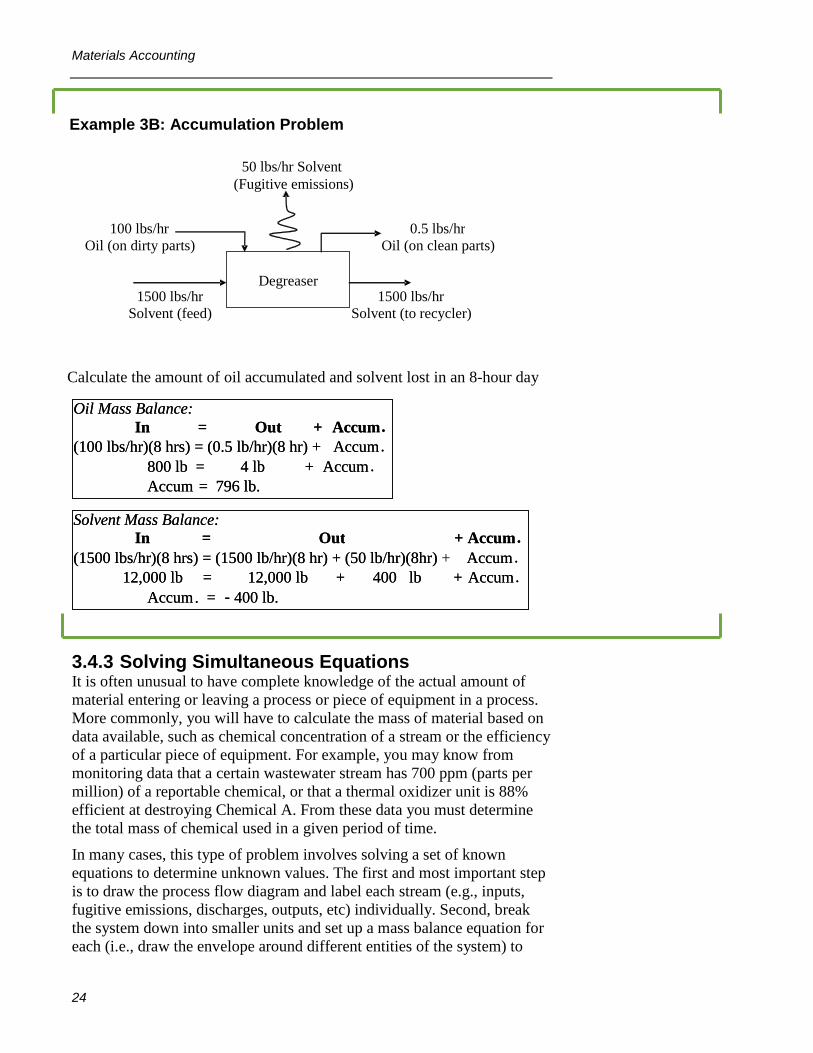
3.4.3 Solving Simultaneous Equations It is often unusual to have complete knowledge of the actual amount of material entering or leaving a process or piece of equipment in a process. More commonly, you will have to calculate the mass of material based on data available, such as chemical concentration of a stream or the efficiency of a particular piece of equipment. For example, you may know from monitoring data that a certain wastewater stream has 700 ppm (parts per million) of a reportable chemical, or that a thermal oxidizer unit is 88% efficient at destroying Chemical A. From these data you must determine the total mass of chemical used in a given period of time.
In many cases, this type of problem involves solving a set of known equations to determine unknown values. The first and most important step is to draw the process flow diagram and label each stream (e.g., inputs, fugitive emissions, discharges, outputs, etc) individually. Second, break the system down into smaller units and set up a mass balance equation for each (i.e., draw the envelope around different entities of the system) to
Degreaser
50 lbs/hr Solvent (Fugitive emissions)
0.5 lbs/hr Oil (on clean parts)
1500 lbs/hr Solvent (to recycler)
In = Out + Accum . (1500 lbs/hr)(8 hrs) = (1500 lb/hr)(8 hr) + (50 lb/hr)(8hr) + Accum .
Calculate the amount of oil accumulated and solvent lost in an 8-hour day
Example 3B: Accumulation Problem
Materials Accounting
25
determine all the known and unknown quantities. Third, solve the equations simultaneously – that is, substitute the known quantities into equations with unknown quantities. Finally, check your work to ensure that all the equations balance and that the quantities make sense. This technique is illustrated in Example 3C.
Example 3C. Solving Simultaneous Equations to Achieve Mass Balance Fresh glycol ethers are fed into a photoresist application unit at a rate of 110 pounds per hour. Monitoring data show that 15% of the glycol ether stream evaporates as fugitive emissions. The remainder is sent through a filtration unit and then recycled back into the photoresist unit after being mixed with the fresh feed stream. However, the filtration unit is only 95% efficient and the unfiltered glycol ethers are sent to the POTW for treatment.
STEP 1: Draw a process flow diagram of this scenario and label it carefully. This is probably the most important step.
STEP 2:
Determine equations and unknowns. (As long as there are as many or more equations than unknowns, the problem can be solved).
6 variables, 5 unknowns 6 equations Fresh feed F = 110 lbs/hr (1) F = E + W Input stream I (2) I = E + D Dirty stream D (3) D = (0.850)(I) Waste stream W (4) W = (0.050)(D) Emissions E (5) E = (0.150)(I) Recycle R (6) R = (0.950)(D)
STEP 3: Substitute equations where necessary and solve until all variables are known.
Materials Accounting
26
Substitute Equation (3) into Eq. (4): W = (0.050)(0.850)(I) W = (0.0425)(I) Substitute this result and Eq (5) into Eq (1) F = (0.0425)(I) + (0.150)(I) F = 110 lb/hr = (0.1925)(I) I = 571 lb/hr Solve other Equations for remaining variables E = (0.150)(571 lb/hr) = 85.7 lb/hr D = (0.850)(571 lb/hr) = 485 lb/hr W = (0.050)(485 lb/hr) = 24.3 lb/hr R = (0.950)(485 lb/hr) = 461 lb/hr STEP 4: Check to ensure the solutions balance and make sense. F = E + W 110 lb/hr = 85.7 lb/hr + 24.3 lb/hr = 110 lb/hr I = F + R 571 lb/hr = 110 lb/hr + 461 lb/hr = 571 lb/hr
3.4.4 Materials Accounting with Mixtures A very common type of calculation is determining the mass of a reportable chemical based on its composition in a mixture. For example, a Safety Data Sheet (SDS) indicates that a paint used in your facility contains 45% of a reportable chemical. This may either be a percentage by volume or by weight.∗ For example, 45% by volume means that in every 100 gallons of paint, there are 45 gallons of chemical. Likewise, if it were percent by weight, it would mean in every 100 pounds of paint there would be 45 pounds of chemical.
To calculate the amount (in pounds) of the chemical used it is important to know how the percentage is expressed because the overall densities of the paint and the chemical may vary, thereby providing different results. This is demonstrated in Example 3D.
∗ The technically correct term is “percentage by mass,” but “percentage by weight” is commonly used.
Materials Accounting
27
Example 3D. By-Volume vs. By-Weight Calculations A screen printer used 4500 gallons of ink in a year. The MSDS indicates that the ink contains 55% methyl ethyl ketone (MEK). The specific gravity of the ink is given as 1.2. The specific gravity of MEK is 0.81. How much MEK is used if the percentage is by-volume? How much is used if it is by-weight?
SOLUTION: To convert a substance from gallons to pounds, the density of water, 8.34 lb/gal, is multiplied by the specific gravity – the density of the substance relative to water. The key to solving this problem is knowing which specific gravity value to use and when to use it.
By-Volume Calculation For every hundred gallons of ink, there are 55 gallons of MEK, so in 4500 gallons of ink, there are 2475 gallons of MEK: (4500 gal ink)(0.55 gal MEK/gal ink) = 2480 gal MEK Now convert gallons to pounds: (2480 gal MEK)(8.34 lb/gal)(0.81) = 17,000 lb MEK By-Weight Calculation For every hundred pounds of ink, there are 55 pounds of MEK. First convert gallons of ink to pounds of ink: (4500 gal ink)(8.34 lb/gal)(1.2) = 45,000 lb ink Now determine the percentage of the ink that is MEK: (45,000 lb ink)(0.55) = 25,000 lb MEK
3.4.5 Materials Accounting with Concentrations Another common materials accounting calculation is determining the amount of byproduct or emission based on monitoring data such as wastewater discharges, or airflow measurements. Concentration data are often presented in terms of parts per million (ppm). The key is converting a concentration such as ppm, which is unit-less, into pounds.
A stack monitoring problem is presented in Example 3E to illustrate this type of problem.
Specific gravity of ink Density of water
Density of water Specific gravity of MEK
Materials Accounting
28
Example 3E. Stack Monitoring Data Problem Calculate the amount of benzene (in lbs) that is emitted through a stack in a year, given the following data: Volumetric flow rate = 34 ft3/hr Concentration = 4500 ppm M.W. = 78.1 Hours of Operation: 6000 hrs/year STEP 1: Determine mass per volume The molecular weight of benzene is 78.1. That means 78.1 gram/mol, which must be converted to mass per volume. At standard conditions, there is 1 mol/22.4 liters, so convert g/mol to g/L: 78.1 g benzene mol = 3.487 g/L 1 mol benzene 22.4 L STEP 2: Account for concentration We are told the concentration is 4500 ppm – 4500 grams of benzene per million grams of air. Multiply this by the number you just calculated 4500 g = 0.0045 1,000,000 g (0.0045)(3.487 g/L) = 0.0157 g/L STEP 3: Convert to proper units Convert g/L to lb/ft3 (there are 454 g in a pound, and 0.0353 cubic feet in a liter): 0.0157 g 1 lb 1 L = 0.000980 lb/ft3 L 454 g 0.0353 ft3 STEP 4: Calculate total based on flow rate and hours of operation
Gathering Data 3.5The objective of materials accounting is to present a complete and comprehensive picture of all of the materials used in a process or facility. Materials accounting is a means of obtaining chemical use data from readily available information. Data for materials accounting can be gathered in the following ways:
• Direct measurement (including metering and monitoring)
Materials Accounting
29
• Business record inventories • Mass balance • Byproduct and emissions accounting • Engineering calculations
As illustrated in Figure 3F, information about materials in production facilities typically appears in seven categories:
1. Procurement (purchasing)
2. Inventory (storage and handling)
3. Material use (within operations)
4. Reuse
5. Byproducts
6. Emissions
7. Products
In many cases materials are easy to track because existing records clearly identify the chemicals. Difficulties occur when chemicals are created or transformed in a manufacturing process, or when exact quantities are undisclosed by the suppliers for proprietary reasons. Where requests for such information are rejected, materials accounting must rely on estimates.
4. Integral recycling (re - use)
2. Storage/ handling
3. Use
Facility Boundary
5. By - products
7. Product
1. Procurement/ inventory
6. Emissions
May or may not be within facility boundary
Figure 3F. Where to Gather Information About Chemical Use
Materials Accounting
30
3.5.1 Materials Procurement Sources of information on materials procurement include:
• Raw material purchase records • Transfer records (between facilities) • Receiving dock records • Vendor invoices
The best place to begin tracking materials is with the purchasing records for new material, usually located in a facility’s business office. Purchasing records should be gathered for several recent years in order to identify seasonal trends and longer term market trends that will be useful in predicting future materials inputs.
In larger firms where materials are bought in bulk and distributed to facilities, transfer records typically serve the same function as purchasing records. Where materials are purchased in bulk and distributed to several production units, it may be necessary to develop a “distribution factor” and estimate the amount of materials sent to each production unit.
Purchased materials are occasionally returned before use due to errors in ordering, failure to meet specifications, or overstocking. Take care not to double-count materials. Make sure that all materials identified as purchased are actual inputs to the production units.
Finally, some materials may come into a facility as part of packaging or transport services and may not be identified on purchasing records. An example is formaldehyde used in packaging glues or used to fumigate transport vehicles.
3.5.2 Storage and Handling Sources of information on materials as inventories include:
• End-of-year inventory records • Storage records
Materials can often languish for years in storage areas. Materials can become lost, unneeded, or outdated. Materials may even disappear in storage due to leaks, evaporation, or theft. Poor inventory control can lead to inefficient materials distribution and problems in storage. It is, therefore, very important to account for materials that accumulate at facilities and do not become part of the product or byproduct outputs.
3.5.3 Materials Use Sources of information on materials use include:
• Operations logs • Samples, analyses, and flow measurements • Batch make-up records • Product specifications
Materials Accounting
31
• Internal transfer records • Production line scheduling records • Production line job sheets
Some materials move down a somewhat simplified chemical pathway from raw inputs directly to finished product constituents. Other materials take circuitous paths through a production unit, and still other materials may serve as intermediaries in the manufacture of the finished product.
Records are often not available, and materials use may vary dramatically depending on customer specifications or the variability of markets and seasons. In some cases estimates will have to be developed in order to assign specific quantities to materials use.
3.5.4 Integral Recycling (Reuse) Integral recycling poses unique challenges in conducting a material balance because a facility-wide materials balance may not reveal the amount of materials reuse in practice. Accounting for materials recycling, such as reuse of solvents, plating baths, stripping and cleaning agents, etc., is vital in considering future options for expanding the reuse possibilities in a production unit.
Records on recycling and reuse are often difficult to find in a facility, as there may be little consistency over time in reuse practices, and reuse itself is difficult to monitor effectively. Give careful attention to accounting for materials reuse, because reuse can easily lead to double-counting materials.
3.5.5 Materials as Byproducts and Emissions Remember that the only difference between byproducts (all non-product output) and emissions is that emissions cross the facility boundary (that is, they are released to the environment). Byproduct figures may differ from emissions figures if a chemical is non-integrally recycled. In that case, the amount of byproduct would equal the amount of emissions plus the amount non-integrally recycled.
Therefore, with the exception of non-integrally recycled material, byproduct and emission information can be found from environmental compliance records such as:
• Waste transport manifests • Waste transporter invoices • Invoices to scrap buyers and recyclers • Sewer (POTW) discharge records • Emissions inventories • Toxics Release Inventory (TRI) forms • Air source registration records
Materials Accounting
32
Some of these data are easily derived from manifest or discharge records. However, actual emissions may differ significantly from the permit records. Therefore, permit data should always be validated with other measurements or estimates.
The process of filling out a federal Toxics Release Inventory (TRI) Form R can reveal many emissions sources.
Materials lost as spills, leaks, and fugitive emissions need to be accounted for as well. The materials balance procedures recommended by the EPA for estimating fugitive emissions for reporting TRI data are useful here, but toxics use reduction planning requires data that is displayed at the level of a production unit. The aggregate losses can be computed by materials balance accounting, but this will not accurately distribute the losses to the points in the production unit where they actually occur.
A surprising amount of materials losses occur in storage and handling operations. Materials can volatilize or leak in storage, and handling materials increases the risks of spills and accidents. Carefully check the storerooms, loading docks, and transport passageways for revealing clues of materials leakage and spillage.
3.5.6 Materials as Products Sources of information on materials in products include:
• Product shipment records • Loading dock records • Product specifications • Invoices to customers (accounts receivable)
Some production materials leave the processes as constituents of finished products. In processes with high product–to–byproduct efficiency ratios, much of the materials input may leave the process in the form of a finished product.
Sales records provide a good starting place for establishing the amount of materials leaving as a part of the finished product. Sales records alone, however, will not be sufficient where products are composed of many materials or where the materials composition varies due to customer demand. A good example is a specialty paint that may be carefully formulated for a specific contract and never made thereafter. Where customer specifications require a certain amount of a material in a finished product, producers may add more than that required to assure that the product will never fall below specifications. In these cases, where products include many constituents, you will need to develop estimates to account for product outputs.
Materials Accounting
33
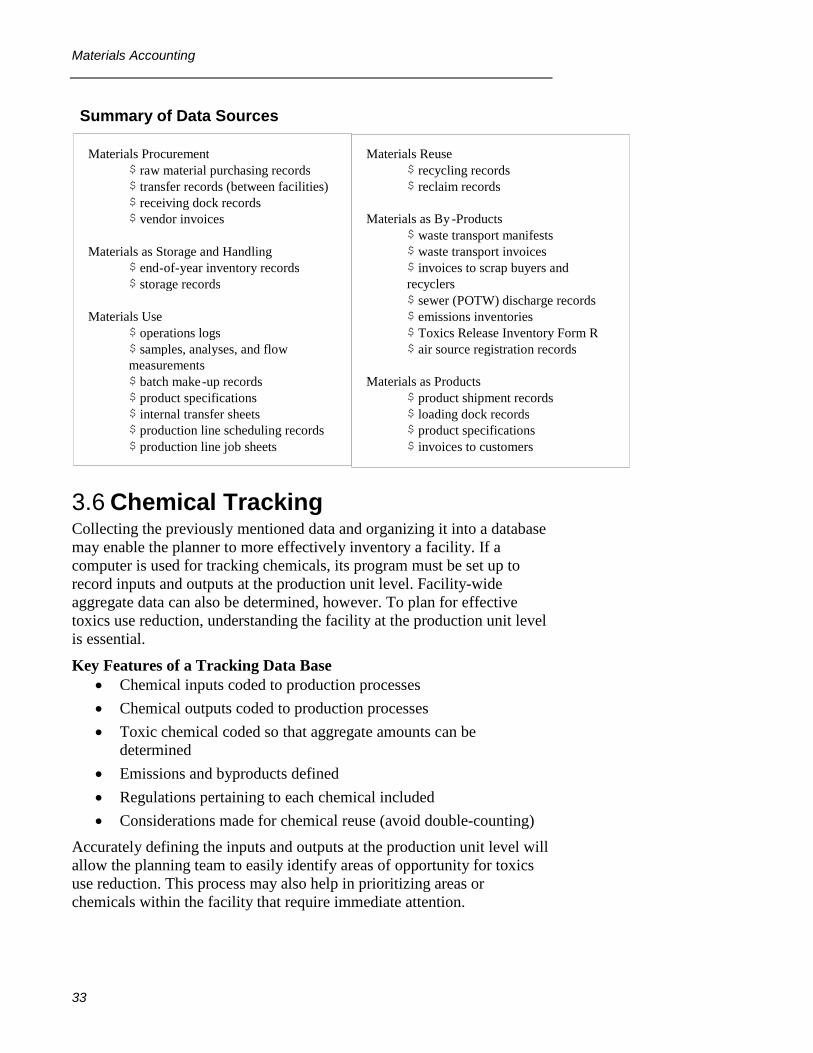
Chemical Tracking 3.6Collecting the previously mentioned data and organizing it into a database may enable the planner to more effectively inventory a facility. If a computer is used for tracking chemicals, its program must be set up to record inputs and outputs at the production unit level. Facility-wide aggregate data can also be determined, however. To plan for effective toxics use reduction, understanding the facility at the production unit level is essential.
Key Features of a Tracking Data Base • Chemical inputs coded to production processes • Chemical outputs coded to production processes • Toxic chemical coded so that aggregate amounts can be
determined • Emissions and byproducts defined • Regulations pertaining to each chemical included • Considerations made for chemical reuse (avoid double-counting)
Accurately defining the inputs and outputs at the production unit level will allow the planning team to easily identify areas of opportunity for toxics use reduction. This process may also help in prioritizing areas or chemicals within the facility that require immediate attention.
Materials Reuse $ recycling records $ reclaim records
Materials as By - Products $ waste transport manifests $ waste transport invoices $ invoices to scrap buyers and recyclers $ sewer (POTW) discharge records $ emissions inventories $ Toxics Release Inventory Form R $ air source registration records
Materials as Products $ product shipment records $ loading dock records $ product specifications $ invoices to customers
Materials Procurement $ raw material purchasing records $ transfer records (between facilities) $ receiving dock records $ vendor invoices
Materials as Storage and Handling $ end - of - year inventory records $ storage records
Materials Use $ operations logs $ samples, analyses, and flow measurements $ batch make - up records $ product specifications $ internal transfer sheets $ production line scheduling records $ production line job sheets
Summary of Data Sources
Materials Accounting
34
Mass Balance in a Plating Operation Exercise Below is a simple chrome plating production unit. The facility operates 8 hours a day, 7 days a week. Carefully review the process flow diagram and answer the following questions: 1. How much water is lost through evaporation from the plating tank
each day? (Note: The chrome concentration in the plating solution is low enough to assume that water = solution drag-out).
2. How much wastewater is discharged per day from the rinse tank?
3. How much sulfuric acid is discharged in the wastewater each day? Should this specify that ounces are mass or volume?
4. If the rinse tank started clean on Day One, how much CrO3 would remain in the tank at the end of Day Three if the average concentration over that time were 0.52 oz./gal.?
Plating Inputs Rinse Inputs Makeup water 180 gal/day City water 6.0 gal/min
CrO3 3800 ounces/day Drag in 80 gal/day chrome solution
H2SO4 ? ounces/day
Plating Outputs Rinse Outputs Drag out 80 gal/day Wastewater ? gal/day CrO3 1600 ounces/day CrO3 0.52 ounces per gal H2SO4 ? ounces/day H2SO4 0.0063 ounces per gal Plate out (on parts) Drag out 80 gal/day
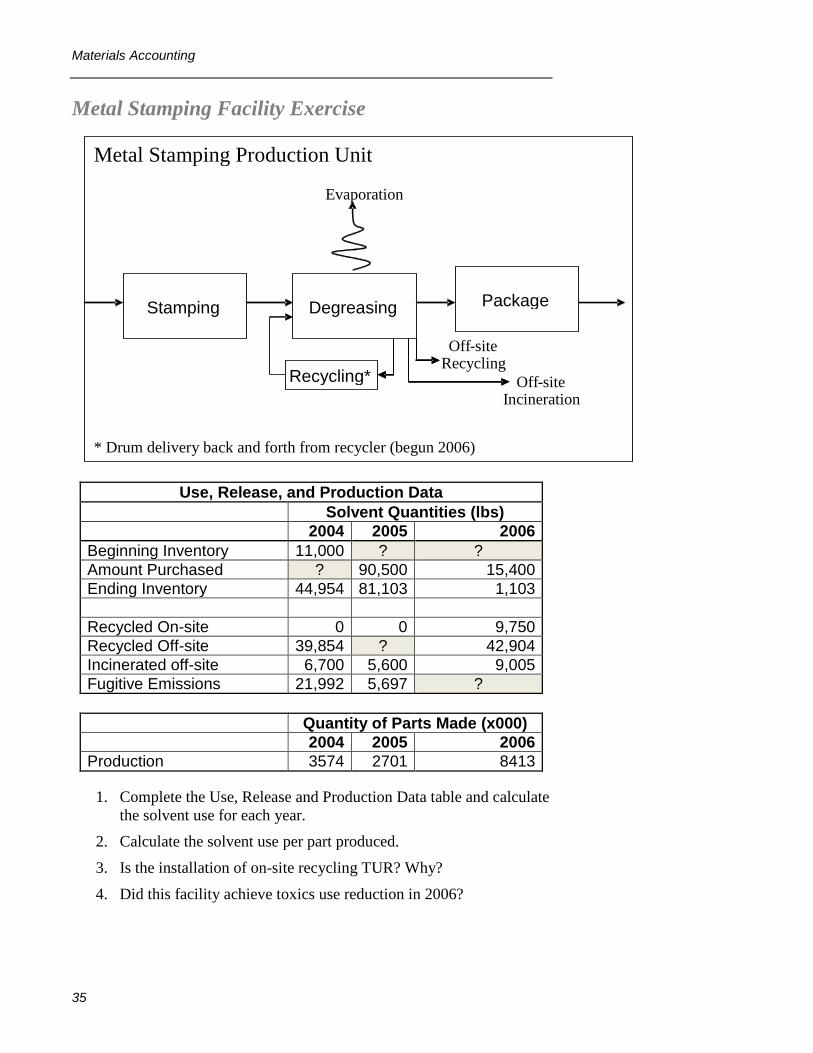
1. Complete the Use, Release and Production Data table and calculate the solvent use for each year.
2. Calculate the solvent use per part produced.
3. Is the installation of on-site recycling TUR? Why?
4. Did this facility achieve toxics use reduction in 2006?
Degreasing
Recycling*
Evaporation
Off - site Incineration
Off - site Recycling
Package
Metal Stamping Production Unit
Stamping
* Drum delivery back and forth from recycler (begun 2006)
Identifying TUR Opportunities
36
4 Identifying TUR Opportunities
Objectives: At the end of this chapter participants will be able to:
• Understand why it is important to generate a range of TUR options
• Learn tools and methods to help you generate TUR options
The next step in TUR planning after process characterization is to identify TUR options. This is the creative phase of TUR planning. The object of this phase is to generate as complete and thorough a list as possible of alternatives for reducing toxics and byproducts. Sometimes the TUR opportunities are obvious, for example, repairing a leak in a solvent tank, or upgrading outdated equipment with more efficient models. Other times the solutions are less clear. This is particularly true when different options will result in different costs and account for different benefits.
Working with a well-selected TUR Planning team can help in opening up the suite of options that you will be considering. Consider including members of existing health and safety or sustainability teams, as well as other key stakeholders on this time. It is important to think about who would provide valuable insights and creative ideas at this point in the TUR planning process. In order to assure that subsequent TUR planning activities build on what has been done in the past, be sure to plan agendas for your team meetings and record the key points from your discussions as you go along.
Identifying Options 4.1Seeking a safer alternative that can serve the same function as a toxic chemical is not the only option to consider. In many circumstances it may not even be the best alternative. Using the ideas from your TUR team as well as other resources will lead to the most possibilities.
4.1.1 Brainstorming TUR Options The search for TUR options is an open and creative process. Brainstorming is a common and useful method to encourage people to think up creative ideas. The principle of brainstorming is to harness the collective creativity of a group to generate as many ideas as possible, with no regard (at this point) for their feasibility.
4.1.1.1 Helpful Guidelines for Brainstorming While it is important not to stifle the creativity of the group with too many constraints, it is equally important to establish certain guidelines and
Identifying TUR Opportunities
37
criteria to guide the brainstorming. Below are some important guidelines that apply in almost every brainstorming situation:
1. No judgment, no evaluation - The focus of TUR brainstorming is to generate as many worthy and creative ideas as possible, NOT determining whether a concept is a valid or feasible TUR option.
DO • Encourage and allow each group member to participate • Treat every TUR idea as worthy
DON’T • Discuss the feasibility of TUR ideas at this stage • Criticize
2. Be creative –Sometimes the most outrageous ideas can lead to the most effective solutions. Being creative in brainstorming does not necessarily mean inventing a new technology or formulation. It can be as simple as coming up with a different way to accomplish a task. DO • Think outside the box (let your imagination wander)
• Change your perspective (imagine yourself in a role other than your own)
• Hitchhike your ideas (let one idea generate another) DON’T • Feel bound by history (set aside convention and past
experience) • Be inhibited (don’t be afraid to speak up in the group)
3. Stay focused – While you don’t want to limit your creativity with too many boundaries, it is important to ensure that the TUR brainstorming process does not stray from reduction to control, treatment, or other process changes that do not count as TUR. DO • Organize your brainstorming session around the 6 TUR
techniques (consider in turn each of the six kinds of TUR options defined by TURA, so that you have 6 mini-brainstorm sessions for each production unit)
• Present a memory-refreshing summary definition of each of the six TUR options
DON’T • Brainstorm ideas that are not TUR Brainstorming can produce a range of benefits. It can help in guaranteeing commitment from participants because they are part of the process. Further, brainstorming does not have to be done solely with toxics use reduction in mind; this activity can be used to improve efficiency in the use of all materials. Successful companies know that their most important asset is their people. It is when people are allowed, encouraged and motivated to find creative solutions that great ideas spring forth.
Identifying TUR Opportunities
38
4.1.2 Information Sources for Alternatives Just as finding less hazardous, high performing, cost competitive, drop-in substitutes for hazardous chemicals is unlikely, you should not expect to find perfect and complete sources of information on the alternatives appropriate for your specific applications. There are many sources of information on possible alternatives for many situations – whether in manufacturing or service operations.
Type of source Type of information provided Examples Safer alternative resources
Sites designed to provide information or present research on potential alternatives for hazardous chemicals in the workplace for selected sectors or applications, sometimes including extensive case study information.
SUBSPORT (EU), IRTA (an Institute providing technical analyses of safer alternatives for California EPA and US EPA) and CatSub (EU/Denmark) all provide case studies of safer alternatives for especially wide varieties of hazardous chemicals, industries and applications. IRTA’s case studies are extensive, in-depth assessments of alternatives.
• SUBSPORTi • IRTA case studiesii • TURI case studiesiii • TURI CleanerSolutions
databaseiv • EPA DfE list of safer
chemical ingredientsv • Catsub databasevi
Trade association technical information
Some trade associations provide technical information on safer alternatives for hazardous materials in production of their products.
AFIRM Supplier Toolkit (apparel sector)vii
Industry trade or other journals
Industry Trade Associations and Professional Societies publish papers that provide technical and scientific information on various topics.
Paint Pro Professional Paint & Decorating Contractors Journal viii
Manufacturer and vendor information
Chemical and chemical products manufacturers publish Product Data Sheets that give information on the physical and chemical properties of their products and application information.
Shell Solventsix
Other companies or technical experts
Obtain information on how an alternative worked in another company’s process. In cases where companies are willing to share some of the details of their implementation experience, talk to them about the challenges. Where did the alternative work and where not? What were key challenges that had to be met to make the alternative effective?
Outside experts may also provide valuable information.
Some of this information is available from case studies, proceedings of conferences and meetings
State technical assistance programs and technical libraries
Many states have pollution prevention, toxics reduction or green chemistry technical assistance programs to provide information and/or limited consulting or research support to companies seeking safer alternatives to replace hazardous chemicals. They often focus particularly on developing and sharing information on safer-alternative options for responding to new regulatory restrictions on the use of hazardous chemicals. The size and technical resources of these programs varies from state to state.
• Michigan Retired Engineers Technical Assistance Program (RETAP)x
• Massachusetts Office of Technical Assistancexi
• Minnesota Technical Assistance Programxii
• Washington Dept. of
Identifying TUR Opportunities
39
Type of source Type of information provided Examples Some of these state programs also have developed on-line technical libraries that include safer alternatives; these resources are often shared between states, and are available to companies anywhere.
A list of state pollution prevention programs (with links) is available at the P2Rx website.
Ecologyxiii • Toxic Use Reduction
Institute at University of Massachusetts, Lowellxiv
• P2Rx links to state pollution prevention programsxv
Internet research In addition to all the resources above, don’t forget to do internet searches for safer alternatives. Tailor the wording of the search to zero in on the chemical you want to replace and the functionality you need to achieve with as much specificity as possible. These searches may take you to innovative approaches not yet included in some of the databases above, and provide ideas on who you should contact to get more information.
SUBSPORT’s custom search engine allows users to search multiple databases and websites related to substitution.
SUBSPORT’s Substitution Search Enginexvi
The value of any particular source of information about potential safer alternatives will depend on your business, the specific application, the type of product you’re manufacturing or servicing and a range of other factors. The more common the demand for alternatives – e.g., due to new regulatory restrictions on the use of the hazardous chemical – the greater the range of tested alternatives are likely to be available. Magic bullets that solve all problems are unlikely. Developing a rich set of alternatives during this step of the process will increase the likelihood that you will be able to develop an effective and protective alternative to adapt to your particular needs.
The Six TUR Techniques 4.2Toxics can be reduced by a facility in a variety of ways, ranging from making simple operational changes to a total redesign of a production unit. TURA defines six categories of TUR techniques and as mentioned above, one useful way to identify TUR options is to consider each TUR technique separately, brainstorming as many ideas for each technique as possible.
The six TUR techniques are:
4. Input substitution – replacing a toxic or hazardous substance or raw material used in a production unit with a non-toxic or less toxic substance.
5. Product reformulation – substituting for an existing end-product an end-product which is non-toxic or less toxic upon use, release or disposal.
Identifying TUR Opportunities
40
6. Production unit redesign or modification – developing and using production units of a different design than those currently used.
7. Production unit modernization – upgrading or replacing existing production unit equipment or methods with other equipment and methods, based on the same production unit.
8. Improved operations and maintenance – modifying or adding to existing equipment or methods including, but not limited to, such techniques as improved housekeeping, system adjustments, process / product inspections, or production unit control equipment or methods.
9. In-process (integral) recycling – recycling, reuse, or extended use of toxics by using equipment or methods which become an integral part of the production unit.
For the purposes of developing specific options in a given facility, you should consider whether the option achieves a reduction in the use of the toxic chemical or the elimination of the toxic chemical. All of the listed techniques allow for toxics use reduction, however, some options may better allow for eventual elimination of the chemical. For this reason all options should be considered in terms of long-term planning. For example, if a company has the long-term goal of eliminating a toxic chemical, it may not make economic sense to invest in a recycling operation for that chemical in the short term.
Along with considering all types of options, the planning team should examine all product-related activities for toxics use reduction opportunities, including product design, formulation, manufacturing, and marketing. Redesigning a product can be an effective approach to reducing or eliminating toxics use since product design affects all processes and chemical use. However, making product design changes requires involvement of design engineers, marketing personnel and others, and may require a longer implementation time than changes to a manufacturing process.
4.2.1 Input Substitution Input substitution involves replacing a toxic or hazardous process chemical with a less hazardous or non-hazardous chemical. This technique may not reduce the volume of waste generated, but the waste generated will be less hazardous. A common example of input substitution occurs in metal parts cleaning where toxic solvents are replaced by less toxic cleaning agents. Sometimes simple detergents may suffice. Such substitutes are called drop-in substitutes, because they do not require any process or product modification. Other substitutes require equipment modifications. For example, helium could serve as a replacement for CFCs in refrigeration, but it would require heavier containers and tubing because of its higher operating pressure level.
Identifying TUR Opportunities
41
Input substitution requires careful analysis. One of the first considerations is the potential effect the substitute may have on product quality. Although there is a great deal of literature regarding available substitutes, caution should be applied in the face of a quick solution. An aqueous degreaser used to replace trichloromethane may be fine for one application, however, for another application, this same substitution may not yield the required results or it may increase production costs.
Another important consideration in choosing a substitute is the relative hazard of the substitute. Increasing concern over safety hazards led to the substitution of non-flammable, chlorinated solvents for flammable solvents in cleaning operations. Today we are seeking substitutes for those chlorinated solvents that have been shown to have chronic health effects. Some currently used substitutes are flammable. It is important that the next transition be toward LESS hazardous materials.
Input substitution is often highly dependent on access to information. Larger firms may be able to find chemical substitutes more easily because of their access to research or their capacity to conduct their own research. Smaller firms may be more dependent on trade associations or vendors to learn of potentially effective substitutes.
Although trade magazine case studies provide a great deal of good information on new substitutes, they do not replace the planning process. Case studies often provide a fine description of the solution, but neglect to describe the procedure involved in finding that solution. While an extensive technical evaluation should be performed on each potential TUR option, one commonly overlooked impact of input substitution bears mentioning here. Input substitution often results in the creation of a different type of byproduct that may affect a different media. For example, switching from a solvent-based to an aqueous-based cleaner could adversely affect the wastewater treatment system, cause effluent limits to be exceeded, and increase wastewater treatment sludge production.
Input substitution is an advanced TUR technique. It requires a reasonable level of effort and willingness to try new materials. Yet input substitution has potentially great economic and environmental rewards, because it directly eliminates the use of a toxic chemical.
Examples of Input Substitution • Substitute soy-based inks for petrochemical inks.
• Substitute water-based paints for oil-based paints.
• Substitute vegetable-based fluids for oil-based cutting fluids.
• Substitute aqueous cleaners for solvents.
• Substitute powder coatings or water-based, high solids for solvent-based coatings.
• Substitute trivalent chromium for hexavalent in electroplating.
• Substitute non-mercury bactericides in paint formulation.
• Substitute non-toxic pigments for chromium-, cadmium- and tin-based pigments.
Identifying TUR Opportunities
42
4.2.2 Product Reformulation Product reformulation involves replacing hazardous chemicals with non-hazardous chemicals in the product design and formulation stage. Reformulating a product to contain less hazardous materials typically results in less toxic chemical use in the process as well as in the final product.
Product reformulation requires significant attention to product quality and a clear understanding of customer requirements. If a product is reformulated, it must meet customer specifications and work as well as the product it is replacing. While product reformulation may not be feasible for every application, consumer demand for environmentally conscious products and the increase in regulations concerning product content may make product reformulation a wise business The information exchange that takes place in product reformulation is sometimes quite sensitive. Firms in highly competitive industries that reveal the constituents of their new formulation for a product may jeopardize their competitive position. Firms may be more likely to offer information on cleaning processes, for example, than on their product formulation.
4.2.3 Production Unit Redesign or Modification Production unit redesign, or process redesign, involves altering the process used to make a product in order to reduce the use of toxic process chemicals. This technique involves more than equipment modernization, because it involves the introduction of a new way to manufacture the product. This may involve new equipment or new procedures.
A good illustration is those firms that have moved from chemical cleaning operations to physical cleaning operations like buffing and sanding. Firms that have substituted high velocity, pulsating water streams for solvent baths have eliminated the need for solvent altogether. Solvents that are
Examples of Product Reformulation • Eliminate trimethylbenzene in a lithographic press wash product by changing
the mixture of chemicals blended to make the wash.
• Eliminate solvents in polyurethane varnish by developing a water based coating for wood furniture.
• Decrease the amount of solvent needed in paint by switching to a high solids formulation.
• Negotiate with FDA for approval for a new cosmetic formula that eliminates use of a toxic chemical in the cosmetic product.
• Educate customers about the advantage of purchasing new product lines specifically designed to eliminate toxic chemical ingredients.
Identifying TUR Opportunities
43
used to dry surfaces are easily replaceable with air blast systems or thermal alternatives. Through careful analysis some firms have discovered that they cleaned parts too often. The so-called "no-clean" process eliminates an operation that previously required a toxic chemical bath.
The installation of multiple rinsing tanks, dragout reclamation systems, and countercurrent rinse cleaning systems has reduced toxics use in electroplating firms. This option may require substantial redesign of the production unit and pilot runs are often required to test for changes in the quality of the product.
Significant process redesign will affect work practices and may require a redeployment of employees. Those skilled in running particular equipment may need to be retrained for different processes. Such training and redeployment costs need to be factored into the option analysis in deciding on process changes. This option may also involve a significant amount of research and capital expenditure.
4.2.4 Production Unit Modernization Production unit modernization refers to upgrading existing production unit equipment and methods with other equipment and methods based on the same production unit. Replacing outdated and inefficient equipment with new and more modern equipment meets the definition of production unit modernization if it reduces the amount of toxic chemical use. Although this technique involves an initial capital investment, it often pays for itself fairly quickly in increased production rates, lower raw material use, and lower waste disposal costs.
Investments in higher quality tools and equipment can lead to reduced toxic chemical use. High performance nozzles in paint or water spray apparatus can better target sprays and reduce chemical waste.
Examples of Production Unit Redesign or Modification • Eliminate unnecessary cleaning steps.
• Replace solvent cleaning operations with aqueous cleaning.
• Use high-pressure water sprays for parts cleaning.
• Install countercurrent rinsing systems to reclaim process chemicals.
• Install drip racks and dragout recovery tanks.
• Use air knives to blow solutions back into baths.
• Install paint arresters to capture paint overspraying.
• Replace solvent-based paint strippers with mechanical processes (abrasion or high velocity plastic bead guns).
• Replace dry grinding operations with wet operations to reduce dust.
Identifying TUR Opportunities
44
Modernization includes increasing levels of process control. Process control improvements can lead to less toxic chemical use due to less off-specification product, fewer spills and leaks, and less rework. Automated control systems can yield higher levels of efficiency in material use and less material leaving a facility as waste byproduct. Yet production unit modernization does not have to be high tech and complicated; it can be as easy as installing a thermostat to control production temperatures better.
Larger scale modernization projects require the company to carefully consider factors such as production down-time, capital availability, facility modifications, and employee training on the new equipment. Considering all of these factors, firms often find that the payback period is fairly quick, because modernization usually leads to increases in productivity as well as reduced waste and toxic chemical costs.
4.2.5 Improved Operation and Maintenance 4.2.5.1 Improving Process Maintenance Improving the efficiency of the production unit by improving the process operation and maintenance can be one of the most cost effective ways of reducing toxics use.
Some production units may involve many operating procedures that differ from those that were originally planned. These procedures may have been adapted over the years due to variations in equipment performance, faulty equipment, or lack of training in the proper procedure. This kind of information is often well known by production line workers. During brainstorming sessions, workers on the production line should be encouraged to present process problems and explain "real" operating procedures when different from those envisioned by management.
Changing a standard operating procedure may seem simple, but it can be heavily resisted by workers if it leads to significant changes in work practices that do not seem beneficial to those who perform the tasks. If only a small savings will be realized by performing a task in a different manner, it probably is not worth making the change.
Examples of Production Unit Modernization • Install automatic thermostats to maintain optimum process temperatures.
• Install automatic flow controls.
• Install high performance nozzles, brushes, and applicators to conserve coatings and reduce the number of reject products.
• Install timers on transfer equipment to time process schedules accurately.
• Upgrade tool and equipment quality to reduce off-spec products.
• Install seal-less pumps in place of packed or single seal types.
Identifying TUR Opportunities
45
Operator training can lead to reduced use of toxic chemicals. Shop floor workers often have a great ability to use materials more efficiently. Too often, workers are not adequately trained or motivated to find ways to make machines perform better.
Maintenance may be constantly reactive, involving frequent repair of broken equipment, rather than preventive maintenance. Constantly running poorly maintained equipment will reduce the efficiency of the process. While most of the techniques involved in this area are simple, they can provide significant reductions. Equipment that has not been maintained will not perform efficiently, resulting in poor quality products or wasted materials, both of which lead to increased toxic chemical use. A faulty valve or a broken seal can release large amounts of toxic chemicals over a workweek, even if the rate of flow is very low.
One very effective remedy may be the implementation of a scheduled maintenance system. This kind of program will help to assure that preventive maintenance takes place. Such a program might include:
• A list of all plant equipment and locations (demarcating critical process equipment)
• Operating time for each item (hrs/day)
Examples of Improved Operations and Maintenance
Process Maintenance • Tighten and repair all faucets, gaskets, and couplings to eliminate leaks.
• Institute employee training programs to encourage employee involvement in TUR programs.
• Schedule production to reduce equipment cleaning.
• Install splash guards and drip boards.
• Dedicate process equipment to a single product line.
• Minimize change-over time in batch processing to reduce drying and setting.
• Sequence batch mixes from light to dark to avoid intermediate cleaning steps.
• Inspect parts prior to processing to reduce number of rejects.
• Install lids on process tanks to reduce evaporation and spills.
Inventory Management • Standardize paints, cleaning agents, oils, etc., to facilitate interchangeable use and
reuse.
• Improve inventory control to avoid overpurchasing, material spoilage, and material obsolescence due to expired shelf life.
• Buy in bulk only where practical.
• Centralize all material purchase records to facilitate easy tracking.
Identifying TUR Opportunities
46
• Service history (days since last tune-up) • Maintenance history (days since last breakdown) • Maintenance manuals
4.2.5.2 Improving Inventory Management Improving inventory management is a noninvasive technique that can allow for significant reductions. Two basic aspects of inventory management are inventory control and material control.
4.2.5.3 Inventory control Inventory control involves buying appropriate materials at appropriate times. The shelf life of the chemical, the amount being used, the storage capabilities, and the costs of the materials should all be factors in determining effective inventory control programs.
If a toxic chemical has a very short shelf life and the chemical is used in small quantities, it is probably not prudent to buy the chemical in bulk. On the other hand, if large quantities of the chemical are used, it makes sense to buy in bulk. Bulk purchase and storage of nonperishable materials can reduce use by reducing the amount lost in transfer leaks and spills and in container residues.
Even with the above techniques, surplus inventories may still accumulate. If a raw material is beyond its shelf life, the company may consider
Potential Sources of Process Material Loss Area Source
Loading Leaking fill hose from line connections Draining of fill lines between fillings Punctured, leaking, or rusting containers Leaking valves, piping, and pumps Lack of training programs Storage Overfilling tanks Improper overflow alarms Punctured, leaking, or rusted containers Leaking transfer equipment Inadequate diking Improper transfer procedures Process Leaking process tanks Improperly operated and maintained process equipment Leaks and spills during material transfer Inadequate diking Equipment and tank cleaning
Identifying TUR Opportunities
47
whether the material can be used in another process that does not require the high purity lost during extended storage.
4.2.5.4 Material control Material control includes storage of raw materials, products, and wastes and the transfer of these materials within the production unit. Often reduction of losses in this area comes as a result of changes in operational procedures. Many losses in this area are forgotten because they occur between the warehouse and the production process. Large reductions can be achieved by proper waste handling. Waste streams should be studied to determine if wastes are being mixed or inadvertently contaminated when they could be recycled or reused within the production unit. This is one reason why the entire production unit should be considered during materials accounting.
4.2.6 Recycling In-process recycling and reuse can be a cost-effective TUR option that can increase the reuse of a toxic chemical in such as way as to reduce the annual amount purchased and the amount discharged as a byproduct. Recycling allows for reductions in waste disposal costs as well as raw material costs.
Electroplating firms have found that plating baths can be filtered, reclaimed, and reused so as to extend the life of the baths over many months. Such techniques are sometimes referred to as “closed-loop” recycling because they result in a closed system of materials use Standardizing solvents to reduce the number of solvents used can not only result in the elimination of some solvents from the facility, but also can make recycling a lot more practical. In-process recycling is preferred because more efficient recovery is likely to occur at the point of generation. Collecting the waste stream outside of the process for off-site recycling does not reduce the amount of toxic chemical being used on-site or prevent exposure to workers. Off-site recycling also increases the amount of handling required. The waste must be loaded onto a truck, transported, off-loaded, recycled, and transported back to the company.
Examples of Recycling, Reuse, or Extended Use of Toxics
• Capture and recycle clean-up solvents. • Rework batch process byproducts back into the next batch. • Recycle and reuse spent rinse water. • Distill and reuse solvent strippers. • Install reverse osmosis, ion exchange, or electrolytic
recovery systems for cleaning baths to increase recycling and reuse.
• Segregate byproducts to increase recoverability and reuse.
Identifying TUR Opportunities
48
Being Systematic 4.3Effective toxics use reduction embraces continual improvement. Therefore, it is important to approach the process of identifying appropriate TUR opportunities systematically. Doing so ensures that subsequent TUR planning efforts can build upon previous work, and that good ideas that do not appear to be technically or economically feasible at first can be reconsidered. As technology advances, once sub-par performance options could become highly appropriate for specific purposes. And financial feasibility considerations are ever-changing as the market adjusts to new economic drivers.
When considering potential opportunities to reduce use of toxic chemicals, therefore, it is helpful to document your ideas, assumptions, information sources and criteria. In doing so, the TUR team should be certain to consider and document the factors that influence your facility’s ability to implement feasible options.
5 TUR Options Evaluation and Alternatives Assessment
Objectives: At the end of this chapter, participants will be able to:
• Consider technical, environmental and human health and safety, and economic criteria when assessing the feasibility of TUR options
• Develop appropriate screening procedures for potential TUR options
• Conduct appropriately thorough evaluations of options, including assessment of safer chemical alternatives
• Develop systematic procedures for choosing TUR options to implement.
In this module we will look at how to evaluate the options identified with the goal of finding opportunities to implement changes that allow your facility to reduce its use of toxic chemicals.
Additional attention is devoted to the case of TUR options at are associated with chemical input substitutions. In this case, the TUR options evaluation process needs to include a more thorough consideration of the environmental and human health and safety (EH&S) impacts of the alternatives being considered. This process is also referred to as Alternatives Assessment.
Evaluating TUR Options
49
5.1 Introduction to TUR Options Evaluation
After a comprehensive list of TUR options has been developed, the next step is to evaluate the technical, economic feasibility, and overall safety of each option. This evaluation of TUR options provides the information needed to make a business case for implementing changes that will result in toxics use reduction. The process of TUR options evaluation is essentially the same as the process more commonly refered to as Alternatives Assessment. In 2014 the National Academies of Science laid out the process of alternatives assessment in its Framework to Guide Selection of Chemical Alterantives (http://www.nap.edu/catalog/18872/a-framework-to-guide-selection-of-chemical-alternatives).
Alternatives assessment is also increasingly being incorporated into businesses’ strategic decisions both nationally and globally as they work to better manage their use of chemicals. Companies like HP use this method to guide their choice of chemicals and materials, with a primary goal being to avoid highly expensive product redesigns required by potential future customer or regulatory restrictions.
The first step in assessing TUR options (alternatives assessment) is to develop criteria for screening out options that are not technically or economically feasible or that do not result in TUR.
5.2 Screening TUR Options As described in the previous module, companies should consider options in all six TUR techniques. However, in many cases, it is not necessary to thoroughly investigate every one of the six techniques, or every TUR option the planning team identifies as a possibility. Companies can screen and immediately eliminate from further consideration any options that clearly are not technically or economically feasible, or that would not actually reduce the use of toxics or the generation of hazardous byproduct.
In fact, you might find that some options are so straightforward, inexpensive, effective, and easy to implement – so-called “low-hanging fruit” – that no further assessment is needed to implement them.
At the same time, it is important not to eliminate TUR options too hastily. Options that may seem impractical at first glance may, in fact, be successful solutions in the long run. For these reasons, it is valuable to approach TUR options selection with rigor, and to take advantage of established tools and benchmarking criteria to assist in arriving at your decision.
Qualitative considerations, such as the impact on the company’s reputation with the local community, regulators and/or customers, must be included in your assessment of TUR options.
Finally, TUR options should not result in shifting risks (for example, removing toxics from the product shipped but increasing potential harm to workers by using more toxic processing chemicals that do not end up in the final product). This is, therefore, another important potential screening criterion.
Options can be evaluated either formally or informally depending on the capacity of the TUR planning team, the complexity of options being considered, and available resources. TUR options evaluation should be incorporated into the company’s existing decision-making processes. For example, if your company has a rigorous procedure for considering and planning process changes, it would be advantageous to include TUR considerations into that process, even if the purpose of initiating such a project is not primarily to implement TUR. Often options may be sufficiently evaluated through discussions about the positive and negative aspects of options with a few knowledgeable employees. In the case of more complex TUR options, a more detailed and objective assessment is typically required.
Initially, it is helpful to construct a list of questions that reflect the conditions of the facility to help guide you in the screening process. Questions might include:
• What are the main benefits of this option? • What is the TUR potential of this option? • How old and in what condition are related buildings and
equipment, and how does this relate to proposed changes? • Does this option fit well with other company goals – such as
operational efficiency or product quality?
5.2.1 Technical Screening The process for screening out TUR options that are not technically feasible should be well-considered. Develop screening criteria that relate specifically to your process, product and customer needs. Consider the entire system in which the TUR option would be applied when screening for technical feasibility. For instance, the replacement of a chemical with a less toxic chemical may initially seem incapable of achieving required performance levels but when considering the entire production process it may be possible to modify upstream process steps to accommodate the use of the option.
Examples of factors that might be appropriate technical feasibility screens could include:
• Equipment availability • Worker skills • The impact on product quality
Initial screening to eliminate obviously infeasible options
allows you to focus time and energy on
more promising options.
Evaluating TUR Options
51
• Space availability for installation of equipment
5.2.2 Economic Screening The financial impacts of implementing a specific TUR option are often influenced by factors that may be variable over relatively short periods of time (e.g., the price of petroleum based substitutes), or that are affected by external forces outside of your facility’s control (e.g., the availability of equipment required to implement the option). As a result, an option that might appear to be economically infeasible at first may in fact become economically feasible as conditions change.
When evaluating TUR options from an economic standpoint you must be careful not to eliminate options too quickly based solely on up-front costs or a Simple Payback Period that exceeds company guidelines. Some projects with large initial investments pay for themselves quickly in overall savings and productivity improvements. It is important to carefully consider what the appropriate economic screening criteria are for your facility, and to document those in your TUR Plan. Typically, developing economic screening criteria should be done in collaboration with your facility’s upper management to assure that they are as flexible as possible while accommodating the company’s business model.
5.2.3 EH&S Screening When the TUR option being considered is a substitution of one chemical for the toxic chemical, or when a product reformulation or process modification results in a change in chemistry, those chemical alternatives that are not in fact safer should be screened out. A chemical is typically considered to be “safer” if it does not exhibit environmental or human health impacts that are similar to or exceed that of the toxic chemical for which it would be substituted. The definition of “safer” also includes avoiding potential shifting of risks to workers, the public or the environment from one set of hazards to another (e.g., substituting a known carcinogen with a chemical shown to cause significant neurological impacts on workers).
The Massachusetts Toxics Use Reduction Institute (TURI) conducted a thorough assessment of chemical and material alternatives for five chemicals of concern in 20062. The EH&S screening method used by TURI for this study was to eliminate from further consideration any chemical that was present on the Science Advisory Board’s list of More Hazardous Chemicals3, chemicals that were carcinogens, mutagens or reproductive toxicants (i.e., either on the European Union list of CMRs4 or
2 http://www.turi.org/About/Library/TURI_Publications/2006_Five_Chemicals_ Alternatives_Assessment_Study 3 http://www.turi.org/Our_Work/Toxic_Chemicals/Chemical_Lists 4 Chemicals known or suspected to be Carcinogenic, Mutagenic, or dangerous to Reproductive health (CMRs) are continuously being assessed by the European Chemicals Agency (ECHA). The list of chemicals under consideration is called the Community
on the State of California’s Proposition 65 list5 or chemicals that are persistent, bioaccumulative and toxic in aquatic environments (as determined by presence on pertinent lists such as the EPA list of PBTs6, or by modeling using EPA’s PBT Profiler.7
There are also many lists of chemicals that exhibit hazardous characteristics that you can use to quickly screen out potential substitutes. One list that is updated routinely and quite comprehensive is the Chemical Hazard Assessment Tool (ChemHAT), which is designed to be highly user-friendly and comprehensive, and is maintained by an alliance of labor and business organizations (the Blue-Green Alliance). There are a number of other resources that one can use to identify appropriate screening criteria. These are discussed later in this module.
The specific method your facility chooses to screen out substitutions based on EH&S considerations should be determined based on the key concerns associated with the use of the chemicals. These concerns include the hazard characteristics of the substitute as well as the occupational exposure potentials associated with the use of the chemical in your process, relevant process waste disposition, and final product use and disposition patterns.
5.3 Evaluating TUR Options Additional investigation of TUR options done during the evaluation stage may reveal that an option is not viable at this time. However, the evaluation stage of your research may also identify new TUR options that should be considered. It is important that TUR options be evaluated using the same criteria that the company uses for other kinds of projects or expenditures.
The following sections provide guidance on the process of evaluating TUR options for technical feasibility, economic feasibility, and environmental and human health and safety (EH&S) impacts.
5.3.1 Technical Evaluation The technical assessment determines whether equipment and materials will function as needed in specific applications. Depending on the option, a number of technical feasibility studies—from paper studies to pilot projects — may be needed. However, an exhaustive technical analysis may not always be necessary or useful. Determine a TUR option’s ability to satisfy associated performance criteria typically relies on qualitative and quantitative information. The input of technical expert – both in house as Rolling Action Plan (CoRAP), at http://echa.europa.eu/information-on-chemicals/evaluation/community-rolling-action-plan/corap-table 5 http://www.dtsc.ca.gov/SCP/upload/Informational_Initial_Candidate-Chemicals-List.pdf 6 http://www.epa.gov/osw/hazard/wastemin/priority.htm 7 http://www.epa.gov/oppt/sf/tools/pbtprofiler.htm
well as external – for guidance on the likelihood of an option being technically feasible and therefore implementable is typically required. Appropriate technical experts may include:
• Process engineers or scientists (chemists, materials scientists, etc.) • Academic researchers who have published closely related
scientific results associated with the performance criteria in question
• End users of the products or processes using the options being considered
• Marketing or sales staff familiar with customer requirements • Consultants with expertise in similar product development
Questions to ask as you evaluate the technical feasibility of the TUR options being considered include: 1. What are the performance needs for the application, process or
product that contains the toxic chemical for which TUR options are being sought? Why is the toxic being used in this specific application? • Does the chemical provide a specific function that is important for
its performance?
2. Has the TUR option already been identified as favorable with respect to performance? • Is the TUR option currently being used (i.e., by other industries) for
the same or similar functional application under review? • Is the TUR option currently used in similar products available on the
commercial market? • Is the TUR option marketed in promotional materials as an option for
providing the desired functionality for the specific application of interest?
3. Is this option available? • Is this option “off-the-shelf” technology with demonstrated
successful use? • What is the likelihood of widespread commercialization? • How reliable is the new technology? • What is the vendor's track record? • Is this option applicable to my firm? Is the option being produced
in sufficient quantity to meet the demand if it is used in place of the toxic?
4. Is the option compatible with existing process technology? • Are equipment, materials, or processes used in the option
compatible with current procedures, work flows, and production rates?
Evaluating TUR Options
54
• Will the system installation require downtime that will interfere with the production schedule?
• How complex are the operations and maintenance requirements? • Is floor space available? • Are utilities available, or will they have to be installed? • Does this option require personnel training?
5. Will product quality be affected? • Will the defect rate increase? • Will the finished product still comply with customer
specifications? • Will the option affect the product cosmetically?
6. Will this option be viable for a sufficiently long term? • What is the toxics use reduction potential of this option? • Will this option remain viable despite market and regulatory
changes? • Is it flexible/durable enough for the firm’s anticipated needs?
Suppliers and industry trade associations may be able to help with information about new materials and systems. Often suppliers will allow companies to test new equipment on a trial basis or will provide bench scale or pilot scale demonstrations, or references to other customers who have implemented the technique. If you are considering changes in equipment or processes, try to visit facilities using the new equipment or process. Check the track record of the technology with operators on the floor to see how vendors’ claims work out in practice.
5.3.2 EH&S Evaluation The Massachusetts TUR program has been a key contributing model to alternatives assessment is that it reorients environmental protection discussions from problems to solutions this emerging field. The most important aspect of alternatives assessment is that it reorients environmental protection discussions from problems to solutions. For example, chlorinated solvents provide a service of degreasing and cleaning. Once we understand that it is this service that the solvent provides that we require, rather than the solvent itself, it is possible to think of a much wider range of alternatives. Options we might consider include ultrasonic cleaning, or less toxic aqueous cleaners, or even redesigning a metal part so that the need for cleaning is eliminated altogether.
5.3.2.1 Alternatives assessment process Alternatives assessment processes can lead to innovation and produce substantial cost savings for firms as well as health and environmental benefits for society. Alternatives assessment can also be a more efficient
If you are considering a process change that
involves a new piece of equipment, it is
important to consider such factors as
additional building services requirements (energy, water, etc.), maintenance issues
worker training needs, and ergonomic considerations.
Evaluating TUR Options
55
means of reducing multiple risks in the long term. Problem-based approaches generally examine one risk or problem at a time and are met with one solution at a time. Alternatives assessment calls attention to current and “on-the-horizon” alternatives. Resources that might otherwise be directed solely to the expensive and time-consuming process of characterizing problems can then focus on solutions.
A number of states have been working together to draft common language for assessing the availability of safer alternatives for chemicals of concern. TURI led the effort by this group to create a protocol for conducting safer alternatives assessments that is being used to inform state government policies and technical assistance practices. In addition, the group has drafted a Resource Guide that provides detailed guidance on the various elements of an alternatives assessment. This Guide can be accessed through the NEWMOA website8.
Another excellent resource for guidance in the process of assessing alternatives is the Occupational Safety and Health Administration (OSHA)’s Transitioning to Safer Chemicals9 program.
For input substitution TUR options, the remaining steps in Alternatives Assessment (screening, comparing, and selecting alternatives) are the primary focus of your TUR options evaluation. Implementing and promoting the adoption of the most feasible and safest alternative(s) is done in accordance with your facility’s business strategy.
Once the “bad actor” chemicals have been screened out from further evaluation, it is important to gather sufficient additional information on possible options to evaluate if, in the case of chemical input substitution, the alternatives being considered are in fact safer than the toxic chemical currently being used.
For example, historically the chemical 1-bromopropane (otherwise known as n-propyl bromide or nPB) had been considered an appropriate and preferred alternative for things like methylene chloride in adhesives, or trichloroethylene (TCE) in vapor degreasing because it could essentially be used as a drop in replacement and, until recently, was not well regulated. However there had been very clear scientific evidence of the acute and chronic health hazards associated with exposure to nPB in the literature for decades. Companies that relied solely on regulatory lists to assess if nPB was an acceptable TUR option found themselves having to make another costly process change years later in order to achieve toxics use reduction. Had those same companies conducted a more thorough investigation of the potential hazards associated with using nPB in their facilities initially, they may have been able to make a more informed
substitution decision that would have led to a more reliable and longer term solution.
5.3.2.2 Tools for finding EH&S data There are on-line tools available to assist in identifying any relevant regulatory and chemical restrictions on toxic chemicals. These tools, such as the ChemHAT tool10, designed for workers and freely available, and the Pharos Project11, designed for building material users, specifiers and designers, and available for a nominal subscription fee, provide a good first step for determining if a potential chemical substitute should be considered further. By utilizing a number of lists as compiled in tools like ChemHAT and Pharos companies will be more likely to avoid regrettable substitutions like the example above because they wrongly assumed that the absence of a chemical alternative on a specific list is an indication that it is safer. However, even using more lists can still lead to regrettable substitutions. If the chemical input substitution being considered is not present on any lists, companies can conduct a relatively cursory review of scientific data to identify if there are any indications for concern. The use of a Safety Data Sheets (SDS) is not intended to be a comprehensive source of information; however it does provide important information about the various hazardous constituents present in a product and the human and environmental health hazards and likely routes of exposure associated with those hazardous constituents.
The Toxics Use Reduction Institute routinely uses an assessment tool, P2OASys (which stands for Pollution Prevention Options Assessment System) to more systematically evaluate whether a potential input substitute is safer than the toxic chemical being replaced. This tool uses SDSs as well as other data sources to evaluate up to 68 criteria: from acute human health endpoints like respiratory sensitization, to physical and chemical characteristics such as flammability and vapor pressure, to process and work environment considerations such as resource use or exposure potential. The P2OASys system relies heavily on expert judgment, with guidance available on TURI’s website (www.turi.org/p2oasys).
A good additional source of information on scientific studies and interpretations of studies is the Toxicology Data Network (ToxNet), maintained by the US National Library of Medicine12. In fact, there are a great many sources of additional information that can be used to more fully characterize a chemical. The Massachusetts Toxics Use Reduction Institute has created a Library Guide for EH&S data, which can be
accessed at http://guides.turi.org/beyondmsds. There you can access a variety of resources for data by health, safety and environmental endpoint (e.g., carcinogenicity, flammability, persistence). There are a number of other related resources available at this site.
5.3.2.3 Input substitution considerations
As you consider the EH&S implications of a chemical input substitution option, questions to ask may include:
1. Does this option impact other Environmental, Health, or Safety requirements?
a. Consider air and water emission permits, OSHA regulations, Chemical Process Safety Management, etc.
b. Consider potential new byproducts and/or hazardous waste streams that may be generated.
2. Is this truly a safer input substitution? a. Does sufficient health, safety, and environmental data
about the option exist to make a reasonable comparison?
b. If data is unavailable or limited, are other technical methods available with which to make a reasonable estimation of the relative safety of the substance (e.g., modeling tools)?
c. Does this option shift risk, for example by making a final product safer while adversely affecting worker health and safety during manufacture?
3. Is this option truly TUR?
a. If implemented, would this option reduce the number and/or amounts of reportable toxic substances on Form R for this specific use?
5.3.3 Economic Evaluation The economic evaluation is intended to determine expensive the TUR option will likely be to implement. Economic aspects of implementing a TUR option to consider include operating costs, material costs and labor costs. In addition, there are less straight-forward costs, such as potential future liability, lost productivity due to worker illness, product quality, and corporate image, which must also be considered and which may affect an option’s overall economic feasibility.
A variety of methods for assessing the economic criteria are discussed in detail in Module 9: Financial Analysis. The methods of financial analysis can be used at this stage in the planning process to gauge the costs and savings associated with each option. When conducting an economic
analysis, it is important to be mindful of the overall objectives – to identify TUR options that are not only economically feasible, but that also result in a less toxic process/product and that perform at least as well as the toxic being reduced.
It is important to consider all the potential costs and savings associated with a potential TUR option. In other words, your financial considerations must go well beyond the initial capital cost of the option. Issues to consider during an economic assessment include:
1. What are the direct costs or savings of this option? • What capital expenditures will be needed to implement this
option? • What will it cost to operate and maintain the new system? • What are the treatment, storage, and disposal costs?
2. What are the hidden costs or savings associated with this option? • Can any negative cost impacts be mitigated in some way, such as
through bulk purchase contracts, recycling contracts, use minimization, etc.?
• Will this option affect costs of compliance-related activities? • Will this option decrease taxes and fees? • Will capital and operating expenses for emergency preparedness
decrease? • Will this option reduce costs for Personal Protection Equipment,
ventilation, and other worker safety requirements? • Will there be less lost time due to accidents or exposures? • Will Workers’ Compensation premiums decrease?
3. Will this option affect future liability? • Will there be less potential future liability for hazardous releases? • Will liability insurance premiums decrease? • Will potential penalties and fines be avoided?
4. Are there fewer tangible or non-monetized costs or benefits? • Will the firm’s public image be enhanced? • Will community and employee relations be improved?
5. What new revenue sources are associated with this option? • Will this option provide new markets for modified
products? • Does this option allow the sale or use of byproducts? • Does this option allow the sale or use of recovered products? • Will market share lost to competing non-toxic products be
regained?
Be mindful of the overall objectives of
an economic evaluation. If a given
TUR option costs less to implement, but will
increase worker exposure to a toxic, is
it really more cost-effective?
Evaluating TUR Options
59
In general, the approach for an economic evaluation is to first look at capital and operating costs and building the business case for implementing the option. However, if a project does entail significant capital costs, a more thorough economic analysis should be done that includes intangibles as well as standard costs and benefits. One of the more difficult intangible cost factors to quantify in assessing the feasibility of toxics use reduction is the potential liability associated with continued usage of toxics. This includes the potential for reduced liability insurance premiums.
When making investment decisions, a company will determine the appropriate return on investment for a given level of risk. If it can be shown that investing in a TUR option represents a reduced level of risk, the firm may opt to reduce its return on investment requirements. This can be done by extending the acceptable payback period or reducing the required rate of return.
5.4 Deciding Whether to Implement a TUR Option
In comparisons of more than a very few simple criteria, some form of hierarchy among the relevant criteria is established. For example, the objective of considering implementation of a chemical substitution is to identify a “safer” alternative. Determining the specific criteria associated with health and ecological impacts that are the most relevant to your specific applications should be weighted more heavily when making decisions.
The most important aspect of any TUR options evaluation is transparency. The thought process used, including all assumptions and rationales, must be made explicit so decisions made can be clearly understood and so that future TUR options evaluations constitute continuous improvement. Without clear documentation of the decision process, you run the risk of having to duplicate effort in subsequent evaluations. Most decisions incorporate the following steps:
1) Define the issue: What decision will be made based on the assessment (e.g., determination to implement a viable TUR option)?
2) Identify the decision making framework: Which process for
arriving at decisions works best for the chemical, product or process under evaluation? What are the key criteria upon which a decision can be made for each step of the TUR Option Evaluation?
3) Consider the reliability of information used for each step of the
TUR option evaluation: Sometimes data associated with key
Evaluating TUR Options
60
elements of the TUR Option Evaluation are not available or unreliable. The quality of the information collected may be an important factor in deciding whether or not to implement a TUR option.
A number of methods can be used to address complex decisions. For example, complex decisions can be broken down into more manageable decisions in which pairs of criteria are compared in a stepwise fashion. The criteria are aggregated and these groups of criteria are compared with each other. In some applications, large numbers of criteria are compared simultaneously in a multi-criteria analysis. In this instance, the values of the criteria often need to be normalized to enhance comparison and the relative importance of each criterion, its relative weight, needs to be defined.
The Interstate Chemicals Clearinghouse (IC2) is a collaborative effort of a number of US states and municipalities interested in promoting the adoption of safer chemicals and materials. In January 2014 the IC2 released an extensive Guide for conducting alternatives assessments, which can be accessed at http://theic2.org/alternatives_assessment_guide. The Guide includes guidance on several decision-making approaches that can be used when determining which input substitutions to implement.
If your company employs a quality manager, it is likely that individual has numerous techniques for deciding on alternatives. Involving your quality manager is also a good way to incorporate TUR planning into regular operations planning.
5.4.1 Less-Tangible Factors to Consider Impacts of implementing a TUR project include effects on: product quality, productivity, public image, market share, stakeholder relations, and employee health and safety, among others.
Some of these issues, such as “public image”, tend to be straightforward: the impact of a TUR project is presumed to be positive, and the question is ‘to what extent and how quickly’. Other issues, such as product quality, may arise as unintended consequences of the effort to reduce toxics. In these cases, toxics use reduction changes may have either a positive or a negative impact. After determining the nature of the possible impact of implementation, the project team must figure out how best to communicate fully the positive benefits, or it must consider ways to restructure the project to minimize unwanted consequences.
• Product quality: Customers are increasingly demanding environmentally-friendly products yet are often unwilling to surrender price or quality to achieve their expectations. A TUR project that is detrimental to product quality (e.g., through inferior material substitution or process changes that fail to meet design specifications) will rapidly translate into lost sales or into increased
costs of rework and downtime. Alternatively, a TUR initiative may improve quality and/or enable a product to be marketed as ‘green’, a benefit that may engender greater market acceptance and boost sales.
• Impact on Productivity/Capacity: Process changes resulting from the implementation of a TUR project could potentially increase or decrease the productivity and/or effective capacity of a plant. For example, an aqueous degreaser may reduce solvent use but may require a longer cycle time to effectively remove contaminants and dry sufficiently for subsequent process steps, thereby increasing throughput time and lowering productivity. On the other hand, installing new equipment to add a parallel process line might both reduce solvent use required for product changeovers and increase production capacity.
• Employee health and safety: Improving working conditions can have both substantial short and long-term benefits, including lower worker compensation rates due to safer conditions, lower health care payments, increased productivity, reduced absenteeism and reduced OSHA regulatory oversight. Combining equipment/process specifications with occupational health and safety data can provide documentation of expected improvements in working conditions. These short term benefits are only part of the value to workers, who can experience health impacts decades after first starting to use certain toxic chemicals. A company’s commitment to the long term health of their employees can be a powerful talent retention tool, as well as being a strong statement of social responsibility.
• Pro-active environmental strategy: Environmental regulation shows a clear trend toward increasingly stringent limitations for contaminants in air emissions, wastewater, and hazardous waste. TUR projects have the ability, inherent in their prevention philosophy, to position a company to meet or surpass projected future toxic use and discharge limits. A strong argument for a TUR project is its capacity to alleviate such unknown factors as purchase price, disposal costs, or new health issues that accompany the use of substances known to be environmentally damaging. A project team can mention these issues in a project justification packet and point to proposed new regulations or regulatory trends to support their arguments.
• Public image: The importance of an environmentally-correct image has greatly increased in the past decade, and many companies now tout their ‘green’ credentials. While a good public image is important for its own intangible reasons, its value is increasing as the link between a company’s public image and
Evaluating TUR Options
62
market acceptance of its products becomes stronger. Image can be especially important to a company that has suffered a poor environmental reputation. Although almost any pollution prevention project can bolster the environmental record of a business, one that directly addresses a publicly-recognized problem can be especially valuable. If a proposed TUR project eliminates a source of bad publicity, such as the discharge of effluent that discolors a waterway, the public relations benefits of the project should be strongly emphasized in the justification package.
• Market share (i.e., consumer acceptance): Numerous surveys have documented the trend of “green” consumerism, and companies have responded by emphasizing environmental attributes in new product development. The growing inclination of consumers to buy “green” refers to purchases of products or services that are environmentally-benign or that are offered by companies with good environmental records. This phenomenon goes beyond consumer purchasing, and is now a very relevant component of institutional purchasing. Massachusetts has an Environmentally Preferred Purchasing list of vendors and products that should be preferentially chosen by state agencies and institutions that is based on their “greener” footprint. A TUR project that ‘creates’ a green process or product may have a significant impact on sales, depending upon customer demand. A project justification proposal could promote the value of this factor by including survey data related to the particular industry or product type.
• Stakeholder relations: The term “stakeholders” can broadly include almost any person, group or organization with which a business has contact: employees, stockholders, lending institutions, customers, suppliers, surrounding communities and others. The benefits of a TUR project may affect relationships with these groups in different ways, such as public image, employee health and safety, and market share. Generally, most firms place increased importance on the value of being recognized as a “good neighbor”. If this is an important issue to the company, it should be mentioned as part of the justification argument in a project proposal.
5.4.2 Potential Financial Liability The financial liability from using and disposing of hazardous substances is potentially unlimited. One of the greatest benefits of a pollution prevention strategy is its capacity to reduce exposure to potential liability. Financial liability may be associated with:
5.4.3 Pilot Testing TUR Options After carefully considering the TUR options that have been identified, the goal is to choose at least one action to implement that will result in a reduction in toxic chemical use. However, the work that has been done to this point has been limited to an “academic” exercise that draws from the best available information to arrive at an informed decision. What has not been determined, however, is if the TUR option chosen will work as expected. Therefore, and particularly when considering TUR options that could result in potential impacts on product quality, process efficiency, or worker health and safety, or when considering implementing options that require significant capital expenditures, conducting a smaller scale pilot test of the option is advised.
Pilot test provide an opportunity to collect relevant data about the TUR option. Pilot test may reveal unanticipated benefits, such as improved throughput efficiencies, as well as unexpected challenges, such as throughput bottlenecks impacting subsequent process steps. If unintended problems occur, pilot test results offer the opportunity to modify your approach in order to achieve success.
Questions that should be considered in the piloting process include:
• Does the TUR option perform as expected • Are there an improvements or negative impacts on working
conditions • Are workers able to meet the needs of the new process or is
additional training required • Is product quality impacted • Are there any regulatory implications associated with the TUR
option that hadn’t been anticipated
Once the pilot testing is completed and any necessary modifications have been identified you can now scale up to full implementation of the TUR option.
5.5 Making the Business Case for Implementing TUR Options
Carefully considering the possible TUR options, and choosing to implement those that achieve TUR while protecting the overall competitive advantage of your company’s business is an important part of company strategies. It is essential to make the case to decision makers in
Evaluating TUR Options
64
your organization that implementing TUR options that have been carefully vetted is in the best interest of the company. To do this, you must identify your company’s strategic business priorities and determine how implementation of the TUR option fits into those priorities. Often the best way to convince a decision maker who may not be well versed in the environmental and human health benefits of reducing toxic chemicals that implementing a TUR option would represent a sound business decision is relate implementation to the financial benefits. Potential benefits of implementing TUR include:
• Reduced risk to workers, and risk of potential future liabilities • Reduced costs for exposure control (e.g., personal protective
equipment for workers and othe engineered controls associated with hazardous byproduct emissions)
• Reduced hazardous waste management and permitting costs • Potential reduction in insurance rates associated with creating a
safer workplace, and reducing potential for liability associated with unintended releases of hazardous chemicals
• Improved worker safety and enhanced worker productivity and motivation
• Improved public relationships with neighbors, regulators, and other stakeholders
• Marketing potential for your safer “greener” product or process.
Evaluating TUR Options
65
SOURCES and ENDNOTES • Alternatives Assessment Reference Guide, Interstate Chemicals
Clearinghouse, 2013, available at: http://www.newmoa.org/prevention/ic2/aaguidance.cfm
• Practical Guide to TUR, Massachusetts Office of Technical Assistance, 1992.
• Improving Your Competitive Position: Strategic and Financial Assessment of Pollution Prevention Projects, Northeast Waste Management Officials Association, 1994
• Facilitation at a Glance, GoalQPC, ISBN: 978-1-57681-104-7 i http://www.subsport.eu/case-stories-database ii Institute for Research & Technical Assistance, http://www.irta.us/reports.htm iii Toxics Use Reduction Institute case studies, http://www.turi.org/TURI_Publications/Case_Studies iv http://www.cleanersolutions.org/ v EPA Design for the Environment program, list of safer chemical ingredients, http://www.epa.gov/dfe/saferingredients.htm#more vi Catsub, an EU database of substitution case studies created by the Danish Working Environmental Authority, http://www.catsub.eu/ vii AFIRM Supplier Toolkit, http://www.afirm-group.com/wp-content/uploads/2013/11/AFIRMSupplierToolkit.pdf viiiPaint Strippers - PaintPRO Magazine ix Proxitol Glycol Ethers, Shell Global; Methyl PROXITOL (PM) Propylene Oxide Glycol Ether - Shell Global x Retired Engineers Technical Assistance Program, Michigan Department of Environmental Quality; http://www.michigan.gov/deq/0,4561,7-135-70153_70155_3585_4848---CI,00.html xi Massachusetts Office of Technical Assistance and Technology (OTA) xii Minnesota Technical Assistance Program University of Minnesota; About Us | Minnesota Technical Assistance Program xiii Washington State Department of Ecology; Technical Assistance | WA State Dept. of Ecology xiv Toxic Use Reduction Institute Library, University of Massachusetts, Lowell; TURI Publications / TURI - TURI - Toxics Use Reduction Institute xvhttp://www.p2rx.org/programs/index.cfm?pageAction=searchByProgramType&ProgramTypeID=2&Format=WDDX®ion=0 xvi http://www.subsport.eu/search-substitution-db
Recommended or Required Exposure Controls/Protective Equipment
Other information
Acme Electronics
TUR Options Identification
Acme now wants to find a replacement for nPB cleaning.
1. In your group, brainstorm at least one potential TUR option for each of the six TUR
techniques.
2. Where would you go (i.e., what resources would you use) to gather more information?
TUR Technique Options for Reducing Use of nPB
Input Substitution
Product Reformulation
Production Unit Redesign/Modification
Production Unit Modernization
Improved Operations and Maintenance
Recycling which is integral to the process
Acme Electronics
TUR Options Evaluation – Performance and Cost
Consider the following in your small groups (estimate 15 min for performance and 15 min for cost evaluations):
1. List key performance criteria that should be considered as you further evaluate the technical feasibility of the TUR options identified above.
a. Who from your team should be part of this step of the TUR planning process?
b. Where would you look to find information to assess these criteria?
2. What are your preferred options for further evaluation? Why?
3. What options do you consider to be “clearly technically infeasible”? Why?
As an initial part of evaluating the financial feasibility of potential TUR options, Acme must quantify its current costs related to the use of nPB. These will then be compared relative to costs in the same categories for the new option(s).
1. The following pages provide a list of potential cost factors and other information identified by the TUR Planning options team. Tabulate the existing costs attributable to using nPB, then the corresponding anticipated costs for your leading alternative solution.
Cost factor Current Yearly Cost
of Using nPB
Anticipated Yearly Cost if Alternative is Implemented
2. Based on the above, decide in your group on your course of action. What factors would you include in making a business case to upper management for your decision?
Potential cost-related elements suggested in TUR Options ID screening: • nPB Use
1. Purchase records indicate that Acme currently uses about 18,000 lbs of nPB yearly (approximately 30 55-gallon drums).
2. Last year, according to purchase records, the hazardous waste hauler processed 15,563 lbs of nPB-related hazardous waste, which includes flux residues and nPB ‘dragout’.
• Recycling and Hazardous Waste Management
1. The current nPB cleaning system captures used solvent as liquid, separates out waste flux (which includes some nPB ‘dragout’), and hard-pipes filtered nPB back into the cleaning process.
2. Some nPB is lost as fugitive air emissions. 3. Waste flux is treated as a hazardous byproduct by Acme. 4. Sometimes, the cleaning station operator needs to use a brush to dislodge larger or sticky flux
residues. These brushes are replaced approximately monthly and managed as hazardous waste.
• Regulatory considerations 1. nPB is regulated as a reproductive or developmental toxic in the EU. It is not currently regulated as
a hazardous substance by the US EPA. 2. nPB is on the REACH Substances of Very High Concern (SVHC) candidate list. 3. EPA has announced they may propose a rule that would make nPB unacceptable as an aerosol
solvent or adhesive carrier. 4. EPA recommendations also call for maximum production rate of 10 ft. per minute through nPB
cleaning operations.
• Worker exposure, health and safety. 1. The current Threshold Limit Value (TLV), as recommended by the American Conference of Industrial
Hygienists (ACGIH) for nPB exposure is 10 ppm, but ACGIH has announced its intention to change it to 0.1ppm. Currently the California Occupational Safety and Health board limits nPB exposure to 5 ppm.
2. nPB has a vapor pressure of 110.8 mm Hg at 20°C 3. Current worker protection controls for nPB exposure at Acme include a local ventilation system in
the board cleaning area. The ventilation system vendor specifies and warrants performance of nPB emissions at or below 1 ppm at operator position when used with a ventilator face velocity of 135 ft./min. – nearly the maximum velocity achievable by this system. This was verified by direct measurement 1 month after ventilation system installation. The cost to purchase and install this ventilation system cost $13,000 when the facility was first built. Similar systems would be required for each new production line if any were to be built. Estimated capital costs for new systems would be about 20% more at current prices.
4. Other PPE includes flexible laminate gloves, aprons, and goggles for workers near the board cleaning station.
• Workmen’s Comp Insurance: 1. A recent Continuing Education Conference presentation suggests that current premiums could be
reduced 75-80% if VOC ‘s were eliminated from operations. 2. After a spill of nPB two years ago, which required suspending operations for that shift, Acme’s
insurance agent sent a warning that Acme could be assigned to a high risk pool if it happens again. This would increase premiums by as much as 40%.
3. Acme responded to the spill by implementing a more robust and vigorous spill prevention and response procedure. Management decided not to communicate this with the insurance agent, reasoning that it was best not to raise the issue further.
• Sales and supply chain requirements:
1. Acme’s sales department has enticed two large, well-known computer manufacturers, Pendragon & Hipplewhite (P&H) and Swell Computer Corp., into considering Acme as a supplier of PC motherboards. Either of these deals would increase production volume by over 100% within 1 year, and management is confident that it could ramp up production fast enough to meet this demand. Since the existing production line is running near capacity, procuring either of these deals would involve duplicating the existing production unit. Sufficient floor space exists.
2. The key considerations for acquiring these deals are Acme’s ability to maintain product quality and production level if they get the new business.
3. Both potential customers are subscribers to the EPEAT Standard (Electronic Product Environmental Assessment Tool) and the European Computer Manufacturers Association (ECMA) Eco-declaration. EPEAT requirements include compliance with the EU RoHS Directive, reduction of substances on the EU REACH Candidate List of SVHCs, and eliminating or reducing all brominated and chlorinated flame retardant content of printed circuit board laminates
4. Swell Computer requires that suppliers provide a Materials Declaration that indicates conformance with RoHS and REACH restrictions. Suppliers must provide the amounts of REACH SVHCs and RoHS substances that are present in the articles they supply.
5. P&H is a major user of Green Screen to evaluate substances, and requires supplier to certify that their products contain no substances with a Green Screen benchmark score of 1.
• Miscellaneous considerations
1. A recent Crain’s Business article profiling Acme was very favorable, noting the company’s high profitability relative to the industry.
2. Acme is currently privately held, and so does not have to disclose financial information to the public. 3. The owners have said that an IPO (Initial Public Offering of shares) is a possibility in order to fund
future growth. If they issue an IPO, employees would have the option to purchase shares at a discount relative to the IPO issue price.
In-plant changes in production processes or raw materials that reduce, avoid, or eliminate the use of toxic or hazardous substances or generation of hazardous byproducts per unit of product, so as to reduce risks to the health of workers, consumers, or the environment.
For each toxic chemical used, identify and characterize:
– Purpose– Total amounts and amounts per unit of product – Byproduct fate: amounts released on-site, treated on-site and off-
site, recycled on-site and off-site, and disposed of on-site and off-site
– Emissions to each media: amounts released on-site, disposed on-site, transferred off-site, and treated, recycled and disposed of off-site to air, surface water, ground water, and land
– Cost of toxics (qualitative or quantitative)• Quantitative if technically feasible options identified• Qualitative if no technically feasible options identified
EmissionsEmissions: Byproducts that are released to the environment OR are transferred to an onsite or offsite management facility
Emissions = Total byproduct – quantity of byproduct destroyed in onsite treatment
Outputs to onsite treatment or recycling = ByproductOutputs to onsite treatment or recycling = Byproduct
Outputs to the environment from onsite treatment or recycling = EmissionOutputs to the environment from onsite treatment or recycling = Emission
Emissions include:Emissions include:
• Air (Point and Fugitive)• Waste Water (to POTW, surface water, ground water, etc.)• Surface water, ground water (storm drains)• Hazardous and Solid Wastes sent to Waste Management Facilities • Off-Site Recycling
(return D1 to process tank)• Base tank dumps on tank analysis
(reduce W1 and H1)• Train operators to minimize spills (reduce S1)• Cover tank when not in use (reduce A1)• Implement preventative maintenance programs
(reduce S1)– * reverse osmosis, ion exchange or electrolytic recovery
Scrap tires are ground up to create crumb rubber, which is used as cushioning infill in artificial turf fields, as filler in paving material, as filler in molded and extruded products, and for a variety of other uses.
Sample testing of manufactured crumb rubber indicates that there is a concentration of 56 ppm of Lead (Pb) in the product.• If 2000 tons of crumb rubber are produced in a year, how much Lead is
processed?• Does this amount need to be reported under TRI? (The reporting
Problem 2: Byproduct CalculationCalculate the Total Byproduct and EmissionsProduction Unit B is a vapor degrease operation. The company purchased 4,500 lbs of TCE to operate this production unit for one year. The fugitive emissions from the degreaser (A1) were determined to be 20% of the amount of TCE used in the degreaser. The fugitive emissions from the recycler (A2) were determined to be 5.0% of the TCE sent to the recycler. The spent TCE sent from the degreaser to the recycler was 10,000 lbs for the year. The recycling process recovered 80% of the TCE that was sent to it.
A1 – Fugitive emissionsA2 – Fugitive emissionsB1 – Incinerated solventR1 – Spent solvent to recyclerR2 – Recycled solventP – Purchased solventS – Solvent used in degreaser
Problem 3: Back-Calculating Byproduct from Treatment Records
Production UnitByproductInfluent = ?
WastewaterPretreatment
Sludge
Effluent
Calculate the annual byproduct generation of copper
Sludge Data Values Data Sourceconcentration Cu 40% periodic monitoringvolume of sludge 600 gal/yr waste disposal recordsdensity of sludge 30 lb/gal lab results
Effluent Data Cu conc. in effluent 2.8 ppm monitoring avg flow of effluent 0.030 MGD POTW, flow meter
Assumptions• Concentration by weight• Volume includes all constituents, not just copper• Production time is 255 days/year
One process includes a toluene degreasing step. Fresh toluene is added to an open-top vapor degreaser at a rate of 8000 lb/yr. 75% of the total toluene input is lost to evaporation, the rest is sent to a non-integral recycling still. 2,000 lb/yr of recycled toluene from the still is added back to the degreaser. The still loses 15% of the total in it to evaporation. The still bottoms are sent off-site as hazardous waste. The process is at steady state.
1. Draw a process flow diagram of this production unit.
2. Calculate the total emissions and total byproducts from this production unit.
21
One accurate measurement is worth a thousand expert opinions.
• Consider options in the following categories:– Input substitution – Product reformulation– Process redesign/modification/modernization– Improved operations and maintenance– Recycling
Replace chemical w/ less hazardous option• May not reduce amount of waste, but waste is less hazardous• Drop-in substitutes don’t require process changes (and are
rare) • Some options may require equipment or product
• Recycling, reuse, or extended use of toxics by using equipment or methods which are integral to the process, including filtration and other closed loop methods
Examples:– Capture and recycle cleaning solvents– Regeneration of acid instead of disposal of acid– Recycle and reuse spent rinse water– Distill and reuse solvent strippers
Assessing Input Substitution OptionsIn order to determine if a substitute is safer you need to first fully characterize the toxic chemical you’d like to replace
For input substitution, characterize potential alternatives and compare to the toxic
on ingredients4. First aid measures5. Firefighting measures6. Accidental release
measures7. Handling and storage8. Exposure
control/personal protection
9. Physical and chemical properties
10.Stability and reactivity11.Toxicological information12.Ecological information13.Disposal considerations14.Transport information15.Regulatory information16.Other information
• Cost factors in adopting water-based adhesive process
– While water-based adhesive costs more per gallon than methylene chloride adhesive, higher solids content of water-based adhesive resulted in lower volume used, net cost savings
– Energy cost of heat required to cure water-based adhesives compensated for by faster drying, increased throughput
– Operational savings paid for capital costs in short term, provided greater long-term profitability
• Improved PR• Market advantage of “green” operations
Benefits
I always make the business case for sustainability. It’s so compelling. Our costs are down, not up. Our products are the best they have ever been. Our people are motivated by a shared higher purpose — esprit de corps to die for. And the goodwill in the marketplace — it’s just been astonishing.