ELSEVTER Hearing Research 76 (1994) 188-202 Topographic representation of tone intensity along the isofrequency axis of cat primary auditory cortex Peter Heil *-a, R. Rajan b, D.R.F. Irvine b u Institute of Zoology Technical University Dannstndt, Schnittspahmtrasse 3, 64287 Darmstadt, FRC ’ Department of ~~ychalo~, ~a~ush ~ni~lers~~, Cfayton, Et&a 3168, Australia (Received 3 August I993; Revision received 14 February 1993; Accepted 23 Februar): 1993) Abstract The sound pressure levei (SPL), henceforth termed intensity, of acoustic signals is encoded in the central auditory system by neurons with different forms of intensity sensitivity. However, knowledge about the topographic organization of neurons with these different properties and hence about the spatial representation of intensity, especially at higher levels of the auditory pathway, is limited. Here we show that in the tonotopically organized primary auditory cortex (Ai) of the cat there are orderly topographic organizations, along the isofrequency axis, of several neuronal properties related to the coding of the intensity of tones, viz. minimum threshold, dynamic range, best SPL, and non-monotonicity of spike count - intensity functions to tones of characteristic frequency CCF). minimum threshold, dynamic range, and best SPL are correlated and alter periodicaliy along isofrequency strips. The steepness of the high-intensity descending slope of spike count - intensity functions also varies systematically, with steepest slopes occurring in the regions along an isofrequency strip where low thresholds, narrow dynamic ranges and low best SPLs are found. As a consequence, CF-tones of various intensities are represented by orderly and, for most intensities, periodic, spatial patterns of distributed neuronal activity along an isofrequency strip, For low - to -moderate intensities, the mean relative activity along the entire isofrequency strip increases rapidly with intensity, with the spatial pattern of activity remaining quite constant along the strip. At higher intensities, however, the mean relative activity along the strip remains fairly constant with changes in intensity, but the spatial patterns change markedly. As a consequence of these effects, low- and high-intensity tones are represented by complementary distributions of activity alternating along an isofrequency strip. We conclude that in AI tone intensity is represented by two complementary modes, viz. discharge rate and place. Furthermore, the magnitude of the overall changes in the representation of tone intensity in AI appears to be closely related to psychophysical measures of loudness and of intensity discrimination. Key wurds: Intensity; Intensity discriminations Loudness; Topography~ Auditory cortex 1. Introduction Humans and various animals can perceive sounds that differ in sound pressure level (SPL), henceforth termed intensity, over a large range (> 130 dB for humans) and can discriminate small differences in in- tensity over a similarly Iarge range (for reviews see e.g. Viemeister, 1988; Smith, 1988; Fay, 1988). Intensity coding over such a wide range is likely to occur either solety or predominantly within frequency-specific chan- nels (Viemeister, 1988), rather than by a spread of excitation to other frequency channels as a conse- * Corresponding author. Fax: +49 (61511 164 808. 0378-5955/94/$07.00 0 1994 Elsevier Science B.V. All rights reserved SSDI 0378-5955(94)00040-w quence of broader cochlear partition displacement pat- terns at higher intensities. At the level of the auditory nerve, it has been proposed that intensity coding over a wide range is achieved by the activation of fibers of the same CF (characteristic frequency; frequency of lowest threshold) but different threshold and dynamic range characteristics (viz., low-threshold/narrow-dynamic range fibers, intermediate-threshold/moderate-dy- namic range fibers, and high-threshold/wide-d~amic range fibers) (e.g. Sachs and Abbas, 1974; Winter et al., 19901. It is not clear that similar categories of intensity-response types are present at higher levels of the central auditory system (e.g. Semple and Kitzes, 1985; Ehret and Merzenich, 1988; Irvine and Gago, 1990; Phillips, 1990). Further, whereas spike - count
Transcript
ELSEVTER Hearing Research 76 (1994) 188-202
Topographic representation of tone intensity along the isofrequency axis of cat primary auditory cortex
Peter Heil *-a, R. Rajan b, D.R.F. Irvine b
u Institute of Zoology Technical University Dannstndt, Schnittspahmtrasse 3, 64287 Darmstadt, FRC ’ Department of ~~ychalo~, ~a~ush ~ni~lers~~, Cfayton, Et&a 3168, Australia
(Received 3 August I993; Revision received 14 February 1993; Accepted 23 Februar): 1993)
Abstract
The sound pressure levei (SPL), henceforth termed intensity, of acoustic signals is encoded in the central auditory system by neurons with different forms of intensity sensitivity. However, knowledge about the topographic organization of neurons with these different properties and hence about the spatial representation of intensity, especially at higher levels of the auditory pathway, is limited. Here we show that in the tonotopically organized primary auditory cortex (Ai) of the cat there are orderly topographic organizations, along the isofrequency axis, of several neuronal properties related to the coding of the intensity of tones, viz. minimum threshold, dynamic range, best SPL, and non-monotonicity of spike count - intensity functions to tones of characteristic frequency CCF). minimum threshold, dynamic range, and best SPL are correlated and alter periodicaliy along isofrequency strips. The steepness of the high-intensity descending slope of spike count - intensity functions also varies systematically, with steepest slopes occurring in the regions along an isofrequency strip where low thresholds, narrow dynamic ranges and low best SPLs are found. As a consequence, CF-tones of various intensities are represented by orderly and, for most intensities, periodic, spatial patterns of distributed neuronal activity along an isofrequency strip, For low - to -moderate intensities, the mean relative activity along the entire isofrequency strip increases rapidly with intensity, with the spatial pattern of activity remaining quite constant along the strip. At higher intensities, however, the mean relative activity along the strip remains fairly constant with changes in intensity, but the spatial patterns change markedly. As a consequence of these effects, low- and high-intensity tones are represented by complementary distributions of activity alternating along an isofrequency strip. We conclude that in AI tone intensity is represented by two complementary modes, viz. discharge rate and place. Furthermore, the magnitude of the overall changes in the representation of tone intensity in AI appears to be closely related to psychophysical measures of loudness and of intensity discrimination.
Humans and various animals can perceive sounds that differ in sound pressure level (SPL), henceforth termed intensity, over a large range (> 130 dB for humans) and can discriminate small differences in in- tensity over a similarly Iarge range (for reviews see e.g. Viemeister, 1988; Smith, 1988; Fay, 1988). Intensity coding over such a wide range is likely to occur either solety or predominantly within frequency-specific chan- nels (Viemeister, 1988), rather than by a spread of excitation to other frequency channels as a conse-
* Corresponding author. Fax: +49 (61511 164 808.
0378-5955/94/$07.00 0 1994 Elsevier Science B.V. All rights reserved SSDI 0378-5955(94)00040-w
quence of broader cochlear partition displacement pat- terns at higher intensities. At the level of the auditory nerve, it has been proposed that intensity coding over a wide range is achieved by the activation of fibers of the same CF (characteristic frequency; frequency of lowest threshold) but different threshold and dynamic range characteristics (viz., low-threshold/narrow-dynamic range fibers, intermediate-threshold/moderate-dy- namic range fibers, and high-threshold/wide-d~amic range fibers) (e.g. Sachs and Abbas, 1974; Winter et al., 19901. It is not clear that similar categories of intensity-response types are present at higher levels of the central auditory system (e.g. Semple and Kitzes, 1985; Ehret and Merzenich, 1988; Irvine and Gago, 1990; Phillips, 1990). Further, whereas spike - count
P. Heil et ul. /Hearing Research 76 (1994) 188-202 IX’)
intensity functions of auditory-nerve fibers are all
monotonic (e.g. Winter et al., 19901, those of many central neurons may be non-monotonic, such that spike counts increase with SPL for low - to - moderate
intensities, peak at a particular SPL (best SPL), and then decrease at higher SPLs (e.g. Brugge and Merzenich, 1973; Suga, 1977; Pfingst and O’Connor,
1981; Phillips and Irvine, 1981; Semple and Kitzes, 1985; Ehret and Merzenich, 1988; Irvine and Gago, 1990; Phillips, 1990; see Smith, 1988 for review).
Lesion studies suggest that the auditory cortex may play a role in intensity discrimination (Oesterreich et al., 1971). The spatial distribution of neurons with
different CFs in the auditory cortex of various mam- mals is well-known (for review see e.g. Aitkin, 1990;
Thomas et al., 1993) and, in many cortical fields, is
highly systematic (tonotopic organization). Orthogonal to the axis of tonotopic organization (i.e. along the isofrequency axis) neurons with the same, or at least
very similar, CF may code for other response proper- ties in that frequency-channel, such as sound intensity. However, our knowledge about any such spatial distri- bution of the representation of sound intensity along the isofrequency axis is limited. In a specialized region of the auditory cortex of the echolocating mustached bat - the Doppler-shifted constant-frequency (DSCF) processing area - non-monotonic neurons with differ-
ent best SPLs are arranged in an orderly fashion (Suga, 1977). However, a similar amplitopic organization has not been described in other, less-specialized mammals.
In the tonotopically organized primary auditory cortex (AI) of the cat (Merzenich et al., 1975), a spatial separation of monotonic and non-monotonic multi- units was reported by Phillips et al. (1985), and Imig et al. (1990) found clustering of units with similar SPL
selectivities. Two recent studies (Schreiner at al., 1992; Heil et al., 1992b) have reported that there are orderly topographic organizations in cat AI of some parame-
ters related to intensity coding. In our earlier study we demonstrated orderly topographic organizations of minimum threshold and dynamic range along the
isofrequency axis of cat AI (Heil et al., 1992b). While these data strongly suggest an orderly representation of
sound intensity along the isofrequency axis of Al, the
frequent occurrence of non-monotonic spike - count
intensity functions would be expected to have signifi- cant effects on the spatial representation of sound
intensity along the isofrequency axis. The present study addresses this issue and shows that the degree of non-monotonicity is also topographically organized in
AI. This has some unexpected consequences for the representation of tone intensity along the isofrequency axis and also relates to psychophysical data on loud- ness and on intensity discrimination. Some of the re-
sults have been presented in abstract form (Heil et al.,
1993a,b).
2. Materials and methods
Six adult cats (four females, two males) with normal N, audiograms (Rajan et al., 1991) served as subjects.
All details of anesthesia, surgery, stimulus generation and recording procedures have been described in de-
tail (Heil et al., 1992a,b). Briefly, animals were deeply anesthetized with pentobarbital sodium (40 mg/kg i.p.) and anesthesia was kept at a surgical level during surgery and recordings (up to 36 h) by supplementary i.v. doses at a rate of about 2-3 mg/kg/h. ECG and pupillary size were monitored continuously, and rectal
temperature was kept near 38°C. After cannulation of the trachea, both meatuses were resected and a cran- iotomy was performed over the left auditory cortex.
The dura was removed and a specially-designed plastic chamber, filled with warm mineral oil or artificial cere- brospinal fluid, was fixed to the skull surrounding the craniotomy. The chamber was closed with a glass-plate containing a central post which housed a glass-in-
sulated tungsten microelectrode, and on which a hy- draulic micromanipulator was mounted. Acoustic stim- uli (150-ms tone bursts, 4-ms rise and fall times, 1-2/s) were generated by a computer-controlled digital stimu- lus system and delivered to the animal’s ears through pre-calibrated closed sound delivery systems (STAX
SRS-MK3). The electrode was advanced perpendicular to the
Table I Relationship between best SPL (y) and minimum threshold (x) for multi-units along an isofrequency strip of AI
Cat Mean CF N Linear regression r P + I SD. tkHz)
90-36 YO-46
Y&S I
90-56
YO-73
90-74
Pooled *
* Pooled data include measures from AI multi-units outside the specified isofrequency strips
cortical surface and penetration sites were marked with reference to the surface vasculature on a high-magnifi- cation photograph of the exposed cortex. Multi-unit activity was recorded in the middle layers of the left AI as identified by its tonotopic gradient (Merzenich et al., 1975). The discriminator level of the Schmitt trigger was set high to select only spikes from about 2-5 units. Most penetrations in each case were placed along the dorsoventral extent of an isofrequency strip (see Fig. 3) in the high-CF region (about 15-25 kHz; see Table f 1 of AI. After audiovisual determination of CF and minimum threshold, spike counts were collected to stimulation of the contralateral ear with tone bursts of different frequencies and intensities presented over a user-determined matrix in a pseudo-random fashion. Only spikes occurring in the 50 ms after the onset of l50-ms tone bursts were counted. From these data, spike - count intensity functions for CF-tones (hereafter referred to as intensity functions) were ob- tained. Intensity functions were almost always mea- sured up to 60 dB SPL, but intensities higher than 80 dB SPL were never used.
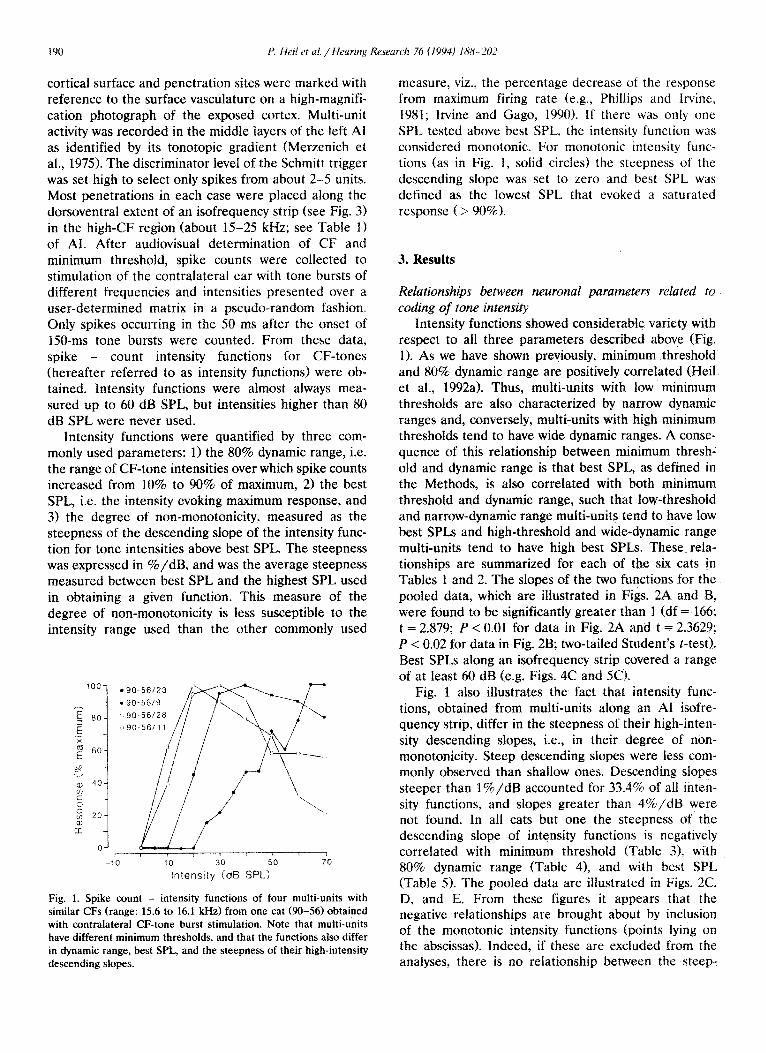
Intensity functions were quantified by three com- monly used parameters: 1) the 80% dynamic range, i.e. the range of CF-tone intensities over which spike counts increased from 10% to 90% of maximum, 2) the best SPL, i.e. the intensity evoking m~mum response, and 3) the degree of non-monotonicity, measured as the steepness of the descending slope of the intensity func- tion for tone intensities above best SPL. The steepness was expressed in %/dB, and was the average steepness measured between best SPL and the highest SPL used in obtaining a given function. This measure of the degree of non-monotonicity is less susceptible to the intensity range used than the other commonly used
r I I 1 -10 10 30 50 70
Intensity CdB SPL)
Fig. 1. Spike count - intensity functions of four multi-units with similar CFs (range: 15.6 to 16.1 kHz) from one cat (90-56) obtained with contralateral CF-tone burst stimulation. Note that multi-units have different minimum thresholds, and that the functions also differ in dynamic range, best SPL, and the steepness of their high-intensi~ descending slopes.
measure, viz., the percentage decrease of the response from maximum firing rate (e.g., Phillips and Irvine, 1981; Irvine and Gago, 1990). If there was only one SPL tested above best SPL, the intensity functi~~n was considered monotonic. For monotonic intensity func- tions (as in Fig. 1, solid circles) the steepness of the descending slope was set to zero and best SPL was defined as the lowest SPL that evoked a saturated response ( > 90%).
3. Results
Relationships between neuronal parameters related to coding of tone interim
Intensity functions showed considerable variety with respect to all three parameters described above (Fig. 1). As we have shown previously, minimum threshold and 80% dynamic range are positively correlated (Heil et al., 1992a). Thus, multi-units with low minimum thresholds are also characterized by narrow dynamic ranges and, conversely, multi-units with high minimum thresholds tend to have wide dynamic ranges. A conse- quence of this relationship between minimum thresh- old and dynamic range is that best SPL, as defined in the Methods, is also correlated with both minimum threshold and dynamic range, such that low-threshoid and narrow-dynamic range multi-units tend to have low best SPLs and high-threshold and wide-dynamic range multi-units tend to have high best SPLs. These rela- tionships are summarized for each of the six cats in Tables 1 and 2. The slopes of the two functions for the pooled data, which are il1ustrated in Figs. 2A and B, were found to be significantly greater than 1 (df = 166; t = 2.879; P < 0.01 for data in Fig. 2A and t = 2.3629; P < 0.02 for data in Fig. 2B; two-tailed Student’s t-test). Best SPLs along an isofrequency strip covered a range of at least 60 dB (e.g. Figs. 4C and 5Cl.
Fig. 1 also illustrates the fact that intensity func- tions, obtained from multi-units along an AI isofre- quency strip, differ in the steepness of their high-inten- sity descending slopes, i.e., in their degree of non- monotonicity. Steep descending slopes were less com- monly observed than shallow ones. Descending slopes steeper than l%/dB accounted for 33.4% of all inten- sity functions, and slopes greater than 4%/dB were not found. In all cats but one the steepness of the descending slope of intensity functions is negatively correlated with minimum threshold (Table 31, with 80% dynamic range (Tabfe 41, and with best SPL (Table 5). The pooled data are illustrated in Figs. 2C, D, and E. From these figures it appears that the negative relationships are brought about by inclusion of the monotonic intensity functions (points lying on the abscissas). Indeed, if these are excluded from the analyses, there is no relationship between the steep-
ness of the descending slope of intensity functions and minimum threshold, dynamic range, or best SPL.
Topographic organization of neuronal parameters related
to codirzg of tone intensity
Figs. 4 and 5 (left columns) illustrate the topo-
graphic organization of the different parameters of intensity functions along the AI isofrequency axis for
two representative cases (90-46 and 90-56; cf. Tables
l-5). Fig. 3 shows the surface locations of the penetra-
60 7 A . .
. . . . . . . 70 f . . . . . . . .
. . . . . . . . . . . .
i 60 . . . . . . . . . . , . .
% 50
1 - -.
. . . . . . . .
. . . . . . . . . . .
s . . . . : . . .
a”
40 . . . . . . . . . .
rn30 . .
1. .
.
. . . . . . . . . .
. . . . . . .
z . . . . . . . . .
2 20 . . . ._ . . . .
10 *
Od : : : : : : :---r--i
-5 0 5 10 15 20 25 30 35 40
Minimum Threshold fdB SPLI
04 : : : - t-4
5 0 5 10 15 20 25 30 35 40
Minimum Threshold tdB SPL)
. . *,..
- . : . ’ i . -
*. . i .
. .
i.I;:‘i: - ‘.. * .’ : -1
: -
tion sites, relative to sulcal landmarks, in the left AI of
these two cats and illustrates how the topographic plots
of Figs. 4 and 5 are derived. As we have described previously (Heil et al., 1992b), minimum threshold and 80% dynamic range alter periodically between low and
high values along an isofrequency strip of AI (Figs. 4A and 5A). Along the 3-5 mm of the isofrequency strips
studied in different cats, two or three areas of high threshold and large dynamic range are separated by
areas of low threshold and narrow dynamic range.
. . . . *- * -* . . _ . _ ‘..
. . . . . . . . ,.. . . .
_ . . . . . . , . . . .
. . . _ . _.
_.. . -.
. . . . . . . . . .
_. . ._ . . .
..I._ ._ . . .
,. _._ . .
_ ._ . .
_. _. . .
I . 10 t
o I,- ___._,_~~__ ,_< 0 10 20 30 40 50
80% Dynamic Range tdB)
80% Dynamic Range (dB)
0 J , 0 20 40 60 80
Best SPL tdB SPL)
Fig. 2. Scatterplots illustrating the relationships between minimum threshold and best SPL (A), X07> dynamic range and best SPL (B). minimum
threshold and degree of non-monotonicity (0, 8096 dynamic range and degree of non-monotonicity CD), and best SPL and degree of
non-monotonicity (E). Data were pooled from six cats and each panel contains a total of 16X measures. Some symbols represent more than a
single measure. Dashed lines represent the results of linear regression analyses (cf. Tables 1-S).
192 P. Neil et ul. / Ikaring Research 76 (I 994) I XH-202
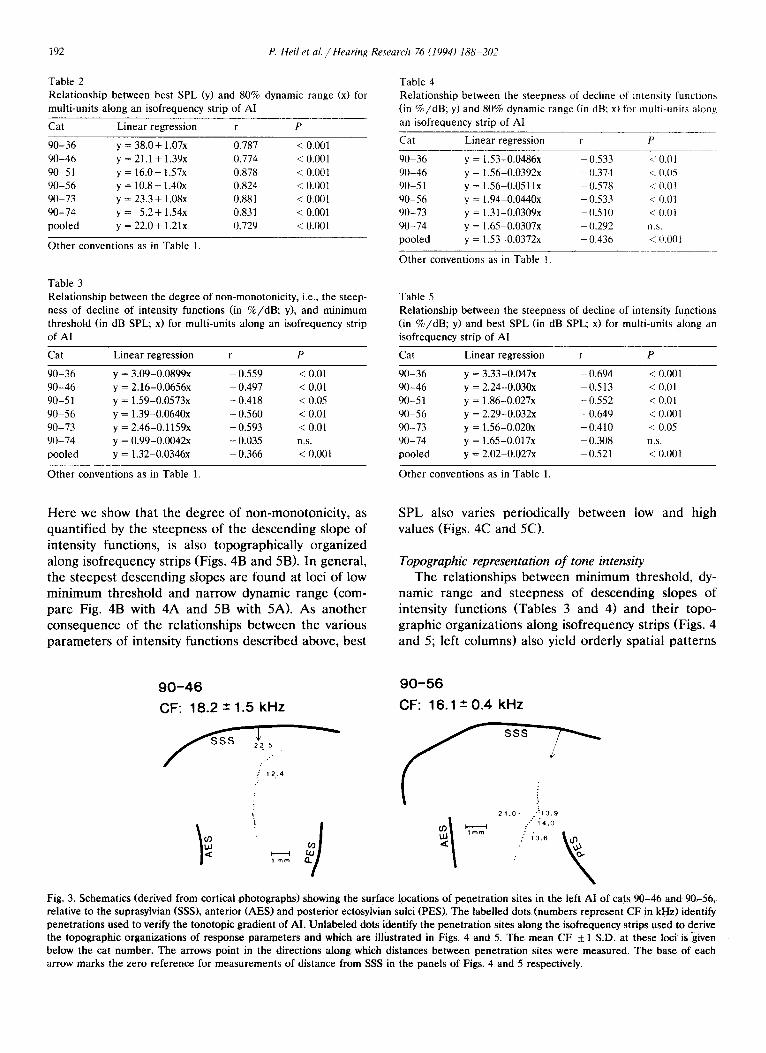
Table 2 Table 4 Relationship between best SPL (y) and 80% dynamic range (x) for multi-units along an isofrequency strip of AI
Relationship between the steepness of decline of intensity function:, (in %/dB; y) and 80% dynamic range (in dB; x) for multi-units along an isofrequency strip of AI Cat Linear regression r P
90-36 y = 38.0+1.07x 0.787 < 0.001 90-46 y = 21.1 + 1.39x 0.774 < 0.001 90-5 1 y = 16.0+1.57x 0.878 < 0.001 90-56 y = 10.8+1.40x 0.824 < 0.001 90-73 y = 23.3 + 1.08x 0.881 < 0.001 90-74 y = 5.2+1.54x 0.831 < 0.001 pooled y = 22.0+1.21x 0.729 < 0.00 I
Other conventions as in Table 1
Table 3 Relationship between the degree of non-monotonicity, i.e., the steep- ness of decline of intensity functions (in %/dB; y), and minimum threshold (in dB SPL; x) for multi-units along an isofrequency strip of AI
Cat Linear regression
90-36 y = 3.09-0.0899x 90-46 y = 2.16-0.0656x 90-51 y = 1.59-0.0573x 90-56 y = 1.39-0.0640x 90-73 y = 2.46-0.1159x 90-74 y = 0.99-0.0042x pooled y = 1.32-0.0346x
Here we show that the degree of non-monotonicity, as quantified by the steepness of the descending slope of intensity functions, is also topographically organized along isofrequency strips (Figs. 4B and 5B). In general, the steepest descending slopes are found at loci of low minimum threshold and narrow dynamic range (com- pare Fig. 4B with 4A and 5B with 5A). As another consequence of the relationships between the various parameters of intensity functions described above, best
90-46
CF: 18.2 2 1.5 kHz
Cat Linear regression
YO-36 y = 1.53-0.0486x 90-46 y = 1.56-0.0392x 90-51 y =1.56-0.0511x 90-56 y = 1.94-0.0440x 90-73 y = 1.31-0.0309x 90-74 y = 1.65-0.0307x pooled y = 1.53-0.0372x
r P
- 0.533 c 0.01 - 0.374 i It.05 - 0.578 < 0.0 1 - 0.533 c 0.01 - 0.510 < 0.01 - 0.2Y2 n.s. - 0.436 < 0.001
Other conventions as in Table 1.
Table 5 Relationship between the steepness of decline of intensity functions (in %/dB; y) and best SPL (in dB SPL; x) for multi-units along an isofrequency strip of AI
Cat Linear regression r P
W-36 y = 3.33-0.047x - 0.694 < 0.001 90-46 y = 2.24-0.030x -0.513 < 0.01 90-51 y = 1.86-0.027x - 0.552 < 0.01 90-56 y = 2.29-0.032x - 0.649 < 0.00 1 90-73 y = 1.56-0.020x - 0.410 < 0.05 90-74 y = 1.65-0.017x - 0.308 ns. pooled y = 2.02-0.027x - 0.521 < 0.001
Other conventions as in Table 1.
SPL also varies periodically between low and high values (Figs. 4C and 50.
Topographic representation of tone intensity The relationships between minimum threshold, dy-
namic range and steepness of descending slopes of intensity functions (Tables 3 and 4) and their topo- graphic organizations along isofrequency strips (Figs. 4 and 5; left columns) also yield orderly spatial patterns
90-56
CF: 16.1 + 0.4 kHz
Fig. 3. Schematics (derived from cortical photographs) showing the surface locations of penetration sites in the left AI of cats 90-46 and 90-56, relative to the suprasyhian (SSS), anterior (AES) and posterior ectosylvian sulci (PES). The labelled dots (numbers represent CF in kHz) identify penetrations used to verify the tonotopic gradient of AI. Unlabeled dots identify the penetration sites along the isofrequency strips used to derive the topographic organizations of response parameters and which are illustrated in Figs. 4 and 5. The mean CF f 1 S.D. at these loci is given below the cat number. The arrows point in the directions along which distances between penetration sites were measured. The base of each arrow marks the zero reference for measurements of distance from SSS in the panels of Figs. 4 and 5 respectively.
0 2 4 6
B
4 i
*O c
3 ! k 60-
%
a’ v3
;; 40-
m”
1
“‘1 D
65 dB SPL
OJ ‘I 1
0 2 4 6
loo- E
3 80-
OJ
0 2 4 6
loo- F
-2 = : 80- -
2 60- o\ 0
g 40
s a
. , 0’
0 2 4 6 1
0 2 4 6
g 20 lx
1
Dtstance from SSS imm) Distance from SSS (mm)
Fig. 4. T~)p[)gr~iphi~ representati~~n of CF-tone intensity along an isofrequency strip in primary auditory cortex (AI) of cat 90-46. (A):
Topographic organization of lo-90% dynamic range. The lower limit of the hatched area represents the intensity (in dR SPLt needed to evoke
10% of the maximum response at the specified locations. This intensity is on average 3 dB above minimum threshold (Heil et al., 1993a). The
upper limit of the hatched area represents the lowest tone intensities needed to evoke 907r of the maximum response. The three
vertically-oriented small arrows indicate sites along the isofrequency strip where the intensity function did not saturate over the intensity range
tested and where the dynamic range may be even larger than indicated, (B): Topographic organization of the steepness of the descending slope of
intensity functions. Note that the steepest descending slopes occur in regions characterized by low nlinimum thresholds and narrow dynamic
ranges. (0: Topographic (urbanization of best SPL, i.e. that eliciting maximum response (see Materials and Methods). The small vertically-ori-
ented arrows identify sites where, because of non-saturating intensity functions, best SPL might be higher than indicated. Note that best SPL
varies over a range of at least 60 dB. Right column: Topographic distribution of relative multi-unit activity along an isofrequency strip in response
to W-tones of three specified intensities (also indicated by the horizontally-oriented large arrows in A). Note the periodic, rather than
homogeneous, distributions at each sound pressure level. Also note that low- and high-intensity tones are represented by complementary
distributions of relative multi-unit activity, i.e. at sites where the relative activity is high for low-intensity tones it is low for high-intensity tones
and vice versa. The small downward pointing arrows in D indicate sites where values of relative activity are taken from the high-intensity
descending slopes of non-monotonic intensity functions.
of relative multi-unit activity in response to CF-tones studied isofrequency strip in each case (cf. Figs. 4A of different intensity. This is illustrated in the right and 5A), are lightly to moderately active, while the columns of Figs. 4 and 5 for three selected SPLs (see remaining multi-units are not activated at all. With also horizontal arrows in Figs. 4A and 5A). Figs. 4F increasing SPL, relative activity in these patches in- and 5F show the patterns for low-intensity tones of 15 creases rapidly, reaching maximum relative activity val- dB SPL for cat 90-46 (Fig. 4) and 10 dB SPL for cat ues in the patch centers at about 25 dB above the 90-56 (Fig. 5). These SPLs correspond to 5 dB (cat lowest minimum threshold (35 dB SPL and 30 dB SPL; 90-46) and 11 dB (cat 90-56) above the lowest mini- Figs. 4E and 5E respectively). Between the low- mum threshold found along the isofrequency strips in threshold patches and, in cat 90-46, also at more these cats. For these low intensities, only few multi- dorsal and ventral locations relative activity is much units, restricted to the low-threshold patches along the lower, resulting in pronounced periodic distributions of
ix p 1.6.
a 5 _ H - 0.6- z 1 z fit 2 o- co 0 2 4 6
d cn ‘; 40-
L%
201
0 2 4 6 0 2 4 6
Dlslance from SSS (mm) Distance from SSS (mm1
loo- ,,
E z g 60.
P -
0, 40.
z _
i% v) 20-
n” I - 70 dB SPL
0 2 4 6
loo- E
F =
: 60- -
i! 60-
c -
$ 40-
s -
:: cr” zo-
- 30 dB SPL
OJ I
0 2 4 6
“‘1 F
Fig. 5. Topographic representation of CF-tone intensity along an isofrequency strip in primary auditory cortex (AI) of cat W-56. Conventions as
in Fig. 4.
P. Heil et al. /Hearing Research 76 (19941 188-202 1%
relative activity along the isofrequency strips. Periodic
distributions are also present for higher tone intensi-
ties, as is illustrated for 65 dB SPL (cat 90-46; Fig. 4D) and 70 dB SPL (cat 90-56; Fig. 5D). For even higher
intensities, these periodic patterns will not only be retained but will be emphasized. This can be inferred from the downward pointing arrows along the curves in
the two figures, indicating that these values of relative activity at 65 and 70 dB SPL, respectively, originate
90-56
70 dB SPL
:Bl 50 dB SPL
30 dB SPL
Distance from SSS (mm)
from the descending slopes of intensity functions.
Despite their periodic nature, activity patterns pro-
duced along an isofrequency strip by lower- and higher-intensity tones are different: at loci where the relative activity is high for lower-intensity tones, it is
low for higher-intensity tones and vice versa (compare Figs. 4D and 4E, Figs. SD and 5E). Thus, low- and
high-intensity tones are represented by complementary distributions of relative multi-unit activity along isofre- quency strips. This effect was seen even in cat 90-74, in which there were no significant correlations between the steepness of the descending slope of intensity func- tions and minimum threshold, dynamic range or best SPL (see Tables 3-5).
In general, periodic distributions of relative activity,
which yield high spatial contrasts of activity along isofrequency strips, dominate for most tone intensities. Only for a narrow range of intermediate tone intensi- ties (approximately 40-50 dB above the lowest mini- mum threshold in the CF-range studied) do the spatial
distributions of relative activity along isofrequency strips tend to be more or less homogeneous (not shown in Figs. 4 and 5, but see Fig. 6B). Thus. the transition from the periodic patterns for lower-intensity tones (Figs. 4E and 5E) to the periodic patterns for higher- intensity tones (Figs. 4D and SD) is via a non-periodic
distribution of activity and not via a shift in the spatial phase of a periodic pattern.
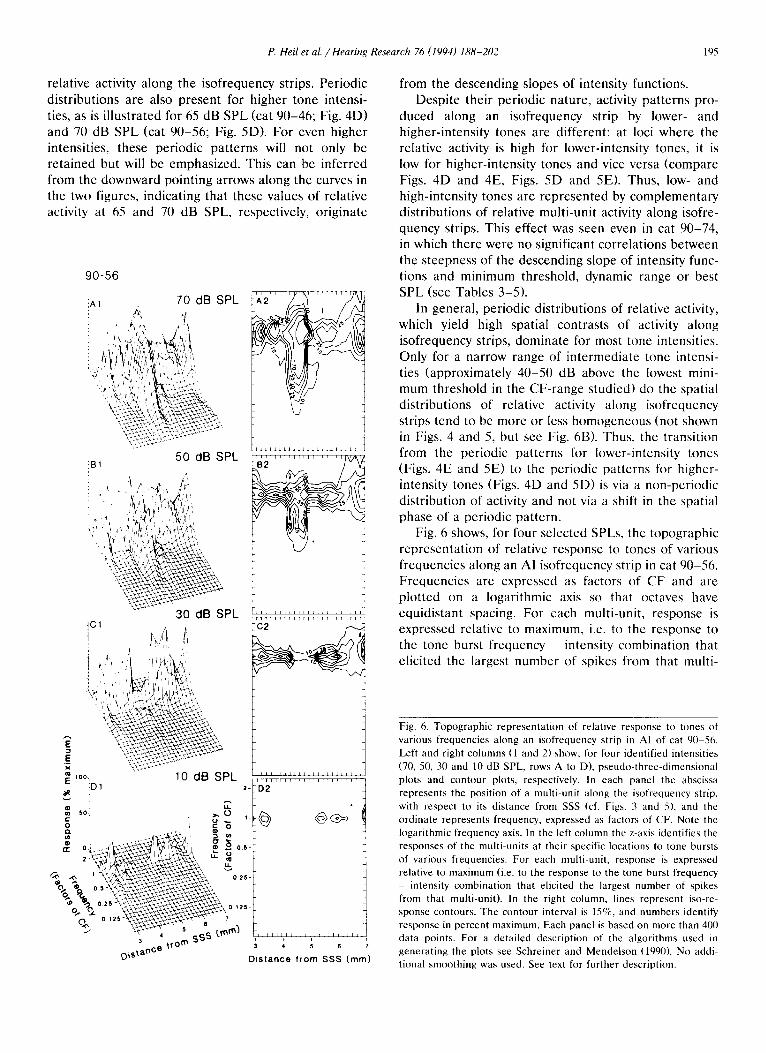
Fig. 6 shows, for four selected SPLs, the topographic
representation of relative response to tones of various frequencies along an AI isofrequency strip in cat 90-56. Frequencies are expressed as factors of CF and are plotted on a logarithmic axis so that octaves have equidistant spacing. For each multi-unit, response is expressed relative to maximum, i.e. to the response to the tone burst frequency - intensity combination that elicited the largest number of spikes from that multi-
Fig. 6. Topographic representation of relative response to tones of
various frequencies along an isofrequency strip in AI of cat 90-56.
Left and right columns (1 and 2) show, for four identified intensities
(70, 50, 30 and 10 dB SPL. rows A to D), pseudo-three-dimensional
plots and contour plots, respectively. In each panel the abscissa
represents the position of a multi-unit along the isofrequency strip,
with respect to its distance from SSS (cf. Figs. 3 and S). and the
ordinate represents frequency, expressed as factors of CF. Note the
logarithmic frequency axis. In the left column the z-axis identifies the
responses of the multi-units at their specific locations to tone bursts
of various frequencies. For each multi-unit, response is expressed
relative to maximum (i.e. to the response to the tone burst frequency _ intensity combination that elicited the largest number of spikes
from that multi-unit). In the right column, lines represent iso-re-
sponse contours. The contour interval is lS%, and numbers identify
response in percent maximum. Each panel is based on more than 400
data points. For a detailed description of the algorithms used in
generating the plots see Schreiner and Mendelson (1990). No addi-
tional smoothing was used. See text for further description.
196 P. Heil et al. /Hearing Reseurch 76 (1994) 188-202
unit. The left and right columns of Fig. 6 show pseudo-three-dimensional and contour plots, respec- tively. In addition to the information provided by Fig. 5D-E, Fig. 6 illustrates the fact that with increasing intensity multi-units respond to an expanding range of frequencies, and that for all intensities the strongest response is to tones of CF or a frequency near CF. Note, however, that the expansion of the excitatory frequency range is not uniform for multi-units at differ- ent positions along the isofrequency strip. With higher intensities (50 dB SPL and above) the largest expan- sions are seen for multi-units located, in cat 90-56, around 4.5 mm ventral of SSS, i.e., in the region of highest thresholds and largest dynamic ranges (cf. Fig. 5A). Considerable expansion of the excitatory fre- quency range occurs also towards the dorsal and ven- tral margins of AI, while the least expansion occurs in multi-units with low thresholds, narrow dynamic ranges and steep descending slopes of intensity functions for
A 90,
30-’ . 90-36 ,90-56
20 I + 90-46 l 90-73
lntenslly (dB re lowest min threshold)
B
f lntenslty (dB re lowest mln threshold)
lntenslty (dB SL)
CF-tones (cf. Fig. 51. Very similar results were ob- tained from cat 90-46 (not shown); in the other cats insufficiently detailed data were obtained to allow this issue to be examined.
Although the data illustrated in Fig. 6 were derived from multi-units located along a one-dimensional isofrequency strip, they may be indicative of the spatial spread of activity across the two-dimensional tonotopic map of AI. On the assumption that the topographic organization of minimum threshold, dynamic range and non-monotonicity of intensity functions, and inten- sity-associated expansion of the excitatory frequency range was identical for adjacent isofrequency strips across the entire tonotopic axis of Al, the patterns in
Fig. 6 could be viewed as the spatial distributions of relative activity in response to CF-tones of the speci- fied intensities. Given that an octave occupies about 1.2 mm along the tonotopic axis in cat AI (Merzenich et al., 1975; Rajan et al., 1993), the panels in Fig. 6
-10 10 30 50 70
lntenslty (dB re lowest mln threshold)
2 D 5:
,’ ,’
/’ /,’ ,
I I p 05- 8.’
F I’ _’
./
.i’ .!’
1.’ i
10 7-m--
10 30 50 70
lntenslty CdB SLI
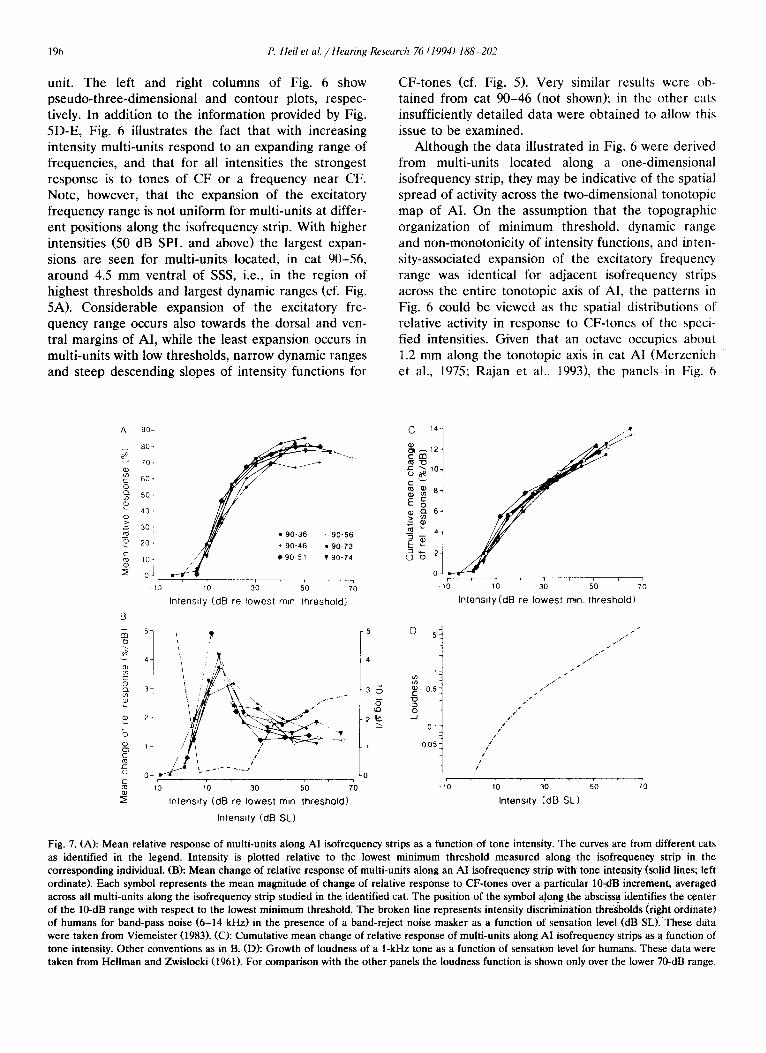
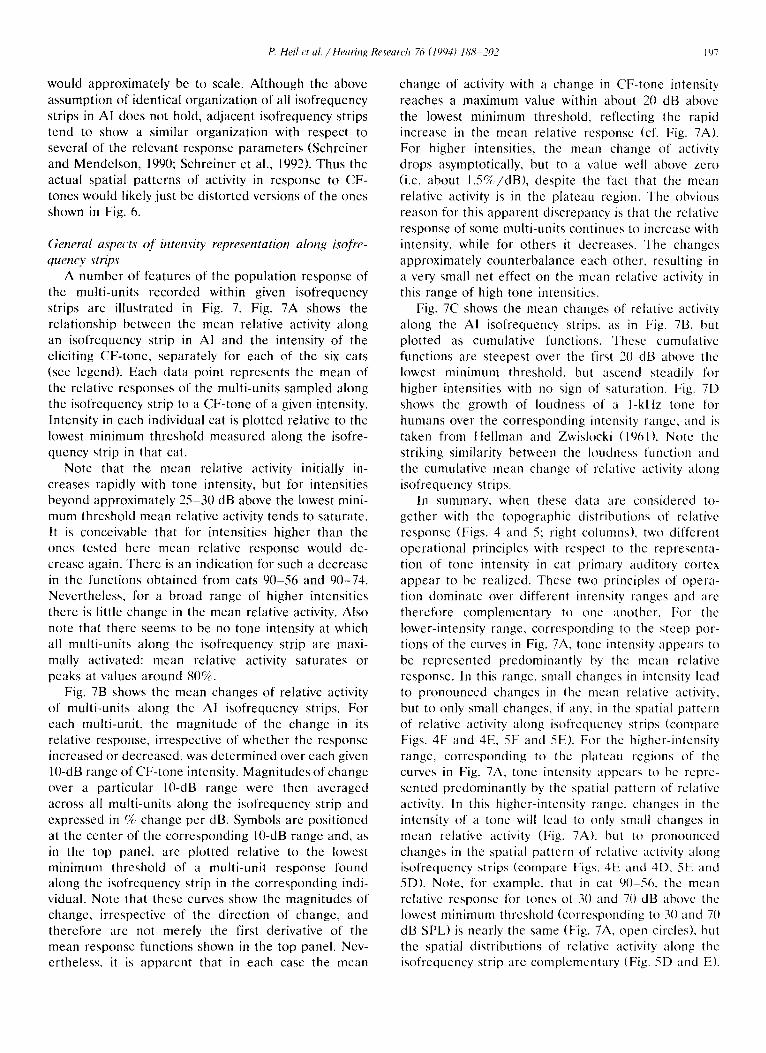
Fig. 7. (A): Mean relative response of multi-units along AI isofrequency strips as a function of tone intensity. The curves are from different cats as identified in the legend. Intensity is plotted relative to the lowest minimum threshold measured along the isofreqwncy strip in the corresponding individual. (B): Mean change of relative response of multi-units along an AI isofrequency strip with tone intensity (solid lines; left ordinate). Each symbol represents the mean magnitude of change of relative response to CF-tones over a particular IOdB increment, averaged across all multi-units along the isofrequency strip studied in the identified cat. The position of the symbol along the abscissa identifies the center of the lo-dB range with respect to the lowest minimum threshold. The broken line represents intensity discrimination thresholds (right ordinate) of humans for band-pass noise (6-14 kHz) in the presence of a band-reject noise masker as a function of sensation level (dB SL). These data were taken from Viemeister (1983). (0: Cumulative mean change of relative response of multi-units along AI isofrequency strips as a function of tone intensity. Other conventions as in B. CD): Growth of loudness of a 1-kHz tone as a function of sensation level for humans. These data were taken from Hellman and Zwislocki (1961). For comparison with the other panels the loudness function is shown only over the lower 70-dB range.
would approximately be to scale. Although the above
assumption of identical organization of all isofrequency strips in AI does not hold, adjacent isofrequency strips tend to show a similar organization with respect to several of the relevant response parameters (Schreiner and Mendelson, 1990; Schreiner et al., 1992). Thus the actual spatial patterns of activity in response to CF- tones would likely just be distorted versions of the ones shown in Fig. 6.
General aspects of intensity representation along isofre-
quency strips
A number of features of the population response of
the multi-units recorded within given isofrequency strips are illustrated in Fig. 7. Fig. 7A shows the relationship between the mean relative activity along an isofrequency strip in Al and the intensity of the eliciting CF-tone, separately for each of the six cats (see legend). Each data point represents the mean of the relative responses of the multi-units sampled along the isofrequency strip to a CF-tone of a given intensity.
Intensity in each individual cat is plotted relative to the lowest minimum threshold measured along the isofre- quency strip in that cat.
Note that the mean relative activity initially in-
creases rapidly with tone intensity, but for intensities beyond approximately 25-30 dB above the lowest mini- mum threshold mean relative activity tends to saturate. It is conceivable that for intensities higher than the ones tested here mean relative response would de- crease again. There is an indication for such a decrease in the functions obtained from cats 90-56 and 90-74. Nevertheless, for a broad range of higher intensities
there is little change in the mean relative activity. Also note that there seems to be no tone intensity at which all multi-units along the isofrequency strip are maxi-
mally activated: mean relative activity saturates or peaks at values around 80%~.
Fig. 7B shows the mean changes of relative activity of multi-units along the AI isofrequency strips. For each multi-unit. the magnitude of the change in its relative response, irrespective of whether the response increased or decreased, was determined over each given lo-dB range of CF-tone intensity. Magnitudes of change over a particular IO-dB range were then averaged across all multi-units along the isofrequency strip and
expressed in % change per dB. Symbols are positioned at the center of the corresponding IO-dB range and, as
in the top panel, arc plotted relative to the lowest minimum threshold of a multi-unit response found along the isofrequency strip in the corresponding indi- vidual. Note that these curves show the magnitudes of change, irrcspectivc of the direction of change, and therefore are not merely the first derivative of the mean response functions shown in the top panel. Ncv- ertheless. it is apparent that in each case the mean
change of activity with a change in CF-tone intensity
reaches a maximum value within about 20 dB above
the lowest minimum threshold. reflecting the rapid increase in the mean relative response (cf. Fig. 7A). For higher intensities, the mean change of activity drops asymptotically, but to a value well above zero (i.e. about l.S%/dB), despite the fact that the mean
relative activity is in the plateau region. The obvious reason for this apparent discrepancy is that the relative response of some multi-units continues to increase with intensity. while for others it decreases. The changes approximately counterbalance each other, resulting in
a very small net effect on the mean relative activity in this range of high tone intensities.
Fig. 7C shows the mean changes of relative activity along the AI isofrequency strips. as in Fig. 7B, but plotted as cumulative functions. Thcsc cumulative functions are steepest over the first 20 dB above the lowest minimum threshold, but ascend steadily for higher intensities with no sign of saturation. Fig. 7D shows the growth of loudness of a I-kHz tone for
humans over the corresponding intensity range, and is taken from Hellman and Zwislocki (I%l). Note the striking similarity between the loudness function and the cumulative mean change of relative activity along isofrequency strips.
In summary, when these data arc considered to- gether with the topographic distributions of relative response (Figs. 4 and 5; right columns). two different operational principles with respect to the rcprescnta- tion of tone intensity in cat primary auditory cortex appear to be realized. These two principles of opera- tion dominate over different intensity ranges and arc therefore complementary to one another. For the
lower-intensity range, corresponding to the steep por- tions of the curves in Fig. 7A, tone intensity appears to
be represented predominantly by the mean relative response. In this range. small changes in intensity lead to pronounced changes in the mean relative activity, but to only small changes. if any. in the spatial pattern of rclativc activity along isofrcqucncy strips (compare Figs. 4F and 4E. SF and 5E). For the higher-intensity range, corresponding to the plateau regions of the curves in Fig. 7A, tone intensity appears to bc rcprc- sented predominantly by the spatial pattern of relative activity. In this higher-intensity range. changes in the intensity of a tone will lead to only small changes in mean relative activity (Fig. 7A). hut to pronounced changes in the spatial pattern of rclativc activity along isofrequcncy strips (compare Figs. 3E and 4D. SE and SD). Note, for example, that in cat W-56, the mean relative response for tones of 30 and 70 dB above the lowest minimum threshold (corresponding to 30 and 70 dB SPL) is nearly the same (Fig. 7A. open circles). but the spatial distributions of relative activity along the isofrcquency strip arc complementary (Fig. 51~ and E).
Therefore it seems that in cat AI, tone intensity could be represented by both operational modes, viz., mean relative activity and spatial distribution of activity (i.e. place), depending on the intensity range.
4. Discussion
Methodological considerations We have utilized the multi-unit technique to study
the spatial representation of tone intensity in cat pri- mary auditory cortex. The interpretational constraints of this method with respect to the properties of the underlying single units have been extensively discussed elsewhere (Schreiner and Mendelson, 1990; Schreiner et al., 1992; Heil et al., 1992a,b). In brief, the minimum threshold of a multi-unit must correspond to the mini- mum threshold of the most-sensitive single unit con- tributing to the multi-unit response. Also, a high de- gree of non-monotonicity of a multi-unit’s intensity function likely means that all the contributing single units have non-monotonic intensity functions, while such a correspondence need not be present in cases of weakly non-monotonic or monotonic multi-unit inten- sity functions. Nevertheless, the distributions of mini- mum threshold and dynamic range in our multi-unit sample is very similar to that seen in an AI single unit sample by Phillips (1990). In particular, the finding that multi-unit dynamic ranges are restricted in a similar fashion as the single unit dynamic ranges reported by Phillips (19901 suggests that our multi-units do not contain single units with markedly divergent intensity response properties. Thus, the multi-unit data obtained at a given locus are quite likely to be a faithful repre- sentation of the intensity reponse properties of the individual single units making up that multi-unit recording. A similar conclusion with respect to the intensity selectivities of AI neurons was drawn by Imig et al. (1990) and Schreiner et al. (1992).
The vast majority of our recordings were obtained in the middle cortical layers and we have no information on the properties in the other layers. However, the available evidence from other studies suggests a colum- nar organization of auditory cortex with respect to a large variety of neuronal response parameters, includ- ing those relevant for intensity coding (for references see Heil et al., 1992b; see also Imig et al., 1990; Shamma et al., 1993; Mendelson et al., 1993). Thus, the variation of the response parameters analyzed in the present study is probably small across the depth of the cortex at a given site relative to the variation along the tangential dimensions of AI.
Tone intensity representation in the auditory cortex With these restrictions in mind, we have shown that
there are orderly spatial organizations in cat AI of
various neuronal parameters related to the encoding ot sound intensity. Minimum threshold, dynamic range, non-monotonicity of intensity functions, and best SPL for CF-tones all vary periodically along isofrequency strips. It cannot be excluded that the relationships of non-monotonicity with minimum threshold, dynamic range, or best SPL (Tables 3-S) and the topographic distributions of non-monotonicity (Figs. 4B, SB) are artifacts of the limited intensity ranges used in the present study. Nevertheless, Schreiner ct al. (1992), using a 70-dB range consistently, have described spatial distributions of minimum threshold, non-monotonicity, and best SPL in cat AI that are largely consistent with our results. Likewise, they report significant correla- tions between minimum threshold and best SPL, and between non-monotonicity and best SPL which are in agreement with our results (see Tables 1 and 51. In contrast to our findings (Figs. 4A, 5A; Tables 2 and 41, Schreiner and colleagues noted a ‘quite idiosyncratic’ spatial distribution of dynamic range, and did not find consistent correlations between dynamic range and any of the other response parameters related to intensity coding. The apparent discrepancies between the study of Schreiner et al. (19921 and ours (Heil et al., 1992a,b: present study) with respect to the topography of dy- namic range and its relationships with other response parameters are likely due to differences in the defini- tion of dynamic range. We defined the dynamic range as the intensity range over which the response in- creased from 10% to 90% of maximum, consistent with the definition used by Phillips and colleagues (e.g. Phillips, 1988, 1990; Phillips et al., 1985). Schreiner et al. (1992) defined a transition point in the intensity function that marked the transition from a fast-growing low-intensity portion to a less fast-growing, a saturat- ing, or a decreasing high-intensity portion. The posi- tive, zero, or negative slope of this high-intensity por- tion above the transition point was the measure of monotonicity, and the range of intensities covered by the fast-growing low-intensity portion of the intensity function, i.e. the intensity range between threshold and the transition point, was defined as the dynamic range (see Fig. 1 in Schreiner ct al., 1992). For intensity functions with saturating or decreasing high-intensity portions, the two different definitions of dynamic range should yield quite similar dynamic range values. For functions with less-fast-growing high-intensity portions (i.e. with sloping-saturation), however, dynamic range values obtained with the definition of Schreiner and colleagues will be markedly lower than those obtained using our definition. In the auditory nerve, fibers with intensity functions showing sloping-saturation charac- teristics have higher thresholds and, when a definition equivalent to ours is used, larger dynamic ranges than fibers with saturating intensity functions (e.g. Winter et al., 1990). The similar positive relationship between
P. Heil et al. /Herring Reward 76 (1994) IKN-202 IYY
threshold and dynamic range we have described in Al
(Heil et al., 1992a,b; see also Figs. 4A and 5A) is
missed with the dynamic range definition of Schreiner
et al. (1992). Independent of the criterion of dynamic range, CF-
tones of various intensities produce, as shown in the present study, orderly spatial distributions of relative multi-unit activity, which, for most intensities, are also periodic. Depending on the tone-intensity range, changes in intensity result either in pronounced changes in the mean relative activity with little change in the
spatial distribution of activity (low-to-moderate inten- sity range). or in little change in the mean relative activity, but pronounced changes in the spatial distribu- tion (high-intensity range), such that low-and high-in-
tensity tones arc represented by complementary distri- butions of relative multi-unit activity. Thus, tone inten-
sity could be represented in cat AI by both the neu- ronal discharge rate in small groups of cells and by the spatial distribution of activity across the array of cells most sensitive to the frequency of the test tone.
This situation is somewhat different from the case of the DSCF area in the bat auditory cortex, where all
neurons have non-monotonic intensity functions and best SPL is mapped in an orderly fashion (Suga, 1977). In that case, systematic shifts in the place of maximum activation with tone intensity would be expected over a wide range of SPLs, and therefore place alone seems sufficient to represent tone intensity in this area. Note,
however, that in this bat it is not clear if any such amplitopic organization is found outside the DSCF
area and for frequencies other than the very narrow
CF range represented in this highly specialized region.
Intensity discrimination The differences between the DSCF area of mus-
tached bats and AI of cats with respect to the organiza- tion of response properties related to intensity coding possibly reflects different needs and specializations for intensity discrimination. The precise determination of intensity and the detection of very small changes in
intensity are behaviorally crucial for echolocating bats, particularly for signals in the CF range which is reprc- scnted in the DSCF area (e.g. Suga, 1984). Also, cer- tain intensity ranges are more important for echoloca- tion than others and. interestingly, are overrepresented in the DSCF area (Suga, 1977. lY82). This suggests that the proportion of neurons tuned to SPLs within a given range may be one basis for improved intensity discrimi- nation. In cat AI, where many neurons are not tuned to SPL but have monotonic intensity functions, inten- sity discrimination capabilities may be directly related to the magnitude of the intensity-dependent change in the activity of the neurons involved in the processing of a given signal. More specifically, a large change in the neuronal activity with a small change in signal intensity
may correspond to a low intensity discrimination
threshold and vice versa. From the shape of the func-
tions in Fig. 7B, which show the mean magnitude of change in the relative activity along isofrequency strips with a change in tone intensity. it might be expected
that intensity discrimination thresholds for tones would improve markedly over the first 20 dB above absolute threshold and would then deteriorate at higher intensi-
ties. Although relevant data are not available for cats, studies from humans, various primates. rodents and birds, all show that intensity discrimination thresholds for tones tend to improve continuously with intensity (for a summary of the data see Fay, 198X). Neverthc- less, the idea of an inverse relationship between the
magnitude of change in neuronal activity and intensity discrimination thresholds need not bc dismissed. With
increasing tone intensity, changes in activity will not be restricted to the isofrequency strip under considera- tion. but excitation will spread further and further into neighbouring CF-regions. With the restrictions pointed
out in the Results, Fig. 6 may provide idealized overviews of the spatial distributions of activity in AI for CF-tones of the specified intensities. The precise
spatial patterns will depend on the details of the topog- raphy of threshold, dynamic range, non-monotonicity and intensity-associated expansion of the excitatory frequency range (Schreiner and Mendelson, 1990; Schrciner et al., 1992; Heil ct al., 1992b). It is conceiv-
able that the magnitude of change in activity with change in tone intensity, averaged over the entire AI or
the entire auditory cortex, would increase continuously with intensity to match the continuous improvement of intensity discrimination thresholds for tones. However,
the study by Viemeister ( 1983) suggests very strongly that in humans the inclusion of other frequency chan- nels due to spread of activity is not required to main- tain good intensity discrimination capabilities over a large range of intensities. He measured intensity dis- crimination thresholds for narrow-band noise (6 14 kHz) under conditions designed to prevent spread of excitation into neighbouring CF-ranges, viz. by prescnt-
ing the noise-band simultaneously with a band-reject noise masker. Interestingly, intensity discrimination thresholds in this situation do not improve continu- ously with base test intensity, but peak around 20 dB SL. This threshold function is plotted in Fig. 7B (broken line; right ordinate) and it is apparent that its course is roughly opposite to the course of the functions of the mean change in activity along isofrcquency strips (solid lines; left ordinate). These data thcreforc provide sup- port for the idea of an inverse relationship between the magnitude of intensity-dependent change in neuronal activity and intensity discrimination threshold.
The cumulative mean change of relative activity along isofrequcncy strips (Fig. 7C) shows a course which is strikingly similar to the human loudness func-
tion for tones over the corresponding intensity range (cf. Fig. 7D). This would suggest that the cumulative mean change of relative activity might be a direct correlate of the perceived loudness of a tone of corre- sponding frequency.
Relationship of tone intensity representation with other features of functional organization of AI
In cat AI there is also an orderly topographic orga- nization of sharpness of frequency tuning (Schreiner and Mendelson, 1990; Heil et al., 1992b). At dorsal and ventral locations along the isofrequency axis multi-units are broadly tuned to frequency while at central loca- tions frequency tuning is much sharper. We did not find any correlations between measures of sharpness of frequency tuning (Q,,) and QZo) and any of the param- eters related to intensity coding. However, a compari- son of Fig. 5A,B and Fig. 6 shows that multi-units characterized by low thresholds, narrow dynamic ranges, and high degrees of non-monotonicity also show the least expansion of their excitatory frequency ranges at high stimulus intensities. This observation is consis- tent with the finding of Schreiner et al. (1992) of correlations between Q4(, and minimum threshold (in two of three cats), non-monotonicity (in all three cats), and best SPL (in two of three cats), while correlations between Qlo and these parameters were seen only inconsistently.
It may be speculated that in the multi-units charac- terized by a low minimum threshold, a narrow dynamic range, and a low degree of expansion of the excitatory frequency range, inhibitory sidebands may, on the one hand, prevent a more pronounced expansion of the excitatory frequency range (see also Suga and Tsuzuki, 1985) and, on the other hand, cause or contribute to the non-monotonic intensity functions for CF-tones (e.g. Phillips et al., 1985; Phillips, 1988). Single units with non-monotonic intensity functions are unlikely to respond to broadband stimuli, such as noise, which contain energy in frequency bands covering the units’ presumed inhibitory sidebands (e.g. Phillips et al., 1985). Fig. 6 might thus also be helpful to envisage the spatial patterns of activity produced by noise stimuli.
The periodic distributions of the parameters related to intensity coding and of relative activity along isofre- quency strips found for most intensities are reminiscent of the spatial organization of binaural interaction types and aural dominance as described by Middlebrooks et al. (1980) and Imig and Adrian (1977). However, these properties are likely to be organized independently in AI. The data reported here were obtained with monau- ral contralateral stimulation, but in two cats we have also recorded the responses to ipsilateral stimulation. Most multi-units found in these two cats were also excited by the ipsilateral ear and thus would fall into the EE-classification scheme of Middlebrooks et al.
(1980). In these two cats aural dominance. as quanti- fied by several different measures, also varied periodi- cally along the isofrequency strips but with a higher spatial periodicity than any of the parameters related to intensity coding, and therefore was not correlated with minimum threshold or dynamic range (Heil et al.. in preparation). Interestingly, while minimum thresh- olds for contralateral and ipsilateral CF-tones could be very different (most commonly contralateral thresholds were lower), the dynamic ranges of the corresponding intensity functions were much more similar and signifi- cantly correlated. Moreover, intensity functions for contralateral and ispilateral CF-tones were most often either both monotonic or both non-monotonic. Neu- rons with strongly non-monotonic intensity functions determined under free-field conditions have been shown to be also quite sensitive to the azimuth of a sound source, while neurons with monotonic intensity functions are less directionally sensitive (Imig et al., 1990). These observations suggest the possibility that the spatial representation of tone intensity and the spatial organization of azimuthal sensitivity in AI (Imig et al., 1990; Rajan et al., 1990) might interact in a complex, yet-unexplored, fashion.
Anatomical speculations Intrinsic connections in cat primary auditory cortex
are generally clustered and anterograde transport from a single injection site often shows multiple patches of terminal labelling with patches predominantly aligned along an isofrequency strip (e.g. Matsubara and Phillips, 1988; Wallace et al., 1991). Recent intracellular la- belling of layer II/III pyramidal neurons in AI has shown that these patchy patterns come about by sys- tems of axon collaterals from individual neurons (Ojima et al., 1991). Axon collaterals form multiple columns of terminal labelling with diameters of 300-500 pm ex- tending through a number of cortical layers. One col- umn is in the vicinity of the cell body, but other columns can be more than two millimeters away from it. Most columns are aligned along the dorsoventral isofrequency axis of AI. Matsubara and Phillips (1988) concluded that the columns bore no relationship with the binaural bands described by Middlebrooks et al. (1980). Indeed, so far it is not known what response properties other than CF, if any, are shared by the interconnected neurons along an isofrequency strip. Based on the gross similarity of the periodic pattern of tone intensity representation with the fairly regular spacing of connectional columns it is tempting to spec- ulate that the columnar projections might interconnect regions with similar threshold, dynamic range, and non-monotonicity, and thus with similar best SPL. This could be advantageous for detection and identification of sound sources, as well as their discrimination from background disturbances.
Acknowledgements
The study was supported by the NHMRC of Aus- tralia, the Deafness Foundation (Victoria), and a Feodor-Lynen scholarship of the Alexander von Hum- boldt-Stiftung to P. Heil. We are grateful to J.F. Cas-
sell, M. Farrington, V. Kohout, V. Parks, and K. Weh- ner for expert technical assistance.
References
Aitkin. L.M. (IYYO) The Auditory Cortex. Chapman and Hall. l,on-
don.
Brugge. J.F. and Merzenich, M.M. (1973) Responses of neurons in
auditory cortex of the macaque monkey to monaural and binaural
stimulation. J. Nrurophysiol. 36. 1138-l 1%. Ehret. G. and Merzenich. M.M. (10Xx) Neuronal discharge rate is
unsuitable for encoding sound intensity at the inferior-collicultls
level. IIear. Re5. 35. 1-X.
Fay. R.R. (IYXX) Ilenring in Vertebrates. A Psychophysics Databook.
Hill-Fay. Winnctka. pp. 3Y7ff.
Heil. P.. Rajan. R. and Irvine. D.R.F. (1YY2a) Sensitivity of neurons
in cat primary auditory cortex to tones and frequency-modulated
stimuli. I. Effects of variation of stimulus parameters. Hear. Rcs.
63. I OH- I33. Hril. P.. Rajan. R. and Irvine. D.R.F. (1YY2b) Sensitivity of neurons
111 cat primary auditory cortex to tone5 and frequency-modulated
stimuli. II. Topographic representation along the ‘i\ofrequcncy’
dimcn\ion. Ilear. Res. 63, 135-150.
Ileil. P.. Reloan, R. and Irvine, D.R.F. (190%) Low- and high-level
tones are represented hy complementary patterns of distributed
multiunit activity along the isofrequency dimension of cat primary