Andreas Niedermeier Danielle Hoja Susanne Lehner Topography and morphodynamics in the German Bight using SAR and optical remote sensing data Received: 9 July 2004 / Accepted: 9 May 2005 / Published online: 8 September 2005 Ó Springer-Verlag 2005 Abstract Morphological changes in coastal areas, especially in river estuaries, are of high interest in many parts of the world. Satellite data from both optical and radar sensors can help to monitor and investigate these changes. Data from both kinds of sensors being avail- able for up to 30 years now, allow examinations over large timescales, while high resolution sensors developed within the last decade allow increased accuracy. So the creation of digital elevation models (DEMs) of, for example, the wadden sea from a series of satellite images is already possible. ENVISAT, successfully launched on March 1, 2002, continues the line of higher resolution synthetic aperture radar (SAR) imaging sensors with its ASAR instrument and now also allows several polari- zation modes for better separation of land and water areas. This article gives an overview of sensors and algorithms for waterline determination as well as several applications. Both optical and SAR images are consid- ered. Applications include morphodynamic monitoring studies and DEM generation. Keywords Waterline Edge detection Remote sensing Morphodynamics Digital elevation model (DEM) Coastal area 1 Introduction Two thirds of the world’s population, some four billion people, live in coastal areas. In most cases, their lives depend on the morphological changes of the coast, the sediment transport of the ocean currents. Both erosion and deposition can be a problem: houses near cliffs may fall into the sea, growing river estuaries can cause flooding. As an exemplar area, the tidal flats of the German Bight, especially the large river estuaries, are studied within this work. Methods are derived to monitor morphodynamics using satellite data from both syn- thetic aperture radar (SAR) and optical imaging sensors. Applications and possible new developments using ENVISAT and upcoming satellites are given. The investigation area covers the German North Sea coast between the Netherlands and Denmark. Figure 1 gives an overview of this area. Examples given here cover the regions of the rivers ‘Elbe’ and ‘Eider’. Addi- tional studies on the river ‘Weser’ and the island ‘Sylt’ are mentioned. The core of this article are methods to derive coast- lines and waterlines 1 from satellite images of various types (Sect. 2). The waterlines can be used in many ways such as the generation of land/water masks, morpho- dynamic monitoring or the generation of digital elevation models (DEMs) (Sects. 3.1, 3.2, and 3.3resp.). New developments and ideas for use with ENVISAT, upcoming satellites and enhanced sensor techniques like interferometric SAR are finally given in Sect. 4. 2 Waterline determination In order to monitor morphodynamic changes of bottom topography, different methods for DEM generation have already been analyzed (Hoja 2000; Niedermeier et al. 2000; Wimmer et al. 2000). One approach is the so- called waterline extraction by image analysis. Using extracted waterlines, several geoscientific applications can be carried out like identifying mor- phodynamic changes in bottom topography over a long time span and interpolation of waterlines from data acquired during a short time span into DEMs using A. Niedermeier (&) D. Hoja S. Lehner Remote Sensing Technology Institute (MF), German Aerospace Center (DLR), Wessling, German E-mail: [email protected]1 A waterline is the instantaneous land–water boundary at the time of the imaging process. A coastline or shoreline is the waterline at the highest possible water level. Ocean Dynamics (2005) 55: 100–109 DOI 10.1007/s10236-005-0114-2
Transcript
Andreas Niedermeier Æ Danielle Hoja Æ Susanne Lehner
Topography and morphodynamics in the German Bight usingSAR and optical remote sensing data
Received: 9 July 2004 / Accepted: 9 May 2005 / Published online: 8 September 2005� Springer-Verlag 2005
Abstract Morphological changes in coastal areas,especially in river estuaries, are of high interest in manyparts of the world. Satellite data from both optical andradar sensors can help to monitor and investigate thesechanges. Data from both kinds of sensors being avail-able for up to 30 years now, allow examinations overlarge timescales, while high resolution sensors developedwithin the last decade allow increased accuracy. So thecreation of digital elevation models (DEMs) of, forexample, the wadden sea from a series of satellite imagesis already possible. ENVISAT, successfully launched onMarch 1, 2002, continues the line of higher resolutionsynthetic aperture radar (SAR) imaging sensors with itsASAR instrument and now also allows several polari-zation modes for better separation of land and waterareas. This article gives an overview of sensors andalgorithms for waterline determination as well as severalapplications. Both optical and SAR images are consid-ered. Applications include morphodynamic monitoringstudies and DEM generation.
Keywords Waterline Æ Edge detection Æ Remotesensing Æ Morphodynamics Æ Digital elevation model(DEM) Æ Coastal area
1 Introduction
Two thirds of the world’s population, some four billionpeople, live in coastal areas. In most cases, their livesdepend on the morphological changes of the coast, thesediment transport of the ocean currents. Both erosionand deposition can be a problem: houses near cliffs mayfall into the sea, growing river estuaries can causeflooding.
As an exemplar area, the tidal flats of the GermanBight, especially the large river estuaries, are studiedwithin this work. Methods are derived to monitormorphodynamics using satellite data from both syn-thetic aperture radar (SAR) and optical imaging sensors.Applications and possible new developments usingENVISAT and upcoming satellites are given.
The investigation area covers the German North Seacoast between the Netherlands and Denmark. Figure 1gives an overview of this area. Examples given herecover the regions of the rivers ‘Elbe’ and ‘Eider’. Addi-tional studies on the river ‘Weser’ and the island ‘Sylt’are mentioned.
The core of this article are methods to derive coast-lines and waterlines1 from satellite images of varioustypes (Sect. 2). The waterlines can be used in many wayssuch as the generation of land/water masks, morpho-dynamic monitoring or the generation of digitalelevation models (DEMs) (Sects. 3.1, 3.2, and 3.3resp.).New developments and ideas for use with ENVISAT,upcoming satellites and enhanced sensor techniques likeinterferometric SAR are finally given in Sect. 4.
2 Waterline determination
In order to monitor morphodynamic changes of bottomtopography, different methods for DEM generationhave already been analyzed (Hoja 2000; Niedermeieret al. 2000; Wimmer et al. 2000). One approach is the so-called waterline extraction by image analysis.
Using extracted waterlines, several geoscientificapplications can be carried out like identifying mor-phodynamic changes in bottom topography over a longtime span and interpolation of waterlines from dataacquired during a short time span into DEMs using
A. Niedermeier (&) Æ D. Hoja Æ S. LehnerRemote Sensing Technology Institute (MF),German Aerospace Center (DLR), Wessling, GermanE-mail: [email protected]
1A waterline is the instantaneous land–water boundary at the timeof the imaging process. A coastline or shoreline is the waterline atthe highest possible water level.
measurements from tide gauges as additional heightinformation.
2.1 Extraction of waterlines from optical images
Different optical data sets have been used for waterlineextraction so far. Table 1 gives an overview of differentsensor systems with their geometric and spectral reso-lutions. Waterlines are extracted from optical remotesensing data using simple image processing techniques.Edge detection techniques are applied directly to themulti-spectral data set or on land/water masks receivedby classification. The true waterline position can befound best using a mid-infrared channel (Lee et al.2001). For sensors without a mid-infrared channel, moresophisticated approaches are needed, e.g., a classifica-tion of image areas using a combination of other chan-nels.
For the classification, a two-stage multi-spectralalgorithm has proved to be valuable (Hoja 1999). First,a feature space analysis (Sabins 1987) is used to distin-guish between water, tidal flats and land. Discriminationbetween tidal flats and land is possible due to the largeamount of water in the tidal flats. In a second step, areasof interest are marked within the tidal flats as trainingareas, based on semi empirically determined spectral
signatures (Jensen 1995; Kraus and Schneider 1988).Finally a supervised classification with the maximum-likelihood operator is carried out. Resulting areas aredivided into the super-classes ‘flooded’ and ‘not flooded’and the boundary is extracted representing the actualwater/land boundary at acquisition time.
Supervised classification of the tidal flats is based onprior knowledge about the sediments in the tidal flatsand their typical spectral reflectance characteristics(Kraus and Schneider 1988; Lillesand et al. 2003). Theresult of classifying an IRS scene was verified at somepoints in the wadden sea during an expedition.
Fig. 1 The GermanBight—geocoded mosaic ofthree IRS-1C LISS III scenesof �150·150 km2each
Table 1 Various optical sensors used for waterline determination
Satellite Sensor Geometricresolution (m)
Spectralbands
Landsat MSS 80 2V+2N+1TETM 30 3V+1N+2S+1TPAN 5 1V
IRS LISS-III 25 2V+1N+1SSPOT XS 10 2V+1N+1S
PAN 5 1VIKONOS XS 4 3V+1N
PAN 1 1VQUICKBIRD XS 2.5 3V+1N
PAN 0.6 1V
Spectral bands: V visible; N near, S short wave, and T thermalinfrared
101
Classification results showing the sediment distributionin the tidal flats is of high interest for administration andmodellers. However, a thorough validation was not yetpossible due to lack of in-situ data and the availablegeological maps being from the mid-seventies of the lastcentury and, therefore, no longer valid in suchmorphodynamically active areas.
Another very common method for waterline extrac-tion, which works effectively with all types of opticalsensor is manual extraction based on visual interpreta-tion. It is a very effective, straight-forward procedure,which is widely applied to remote sensing data.Although not a mathematical tool, the human eye, ingeneral, is also able to detect edges and boundaries suchas shorelines in satellite pictures. Additionally, rationaljudgement skills a profitable input in defining what is arelevant edge or what is not. There are limitations, ofcourse. Besides, a certain monotony that may inducemistakes, manual digitizing throws up challengesregarding the resolution of the sensor. The secondchallenge refers to interpretation of a boundary, sincemainly in the low-resolution images, colour shades maydecay gradually.
Cloud-free optical scenes of a particular optical sen-sor are generally available only two to three times a yearin temperate areas. Due to the resolution of the satellitedata, features in the wadden sea up to about 100 m insize can be monitored now. Comparative studies ofextracted topographic information using different sen-sors showed a very good overall agreement in spite ofdifferent sensor resolutions and algorithm accuracy(Rausch 2000; Zeug 2000).
2.2 Waterlines derived from SAR images
While useful optical images are only obtainable undergood illumination and atmospheric conditions, syntheticaperture radar (SAR) also allows imaging of the Earthsurface through clouds and at nighttime. Several SARsatellites are either in orbit now or will shortly belaunched, Table 2 gives an overview.
Due to its coherent illumination, SAR images, on theother hand are degraded by speckle, a multiplicativenoise. This makes SAR image processing a far morechallenging task, than the interpretation of images fromoptical sensors. Sophisticated and adapted algorithms
for SAR images are needed (e.g. (Dellepiane et al. 2004;Lee and Jurkevich 1990; Liu and Jezek 2004)).
An algorithm for waterline extraction from SARimages was developed (Niedermeier et al. 2000). It useswavelet edge detection (decomposition and threshold-ing) as well as several post processing steps for thederivation of a continuous waterline from a single SARimage. Figure 2 gives an overview of the steps of thisalgorithm showing the intermediate results on an
Table 2 Various SAR sensors used for waterline determination
Satellite(planned launch year)
Geometricresolution (m)
Polarizations
ERS-1/2 (1991/1995) 30 1ENVISAT (2002) 30 2RADARSAT-1 (1995) 9 1RADARSAT-2 (2005) 3–10 4COSMO-SKYMED (2005) 1–15 2TerraSAR (2006) 1–6 4 Fig. 2 A wavelet based waterline extraction algorithm for SAR
images
102
exemplar SAR image from the estuary of the Germanriver Elbe.
An amplitude density image (the point wise logarithmof a SAR amplitude image) is used as input to thewavelet edge detection method proposed by Mallat(Mallat and Hwang 1992; Mallat and Zhong 1992a).This method is based on a dyadic wavelet decompositionwithout subsampling followed by thresholding. It worksas a sophisticated edge detection method on SAR imagesas investigated in (Niedermeier 2002). This edge detec-tion method is used as a first step in the proposedwaterline algorithm. The theory of the edge detection isbased on a relation (Mallat and Hwang 1992) betweenthe regularity of an image (which is different for‘homogeneous’ speckle noise and image edges) and thedecay of the wavelet coefficients along the scale a. Thewavelet transform
WwI : ða; bÞ7! 1
aj j
Z
R2
IðxÞw x� b
a
� �d2x; ð1Þ
of the image I is calculated for all image coordinates bon dyadic scales a=2k using an iterative filter convolu-tion (Mallat and Zhong 1992a) which is equivalent tointegration with a spline wavelet w in (1).
Post-processing starts with an image segmentationinto connected edge-free regions (water) and regionswith higher edge density (land). The so-called block-tracing (Niedermeier et al. 2000) begins with large, edgefree squares and attaches smaller ones recursively. Itsresult is a coarse image segmentation into water andland.
Within a small band of boundary between both re-gions, the strongest image edge is locally selected yield-ing edge fragments of the waterline. To connect thesefragments to a continuous waterline, an active contourmodel (Mason and Davenport 1996; Williams and Shah1992) is used. It minimizes certain energy integrals(representing length, curvature, area, etc.) iterativelyalong points of a closed curve v : J ! R; s 7! vðsÞ:Foreach pixel of v, the energy function
E ¼Z
J
kconEconðsÞ þ kcurEcurðsÞ þ kimgEimgðsÞds; ð2Þ
is calculated and minimized, where
EconðsÞ ¼dvdsðsÞ
��������2
; ð3Þ
and
EcurðsÞ ¼d2vds2ðsÞ
��������2
; ð4Þ
are the internal energies (tension and curvature strength)of the curve v, Eimg(s) is the external image energy, andkk > 0 are balancing parameters (Mason and Daven-port 1996; Niedermeier et al. 2000).
Although some applications can handle waterlinefragments, others (e.g. image segmentation) depend on acontinuous waterline. Due to speckle artefacts or lowimage contrast, there are often a lot of small fragmentswhich are joined by the active contour step.
The mean error of the location of the detectedwaterline was around 40 m in comparison to a modelsolution derived by visual inspection of an exemplarimage of 1 million pixels (Niedermeier 2002). This is avery promising result taking into account that theground resolution of ERS is around 30 m at a 12.5 mpixel spacing.
High resolution images from ERS/ENVISAT of anarea are available 1–4 times a month. Automatic pro-cessing is possible on most of them while only a few beardisturbing features, e.g. due to very extreme weathersituations. These can be corrected with a small manualinteraction before the post-processing in roughly everysecond case.
2.3 Use of SAR coherence images
To overcome the problem of missing contrast of theland/water boundary in the SAR amplitude image, SARcoherency data was analysed. Use of interferometriccoherence as a measure of the correlation of the scat-terers between two SAR acquisitions serves as a criterionto distinguish between the land and sea surface.
For two complex SAR images c1, c2 of the same area,the coherence magnitude can be estimated in an Npointneighbourhood of x0 as
where ‘*’ denotes complex conjugation. |c| is a value inthe interval [0, 1].
The coherency data used were derived from SARimages of the ERS satellites flown in tandemmode. In thismode, one acquisition per satellite is acquired of the samearea only one day apart (multi-pass interferometry).
The algorithm to determine the coastline is purelybased on an examination of the interferometric coher-ence (Schwabisch et al. 1997). The extraction is per-formed in a first step with a series of basic imageprocessing steps (filtering, gradient estimation) individ-ually for each ‘resolution level’ (three have proved use-ful). These numbers of averaged samples are chosenwithin the preprocessing step of calculation of coher-ence. The second step in the coastline detection refinesthe individual lines again with basic image processingmethods (opening, thinning). Finally, the individuallines are merged to yield an accurately positionedshoreline.
In contrast to waterline extraction from amplitudeSAR data (as described in the previous section), thismethod is restricted to the detection of the line of highest
103
water level between the acquisitions. This is due to thefact that coherence maps describe the degree of stabilityof scatterers on a centimetre scale between two acqui-sitions. Areas having changed between the two acquisi-tion dates due to being flooded therefore show differentappearances in the two complex images which results inlow coherence. Another drawback of the algorithm isthe detection of areas in the tidal flats showing highcoherence although they were flooded between the timesof data acquisition.
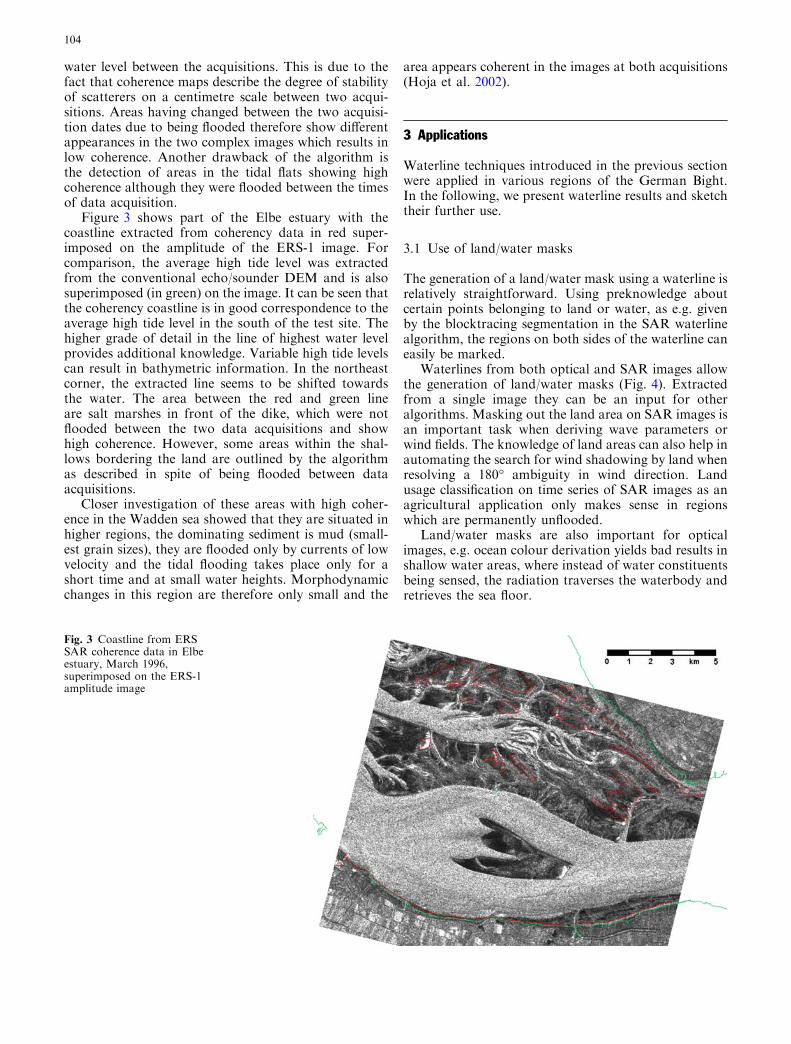
Figure 3 shows part of the Elbe estuary with thecoastline extracted from coherency data in red super-imposed on the amplitude of the ERS-1 image. Forcomparison, the average high tide level was extractedfrom the conventional echo/sounder DEM and is alsosuperimposed (in green) on the image. It can be seen thatthe coherency coastline is in good correspondence to theaverage high tide level in the south of the test site. Thehigher grade of detail in the line of highest water levelprovides additional knowledge. Variable high tide levelscan result in bathymetric information. In the northeastcorner, the extracted line seems to be shifted towardsthe water. The area between the red and green lineare salt marshes in front of the dike, which were notflooded between the two data acquisitions and showhigh coherence. However, some areas within the shal-lows bordering the land are outlined by the algorithmas described in spite of being flooded between dataacquisitions.
Closer investigation of these areas with high coher-ence in the Wadden sea showed that they are situated inhigher regions, the dominating sediment is mud (small-est grain sizes), they are flooded only by currents of lowvelocity and the tidal flooding takes place only for ashort time and at small water heights. Morphodynamicchanges in this region are therefore only small and the
area appears coherent in the images at both acquisitions(Hoja et al. 2002).
3 Applications
Waterline techniques introduced in the previous sectionwere applied in various regions of the German Bight.In the following, we present waterline results and sketchtheir further use.
3.1 Use of land/water masks
The generation of a land/water mask using a waterline isrelatively straightforward. Using preknowledge aboutcertain points belonging to land or water, as e.g. givenby the blocktracing segmentation in the SAR waterlinealgorithm, the regions on both sides of the waterline caneasily be marked.
Waterlines from both optical and SAR images allowthe generation of land/water masks (Fig. 4). Extractedfrom a single image they can be an input for otheralgorithms. Masking out the land area on SAR images isan important task when deriving wave parameters orwind fields. The knowledge of land areas can also help inautomating the search for wind shadowing by land whenresolving a 180� ambiguity in wind direction. Landusage classification on time series of SAR images as anagricultural application only makes sense in regionswhich are permanently unflooded.
Land/water masks are also important for opticalimages, e.g. ocean colour derivation yields bad results inshallow water areas, where instead of water constituentsbeing sensed, the radiation traverses the waterbody andretrieves the sea floor.
Fig. 3 Coastline from ERSSAR coherence data in Elbeestuary, March 1996,superimposed on the ERS-1amplitude image
104
3.2 Monitoring the morphodynamics
With the tidal current moving the water several tens ofkilometers twice a day, the sandbanks of the GermanBight are subject to permanent change in both shape andposition. A time series of satellite images of the sameregion in the wadden sea at a similar tidal phase allowsthe monitoring of the morphologically active areas. Asan example, Fig. 5 shows the changes of a sandbank inthe Eider estuary over a time span of 24 years. Water-lines were derived via visual interpretation using opticalimages. The dotted lines are less confident parts of thewaterlines. Nevertheless, the results are remarkable: thecentre of gravity of the sandbank shifts some 800 m(9 cm per day in average) while reducing in size andslightly rotating.
Within only 7 years (1992–1999), the south coast ofthe sandbank ‘Medemsand’ in the river Elbe estuarymoved northwards some 850 m (corresponding almost70 pixel in the geocoded ERS image). This was derivedfrom three SAR images of this period, each at low tidesituation (�1.8–�1.5 m absolute altitude according tonearby tide gauge values), as presented in Fig. 6. Theautomatic waterline detection mentioned in Sect. 2.2 wasused here.
Using topographic information (either from echoso-under measurements or interpolated as shown in thefollowing section) the amount of transported sedimentcan be roughly estimated. According to the (vessel
mounted) echosounder topography of 1996, providedby the German Federal Waterway Engineering andResearch Institute (BAW), the river directly south of‘Medemsand’ is some 20 m deeper than the sandbankwhich means about 2,400 m3 (4,000 t) sand being trans-ported per year per meter of coastline.
Data of the coastline of the German island Sylt in-cluded historic maps of the last two centuries, opticalsatellite images of the 1970s and 1980s and several SARimages from 1992 to 1998. Erosion on large parts of theisland were stopped in the mid 20th century by humaninteraction. Nevertheless, the northern and southern tipsare still changing their shapes. Details can be found in(Zeug 2000).
3.3 Generation of digital elevation models
For extraction of the bottom topography (to create anintertidal DEM), we consider a set of waterlines in asmall region from satellite images taken during a smalltemporal interval, but covering many different waterlevel situations. Usually this technique is applied to SARimages as the weather situation in the German Bightdoes not allow recording enough cloud-free opticalimages in a short time span. The interpolation of a DEMuses therefore the waterlines from these images as well asnearby (in space and time) information from a tidalgauge. Thereby the following simplifications are used:
– The area is small enough to ignore the tidal slope ofthe water surface.
– The time period covering all images is short enough toignore morphodynamical changes but long enough tohave sufficiently many different tidal situationsavailable.
Figure 7 presents 12 SAR images of the small sand-bank ‘Medemgrund’ in the Elbe estuary, recorded be-tween December 1996 and July 1998 in various tidalsituations. Tidal heights taken from a tide gauge lessthan 10 km away from the sandbank were used tointerpolate a topography by a Gaussian shaped inter-polation weight function. The interpolation results aregiven in Fig. 8a. Regions outside the tidal height rangeof the 12 images allow no elevation extraction. A com-parison with the same area from the vessel mountedechosounder topography from 1997 provided by BAWgave mean height differences of 30–40 cm (ignoringborder effects from regions outside the tidal rangeconsidered, Fig. 8b gives the reference topography forvalues higher than �2.0 m NN).
DEMs like the one created, are important input fortidal modelling and its applications, e.g. flood preven-tion. By iterative methods, existing DEMs can also bemodified using a single or very few waterlines and iter-ative runs of a tidal model (Mason et al. 1999). This issupposed to yield higher accuracies and larger regionsbeing examined due to better tidal information aboutevery point of the waterline as well as a shorter temporal
Fig. 4 Waterline in estuary of the German river Eider, SAR imagefrom March 19, 1998
105
range of the images. Nevertheless a DEM and a tidalmodel are needed for the latter approach.
4 Conclusions and outlook
4.1 Waterline detection with ENVISAT
Besides the comparable SAR imaging modes from theERS-1/2 satellites, which promise similar waterline
quality, ENVISAT provides several new modes andsensors.
ScanSAR allows imaging of huge regions up to500·500 km2 in a single scene at a resolution of about100 m. This reduces the quality of the derived water-line to a value of around 150–200 m meaning errors inthe derived DEM of around 1 m as a rough estima-tion based on ERS results and coastal slopes. While amore frequent coverage would mean also easier cov-erage of the tidal range, reducing the morphological
Fig. 5 Changes of thesandbank ‘Blauort’ within twodecades using Landsat and IRSimages
106
2000 2200 2400 2600 2800 3000 3200
200
400
600
800
Aug 1992
Apr 1996
Jul 1999
Medemsand
Kehdingen
Medemgrund
Fig. 6 Changes of thesandbanks ‘Medemsand’ within7 years using ERS-2 SARimages. Axes show pixelnumbers (12.5 m pixel spacing)
Fig. 7 Waterlines superimposed to SAR images of sandbank ‘Medemgrund’ in 12 cases during 1.5 years ordered by falling water level.The sandbank is totally covered by water almost half of the time
107
changes in the period under consideration, the error ofthe waterline localization will be the major contribu-tion to the DEM error.
The optical sensor MEdium Resolution ImagingSpectrometer (MERIS) has 15 spectral bands at a res-olution of 300 m. While being able to very confidentlyseparate land and water areas with its relatively highspectral resolution, the spatial resolution is too low forwaterline applications covered here. MERIS is a usefulsensor for large scale applications like land/water maskgeneration for wind derivation.
4.2 Further sensors and methods
4.2.1 Upcoming satellites
Both recent and upcoming satellites provide muchhigher geometric resolutions, both in optical and SARdata. RADARSAT-2 e.g. will provide SAR images up toa resolution of 3 m, IKONOS and QUICKBIRD pro-vide optical images of 1 m and 0.6 m resp., and Terra-SAR-X and COSMO-SKYMED will provide SARimages of 1 m resolution. Uses of these images will, byfar, enhance the localization of the derived waterline andreduce the error of the interpolated bottom topography.The problems of automatic waterline extraction (Sect. 2)due to extreme weather situations in some SAR scenesmight vary with the SAR look angle / due to the radar
reflectivity r0 on the water being dependent on bothwind speed and /.
Using multipolarization SAR allows easier segmen-tation of different land coverage areas and thus morereliable waterline extraction using up to four possiblepolarization combinations. This will also enhance thequality of waterlines using multipolarized images fromENVISAT and COSMO-SKYMED (up to two polar-izations per image), RADARSAT-2, and TerraSAR-X(both up to four polarizations per image).
4.2.2 DEMs from InSAR techniques
SAR interferometry (InSAR) is a technique by whichelevation models are calculated using different runningtime between two acquisitions of the same area fromslightly different positions of two antennas (Bamler andHartl 1998; Siegmund et al. 2001). InSAR allows DEMgeneration of the wadden sea, if the cross-track baselineis suitable for the application. With this method, DEMscan only be generated of non-flooded areas. Therefore,the acquisition takes place during low tide situations.
Examination of data from the Shuttle Radar Topog-raphy Mission (SRTM, in February 2000) (Werner 2000)showed that the principal topographic shapes of thesandbanks in the Elbe estuary are visible (Niedermeier2002; Voigt 2002), although the height accuracy (around2 m, which is much better than the theoretically pro-posed 6 m) is still too low for the use in shipping ornumerical tide modelling. Airborne InSAR allows anaccuracy of a few centimeters at high spatial resolution(Wimmer et al. 2000) while its costs for mapping largeregions are relatively high.
Also equipped with an InSAR mode, TerraSAR-Xwill not be able to measure topographies, as its baselineis proposed to be along-track only.
4.2.3 Other instruments
Some of the algorithms proposed in this paper are alsoapplicable to aerial photography.
Acknowledgements The authors like to thank Edzard Romaneeßenfor the development of parts of the SAR waterline extractionalgorithm and Norbert Winkel for providing tidal gauge andtopographical comparison data. The work was done within theHGF project ENVOC.
Dellepiane S, De Laurentiis R, Giordano F (2004) Coastlineextraction from SAR images and a method for the evaluation ofcoastline precision. Pattern Recogn Lett 25:1461–1470
Hoja D (1999) Extraktion von Wasserstandslinien aus IRS-1CSzenen. Studienarbeit, Institut fur Kartographie, TechnischeUniversitat Dresden, May 1999
Fig. 8 Bottom topography (in meters) of the sandbank ‘Medemgr-und’ interpolated from SAR images (a) in comparison to theechosounder based topography (b)
108
Hoja D (2000) InSAR-Hohenmodell und Wasserstandslinienver-fahren im Vergleich. Master’s thesis, Institut fur Kartographie,Technische Universitat Dresden, January 2000
Hoja D, Lehner S, Schwabisch M, Winkel N, Buchroithner MF(2002) Analysis of ERS tandem mode coherence maps in thegerman wadden sea. Int J Remote Sens (Submitted)
Jensen JR (1995) Introductory digital image processing: a remotesensing perspective, 2nd edn. Prentice Hall, Englewood Cliffs
Kraus K, Schneider W (1988) Fernerkundung, volume 1: Physi-kalische Grundlagen und Aufnahmetechniken. Ferd. DummlersVerlag, Bonn
Lee J-S, Jurkevich I (1990) Coastline detection and tracing in SARimages. IEEE T Geosci Remote Sens 28(4):662–668
Lee K-S, Kim T-H, Yun Y-S, Shin S-M (2001) Spectral charac-teristics of shallow turbid water near the shoreline on inter-tidalflat. Korean J Remote Sens 17(2):131–139
Lillesand TM, Kiefer RW, Chipman JW (2003) Remote sensingand image interpretation, 5th edn. Wiley, New York
Liu HX, Jezek KC (2004) A complete high-resolution coastline ofantarctica extracted from orthorectified radarsat SAR imagery.Photo Eng Rem Sens 70(5):605–616
Mallat SG, Hwang WL (1992) Singularity detection and processingwith wavelets. IEEE T Inform Theory 38(6):617–643
Mallat SG, Zhong S (1992a) Characterisation of signals frommultiscale edges. IEEE T Pattern Anal Mach Intel 14(7):710–732
Mason DC, Amin M, Davenport IJ, Flather RA, Robinson GJ,Smith JA (1999) Measurement of recent intertidal sedimenttransport in morecambe bay using the waterline method. EstuarCoast Shelf S 49:427–456
Mason DC, Davenport IJ (1996) Accurate and efficient determi-nation of the shoreline in ERS-1 SAR images. IEEE T GeosciRemote Sens 34(5):1243–1253
Niedermeier A (2002) Wavelet-Methoden in der SAR-Bildverar-beitung—Ein Wavelet-basiertes Wasserstandslinienverfahren
zur Topographiebestimmung im Wattenmeer. PhD thesis,Technische Universitat Munchen, 2002
Niedermeier A, Romaneeßen E, Lehner S (2000) Detection ofcoastlines in SAR images using wavelet methods. IEEE TGeosci Remote Sens 38(5):2270–2281
Rausch J (2000) Analysis of morphological changes in the Dith-marschen bight based on topographic, radar and optical data.Master’s thesis, Institute of Geoscience, Christian AlbrechtsUniversity Kiel, March 2000
Sabins FF Jr (1987) Remote sensing—principles and interpretation.Freemann, New York
Schwabisch M, Lehner S, Winkel N (1997) Coastline extractionusing ERS SAR interferometry. In: Proceedings of 3rd ERSSymposium on ‘Space at the service of our Environment’,Florenz, Italien, March 1997
Siegmund R, Bao M, Lehner S, Niedermeier A, Mayerle R (2001)Surface currents imaged with hybrid along and cross trackinterferometry. In: Proceedings of IGARSS’01 (Sydney, July9th–14th 2001), IEEE 2001
Voigt Y (2002) Hohenmodelle und Stromungsmessungen im de-utschen Wattenmeer aus SRTM-Daten. Master’s thesis, Institutfur Kartographie, Technische Universitat Dresden, April 2002
Werner M (2000) Shuttle radar topography mission(SRTM)—mission overview. In: Proceedings of EUSAR2000,Munich, Germany, 2000
Williams DJ, Shah M (1992) A fast algorithm for active contoursand curvature estimation. CVGIP: Imag Understan 55(1):14–26
Wimmer C, Siegmund R, Schwabisch M, Moreira J (2000) Gen-eration of high-precision DEMs of the wadden sea with air-borne interferometric SAR. IEEE T Geosci Remote Sens 38
Zeug G (2000) Entwicklung und Veranderung der Westkuste derInsel Sylt nach historischen Quellen und Satellitendaten. Mas-ter’s thesis, Institut fur Geographie, Ludwig-Maximilians-Uni-versitat Munchen, February 2000