40
www.german-renewable-energy.com erman-renewable-energy.com Project Development Programme East Africa Uganda`s Bioenergy Market Target Market Analysis www.renewables-made-in-germany.com

www.german-renewable-energy.com
www.german-renewable-energy.com
Project Development Programme East Africa
Uganda`s Bioenergy Market
Target Market Analysis
www.renewables-made-in-germany.com


www.german-renewable-energy.com
Target Market Analysis
Uganda’s Bioenergy Market

www.german-renewable-energy.com
Authors
Robert J. van der Plas
Paul Kirai
November 2009
Editor
Deutsche Gesellschaft für Technische
Zusammenarbeit (GTZ) GmbH
On behalf of the
German Federal Ministry
of Economics and Technology (BMWi)
Contact
Deutsche Gesellschaft für
Technische Zusammenarbeit (GTZ) GmbH
Potsdamer Platz 10, 10785 Berlin, Germany
Fax: +49 (0)30 408 190 22 253
Email: [email protected]
Web: www.gtz.de/projektentwicklungsprogramm
Web: www.exportinitiative.bmwi.de
This Target Market Analysis is part of the Project Development Programme (PDP) East Africa. PDP East Africa is implemented
by the Deutsche Gesellschaft für Technische Zusammenarbeit (GTZ) on behalf of the German Federal Ministry of Economics
and Technology (BMWi) in context of the Export Initiative Renewable Energies. More information about the PDP and about
renewable energy markets in East Africa: www.gtz.de/projektentwicklungsprogramm
This publication, including all its information, is protected by copyright. GTZ cannot be liable for any material or immaterial
damages caused directly or indirectly by the use or disuse of parts. Any use that is not expressly permitted under copyright
legislation requires the prior consent of GTZ.
All contents were created with the utmost care and in good faith. GTZ assumes no responsibility for the accuracy,
timeliness, completeness or quality of the information provided.

Target Market Analysis: Uganda’s Bioenergy Market V
Content
1 STATUS QUO OF THE BIOENERGY SECTOR ....................................................................... 1
1.1 Brief Bioenergy Sector Overview .......................................................................................................... 1
1.2 Major Market Segments ....................................................................................................................... 2 1.2.1 Forests and Woodlands ....................................................................................................................... 2 1.2.2 Agricultural and Agro-Industrial Residues ........................................................................................... 5 1.2.3 Papyrus ................................................................................................................................................ 6
1.3 Local Capacities..................................................................................................................................... 6
2 BIOENERGY MARKET POTENTIALS ..................................................................................... 8
2.1 Overall Sector Outlook .......................................................................................................................... 8 2.1.1 Recommendations for German companies ...................................................................................... 10
2.2 Undeveloped Market Opportunities ................................................................................................... 10 2.2.1 Agricultural and Agro-Industrial Residues ......................................................................................... 11 2.2.2 Municipal Solid Waste (MSW) ........................................................................................................... 12 2.2.3 Other Solid Biomass Opportunities (Mainly Household Sector) ....................................................... 13 2.2.4 Liquid Biofuels ................................................................................................................................... 15 2.2.5 Advanced Technologies ..................................................................................................................... 16
3 BIOENERGY-SPECIFIC REGULATION AND FRAMEWORK .......................................... 17
3.1 Policies and Regulations ..................................................................................................................... 17 3.1.1 National Energy Policy (esp. Biofuels) ............................................................................................... 17 3.1.2 Electricity Regulation Authority (ERA) ............................................................................................... 18 3.1.3 Forestry Policy ................................................................................................................................... 18
3.2 Applicable Public Sector Support / Financing Mechanisms and Sources............................................. 19
3.3 Campaigns and Others ........................................................................................................................ 20
4 BUSINESS PARTNERS AND COMPETITORS IN THE BIOENERGY SECTOR ............ 21
4.1 Overview of Bioenergy Market Players ............................................................................................... 21
4.2 Overview Major and/or Most Emblematic Bioenergy Projects ........................................................... 27
4.3 Highlights in Local Bioenergy Market Developments .......................................................................... 28

Target Market Analysis: Uganda’s Bioenergy Market VI
List of Tables Table 1: Details of Biomass Energy Technologies Available in Uganda Market .................................................... 2
Table 2: Woody biomass demand by sector (tons/year) 2006 ............................................................................... 3
Table 3: Woody Biomass in Uganda ..................................................................................................................... 4
Table 4: Summary of Estimated Available national Woody Biomass ..................................................................... 4
Table 5: Agricultural Residues in Uganda (MEMD) ............................................................................................... 6
Table 6: Regional Wood Biomass Balances .......................................................................................................... 8
Table 7: The Renewable Energy Power Potential ............................................................................................... 10
Table 8: Energy Production Potential from Agro-Residues ................................................................................. 11
Table 9: Technical Potential of Agro-industrial and Agri-cultural Residues ......................................................... 11
Table 10: Potential for Electricity Generation from MSW ..................................................................................... 12
Table 11: Potential Opportunities Solid Biomass –MSW ..................................................................................... 13
Table 12: Potential Opportunities Solid Biomass – Traditional Fuels .................................................................. 14
Table 13: Biomass Technologies Targets and Impacts ....................................................................................... 15
Table 14: Potential Opportunities Liquid Biomass ............................................................................................... 17
Table 15: Biomass Energy in the Renewable Energy Policy ............................................................................... 20
Table 16: Selected Bioenergy Market Players in Uganda ................................................................................... 22
Table 17: Key Actors and their Roles .................................................................................................................. 25
Table 18: Most Important Bioenergy Projects ...................................................................................................... 27

Target Market Analysis: Uganda’s Bioenergy Market VII
Currency
1 USD = UShs 2,230 (May 2010)
1 € = UShs 2,733 (May 2010)
Measurement
W Watt Wp Watt peak Wh Watt hour
kW Kilowatt kWp Kilowatt peak kWh Kilowatt hour
MW Megawatt MWp Megawatt peak MWh Megawatt hour
GW Gigawatt GWp Gigawatt peak GWh Gigawatt hour

Target Market Analysis: Uganda’s Bioenergy Market VIII
List of Acronyms
API Africa Power Initiative
BET Biomass-Energy Technologies
CHP Combines Heat and Power
COMESA Common Market for Eastern and Southern African States
CREEC Centre for Research in Energy and Energy Conservation
EAC East African Community
EIA Environmental Impact Assessment
ERA Electricity Regulatory Agency
KCC Kampala City Council
MAAIF Ministry of Agriculture, Animal Industry and Fisheries
MEMD Ministry of Energy and Mineral Development
MSW Municipal Solid Waste
Mt Megaton
Mtoe Million oil equivalent tons
MUK Makerere University
NFA National Forestry Authority
NGO Non-Governmental Organisation
PCIA Partnership for Clean Indoor Air
RAP Resettlement Action Plan
REA Rural Electrification Agency
RET Renewable Energy Technology
SPGS Sawlog Production Grant Scheme
UETCL Uganda Electricity Transmission Company Ltd
UFRIC Uganda Forestry Resources and Research Institute
UNBS Uganda National Bureau of Standards
UOSPA Ugandan Oil Seed Producers and Processor Association
UORDP Uganda Orphans Rural Development Programme
UTGA Uganda Timber Growers Association
WRMD Water Resources Management Department

Target Market Analysis: Uganda’s Bioenergy Market IX
Summary
85 % of the Uganda’s energy balance is made up of biomass, predominantly woodfuel for cooking and
heating. The sugar industry utilises agricultural residues (bagasse) for energy production. A small
amount of coffee and rice husks is also used to provide heat for the production of cement, lime, and
brick & tiles.
Studies by the Ministry of Energy and Mineral Development (MEMD) in 2003 estimated a potential of
more than 5 GW potential from renewable energy in Uganda with biomass contributing 2.45 GW,
almost 50 %. The main opportunities are power generation from bagasse at specific locations and
municipal solid waste in Kampala. There are further opportunities in the traditional energy sector
ranging from briquette production from papyrus and agro or silvi-industrial operations, plus a variety of
activities dealing with energy efficiency in tree plantations and household cooking. Biofuels present
another opportunity. However, there remains limited local technical experience available. The
government’s renewable energy policy recommends blending of diesel with 20 % biodiesel and is
intended to create a marketplace and attract investment in production. There is some, but limited,
financial and technical skills capacity in the public and private sector to develop these opportunities.

Target Market Analysis: Uganda’s Bioenergy Market 1
1 Status Quo of the Bioenergy Sector
1.1 Brief Bioenergy Sector Overview
Uganda covers an area of 236,040 km2 and had an estimated population of over 28 million in 2006
growing at about 3 % per annum. Over the last decade the country has recorded a fairly steady
economic growth and stable political climate, with an average GDP real growth rate of 6 %. This
growing economy combined with the fast growing population translates into a growing demand for
energy.
Uganda’s energy supply and utilisation remains dominated by biomass while access to electricity is
limited to only 9 % of the population; the remaining 91 % of the population mainly use biomass in the
form of firewood or charcoal. It is envisaged that this trend will continue in the foreseeable future.
Trading in biomass energy, especially charcoal, contributes to the economy in terms of rural incomes,
tax revenue and employment, employs at least 20,000 people and generates approximately UShs 36
billion (USD 20 m) per year in rural incomes. Fuel wood demand and particularly land clearing for
agriculture have contributed to the degradation of forests and wood reserves are being depleted at a
rapid rate in many regions. Charcoal, which is generally produced on non-state land, experiences a
high growth as the consumption increases at a rate close to that of urban population (6 % per annum).
Most of the biomass in Uganda is used with traditional energy technologies that are not very efficient.
Several initiatives to conserve biomass resources or improve the utilisation efficiency have been
undertaken by the government, the private sector, and NGOs. They include the use of modern
furnaces and boilers, the promotion of improved cooking stoves, and re- or afforestation. However, the
impact of these efforts has remained limited so far. There is no lack of biomass in Uganda and the
bioenergy market could therefore be described as “underdeveloped with substantial potential”, which
is good news for new investors interested in this subject.
The country is dependent on imported fossil fuels. Deposits of oil have been discovered in the
Western region of the country and commercial drilling is expected to begin in 2010 in Lake Albert. As a
landlocked country, Uganda experiences higher retail prices for petroleum products compared to many
other African countries due to high transportation costs. The escalating prices of fossil fuels have
made it imperative for the government to promote the development and utilisation of renewable energy
resources including bioenergy and associated technologies.
Interest in bioenergy in Uganda is driven by a number of factors and events. Firstly, the recent volatile
price of fossil fuels in the international market. Secondly, the (global) renewed interest in green and
clean energy would apply to biomass under the right conditions in Uganda giving rise to many
opportunities due the good physical climate for agriculture. Thirdly, although it is not generally
perceived as such by the government, energy from biomass contributes to the energy security of the
country as well as to rural development as a result of employment generation, technology transfer and
promotion of capacity building.
Obstacles for increased biomass development identified in Uganda include inadequate land due to
increasing population density and a high demand for land for food crop farming. Since many of the
communities in Uganda are still deeply rooted in their traditions, they have great reverence to cultural
heritage sites that have special significance to the community. Biomass resources in such sites would
not be easily exploited due to cultural resistance.

Target Market Analysis: Uganda’s Bioenergy Market 2
1.2 Major Market Segments
Biomass is predominantly used at the household level for cooking and boiling water in the forms
firewood, charcoal, farm residues and wood wastes. Over 80 % of households and restaurants use
charcoal in urban areas traditionally on a metallic stove known as a “sigiri”, whilst rural households and
institutions use firewood in three-stone stoves or more modern improved stoves with a recent
introduction of charcoal.
Table 1: Details of Biomass Energy Technologies Available in Uganda Market
Equipment Capacity/application Cost (UShs)* Cost (USD)
Domestic charcoal stove Ranging from budget to large
size
8,000 – 15,000 3.59 – 6.73
Domestic heavy duty domestic
stove
Standard capacity 50,000 22.42
Multipot burners (wood chops) 2-12 pots (one fire feeding
point)
600,000 -3,200,000 269.06 –
1,434.98
Deep friers (wood chops) 8 - 30 liters 720,000 – 840,000 322.87 – 376.69
Meat roasters (charcoal or firewood) Domestic and commercial use 200,000-800,000 89.69 – 358.74
Water heating systems 100 -200 liters 3,250,000 –
4,500,000
1,457.4 –
2,017.94
Institutional energy saving jikos
(wood chops)
50-400 liters (serves 800
people)
800,000 –
2,200,000
358.74 – 986.55
Baking ovens (wood chops) 12,30 and 60 loaves (1kg) 800,000 –
2,200,000
358.74– 986.55
Milk pasteurisers (Wood chops) 150 -300 liters 3,000,000 –
4,500,000
1,345.29 –
2,017.94
Incinerators Institutional and hospital use 6,000,000 –
15,000,000
2,690.58 –
6,726.46
Source; MEMD*Based on 2004 prices (May 2010: 1 USD=USh 2,230)
The main biomass market segments in Uganda are:
(i) trees in forests, plantations, and on farmers lands;
(ii) agricultural and agro-industrial residues;
(iii) papyrus;
(iv) municipal solid waste
1.2.1 Forests and Woodlands
According to the MEMD’s 2004 Annual Report (2006), the per capita consumption in 2004 was 680
kg/yr and 240 kg/yr for firewood for rural and urban areas respectively, and 4 kg and 120 kg of
charcoal per person per year. Total biomass (firewood and wood for charcoal) demand for households
(year 2006) is 22.2 million tons per year. The cottage industries account for about 20 % of total
biomass use, adding a further 5.5 million tons of biomass and bringing the total biomass demand to
about 27.7 million tons as shown in Table 2 below.
Target Market Analysis: Uganda’s Bioenergy Market 3
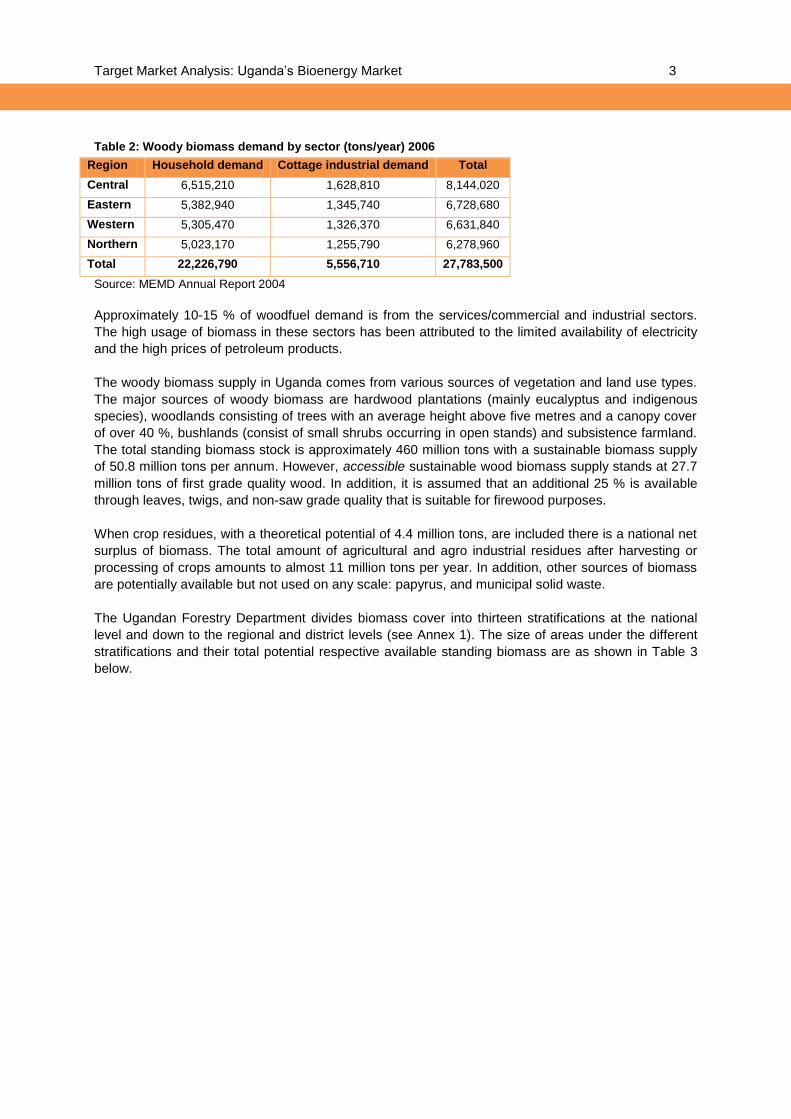
Table 2: Woody biomass demand by sector (tons/year) 2006
Region Household demand Cottage industrial demand Total
Central 6,515,210 1,628,810 8,144,020
Eastern 5,382,940 1,345,740 6,728,680
Western 5,305,470 1,326,370 6,631,840
Northern 5,023,170 1,255,790 6,278,960
Total 22,226,790 5,556,710 27,783,500
Source: MEMD Annual Report 2004
Approximately 10-15 % of woodfuel demand is from the services/commercial and industrial sectors.
The high usage of biomass in these sectors has been attributed to the limited availability of electricity
and the high prices of petroleum products.
The woody biomass supply in Uganda comes from various sources of vegetation and land use types.
The major sources of woody biomass are hardwood plantations (mainly eucalyptus and indigenous
species), woodlands consisting of trees with an average height above five metres and a canopy cover
of over 40 %, bushlands (consist of small shrubs occurring in open stands) and subsistence farmland.
The total standing biomass stock is approximately 460 million tons with a sustainable biomass supply
of 50.8 million tons per annum. However, accessible sustainable wood biomass supply stands at 27.7
million tons of first grade quality wood. In addition, it is assumed that an additional 25 % is available
through leaves, twigs, and non-saw grade quality that is suitable for firewood purposes.
When crop residues, with a theoretical potential of 4.4 million tons, are included there is a national net
surplus of biomass. The total amount of agricultural and agro industrial residues after harvesting or
processing of crops amounts to almost 11 million tons per year. In addition, other sources of biomass
are potentially available but not used on any scale: papyrus, and municipal solid waste.
The Ugandan Forestry Department divides biomass cover into thirteen stratifications at the national
level and down to the regional and district levels (see Annex 1). The size of areas under the different
stratifications and their total potential respective available standing biomass are as shown in Table 3
below.

Target Market Analysis: Uganda’s Bioenergy Market 4
Table 3: Woody Biomass in Uganda
Land cover (use) Gross area (km2) Total biomass(,000 t, air dry)
Broadleaved plantations total 188.9 1,431.20
Built up areas total 365.8 47.4
Bushlands1 total 14,221.90 14,961.30
Grasslands2 total 50,721.10 58,560.80
Impediments3 total 37.4 0
Large scale farmlands total 684.5 0.6
Softwood plantations total 163.9 2,456.50
Subsistence farmlands total 84,007.10 104,534.30
Tropical high forest total 6,511.10 145,847.80
Tropical high forest (degraded) total 2,730.60 30,855.50
Water total 36,895.60 0
Wetlands total 4,840.30 0
Woodlands total 39,744.60 118,474.20
Grand total 241,112.80 477,169.60
Source: National Biomass Assessment Study 2003, Ministry of Water, Lands and Environment
Woody biomass supplies a very important source of energy for both the rural and urban population of
Uganda. It is worth noting that not all the biomass is accessible due to either being far from populated
areas or because of management restrictions in protected areas such as forest reserves, game
reserves and national parks. In consideration of reduced access to potential wood sources, Table 4
below provides a summary of estimated available national woody biomass resources.
Table 4: Summary of Estimated Available national Woody Biomass
Land cover
(use)
Gross
area (km2)
Protected
area (km2)
Available
area (km2)
Total biomass
(,000 t, air dry)
Protected
(,000 t, air dry)
Available
(,000 t, air dry)
Broadleaved
plantations total
188.9 66.7 122.2 1,431.20 505.65 925.55
Built up areas
total
365.8 26 339.9 47.4 3.72 43.68
Bushlands total 14,221.90 8,626.70 5,595.20 14,961.30 8,102.34 6,858.96
Grasslands total 50,721.10 23,163.40 27,557.70 58,560.80 27,522.52 31,038.28
Impediments
total
37.4 11.4 26 0 0 0
Large-scale
farmlands total
684.5 22.6 662 0.6 0 0.6
Softwood
plantations total
163.9 156.9 7 2,456.50 2,353.50 103
Subsistence
farmlands total
84,007.10 4,985.70 79,021.40 104,534.30 4,346.80 100,187.50
1 Bushlands refer to crown cover over 40% and below 5 meters.
2 Grasslands are predominantly covered with grass vegetation but with occasional scattered trees.
3 Implements refer to areas where no biomass is expected such as rock outcrops and bare lands.

Target Market Analysis: Uganda’s Bioenergy Market 5
Tropical high
forest total
6,511.10 4,763.40 1,747.70 145,847.80 106,700.83 39,146.97
Tropical high
forest
(degraded) total
2,730.60 971.5 1,759.10 30,855.50 10,978.29 19,877.21
Water total 36,895.60 270.5 36,625.10 0 0 0
Wetlands total 4,840.30 535.8 4,304.50 0 0 0
Woodlands total 39,744.60 13,726.50 26,018.10 118,474.20 40,728.35 77,745.85
Grand total 241,112.80 57,327.00 183,785.80 477,169.60 201,242.00 275,927.60
Source: National Biomass Assessment Study, 2003, Ministry of Water, Lands and Environment
1.2.2 Agricultural and Agro-Industrial Residues
Rural households will use agricultural residues whenever available, particularly during the harvest
seasons. In addition, they will gather as much wood and small biomass leftovers then can find. Only
households in secondary cities and larger towns may use purchased firewood in addition to gathered
firewood. Biomass energy from crops is derived from agricultural residues available from growing,
harvesting, and/or processing of food crops (cereals, root crops and pulses) as well as cash crops
such as coffee, tea and cane sugar. The distributions of these crops in the country depend on specific
crop requirements such as soils and climatic conditions (e.g. rainfall patterns and its distribution).
Table 5 below indicates the available agricultural residues in Uganda.
Total cultivated area for crops and plants as a potential source of energy is almost 5.1 million ha. The
total amount of agricultural residues left after harvesting or processing of crops amounts yearly to
almost 11 million tons. As of today, sugar mills utilise to some extent residues for energy conversion
using modern technology, all other industries with residue potential do not use these. A small amount
of coffee and rice husks are utilised for heat production in cement as well as in brick and tiles
manufacturing. Residues are also used as fertiliser and/or animal fodder.

Target Market Analysis: Uganda’s Bioenergy Market 6
Table 5: Agricultural Residues in Uganda (MEMD)
Crop Type Residues (t) Availability for
energy (%)
Availability for
energy (tons)
Cassava 667,200 0 0
Bananas 3,604,799 30 1,081,440
Beans 273,001 30 81,900
Cow peas 26,783 30 8,035
Field peas 9,599 30 2,880
Soya beans 55,299 30 16,590
Finger millet 695,200 0 0
Sorghum 478,802 30 143,641
Maize 913,002 30 273,901
Rice 108,445 30 32,534
Wheat 10,800 0 0
Sun flower 22,251 0 0
Ground nuts 144,000 30 43,200
Sweet potatoes 666,900 0 0
Irish potatoes 155,726 0 0
Coffee 145,172 30 43,552
Tea 12,692 30 3,808
Tobacco 6,851 30 2,055
TOTAL 7,996,522 - 1,733,536
Source: MEMD (2007); Renewable Energy Policy for Uganda
1.2.3 Papyrus
Despite the lack of available data to determine the full extent of papyrus in Uganda, the World
Resources Institute indicated that 514 districts in Uganda have papyrus resources and 444 do not. In
addition, it shows that papyrus is available throughout the country with a concentration in the Western
and Southern parts and that there are already some small-scale harvesting operations. In Uganda,
papyrus grows at more than 20 t/ha/year (dry biomass), a higher productivity rate than typically
observed for eucalyptus trees4. Some harvesting has been reported but it is not known whether this is
for energy or for other purposes such as making mats as an alternative to water hyacinth.
1.3 Local Capacities
There is latent capacity in Uganda for issues dealing with biomass energy, dispersed across
organisations throughout the country. There is no interest group pursuing more efficient biomass
energy issues.
Partner organisations
Organisations established by stove artisans who continue to face capacity issues. Some do not
have formal job training and acquired practical on-the-job experience. They may have benefited
from occasional stakeholders courses organised by e.g. MEMD, NGOs, GTZ
Lack of own finances hinder expansion and better product improvement
4 Compared to a typical productivity of 10 t/ha for eucalyptus.

Target Market Analysis: Uganda’s Bioenergy Market 7
Research and Development is rarely given a priority and product differentiation is minimal
Product quality is not strictly adhered to
Capacity building programmes
GTZ advises the Ugandan MEMD and organises training measures on energy efficiency and
renewable energy for representatives of business. GTZ trains local producers of efficient stoves
and assists marketing plus awareness-raising campaigns within the population and training
courses in the villages on how the energy-saving stoves work.
One of the main universities in the country offers specialised courses in renewable energy.
Makerere University Faculty of Technology has acquired some basic testing equipment for
biomass related issues and can be involved in capacity building and technology assessment.
Elementary schools address household energy issues and include a section on improved stoves;
secondary schools have specialised curricula for household energy.
Through the Partnership for Clean Indoor Air (PCIA), managed by the US Environmental
Protection Agency, UGASTOVE (as the market leader sold 30,000 units in 2008) has improved
their capacity to construct and operate a fuel-efficient kiln to produce light-weight insulation
ceramics to be used in the production of improved cooking stoves.
Availability of qualified human resources
Educational programmes in schools and sessions organised by GTZ and other NGOs have raised
the awareness on efficient biomass stoves.
A pool of technicians and artisans exist, but there is still a shortage of engineers with prerequisite
skills in the bioenergy field.
A number of personnel who have trained overseas have returned to Uganda.
Local contacts
There is not a professional association to look after the interests of biomass and biomass energy
practitioners.
Competing interests among various players have led to emergence of multiple advocacy
organisations which may not be strong enough to pursue a common objective for all players.
MEMD has produced a Renewable Energy directory with GTZ funding.
Local suppliers for bioenergy installations
Manufacturers of improved cook stoves utilise local materials only.
There are few suppliers of industrial equipment like modern kilns, presses etc.; most of these are
fabricated locally at informal workshops.
Available suppliers also double-up as consultants thereby reducing the reliability of their installed
systems.
Potential customers first contact their suppliers and give little consideration to the importance of
consultancy advice that they find expensive and often not necessary.
Local operation and maintenance capacities
Most of the manufacturers do not have quality verification systems in place which has hindered
market penetration due to lack of confidence in local products.
After sale services of bioenergy systems is not well established. This has caused low level of
confidence in viability of such systems hence reducing their uptake among the local population.

Target Market Analysis: Uganda’s Bioenergy Market 8
Constraints to local business growth
Lack of investment capacity for expansion and modernisation.
Many of the business set up are family-oriented or traditional, and thus lack the prerequisites for a
modern business approach.
Lack of unified advocacy body to pursue a united objective for all the sector players hinders higher
market penetration.
Local capacity for research and development
Makere University has a Forestry Faculty with four departments: Forestry Products, Forest
Management, Community Forestry and Forest Biology.
The Uganda Forestry Resources and Institutions Center (UFRIC) intends to ensure sustainability
of forestry resources in Uganda through systematic data collection and analysis for use in forest
policy formulation.
2 Bioenergy Market Potentials
2.1 Overall Sector Outlook
The national balance of woody biomass has a deficit of 85,000 tons (Report on the Renewable Energy
Resource Information Development and Capacity Building Assessment In Uganda; KAMFOR, 2006),
i.e. the estimated sustainable supply of woody biomass is smaller than the total estimated demand for
wood fuels plus timber. This does not include crop residues and non-timber grade. However, the use
of biomass is site-specific due to bulkiness and low density characteristics of most residues transport
from one region to another is not practical and expensive. For firewood, commonly accepted
breakeven distances are about 80 km from the consumption centre, while charcoal can be transported
over much larger distances of several hundreds of km. Therefore, at a regional level differences in the
local supply-demand balances occur, with a deficit of about three million tons in both the Central and
Eastern Regions, and a surplus of about four million tons in the Northern region and of about two
million tons in the Western region.
Currently, accessible sustainable wood biomass supply stands at 27.7 million tons. When crop
residues, whose theoretical potential in Uganda could be 4.4 million tons, are included, there is a
national net surplus. Agro-industrial residues from the sugar, coffee and rice industries amount to
about 3.7 million tons a year. Sawmilling residues (440,000 m3) consist of sawdust, bark, chips and
other waste wood that is not suitable for further processing; most of this is used as fuel wood.
Table 6: Regional Wood Biomass Balances
Regions Total Demand Sustainable
Supply
Balance
Central 8,144,013.18 5,152,332.95 – (2,991,680.23)
Eastern 6,728,674.51 3,812,874.61 – (2,915,799.90)
Western 6,631,836.37 8,485,586.19 1,853,749.82
Northern 6,278,955.35 10,247,437.46 3,968,482.11
Total 27,783,479.40 27,698,231.20 – (85,248.20)
Source: KAMFOR Report, 2006

Target Market Analysis: Uganda’s Bioenergy Market 9
Several barriers hamper further bioenergy development and use in Uganda.
Inadequate legal and institutional framework
There is no standard procedure for developing bioenergy activities and legal instruments to
supporting investments. There is a Renewable Energy Policy for Uganda but this has hardly been
put into place and as a result there are not many concrete actions.
Low priority for bioenergy
Insufficient attention is given to biomass energy in the national policies, strategies, programmes
and projects. Prospects for petroleum deposits in the Western Rift Valley have further decreased
the government’s interest in bioenergy and increased interest in fossil fuel exploration and use.
Preferential investment incentives for petroleum sector development are likely which will further
marginalise bioenergy. The majority of policymakers, planners, decisionmakers and political
leaders equate energy with high-grade forms of energy such as electricity and petroleum products.
The quasi-exclusive focus on increasing access and substituting away from biomass energy is
partly due to a poor understanding of the important roles currently played by biomass energy.
Poor data bank
There is lack of comprehensive and reliable data on both the consumption and supply sides.
Biomass energy planning relies on a wide variety of information (both quantitative and qualitative)
from different disciplines. The responsible institutions (Energy Department and Bureau of
Statistics) lack the prerequisite financial and human resources as well as the professional interest
to properly address this sector. The key institutions in the biomass sub-sector like MEMD and
MUK, NGOs and private companies experience shortage of qualified personnel/experts in the
area of biomass. Also the institutional linkages between the various actors are weak and in some
cases non- existent.
Lack of suitable and available financing mechanisms
Commercial banks in Uganda do not offer financing schemes that support short or long-term
investments in biomass energy due to perceived risks and misunderstanding of the sector. The
biomass sub-sector largely functions and operates in the informal and private sector and banks
consider it as risky business with little attraction for capital investments and poor payback
performance. The sub-sector is characterised by projects/businesses with long gestation periods
and small profit margins. It is rarely attractive to large capital providers as it lacks financial appeal
compared to other sectors of the economy.
Underdeveloped markets
There is potential for commercial demand of bioenergy products, but the market is not yet fully
developed to realize actual demand. The public is neither aware of available new technologies
with associated advantages and constraints, nor are they aware of the usefulness of investing in
such technologies. Few local producers/manufacturers and importers characterise the sub-sector.
Limited technical and institutional capacity
The public and private sectors have limited technical and institutional capacity to develop and
manage bioenergy projects. Training at higher institutions of learning has not sufficiently
emphasized bioenergy in the engineering and other related professional courses.
Lack of research and development support
Due to increased pressure to fulfill pressing social and infrastructural concerns, there is limited
government’s budgetary support to higher learning and research and development institutions to
carry out adaptive research that can promote the development of bioenergy.

Target Market Analysis: Uganda’s Bioenergy Market 10
2.1.1 Recommendations for German companies
Partner with local companies that understand local market dynamics. Identify key institutional
partners to assist in strengthening the capacity of these players to effectively carry out their
respective roles which is ideal to sustain a project.
Identify the most appropriate and cost-effective designs before launching a large-scale
dissemination programme; pilots are a good and low-cost way to identify any remaining barriers.
Establish and enforce design, quality and service criteria to commensurate modern technology as
practiced in Europe to ensure the reliable and cost-effective operation of installed systems as a
fundamental attribute to realising success in energy projects.
Sub-standard product quality is expected in the Uganda market and therefore product
differentiation is absolutely necessary. German technology is known for its robustness and
durability, and products sold in Africa should not differ from this.
Understanding end-user/market needs and concerns by designing a product that meets these
needs and addresses the concerns.
The market for renewable energy technologies (RETs) and after-sales delivery services are
underdeveloped. Market vendors for RETs are concentrated in major towns only and it is
expensive to contract sales and after sales services in rural areas. Any potential investor should
see this as an opportunity for entry into the market.
2.2 Undeveloped Market Opportunities
In addition to the mainstream primary woody biomass resources, a large potential exists in the form of
secondary sources like agro-industrial and agricultural residues and municipal solid wastes (MSW).
Although it is technically possible to produce electricity from these residues by combustion through
combined heat and power (CHP), it remains a matter of economic performance that determines the
viability. The operational costs of using agro-industrial residues, the benefits of replacing grid
electricity and income from the sale of excess electricity back to the national grid should provide an
adequate rate of return on the capital investments in the bioenergy plant. The suitable technology
depends on the size of the plant.
Advanced biomass technologies such as gasification, and modern brick kilns are still new and
untested in the country, possibly presenting viable bioenergy business opportunities.
The Renewable Energy Policy for Uganda estimated a potential of more than 5 GW potential from
renewable energy, as indicated in Table 7. Biomass could contribute 2.45 GW, almost 50 %, of this
potential capacity. The following table illustrates the potential of different alternative energy resources
in Uganda in 2003/4, since which few developments have been made.
Table 7: The Renewable Energy Power Potential
Energy source Estimated electrical potential (MW)
Hydro 2,000
Mini-hydro 200
Solar 200
Biomass 1,650
Peat 800
Geothermal 450
Wind -
Total 5,300
Source: Renewable Energy Policy for Uganda, 2007

Target Market Analysis: Uganda’s Bioenergy Market 11
2.2.1 Agricultural and Agro-Industrial Residues
Table 8 below shows potential energy production potential for agro-residues; the economically viable
part to this potential is likely to be much smaller because the feedstock has a low energy density, is
difficult and expensive to transport, and cannot always be easily burnt in a boiler.
Table 8: Energy Production Potential from Agro-Residues
Biomass type Annual production
(‘000 tons/yr)
MWe average
Bagasse, total 590
Of which un-used surplus, (available
immediately)
3 x 25-50 67
Rice husks 25-30 16
Rice straw 45-55 30
Sunflower hulls 17 20
Cotton seed hulls +50 (being developed) 1
Tobacco dust 2-4 2
Maize cobs 234 139
Coffee husks 160 95
Groundnut shells 63 37
Total 407
Source: Renewable Energy Policy MEMD 2007.
Some of the food and cash crops that would in theory provide substantial potential for energy
extraction are highlighted below in Table 9. Some of the residues will be ploughed back into the fields,
households will use some and the remaining could be used for industrial energy purposes. Whether or
not this is viable should be determined through a systematic assessment. The fact that the three sugar
mills all have converted their boilers to allow CHP generation operations indicates that it is
economically viable in Uganda to use biomass for energy purposes in a commercial setting.
Table 9: Technical Potential of Agro-industrial and Agri-cultural Residues
Agriculture residues
Remarks
Sugar cane Bagasse form sugarcane can be used for cogeneration to produce electricity. Currently, three factories in Uganda, namely: Kakira Sugar Works Ltd, Kinyara Sugar Works Ltd and Sugar Corporation of Uganda Ltd, already employ cogeneration equipment with a total electricity generation of over 10 MW. There is potential to increase this as the excess can be fed to the national grid.
Banana
The banana is a common food in Uganda and on average consists of 35 % banana and 65 % banana peelings. The production of banana in 2003 was 9.6 million tons of which 6.2 million tons are banana peelings. This can be used for briquetting that can be used as fuel in small scale industries and commercial institutions. Even if only 10 % can be collected, this still is a large quantity compared to the total market for wood fuels.
Cassava Total cassava production in Uganda in 2003 was five million tons. The stalk residues weigh approximately 326,000 tons that can in theory be used as source of energy.
Maize Maize is an annual plant grown widely in Uganda. After harvest, the straw and cobs are residues that can be utilised to provide energy sources. The production of maize in Uganda in 2003 was 1.2 million tons.
Rice
The amount of rice produced in Uganda in 2003 was 109,000 tons. The resulting rice husks
can be a viable source of energy.
Groundnut
The amount of groundnuts produced in Uganda in 2003 was 130,000 tons. The groundnut
shells or husks are well suited for energy purposes.
Coffee
There are two commercially grown coffee species in Uganda, Robusta and Arabica. Coffee
husks removed when coffee beans are harvested can be utilised for to provide energy e.g.
as in Uganda Clay, Kajjansi Bricks. The coffee production in Uganda in 2002 was
approximately 210,000 tons.

Target Market Analysis: Uganda’s Bioenergy Market 12
2.2.2 Municipal Solid Waste (MSW)
Municipal waste in Uganda is generally composed of wet carbon and nitrogen rich materials that
include organic waste from households, agro-industrial waste (slaughter houses, food industry) and
agro waste (manure and straw). There is a vast amount of municipal waste (both solid and sewage
effluents) that is currently not being utilised for energy production. The capital city, Kampala, produces
an estimated 430,000 tons of solid wastes annually. Other municipalities and towns also generate
considerable amounts of waste, but do not have in place proper waste management plans. Over 70 %
of the municipal solid waste is vegetable matter (mainly food residues). The current practice is either
to burn these wastes in the open-air or dump them in landfills with no extraction of their energy
contents. This does not only result in a waste of energy potential, but also causes environmental risks
as the burning is not controlled and the landfills are poorly managed.
Kampala City Council (KCC) currently collects only 40 % of the waste generated in Kampala (KCC,
2002). The following Table 10 shows the potential for electricity generation from MSW in the capital
city.
Table 10: Potential for Electricity Generation from MSW
Power output from waste combustion
Year Waste
produced
(tons)
Feeding rate,
combustion
(kg/h)
Heat
output,
based
on EHV
(KW)
Effective
power
generation
(KW)
Electricity
output
(GWh)
theoretical
(1)
Electricity
output
(GWh)
practical (2)
Electricity
output
(GWh)
theoretical
(3)
2004 430247 49115 102925 28563 250 98 98
2005 444876 50785 106425 29534 259 101 114
2006 460002 52512 110043 30538 268 104 131
2007 475642 54297 113785 31576 277 108 149
2008 491813 56143 117653 32650 286 112 169
2009 508535 58052 121653 33760 296 115 189
2010 525825 60026 125790 34908 306 119 211
2011 543703 62067 130066 36095 316 123 234
2012 562189 64177 134489 37322 327 128 258
2013 581304 66359 139061 38591 338 132 284
2014 601068 68615 143789 39903 350 136 311
Source: Kampala City Council Strategy to improve Solid Waste Management in Kampala City Council, Kampala
City Council, Kampala Uganda, 2002
Note: The level of waste generation in 2002 is the baseline for the projected the calculations. Steady growth rate
in the capital population at 3.4 %, steady rate of waste production at 1 kg per capita is assumed and 5 % recycling
rate. 1) The theoretical available waste amounts provided 100 % collection rate. 2) the practical amounts are
based on the current collection rate at 39 % 3) This scenario involve an increase of the collection rate by 5 %
annually, initially at 39 % in 2004 and rising to 89 % in 2014.
MSW can be used for electricity generation through a combination of combustion and methane gas
extraction. The non-combustible organic matter can be digested to produce biogas. The slurry that
comes out of the digester is rich in nitrogen, phosphorous, potassium and humus and can be used to
replace imported fertilizers and increase agricultural productivity on farms. In addition to municipal
wastes, there are vast quantities of industrial wastes like spent grains in the breweries and used oils,
which can all be used for power generation. The large quantity of sewage can also be effectively used
to generate biogas. Biogas in principle can be used as domestic fuel, fuel for vehicles and power
generation, but in practice power generation is the most practical.

Target Market Analysis: Uganda’s Bioenergy Market 13
In rural farms MSW can be converted into biogas for cooking and lighting at the domestic level, and
commercial dairies and piggeries at the industrial level can generate biogas to be used by gas turbines
to generate electricity and heat in cogeneration technology.
Table 11: Potential Opportunities Solid Biomass –MSW
Opportunity 1: Municipal solid waste
Potential reserves MSW: 50,000 t/annum (Kampala only)
Under development None known of substantial magnitude
Type of equipment MSW: collection and drying equipment: specialised tractors, trailers; storage
facilities; specialised boilers and furnaces
Justification MSW: electricity and/or gas generation
Organisational set-
up/operator models
Private investments
Planning 3+ year time horizon
Constraints/obstacles Financing availability
Recommendations for
German companies
Look for opportunities in Development Business and local newspapers
Options: electricity generation; other energy-intensive manufacturing or processing
2.2.3 Other Solid Biomass Opportunities (Mainly Household Sector)
The supply of solid biomass use in the household sector is quite substantial. The market for charcoal
in towns and cities is fairly large and commercial firewood is used throughout the country. These
products originate mainly from natural forests and to a limited extent from man-made wood
plantations, and private lands.
Charcoal demand is driven by three factors: (i) urban households have no time to collect firewood or
residues and for convenience reasons they buy charcoal; (ii) urban areas have a growing population
which results in a growing charcoal market; (iii) high cost of alternatives, such as kerosene, LPG and
electricity compared with charcoal resulting in market inertia.
There is a large market for solid fuel in Uganda and much of it is in the hands of private individuals and
village authorities. This creates several opportunities for new business to supply woodfuel to industries
or the household market, or to supply alternative biofuels. Conversion of wood into charcoal is
inefficient and causes many harmful emissions. Although modern stove technologies that double
charcoal fuel efficiency and reduce emissions are used in Europe and Latin America, they are not
widely used in Africa.
There are possibilities for the production of briquettes from residues or other. Briquettes made from
carbonized materials replace charcoal for use in households; briquettes from materials that are not
carbonized replace firewood and are likely for industrial purposes. However, in practice these
possibilities are quite limited as most valuable residues are already used by small-scale industries,
such as coffee husks, rice husks. In urban areas there are limited quantities of charcoal dust available
that could be made into briquettes also.

Target Market Analysis: Uganda’s Bioenergy Market 14
Another option for producing briquettes is the use of fast growing biomass, such as papyrus or water
hyacinth through sustainable harvesting. Papyrus is an interesting option that is available but not used.
(Tests on the conversion of papyrus into charcoal briquettes are expected in Rwanda in the near
future). It has already been demonstrated in Mali with typha, which is a very similar plant to papyrus.
Table 12: Potential Opportunities Solid Biomass – Traditional Fuels
Opportunity 2: Other solid biomass
Potential reserves Briquetting of residues
Modernisation of the charcoal conversion and the whole charcoal supply chain
3rd
generation improved stoves
Under development
Type of equipment
20-50
Justification
Briquetting equipment, carbonizes/kilns
Organisational set-
up/operator models
Commercial sale of fuel; export to Congo
Planning
Private investments or fee for service
Constraints/obstacles
5+ year time horizon
Recommendations for
German companies
Financing availability
Potential reserves
Look for opportunities in Development Business and local newspapers
Consider setting up a CDM project
Finally, there is an opportunity with regards to solid biomass in the commercialization of modern
cooking appliances. The urban and rural population uses improved stoves on a fairly large scale,
however, these are based on traditional stove models that have been in use for 30 years and are not
the most modern appliances. Many households, urban and rural, now have mobile phone access and
are looking for ways to further modernize their lives. Modern cooking stoves fit in this pattern. Bosch-
Siemens, Philips, Envirofit, and BP have recently developed modern, efficient; low-emission stoves for
plant-oil, firewood and kerosene, however, the projects remain at marketing trials. It is not unthinkable
that households would accept buying modern stoves if these became available and affordable. The
potential market size is significant at five million households (firewood stoves) and one million urban
households (charcoal stoves).
Table 13 presents potential market opportunities for more modern energy equipment in the biomass
energy field. The figures in the table are the MEMD targets to improve efficient utilisation of biomass
resources in the country.

Target Market Analysis: Uganda’s Bioenergy Market 15
Table 13: Biomass Technologies Targets and Impacts
2007 2012 2017
Technology Baseline No.
of units
Savings Ton
Biomass
Target No. of
units
Savings Tons
biomass
Target No. of
units
Savings Tons
biomass
Improved
wood stoves
170,000 2,300,000 1,000,000 9,520,000 4,000,000 23,380,000
Improved
charcoal
stoves
30,000 96,000 100,000 320,000 250,000 790,000
Institutional
wood stoves
450 10,800 1,500 36,000 5,000 120,000
Baking
ovens
60 4,860 250 20,000 1,000 81,000
Kilns (lime,
charcoal,
brick)
10 4,500 30 13,500 100 45,000
Biogas 500 1,000 30,000 60,000 100,000 200,000
Total 2,417,160 11,221,000 27,825,000
Source: Renewable Energy Policy, MEMD 2007
Assuming an investment of USD 8 for improved wood stoves, USD 26 for improved charcoal stoves,
USD 1,025 for institutional wood stoves, USD 770 for baking ovens and USD 2,065 for kilns the
annual market value is equivalent to USD 28.5 million with a 70 % market penetration. This calculation
assumes a constant population over the period. Taking into account the current population growth of 3
%, the market will be equivalent to USD 37 million for the technologies considered.
2.2.4 Liquid Biofuels
The government actively supports the development of this sector and some private firms have started
to initiate activities by buying seeds from out-growers and developing plantations, however the
industry is still in its infancy.
It is estimated that in 2010 Uganda will import and consume 360 million liters of diesel and 385 million
liters of gasoline. If this fuel could be blended with environmentally friendly locally produced biofuel,
Methyl alcohol, at proportions of 25 % for gasoline and for 60 % diesel, it would require a total of 312
million liters of Methyl alcohol. If a total of 312 million liters of petroleum products are replaced by
Methyl alcohol, this will replace nearly one million tons of CO2-emission in the country and would make
a commendable impact on the environment.
Various options exist for biodiesel production in Uganda. A considerable amount of oil can be obtained
from various plant products. The advantage of most of these plants (other than Jatropha) is that they
can be used as cooking oil or for other processing. A recent feasibility study in Uganda (MEMD,
Annual Report 2006), found it uneconomical to produce ethanol from molasses due to the high
demand of molasses in the production of local gin, the Uganda Waragi. On the local market a liter of
crude Waragi costs more than UShs 7,000 (USD 3.6), ethanol for petrol blending would fall far below
this whilst petrol prices hover below USD 1 per liter.
The government’s Renewable Energy Policy recommends blending of diesel with 20 % biodiesel and
is intended to create a market and attract investment in biodiesel production. To ensure that this is
integrated with the agriculture system, the government is promoting oil seed production to meet the
need for feedstock for biodiesel and for edible vegetable oil production. The bio-diesel will be used for
the transport sector and farm power production. Blending of all diesel used for transport in Uganda
with 20% biodiesel would translate into a market potential of 100 million liters of biodiesel based on

Target Market Analysis: Uganda’s Bioenergy Market 16
2008 figures, increasing to approximately 200 million liters in 2012 given the annual average increase
in diesel consumption of 17%.
Jatropha has been grown mainly as a support tree in small-holder vanilla farms. In the last two years
there has been interest in Jatropha as a crop for oil seed production. A number of organic processors
in Mukono District have started buying Jatropha seeds from the vanilla growers. The seeds are then
used as raw materials for oil extraction and the oil is either converted into biodiesel first or used
directly in internal combustion engines. For example, the flower growing company Bas Lankveld based
in Mukono District (www.royalvanzanten.com) buys Jatropha seeds from farmers and uses it as a
source of fuel for running their machinery. The company has also established a Jatropha farm of 11 ha
and would like to expand it to 100 ha. Interest in Jatropha production and processing in Uganda is very
high.
The Mukwano group of companies (www.mukwano.com), the largest importer of vegetable oil,
operates the largest sunflower out-grower scheme in the districts of Apac and Lira. Annual production
of sunflowers in these two districts is estimated at more than 10,000 mt contributing more than USD
17 million to the local economy. Mukwano intend to establish a 1000 ha Jatropha plantation and build
a processing facility for biodiesel. Palm oil and sunflower plantations are being established in
Kalangala District. Though earmarked for vegetable cooking oil, the palm establishment is encouraged
among small holders for excess oil for energy production. More farmers are producing sunflower
crops, especially through the efforts of the Uganda Oil Seed Producers and Processors Association
(UOSPA). A hectare currently produces about 1.5 tons, with current processing techniques produces
about 400 liters of oil and about one ton of cake, which is used for poultry and cattle feed. Higher
yields per ha and more oil per kg of sunflower can be achieved with improved pressing technologies
and the use of fertilizers and irrigation. A liter of oil fetches is about UShs 2,000 and cake UShs 200
per kg, barely competitive with petroleum products from the pump.
The government estimates that present sunflower and oil yields are good enough to encourage large-
scale uptake of sunflower production and processing. UOSPA through training farmers’ groups on
agronomy, harvesting and post-harvesting techniques is already achieving higher yields per hectare. It
also gives seeds to the farmers and provides market links to millers. There are presently about 25
millers who process between 2.5 - 20 tons a day with a collective capacity of about 200 tons (50 m3/d).
2.2.5 Advanced Technologies
Modern biomass power generation systems are not very common in Uganda, but are gaining ground
in developed countries on account of its cleanliness, availability sustainability and non-reliance on
fossil fuels. This is mainly through gasification (conversion of biomass material into gaseous fuel and
ash under limited air supply). Gases can be used for combustion engines for electricity production.
Systems are often configured as cogeneration, i. e. simultaneous production of electricity and the use
of exhaust heat (e.g. in production processes). A study sponsored by the National Forest Authority
(SPGS/ Unique forestry consultants; Reducing the Uncertainty for Forest Investors in Uganda, 2006)
indicates that using Eucalyptus grandis and Markhamea lutea plant species on a short rotation of four
to five years, can produce electricity at a cost of US cents 10.5 per KWhel and is comparable to that of
grid electricity (US cents 12.6 per KWhel).
In addition, pyrolysis is a technology that could use low-grade biomass residues (grass, leaves, etc)
and transform into fuel oil equivalent. A sugar mill plant was assessing a test project with Dutch PSOM
funding whereby bagasse would be used to produce a fuel oil that would be used in the mill or sold to
a cement factory. The status of this activity is unknown.

Target Market Analysis: Uganda’s Bioenergy Market 17
Table 14: Potential Opportunities Liquid Biomass
3 Bioenergy-Specific Regulation and Framework
3.1 Policies and Regulations
The government’s commitment to develop the use of renewable energy sources is aimed at creating
means for socio-economic development especially transforming rural areas. In implementing the policy
the government expects to address poverty issues, catalyze industrialisation and protect the
environment.
3.1.1 National Energy Policy (esp. Biofuels)
Uganda’s current National Energy Policy promotes accelerated power generation from renewable
resources and emphasizes the development, adoption and utilisation of modern fuels and
technologies such as biofuels, whereas previously there were no specific incentives for the growing of
energy crops. The provision of incentives for the growing of energy crops is expected to contribute to
re-afforestation and sustainable use of biomass. However, charcoal production and transportation
remain unregulated and the disposal of biomass waste by burning is not restricted.
The government’s Renewable Energy Policy recommends blending of diesel with 20 % biofuel. By
specifying the maximum proportion of biodiesel blends the government hopes that investors will be
attracted to invest in biodiesel production knowing that there is a market for it. As outlined above, to
ensure that the biodiesel is integrated in the agriculture system the government is promoting oil seed
production not only to meet the need for feed stock for biodiesel but also for edible vegetable oil
production. The biodiesel is likely to be used in the transport sector and also in rural electrification and
farm power production. The expected benefits from the policy include:
Opportunity 3: Liquid
Biomass
Under development Private firms have started developing oil production to replace own
petroleum fuel consumption
Type of equipment Oil pressing; refining; esterization
Justification Payback from savings on the consumption of petroleum fuels
Organisational set-
up/operator models
Private investments, CDM
Planning 5+ year time horizon
Constraints/obstacles Financing availability
Recommendations for
German companies
Look for opportunities in development business and local newspapers
Options: CDM or voluntary market

Target Market Analysis: Uganda’s Bioenergy Market 18
Improved national energy security by using indigenous renewable energy sources instead of
imported fossil fuel
Create employment and income in rural areas
Promotion of local renewable natural resources
Reduced emission of carbon dioxide to the atmosphere
Promotion of a new source of income to farmers
Support rural electrification strategy
Promotion of technology transfer
Blending of all diesel used for transport in Uganda with 20 % biodiesel would translate into a
market potential of 100 million liters of biodiesel in 2008 increasing to approximately 200
million liters in 2012 given the annual average increase in diesel consumption of 17 %
(obtained from the rate of fuel imports projections).
The government has stated the need for developing appropriate regulations for grid connections and
support for electricity generated from renewable energy. The policy also states the intention of
facilitating commercially-based development of small-scale renewable energy power generation,
utilising indigenous renewable energy sources such as bagasse, crop residues and mini-hydro by
implementing a standardised transactional framework for contract, pricing and regulation.
3.1.2 Electricity Regulation Authority (ERA)
In the case of rural electricity systems with generation capacity of less than 2 MW or sales of less than
4 GWh per year, the ERA has the power under Section 114 of granting exemptions from licensing.
The projects will still need to register and the absence of a license does not preclude the ERA from
exercising its other regulatory functions. The Electricity Act contains provisions which allow ERA to
delegate its regulatory powers to competent local authorities. However, regulatory responsibilities are
not delegated to any local authority which is active as the sponsor of an electricity project. This is in
order to prevent conflicts of interest arising. Any local authority entering into the role of a project
sponsor must immediately declare its interest and surrender any existing regulatory functions to the
ERA.
Article 56 of the Electricity Act 1999 requires “the system operator, in consultation with the authority, to
publish standardised tariffs based on the avoided cost of the system for sales to the grid of electricity
generated by the renewable energy systems of up to a maximum capacity of 20 MW.”
3.1.3 Forestry Policy
The Forestry Policy (2001) indicates that the government will actively protect, maintain and sustainably
manage the current permanent forest estate. Profitable and productive forest plantation businesses
will be promoted. The private sector will play the major role in developing and managing commercial
forest plantations. This may either be through large-scale industrial plantations on government or
private land, or through small-scale plantations on farms. The role of government will be to support
and regulate this development and create a positive investment climate to encourage private
investment in commercial forest plantations. The government will also set out priority areas for the
development of fuel wood, timber and carbon storage plantations in different areas of Uganda,
concentrating fuel wood priorities in peri-urban areas.
Collaborative partnerships with rural communities will be developed for the sustainable management
of forests. The government will promote innovative approaches to community participation in forest
management on both government and private forest lands. This will address the disincentives

Target Market Analysis: Uganda’s Bioenergy Market 19
associated with a protectionist approach to forest management, and the destructive practices
associated with open access to forest resources. The development of collaborative forest
management will define the rights, roles and responsibilities of partners and the basis for sharing
benefits from improved forest management. There will be a specific focus on wide stakeholder
participation, collective responsibility and equity, and on improving the livelihoods of forest-dependent
communities.
3.2 Applicable Public Sector Support /
Financing Mechanisms and Sources
The level of dependence on external sources to finance energy development in Uganda has been
prevalent, overlooking the need to mobilise local financial resources. A few private sector biomass
energy initiatives have been implemented using locally generated resources however, the success of
these initiatives is limited.
Some biomass energy technologies such as biogas systems, institutional stoves and technologies for
harnessing alternative fuels have high investment costs that discourage end-users. The first biogas
digesters introduced in Uganda were made of concrete and/or bricks that most farmers could not
afford. Currently, integrated rural development initiatives are disseminating a tubular biogas digester
that is cheaper; however, farmers still need financial assistance.
In order to promote the development of biofuels the government intends to provide financial incentives
for the production of biofuels through
i. Subsidies to the farmers of vegetable oil
ii. The removal of taxes on biofuels
iii. Five-year-tax-free importation of machinery and equipment (from licensed
manufacturers, who have a patent)
In order to encourage the use of municipal waste for energy extraction, the government intends to
promote fiscal measures that will discourage open burning or disposal of wastes without extracting
their energy content.

Target Market Analysis: Uganda’s Bioenergy Market 20
3.3 Campaigns and Others
The Renewable Energy Policy outlined the following strategies:
Table 15: Biomass Energy in the Renewable Energy Policy
Policy Objective Strategies
Utilise biomass energy
efficiently so as to contribute
to the management of the
resource in a sustainable
manner
1. Promote, in collaboration with NFA and MAAIF, the growing of energy
crops.
2. Provide incentives for farmers to establish commercial woodlots.
3. Integrate biomass energy production and efficient utilisation and its
impacts on climate and health into the formal education system.
4. License charcoal production and transportation and encourage commercial
production in an efficient and sustainable manner.
5. Promote the production and use of biogas at both household levels and
large/industrial scale. Scale up household biogas units to 100,000 by
2017.
6. Scale up the adoption of efficient charcoal fuel stoves from 20,000
currently to 2,500,000 households by 2017.
7. Increase the adoption of efficient fuel wood stoves from 170,000 currently
to 4million by 2017.
8. Promote interfuel/intertechnology substitution in households, commercial
buildings and industry.
9. Promote efficiency in intensive wood burning industries.
10. Promote biomass fired cogeneration in industries and institutions.
11. Offer training opportunities for “Jua Kali” artisans for manufacture,
installation and maintenance of efficient cook stoves.
12. License encroached national forest reserves to investors.
Promote the sustainable
production and utilisation of
biofuels
1. Develop appropriate legislation for the use of biofuels.
2. Adopt appropriate international standards for the manufacture and
blending of biofuels with petroleum fuels.
3. License companies to blend up to 20 % biofuels into gasoline and diesel.
4. Provide financial incentives for the production of biofuels.
5. Set up a biofuels standard testing facility at the UNBS for testing and
monitoring purposes.
6. Monitor the standards of biofuels producers.
7. Sensitise the public and stakeholders on the use of the biofuels.
8. Facilitate research on biofuels.
Promote the conversion of
municipal and industrial
waste to energy
1. Provide incentives for the conversion of wastes to energy.
2. Put in place fiscal measures that will discourage open burning or disposal
of wastes without extracting their energy content.

Target Market Analysis: Uganda’s Bioenergy Market 21
4 Business Partners and Competitors in the Bioenergy
Sector
4.1 Overview of Bioenergy Market Players
The GTZ’s Promotion of Renewable Energy and Energy Efficiency Programme (PREEEP) has been in
operation for several years, jointly implemented with the MEMD. It is focused on improved cooking
stove promotion and dissemination plus addressing non-biomass energy. GTZ has implemented
NGO-led training of artisans in several districts including Bushenyi and Rakai.
The most successful stove models today are the stationary, clay improved cooking stoves (the Rocket
Lorena) and the portable improved stove (shielded). The dissemination of the improved Rocket Lorena
stoves has followed a “pyramid” system strategy that starts with a few coordinators and ends with
hundreds of stove builders at the village level. NGOs train sub-county coordinators who select artisans
to train at the parish and village levels.
The project strategy is to build the capacity of an NGO in a chosen district to technically and
administratively manage the program. The NGO appoints a number of district coordinators for the
scaling up dissemination process. Since the district is divided into sub-counties, parishes and villages,
the NGO builds the capacity of sub-county stove coordinators. Selected potential stove builders from
every village are trained at parish level by visiting trainers. Every parish is given a proven artisan to
train the stove builders. The parish coordinator also ensures that the stove builders are organised into
operational groups that can disseminate stoves. The sub-county coordinator is responsible for the
selection of trainees and organising the training in every parish in the sub-county. This strategy has
been successful used to disseminate over 175,000 Rocket Lorena stoves in Bushenyi and Rakai
districts in Uganda since 2005.
GTZ estimates that PREEEP with its partners have reached over 200,000 households with improved
stoves within two years, saving over 200,000 tons of wood are per year.

Target Market Analysis: Uganda’s Bioenergy Market 22
Table 16: Selected Bioenergy Market Players in Uganda
Full Name Core Business and Market
Position
Products Location Further remarks Contact details
Consultants Biogas Consultant
Engineering Workshop
Established in 1985. Focus on
biogas feasibility studies,
surveys, system layouts, bio-
digester construction and
installation, fabrication and
modification of biogas appliances
and consultancy
Products available include fixed
dome biogas digesters, biogas
appliances. Services
Kampala Company has
collaborations with
CARMATEC –
Tanzania, NARO,
Makerere University
Christopher Kato
Namalere, Kawanda Trading
Centre
8 miles off Kampala,
Bombo Rd
P.O. Box: 7144,
Kampala, Uganda
Mob: +256 (0) 772 495000
Email:
Energy Saving Stove
Builders Co. Ltd
Focus in energy efficient biomass
usage for domestic, commercial
and institutional purposes in the
Western areas of Uganda –
Mbarara, Bushenyi, Kanugu,
Kabale and Kasese
Design and production of
stainless cooking systems,
institutional stoves, biomass
baking ovens
Mbarara Ibrahim Barugahare
Old taxi park- Mbarara
P.O. Box 707,
Mbarara 70964,
Kampala, Uganda
Tel (+256) (0) 77442557
Retailers Institutional & Commercial
Cooking Systems
Fabrication, design and
production of stainless steel
based energy saving equipment
for domestic, commercial,
institutional and factory use.
Company is also involved in
biomass consultancy and
apprentice training. Only
operates within Kampala but
sells over the country
Domestic improved charcoal
stoves, baking ovens
Kampala Arthur Mugyenzi
Bagala, Seeta Industrial Area,
Namilyango Rd
P.O. Box 994,
Kampala, Uganda
Tel: +256 (0) 414 285679
Mob: +256 (0) 772 489299
Email: [email protected]

Target Market Analysis: Uganda’s Bioenergy Market 23
Uganda Stove
Manufacturers Limited
(UGASTOVE)
Firewood/charcoal saving stove,
rocket stove for households and
institutions, training of artisans,
research and awareness raising
Firewood/charcoal saving stove,
rocket stove for households and
institutions
Kayemba
Rd,
Kampala
USD 350,000,
more than 50
employees
Mohamed Kawere
Nkere Zone, Kayemba Rd,
Kibuye
P.O.Box 1265,
Kampala, Uganda
Tel: (+256) (0) 752640073
Contractors
Prime Equipment and
Contractors Ltd
Charcoal/firewood energy saving
stoves, wood fuel boilers, baking
ovens, incinerators and
construction services
Joseph. I. Semaganda
Mutungo - Biina, off Port bell
Rd
P.O. Box 971,
Kampala, Uganda
Tel: +256 (0) 312 283479
Mob: +256 (0) 772/753 403785
Email: [email protected]
Uganda Oil Seed
Producers and
Processors Association
(UOSPA)
Oil seeds Northern
Uganda
Plot 47/49 Nkrumah Road
UCA Building- 1st Floor
P.O Box 26357
Kampala Uganda
Tel:(+ 256) (0) 41 342504
Fax: (+256) (0) 41 342504
Email:
Bas Lankveld
Flower grower Flowers, oil seeds Mukono
district
www.royalvanzanten.com
Urban Community
Development Association
(UCODEA)
A community based organisation
focused on the promotion of
biomass energy efficient
appliances for both domestic and
institutional use
Biomass products – households
(sigiri), ovens and institutional
stoves. Also carries out
research, consultancy and
training in alternative energy
sources in the biomass sub-
sector
Plot 574, Kayemba Road,
Nkere Zone
Kibuye Parish, Makindye
Division, PO Box 15191
Kampala, Uganda
Tel: (+256) (0) 41 578 251
Others Joint Energy &
Environment Project
(JEEP)
Environmental NGO started in
1983
Institutional stoves, promote use
of domestic stoves,
consultancy, training in stove
construction and solar energy
applications
Kampala,
Kyanja,
Gayaza
Road
Plot 243, Gayaza Road
Kyanja, Kampala
7 miles/11 kilometers north of
P.O. Box 4264
Kampala Central, Uganda
Tel (+256) (0) 414568300,
772468662
Email:

Target Market Analysis: Uganda’s Bioenergy Market 24
Youth Association for
Rural Development
(YARD)
Dissemination of energy saving
stoves and wood lot planting
Ngongwe
Subcounty,
Mukono
District
Lunaana Luke
Ngogwe sub county, Mukono
District
P.O. Box: 109,Lugazi
Uganda
Tel:(+256) (0) 773116664
Email :
Political
pressure
groups,
NGOs, etc.
Yumbe District Farmers
Association (YDFA)
Capacity building in use of
improved stoves and promotion
of tree planting
Yumbe Edon Brahan Nasur
Yumbe Town Council next to
Local government
Administration Offices
BOX 55, Yumbe
Tel : (+256) (0) 782541579
Email: [email protected]
Uganda Orphans Rural
Development Programme
(UORDP)
Dissemination of rocket Lorena
stoves to communities
Tororo J. Apollo
Wills Rd, Namirembe, Kampala
&
Plot 3, Busia Rd, Tororo
P.O. Box: 29156,
Kampala & 853 Tororo
Tel: (+256) (0) 392822223
Mob: (+256 )(0) 752 621842
Email:
JEEP
This page is best viewed at 1024 x 768 resolution. Copyright © 2008 JEEP

Target Market Analysis: Uganda’s Bioenergy Market 25
Table 17: Key Actors and their Roles
Key actor Role in sector Contact details
Government The Ministry of
Energy and Mineral
Development (Energy
Department, New and
Renewable Energy
Sources Division)
MEMD is the lead agency in the
energy sector. It is responsible
for policy formulation, promotion,
coordination, monitoring and
evaluation. MEMD is also
responsible for initiating
legislation in the energy sector.
Eng. Paul Mubiru
P.O.Box 7270,
Kampala.Uganda
Tel: (+256) (0) 41-4349010
Fax: (+256) (0)41-4349342
E-mail: [email protected]
Internet: http://www.energyandminerals.go.
ug/dept_energy.php
The Ministry of Water,
Lands and
Environment
Major actor providing requisite
information on biomass
distribution and balances in
different parts of the country.
Plot 21/28 Port Bell Road, Luzira
P.O. Box 20026 Kampala
Uganda
Tel: (+256) (0) 414 505942
Email: [email protected]
www.mwe.go.ug
National Bureau of
Statistics and the
Ministry of
Agriculture, Animal
Industry and
Fisheries
Provide information on energy
demand and supply; and,
production and stocking rates in
relation to use of agricultural
waste for energy production
respectively.
Uganda Bureau of Statistics
Plot 9, Colville Street
P.O. Box 7186
Kampala, Uganda
Tel: (+256) (0) 414 706000
Fax: (+256) (0) 414 237553
Email: [email protected]
Internet: www.ubos.org
Ministry of Agriculture, Animal
Industry and Fisheries
P.O.Box 102, Entebbe – Uganda
Tel: (+256) (0) 41 32084, 320981
Internet: www.agriculture.go.ug/
The National
Environment
Management
Authority
The principal environmental
monitoring agency in Uganda in
charge of strategic and project
based impact assessments.
Involved in licensing of projects
that may have an impact on the
environment. Awards
environmental clearances,
following review and approval of
environmental audits,
environmental impact
assessment (EIA) statements
and resettlement action plans
(RAP).
Nema House,
Plot 17/19/21 Jinja Rd,
P. O. Box 22255
Kampala,Uganda
Tel: (+256) (0) 414 251064/65/68
Fax: (+256) (0) 414 257521
Email: [email protected]
Internet: http://www.nemaug.org
The National
Agricultural Research
Organization (mainly
Agricultural
Engineering,
Appropriate
Technology Research
Institute and Forestry
Resources Research
Institute) and
Makerere University
Both play an important role in
research addressing technology
development and research
issues.
NARO Council Secretariat
Plot 3, Lugard Avenue, Entebbe
Council Sectretariat: P.O.Box 295,
Agricultural Engineering:P.O. Box:
7144
National Forestry Resources
Research Institute: P.O.Box 1752
Entebbe, Uganda
Tel:(+ 256) (0)41 320512, 41
320341/2; 41- 320178
Fax: (+256) (0) 41 321070
Email: [email protected]
Internet: www.naro.go.ug
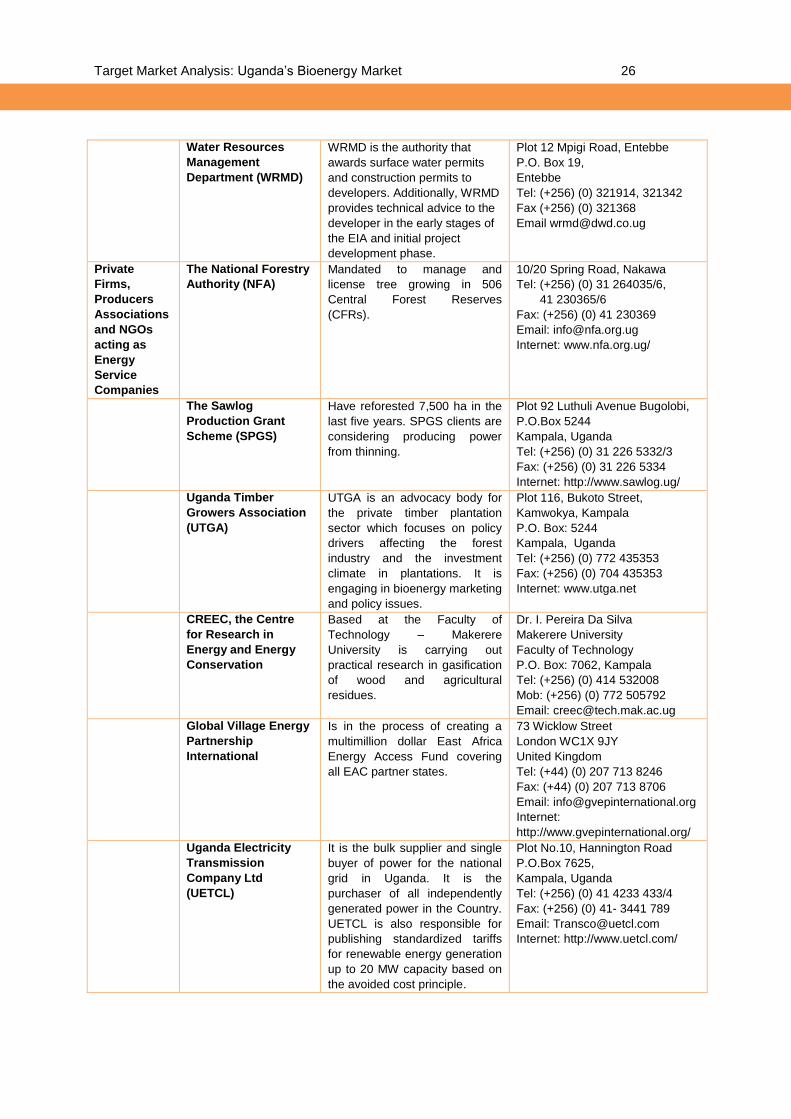
Target Market Analysis: Uganda’s Bioenergy Market 26
Water Resources
Management
Department (WRMD)
WRMD is the authority that
awards surface water permits
and construction permits to
developers. Additionally, WRMD
provides technical advice to the
developer in the early stages of
the EIA and initial project
development phase.
Plot 12 Mpigi Road, Entebbe
P.O. Box 19,
Entebbe
Tel: (+256) (0) 321914, 321342
Fax (+256) (0) 321368
Email [email protected]
Private
Firms,
Producers
Associations
and NGOs
acting as
Energy
Service
Companies
The National Forestry
Authority (NFA)
Mandated to manage and
license tree growing in 506
Central Forest Reserves
(CFRs).
10/20 Spring Road, Nakawa
Tel: (+256) (0) 31 264035/6,
41 230365/6
Fax: (+256) (0) 41 230369
Email: [email protected]
Internet: www.nfa.org.ug/
The Sawlog
Production Grant
Scheme (SPGS)
Have reforested 7,500 ha in the
last five years. SPGS clients are
considering producing power
from thinning.
Plot 92 Luthuli Avenue Bugolobi,
P.O.Box 5244
Kampala, Uganda
Tel: (+256) (0) 31 226 5332/3
Fax: (+256) (0) 31 226 5334
Internet: http://www.sawlog.ug/
Uganda Timber
Growers Association
(UTGA)
UTGA is an advocacy body for
the private timber plantation
sector which focuses on policy
drivers affecting the forest
industry and the investment
climate in plantations. It is
engaging in bioenergy marketing
and policy issues.
Plot 116, Bukoto Street,
Kamwokya, Kampala
P.O. Box: 5244
Kampala, Uganda
Tel: (+256) (0) 772 435353
Fax: (+256) (0) 704 435353
Internet: www.utga.net
CREEC, the Centre
for Research in
Energy and Energy
Conservation
Based at the Faculty of
Technology – Makerere
University is carrying out
practical research in gasification
of wood and agricultural
residues.
Dr. I. Pereira Da Silva
Makerere University
Faculty of Technology
P.O. Box: 7062, Kampala
Tel: (+256) (0) 414 532008
Mob: (+256) (0) 772 505792
Email: [email protected]
Global Village Energy
Partnership
International
Is in the process of creating a
multimillion dollar East Africa
Energy Access Fund covering
all EAC partner states.
73 Wicklow Street
London WC1X 9JY
United Kingdom
Tel: (+44) (0) 207 713 8246
Fax: (+44) (0) 207 713 8706
Email: [email protected]
Internet:
http://www.gvepinternational.org/
Uganda Electricity
Transmission
Company Ltd
(UETCL)
It is the bulk supplier and single
buyer of power for the national
grid in Uganda. It is the
purchaser of all independently
generated power in the Country.
UETCL is also responsible for
publishing standardized tariffs
for renewable energy generation
up to 20 MW capacity based on
the avoided cost principle.
Plot No.10, Hannington Road
P.O.Box 7625,
Kampala, Uganda
Tel: (+256) (0) 41 4233 433/4
Fax: (+256) (0) 41- 3441 789
Email: [email protected]
Internet: http://www.uetcl.com/

Target Market Analysis: Uganda’s Bioenergy Market 27
Rural Electrification
Agency (REA)
REA responsible for developing
and promoting rural
electrification and rural
electrification projects. Rural
Electrification Board (REB), as
the governing body for REA,
controls subsidies for rural
electrification and renewable
energy projects, and therefore
decides on priorities and
allocation of funds.
Plot 1 Pilkington Road
10th Floor, Worker’s House
P.O Box 7317,
Kampala, Uganda
Tel: (+256) (0)312
264095/264103/4/5
Fax: (+256) (0) 414 346013
Email: [email protected]
Internet: http://www.rea.or.ug/
4.2 Overview Major and/or Most Emblematic Bioenergy Projects
Table 18: Most Important Bioenergy Projects
Location Installed capacity Success factors
Kinyara Sugar Works 7.5 MW Use bagasse for cogeneration
Sugar Corporation of
Uganda Ltd (SCOUL)
3.5 MW Use bagasse for cogeneration
Bas Lankveld, Mukwano
Industries
N/A Private interest in oil seeds, buying oil seeds for
pressing and own energy use of for sale

Target Market Analysis: Uganda’s Bioenergy Market 28
4.3 Highlights in Local Bioenergy Market Developments
The British energy firm, Aldwych International, intends to construct and install a biomass power
plant of 50 MW in Uganda. The company is backed by the Dutch development finance institution
and Shell. It has filed a proposal with the Ugandan Electricity Regulatory Authority (ERA) for the
project estimated to cost about USD160 million. It is expected that the plant be commissioned in
2010 and has a life-span of 20 years.
A local company, Africa Power Initiative (API), is in the advanced stages of producing 60,000 liters
of oil a day from locally grown Jatropha and other oil seeds in Uganda's North-Eastern region of
Karamoja. The project integrates the local community and is a partnership with American and local
investors. The farm employs over 500 people on 2,000 acres of land.
In 2002, Kakira Sugar Works Ltd was licensed to generate about 6 MW from baggase for its
internal use. In July 2003, the company completed a power purchase agreement with the Uganda
Electricity Transmission Company (UECTL) to sell electricity to the grid. With the planned increase
in cane production, the company plans to expand the cogeneration facility to generate 14 MW.
The local company Liquefier Uganda Limited became operational in Uganda in 2007 introducing
synthetic oil to burn in especially designed lamps (Liquilamp). The company currently imports the
biofuels (synthetic oil and gel) from their South African-based parent company Liquefier Pty
Limited. The Liquilamp, which takes half a liter of synthetic oil, sells at UShs 26,000 (USD 13.3)
giving 60 hours of burning or lighting. The synthetic oil has been mixed with a chemical called
citronella, a mosquito repellant, as an advantage due to prevalent malaria problem. Other
products are gels that come with specially designed stoves, made of mild steel. A liter of gel,
which burns in the stove, sells at UShs 3,600. A five-liter gel pack burns for a period of three to
four weeks for light cooking. The gel product leaves minimal residue after use and produces
double the energy compared to gas and paraffin. The company is planning to start local
production in the near future.
In 2008, the US Trade and Development Agency and the MEMD signed a USD 572,000 (UShs
972.4 million) grant to develop the potential for a biofuel market. The grant was to provide cost-
benefit analysis on potential biofuel resources and technologies, as well as recommend
appropriate industry regulations and potential incentives for the development of safe and
responsible biofuel production.

Target Market Analysis: Uganda’s Bioenergy Market 29
Annex 1: Biomass Stratification
The Forestry Department divides biomass cover into 13 stratifications at the national level and down
to the regional and district levels. The key stratifications are:
i. Hardwood Plantations: mainly eucalyptus indigenous species e.g. Maesopsis eminii.
Eucalyptus species are planted for the production of transmission poles, building construction
timbers and fuel wood for both domestic energy as well as for agricultural uses such as
tobacco curing or tea production.
ii. Softwood Plantations: comprises pines and cypress mainly for timber supply but also to
reduce pressure on natural forests. They provide little in terms of fuel wood. One third of the
coniferous plantations are Cupressus spp. and the remainder is Pinus spp.
iii. Tropical High Forest (stocked): without human interference that is normally protected as they
occur mainly in forest reserves and national parks.
iv. Tropical High Forest (depleted): degraded by human influence, mainly in the non-gazetted
areas and on private land.
v. Woodlands: open stands of trees, single storied. Woodlands are characterised by trees above
5 m with a canopy cover of over 40% and a ground layer dominated by grasses.
vi. Bushlands: a crown covers below 40 % with trees below 5 m in height. They mainly consist of
small shrubs occurring in open stands.
vii. Grasslands: dominated by grasslands and scattered, short and small-diameter trees.
viii. Wetlands: permanently covered by wetland grass e.g. papyrus or seasonal varieties.
ix. Subsistence farmland areas with settlements: include areas where agro forestry is practiced.
x. Commercial Farmlands: large-scale farms e.g. sugarcane and tea plantations.
xi. Built-up areas: include urban and trading centers, etc.
xii. Water bodies: include lakes, ponds and rivers
xiii. Impediment areas: include rock outcrops and bare lands.

Target Market Analysis: Uganda’s Bioenergy Market 30
References
Alternative Energy Sources Assessment Report, 2004
Annual Report Ministry of Energy and Mineral Development, 2001
Annual Report Ministry of Energy and Mineral Development, 2003
Annual Report Ministry of Energy and Mineral Development, 2006
Annual Report Ministry of Energy and Mineral Development, 2009
Kampala City Council Strategy to improve Solid Waste Management in Kampala City Council,
Kampala City Council, Kampala Uganda;
National Biomass Assessment Study 2003
Renewable Energy Policy for Uganda., MEMD 2007
Report on the Renewable Energy Resource Information Development and Capacity Building
Assessment In Uganda, KAMFOR Report, 2006
The Sawlog Production Grant Scheme (SPGS) / Unique forestry Consultants, Reducing the
Uncertainty for Forest Investors in Uganda, 2006

This publication is available free of charge as part of the public relations work of the Federal
Ministry of Economics and Technology, and may not be sold. It may not be used by political parties
or campaigners or electoral assistants during an election for the purposes of campaigning. In
particular, it is forbidden to distribute this publication at campaign events or at information stands
run by political parties or to insert, overprint, or affix partisan information or advertising. It is also
forbidden to pass it on to third parties for the purposes of electoral campaigning. lrrespective of
when, in what way, and in what quantity this publication reached the recipient, it may not be used
even when an election is not approaching in a way that might be understood as suggesting a bias
in the federal government in favour of individual political groupings.


