Page 1
Torsional Behavior of Reinforced Concrete
Beams Predicted by a Compatibility-Aided Truss
Model
Seung Hoon Lee1, Seok-Kwang Yoon
2, Sung Hyun Yoon
1, Yoon Ki Hong
3, and Jung-Yoon Lee
4
1Department of Civil, Architectural and Environmental System Engineering, Sungkyunkwan University, Suwon,
Republic of Korea 2Dohwa Engineering Co., Ltd., Seoul, Republic of Korea
3Department of Global Construction Engineering, Sungkyunkwan University, Suwon, Republic of Korea 4School of Civil and Architectural Engineering, Sungkyunkwan University, Suwon, Republic of Korea
Email: { esh0125, y6639, hyg623} @naver.com, [email protected] , [email protected]
Abstract—To avoid brittle torsional failure due to web
concrete crushing before yielding of torsional reinforcement
on reinforced concrete members, the ACI 318-14 design
code and the Eurocode 2 limit the yield strength of torsional
reinforcement up to 420 MPa and 600 MPa, respectively. In
this study, six beams having different compressive strength
of concrete and yield strength of torsional reinforcement
were tested. The observed test results were compared with
the torsional behavior predicted by a compatibility-aided
truss model. Experimental and analytical results showed
that torsional strength of reinforced concrete beams did not
increase as the yield strength of torsional reinforcement
increased. The beams with high strength torsional
reinforcement failed due to concrete crushing before
yielding of reinforcement. Test results also indicated that
the limitation on the yield strength of torsional
reinforcement in the ACI 318-14 design code was
appropriate but not in the Eurocode 2.
Index Terms—compatibility-aided truss model, failure mode,
high-strength reinforcement, reinforced concrete beams,
torsional strength
I. INTRODUCTION
The ACI 318-14 design code [1] and the Eurocode 2 [2]
limit the yield strength of shear and torsional
reinforcement on reinforced concrete (RC) members up
to 420 MPa and 600 MPa, respectively. The reasons why
the design codes limit the yield strength of shear and
torsional reinforcement are as follows.
The first reason is to avoid compression failure of
concrete struts. It is because the failure by compression of
concrete struts before yielding of shear and torsional
reinforcement is brittle. And the second reason is to limit
diagonal crack width. When using high-strength
reinforcement, spacing of reinforcement is wider at the
same level of design shear or torsional strength. Thus the
number of diagonal cracks decreases and width of a
Manuscript received December 4, 2015; revised May 4, 2016.
diagonal cracks increases when using high-strength
reinforcement. In this study, six reinforced concrete beams with high
strength materials were tested to investigate the torsional
behavior of RC beams. The observed test results were
compared with the torsional behavior predicted by a
compatibility-aided truss model (CATM). In addition,
some simulations are conducted to figure out the torsional
behavior of RC beams with high strength materials.
II. TEST PROGRAM
The torsional strength equation in the design codes
were derived based on the thin-walled tube analogy and
the space truss model. The design codes determine the
torsional strength at the yield strength of the longitudinal
and transverse reinforcement (fyl and fyt) [3]. In the ACI
318-14 design code, the torsional strength is less value of
the torsional strength of longitudinal reinforcement and
that of transverse reinforcement. In the ACI 318-14
design code, the torsional strength is estimated by (1) and
the angle of the concrete struts α is recommended to use
45° or can be calculated by (2).
2 2min cot , cot
o t yt o l yl
n
h
A A f A A fT
s p
(1)
2cotl yl
t yt
f
f
(2)
where Ao: gross area enclosed by shear flow path; At:
cross-sectional area of one transverse reinforcement; Al:
total cross-sectional area of longitudinal reinforcement; s:
spacing of stirrups in the direction parallel to the
longitudinal axis of member; ph: perimeter of centerline
of outermost closed transverse torsional reinforcement;
and α: inclination between the direction of principal
compressive stress of concrete and the longitudinal
direction.
And the ACI 318-14 design code limits shear and
torsional strength to avoid compression failure of
concrete struts before yielding of torsional reinforcement
by empirical and experimental equation (3).
265© 2016 Int. J. Struct. Civ. Eng. Res.
International Journal of Structural and Civil Engineering Research Vol. 5, No. 4, November 2016
doi: 10.18178/ijscer.5.4.265-272
Page 2
22
2
2
31.7
cu u h c
w woh
fV T p V
b d b dA
(3)
where Vu: factored shear force at section; bw: web width ;
d: effective depth; Tu: factored torsional moment at
section; Aoh: area enclosed by centerline of the outermost
closed transverse torsional reinforcement; Vc: nominal
shear strength provided by concrete; fc': specified
compressive strength of concrete.
By (3), the boundary value of torsional strengths of
concrete struts and torsional reinforcement Tcs can be
calculated as (4).
21.75
6
oh
cs c
h
AT f
p
(4)
With above equation (4), the failure mode of torsional
members can be determined. If the torsional strength of
concrete struts is larger than that of reinforcement, the
failure mode can be determined as under-reinforced
failure. And the opposite case’s failure mode can be
determined as over-reinforced failure.
A. Testing Plan
Table I shows the details of the test specimens. The
experimental program consisted of 6 specimens. The
main variables of specimens were the compressive
strength of concrete, and the yield strength of
reinforcement. Two different compressive strengths of
concrete were used (42 MPa and 70 MPa). And three
different yield strengths of reinforcement were used
(about 300 MPa, 400 MPa, and 600 MPa) [4].
The test specimens had same longitudinal and
transverse reinforcement ratio (ρl=0.009979 and
ρt=0.010582). And two different compressive strength of
concrete and three yield strengths of reinforcement were
used. Thus torsional strengths of the specimens calculated
by (1) are different according to the yield strength of
reinforcement.
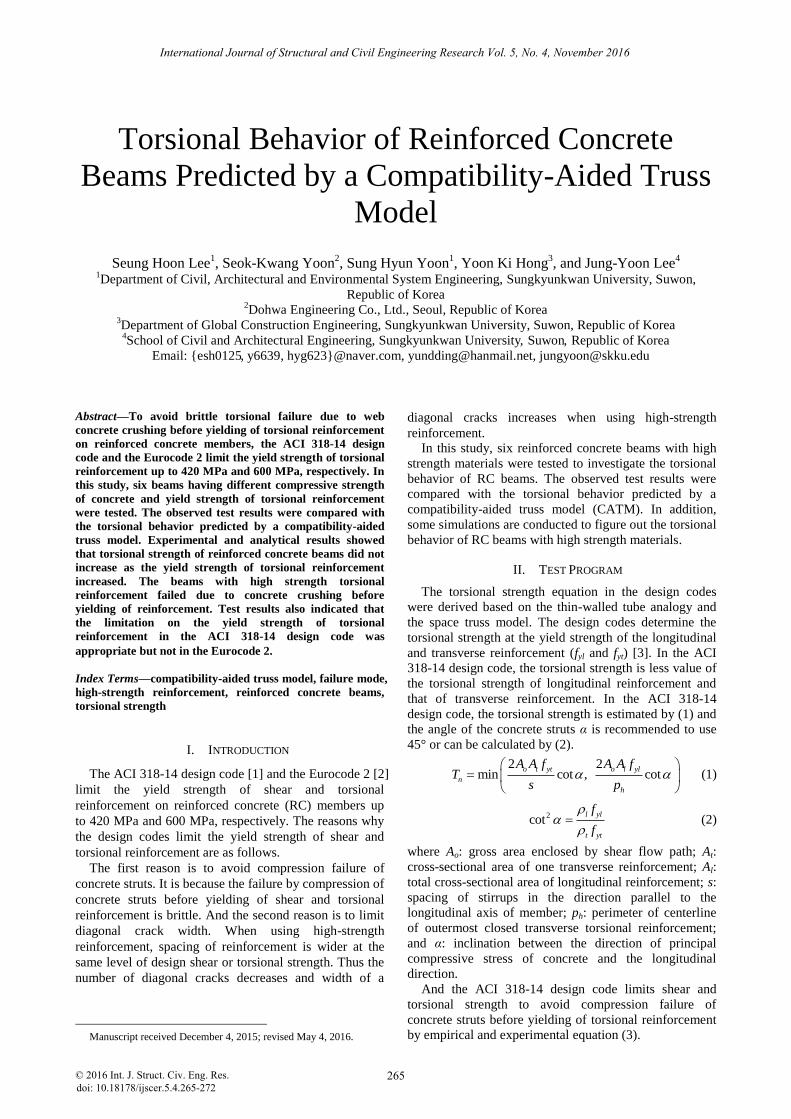
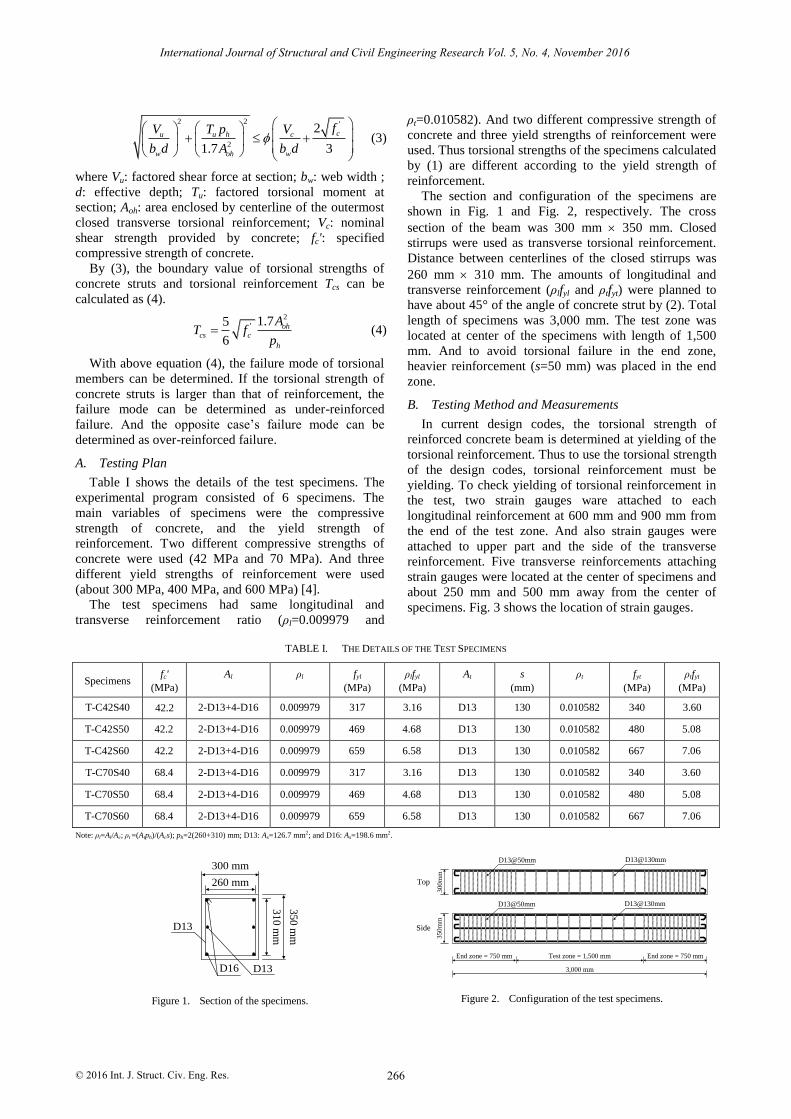
The section and configuration of the specimens are
shown in Fig. 1 and Fig. 2, respectively. The cross
section of the beam was 300 mm 350 mm. Closed
stirrups were used as transverse torsional reinforcement.
Distance between centerlines of the closed stirrups was
260 mm 310 mm. The amounts of longitudinal and
transverse reinforcement (ρlfyl and ρtfyt) were planned to
have about 45° of the angle of concrete strut by (2). Total
length of specimens was 3,000 mm. The test zone was
located at center of the specimens with length of 1,500
mm. And to avoid torsional failure in the end zone,
heavier reinforcement (s=50 mm) was placed in the end
zone.
B. Testing Method and Measurements
In current design codes, the torsional strength of
reinforced concrete beam is determined at yielding of the
torsional reinforcement. Thus to use the torsional strength
of the design codes, torsional reinforcement must be
yielding. To check yielding of torsional reinforcement in
the test, two strain gauges ware attached to each
longitudinal reinforcement at 600 mm and 900 mm from
the end of the test zone. And also strain gauges were
attached to upper part and the side of the transverse
reinforcement. Five transverse reinforcements attaching
strain gauges were located at the center of specimens and
about 250 mm and 500 mm away from the center of
specimens. Fig. 3 shows the location of strain gauges.
TABLE I. THE DETAILS OF THE TEST SPECIMENS
Specimens fc'
(MPa)
Al
ρl
fyl
(MPa)
ρlfyl
(MPa)
At
s
(mm)
ρt
fyt
(MPa)
ρtfyt
(MPa)
T-C42S40 42.2 2-D13+4-D16 0.009979 317 3.16 D13 130 0.010582 340 3.60
T-C42S50 42.2 2-D13+4-D16 0.009979 469 4.68 D13 130 0.010582 480 5.08
T-C42S60 42.2 2-D13+4-D16 0.009979 659 6.58 D13 130 0.010582 667 7.06
T-C70S40 68.4 2-D13+4-D16 0.009979 317 3.16 D13 130 0.010582 340 3.60
T-C70S50 68.4 2-D13+4-D16 0.009979 469 4.68 D13 130 0.010582 480 5.08
T-C70S60 68.4 2-D13+4-D16 0.009979 659 6.58 D13 130 0.010582 667 7.06
Note: ρl=Al/Ac; ρt =(Atph)/(Acs); ph=2(260+310) mm; D13: As=126.7 mm2; and D16: As=198.6 mm2.
300 mm
260 mm
31
0 m
m
35
0 m
m
D16
D13
D13
Figure 1. Section of the specimens.
End zone = 750 mm End zone = 750 mmTest zone = 1,500 mm
35
0m
m3
00
mm
Top
3,000 mm
Side
D13@50mm D13@130mm
D13@50mm D13@130mm
Figure 2. Configuration of the test specimens.
266© 2016 Int. J. Struct. Civ. Eng. Res.
International Journal of Structural and Civil Engineering Research Vol. 5, No. 4, November 2016
Page 3
End zone = 750 mm End zone = 750 mmTest zone = 1,500 mm
350m
m300m
m
Top
3,000 mm
Side
Figure 3. Location of strain gauges.
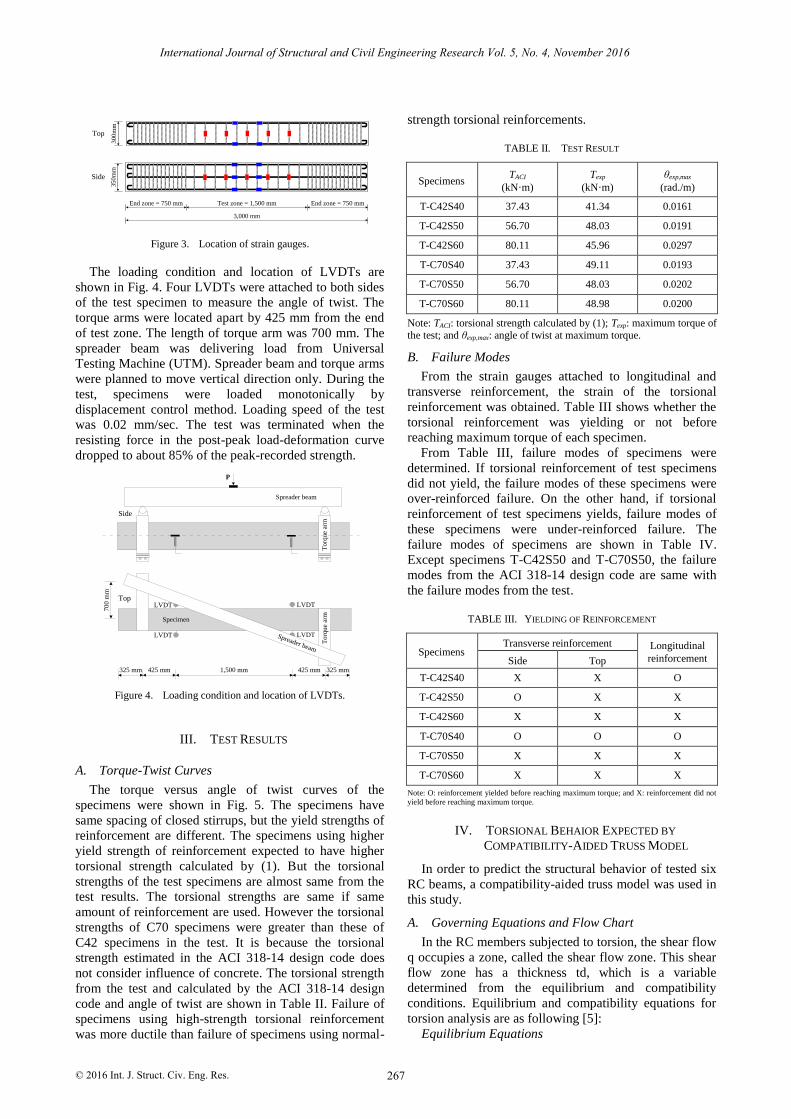
The loading condition and location of LVDTs are
shown in Fig. 4. Four LVDTs were attached to both sides
of the test specimen to measure the angle of twist. The
torque arms were located apart by 425 mm from the end
of test zone. The length of torque arm was 700 mm. The
spreader beam was delivering load from Universal
Testing Machine (UTM). Spreader beam and torque arms
were planned to move vertical direction only. During the
test, specimens were loaded monotonically by
displacement control method. Loading speed of the test
was 0.02 mm/sec. The test was terminated when the
resisting force in the post-peak load-deformation curve
dropped to about 85% of the peak-recorded strength.
P
Spreader beam
To
rqu
e ar
mT
orq
ue
arm
LVDT LVDT
LVDTLVDT
Specimen
70
0 m
m
1,500 mm 425 mm 325 mm425 mm325 mm
Side
Top
Spreader beam
Figure 4. Loading condition and location of LVDTs.
III. TEST RESULTS
A. Torque-Twist Curves
The torque versus angle of twist curves of the
specimens were shown in Fig. 5. The specimens have
same spacing of closed stirrups, but the yield strengths of
reinforcement are different. The specimens using higher
yield strength of reinforcement expected to have higher
torsional strength calculated by (1). But the torsional
strengths of the test specimens are almost same from the
test results. The torsional strengths are same if same
amount of reinforcement are used. However the torsional
strengths of C70 specimens were greater than these of
C42 specimens in the test. It is because the torsional
strength estimated in the ACI 318-14 design code does
not consider influence of concrete. The torsional strength
from the test and calculated by the ACI 318-14 design
code and angle of twist are shown in Table II. Failure of
specimens using high-strength torsional reinforcement
was more ductile than failure of specimens using normal-
strength torsional reinforcements.
TABLE II. TEST RESULT
Specimens TACI
(kN·m)
Texp
(kN·m)
θexp,max
(rad./m)
T-C42S40 37.43 41.34 0.0161
T-C42S50 56.70 48.03 0.0191
T-C42S60 80.11 45.96 0.0297
T-C70S40 37.43 49.11 0.0193
T-C70S50 56.70 48.03 0.0202
T-C70S60 80.11 48.98 0.0200
Note: TACI: torsional strength calculated by (1); Texp: maximum torque of
the test; and θexp,max: angle of twist at maximum torque.
B. Failure Modes
From the strain gauges attached to longitudinal and
transverse reinforcement, the strain of the torsional
reinforcement was obtained. Table III shows whether the
torsional reinforcement was yielding or not before
reaching maximum torque of each specimen.
From Table III, failure modes of specimens were
determined. If torsional reinforcement of test specimens
did not yield, the failure modes of these specimens were
over-reinforced failure. On the other hand, if torsional
reinforcement of test specimens yields, failure modes of
these specimens were under-reinforced failure. The
failure modes of specimens are shown in Table IV.
Except specimens T-C42S50 and T-C70S50, the failure
modes from the ACI 318-14 design code are same with
the failure modes from the test.
TABLE III. YIELDING OF REINFORCEMENT
Specimens Transverse reinforcement Longitudinal
reinforcement Side Top
T-C42S40 X X O
T-C42S50 O X X
T-C42S60 X X X
T-C70S40 O O O
T-C70S50 X X X
T-C70S60 X X X
Note: O: reinforcement yielded before reaching maximum torque; and X: reinforcement did not
yield before reaching maximum torque.
IV. TORSIONAL BEHAIOR EXPECTED BY
COMPATIBILITY-AIDED TRUSS MODEL
In order to predict the structural behavior of tested six
RC beams, a compatibility-aided truss model was used in
this study.
A. Governing Equations and Flow Chart
In the RC members subjected to torsion, the shear flow
q occupies a zone, called the shear flow zone. This shear
flow zone has a thickness td, which is a variable
determined from the equilibrium and compatibility
conditions. Equilibrium and compatibility equations for
torsion analysis are as following [5]:
Equilibrium Equations
267© 2016 Int. J. Struct. Civ. Eng. Res.
International Journal of Structural and Civil Engineering Research Vol. 5, No. 4, November 2016
Page 4
2 2cos sinl d r l lf (5)
2 2sin cost d r t tf (6)
sin coslt d r (7)
0(2 )lt dT A t (8)
(a) C42 specimens
(b) C70 specimens
Figure 5. Torque-twist curves of the specimens.
TABLE IV. FAILURE MODE OF THE SPECIMENS
Specimens Failure mode from
the ACI 318-14
Failure mode from
the test
T-C42S40 UR UR
T-C42S50 OR UR
T-C42S60 OR OR
T-C70S40 UR UR
T-C70S50 UR OR
T-C70S60 OR OR
Note: UR: under-reinforced failure; and OR: over-reinforced failure.
Compatibility Equations
2 2cos sinl d r (9)
2 2sin cost d r (10)
sin cos2
lt
d r
(11)
2
o
lt
o
p
A (12)
sin 2 (13)
ds
dt
(14)
2
ds
d
(15)
where τlt: shear stress, γlt: shear strain, θ: angle of twist,
po: perimeter of the centerline of the shear flow, ψ:
curvature of the concrete struts, and εds: maximum strain
at the surface.
Constitutive Laws of Materials
To solve unknown value of variables, constitutive laws
of concrete and steel are needed. Constitutive laws of
concrete struts are (16)-(20), and Constitutive laws of
steels are (21)-(24).
- Concrete struts
For the ratio of the average stress to the peak stress k1,
(17-a) and (17-b) were used. (17-a) is for ascending
branch, and (17-b) is for descending branch. For a
softening coefficient ζ, Belarbi and Hsu’s equations (18-
a) and (18-b) were used [6]. For tensile stress-strain
relationship for concrete, (19-a) and (19-b) were used [7].
1
d ck f (16)
1
0 0 0
11 1.0
3
ds ds dsk
(17-a)
2
0
1 2
2
2
0 0 0
11 1
32
1 1 1.0
32
ds
ds ds ds
k
(17-b)
0.9 ( 41.5 MPa)
1 400c
r
f
(18-a)
5.8 1 ( 41.5 MPa)
1 400c
rc
ff
(18-b)
r cr r c rE (19-a)
0.4
r cr cr
r cr
r
f
(19-b)
1
3cr cf f (20)
where ε0: strain at the peak stress fc' (usually taken as
0.002), Ec: modulus of elastic of concrete, εcr: strain at
268© 2016 Int. J. Struct. Civ. Eng. Res.
International Journal of Structural and Civil Engineering Research Vol. 5, No. 4, November 2016
Page 5
cracking of concrete, and fcr: stress at cracking of
concrete.
- Steels
For stress-strain relationship of steels, the equations for
steel bars embedded in concrete were used. (21)-(24) are
equations for the stress-strain relationship of steel bars [8].
when
s yf f ,
s s sf E (21)
when
s yf f ,
0.91 2 0.02 0.25s y s sf B f B E (22)
0.93 2y yf B f (23)
1.5
1 cr
y
fB
f
(24)
where fs= fl or ft when applied to longitudinal
reinforcement or transverse reinforcement, respectively,
εs= εl or εt when applied to longitudinal reinforcement or
transverse reinforcement, respectively, and ρ= ρl or ρt
when applied to longitudinal reinforcement or transverse
reinforcement, respectively.
In this study, torsional analysis was performed by
Hsu’s flow chart for torsional analysis [9]. Fig. 6 shows
the flow chart of Rotating Angle-softened Truss Model
(RA-STM) for torsion by Hsu. For the initial values of
the principal compressive strain εd, the principal tensile
strain εr, and the thickness of shear flow zone td, -0.00001,
0.0001, and 0.0001 in. were chosen, respectively. And the
increments of these variables were chosen -0.00001,
0.00002, and 0.0001 in., respectively.
Select εd
Assume εr
Calc. ζ, k1, σd, σr
Assume td
Calc. Ao, po
Solve εl, fl, εt, ft
Calc. εr, td
Is εr close?
Is td close?
Calc. α, τlt, T, γlt, θ, ψ
End
Is εd > 0.0018?
No
No
Yes
Yes
Figure 6. Flow chart of CATM for torsion.
B. Torsional Strength
The torsional strength and the angle of twist at
maximum torque expected by CATM are shown in Table
V. The torsional strengths expected by CATM were
similar to the torsional strengths obtained by the test in
case of specimens T-C42S40 and T-C42S40. However
the torsional strengths expected by CATM of other
specimens were overestimated in comparison with the
torsional strength obtained by the test. So expecting
torsional strength of RC beams using high-strength
reinforcement by CATM can be overestimated.
C. Failure Modes
By checking whether torsional reinforcement was
yielding before reaching maximum torque or not, failure
mode can be expected by CATM. Except specimen T-
C70S50, the failure modes expected by CATM were
same with the failure modes obtained by the test. Unlike
the failure mode by the test, the expected failure mode of
specimen T-C70S50 was under-reinforced failure.
TABLE V. ANALYSIS RESULT
Specimens TCATM
(kN·m)
θCATM,max
(rad./m)
Texp
(kN·m)
θexp,max
(rad./m)
TCATM /
Texp
T-C42S40 47.53 0.0547 41.34 0.0161 1.150
T-C42S50 63.72 0.0500 48.03 0.0191 1.327
T-C42S60 64.80 0.0535 45.96 0.0297 1.410
T-C70S40 49.08 0.0682 49.11 0.0193 0.999
T-C70S50 67.29 0.0449 48.03 0.0202 1.401
T-C70S60 76.42 0.0573 48.98 0.0200 1.560
Note: TCATM: torsional strength expected by CATM; θCATM,max: angle of twist at maximum torque expected by CATM; Texp: maximum torque
from the test; and θexp,max: angle of twist at maximum torque from the test.
TABLE VI. YIELDING OF REINFORCEMENT AND FAILURE MODE
EXPECTED BY CATM
Specimens
Yielding of reinforcement Failure mode
expected by
CATM Transverse
reinforcement
Longitudinal
reinforcement
T-C42S40 O O UR
T-C42S50 O O UR
T-C42S60 X X OR
T-C70S40 O O UR
T-C70S50 O O UR
T-C70S60 X X OR
VT-C90S60 X X OR
VT-C100S60 X X OR
VT-C110S60 O X UR
Note: O: reinforcement yielded before reaching maximum torque; X: reinforcement did not yield before reaching maximum torque; UR:
under-reinforced failure; and OR: over-reinforced failure.
In the other literatures, the torsional failure modes
expected by CATM tended to match with the torsional
failure modes by the tests. Thus torsional analysis by
CATM on three more virtual specimens was performed.
The virtual specimens VT-C90S60, VT-C100S60, and
VT-C110S60 have same yield strength of steels (fyl=659
MPa and fyt=667 MPa) and three different compressive
strength of concrete (fc'=90, 100, and 110 MPa,
respectively). The torque versus angle of twist curve of
269© 2016 Int. J. Struct. Civ. Eng. Res.
International Journal of Structural and Civil Engineering Research Vol. 5, No. 4, November 2016
Page 6
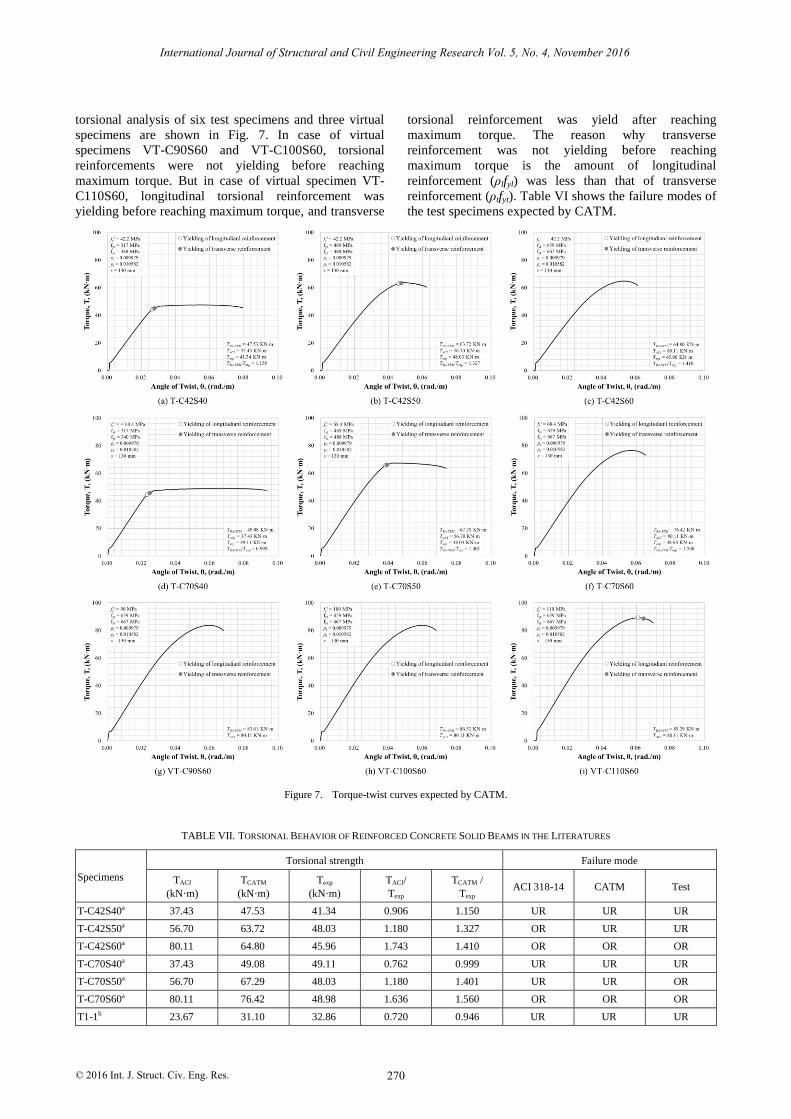
torsional analysis of six test specimens and three virtual
specimens are shown in Fig. 7. In case of virtual
specimens VT-C90S60 and VT-C100S60, torsional
reinforcements were not yielding before reaching
maximum torque. But in case of virtual specimen VT-
C110S60, longitudinal torsional reinforcement was
yielding before reaching maximum torque, and transverse
torsional reinforcement was yield after reaching
maximum torque. The reason why transverse
reinforcement was not yielding before reaching
maximum torque is the amount of longitudinal
reinforcement (ρlfyl) was less than that of transverse
reinforcement (ρtfyt). Table VI shows the failure modes of
the test specimens expected by CATM.
Figure 7. Torque-twist curves expected by CATM.
TABLE VII. TORSIONAL BEHAVIOR OF REINFORCED CONCRETE SOLID BEAMS IN THE LITERATURES
Specimens
Torsional strength Failure mode
TACI
(kN·m)
TCATM
(kN·m)
Texp
(kN·m)
TACI/
Texp
TCATM /
Texp ACI 318-14 CATM Test
T-C42S40a 37.43 47.53 41.34 0.906 1.150 UR UR UR
T-C42S50a 56.70 63.72 48.03 1.180 1.327 OR UR UR
T-C42S60a 80.11 64.80 45.96 1.743 1.410 OR OR OR
T-C70S40a 37.43 49.08 49.11 0.762 0.999 UR UR UR
T-C70S50a 56.70 67.29 48.03 1.180 1.401 UR UR OR
T-C70S60a 80.11 76.42 48.98 1.636 1.560 OR OR OR
T1-1b 23.67 31.10 32.86 0.720 0.946 UR UR UR
270© 2016 Int. J. Struct. Civ. Eng. Res.
International Journal of Structural and Civil Engineering Research Vol. 5, No. 4, November 2016
Page 7
T1-2b 35.16 44.88 45.89 0.766 0.978 UR UR UR
T1-3b 47.34 56.68 54.05 0.876 1.049 UR UR UR
T1-4b 68.87 72.27 62.41 1.103 1.158 OR UR UR
T2-1b 20.03 24.23 26.05 0.769 0.930 UR UR UR
T2-2b 36.80 41.26 38.11 0.966 1.083 UR UR UR
T2-3b 54.78 54.22 50.16 1.092 1.081 OR UR UR
T2-4b 64.45 59.67 56.39 1.143 1.058 OR UR UR
C24SD30-midc 40.10 50.80 34.91 1.149 1.455 OR UR UR
C24SD30-ECc 60.53 61.05 40.60 1.491 1.504 OR OR OR
C24G60-ECc 48.65 55.32 36.64 1.328 1.510 OR OR OR
C42G60-ACIc 38.04 60.01 39.70 0.958 1.512 UR UR UR
H-06-06d 76.00 88.41 92.00 0.826 0.961 UR UR UR
H-06-12d 95.69 108.03 115.10 0.831 0.939 UR UR UR
H-12-12d 119.50 148.53 155.30 0.770 0.956 UR UR UR
H-12-16d 181.17 172.45 196.00 0.924 0.880 OR UR UR
H-20-20d 261.77 210.98 239.00 1.095 0.883 OR OR OR
H-07-10d 100.21 111.90 126.70 0.791 0.883 UR UR UR
H-14-10d 131.18 143.14 135.20 0.970 1.059 UR UR UR
H-07-16d 129.37 123.68 144.50 0.895 0.856 UR UR UR
N-06-06d 76.00 84.04 79.70 0.954 1.054 UR UR UR
N-06-12d 95.69 97.93 95.20 1.005 1.029 UR UR UR
N-12-12d 119.50 128.46 116.80 1.023 1.100 OR OR UR
N-12-16d 162.82 134.87 138.00 1.180 0.977 OR OR UR
N-20-20d 261.77 148.04 158.00 1.657 0.937 OR OR OR
N-07-10d 100.21 96.31 111.70 0.897 0.862 OR UR UR
N-14-10d 131.18 121.05 125.00 1.049 0.968 OR UR UR
N-07-16d 129.37 102.86 117.30 1.103 0.877 OR UR UR
B5UR1e 16.31 20.66 19.40 0.841 1.065 UR UR UR
B7UR1e 15.77 22.03 18.90 0.834 1.166 UR UR UR
B9UR1e 16.31 21.55 21.10 0.773 1.021 UR UR UR
B12UR1e 15.77 22.27 19.40 0.813 1.148 UR UR UR
B12UR2e 15.58 22.45 18.40 0.847 1.220 UR UR UR
B12UR3e 20.95 25.52 22.50 0.931 1.134 UR UR UR
B12UR4e 23.66 27.98 23.70 0.998 1.181 UR UR OR
B12UR5e 24.74 32.09 24.00 1.031 1.337 UR UR OR
Mean. 1.019 1.110
C.V. 0.241 0.181
athis paper [4]. bJ.-Y. Lee and S.-W. Kim 2010 [3]. cS.-C. Lee 2013 [10]. dI-K. Fang and J.-K. Shiau 2004 [11]. eN.E. Koutchoukali and A. Belarbi 2001 [12].
D. Torsional Analysis of Specimens in the Literatures
To check accuracy and precision of torsional analysis
by CATM, torsional behavior of forty-two RC solid
beams [3], [4], [10]-[12] subjected to pure torsion
including these test specimens was analyzed by CATM.
Table VII shows torsional behavior by the ACI 318-14
design code, CATM, and the test. The torsional strengths
and failure modes expected by CATM showed good
agreement with the test results of RC beams with normal
strength torsional reinforcement. However, in case of RC
beams with high strength torsional reinforcement, such as
S50 specimens (fyl=469 MPa and fyt=480 MPa) and S60
specimens (fyl=659 MPa and fyt=667 MPa), the torsional
strengths expected by CATM overestimated the observed
ones up to 42.5 %.
V. CONCLUSION
This study investigated the torsional behavior of RC
beams with normal- and high-strength torsional
reinforcement. The observed test results were compared
with the torsional behavior predicted by a CATM. The
results obtained from the experimental and analytical
study are as follows:
271© 2016 Int. J. Struct. Civ. Eng. Res.
International Journal of Structural and Civil Engineering Research Vol. 5, No. 4, November 2016
1) Test results indicated that the torsional strength of
RC beams did not increase with the increase of yield
strength of torsional reinforcement.
Page 8
272© 2016 Int. J. Struct. Civ. Eng. Res.
International Journal of Structural and Civil Engineering Research Vol. 5, No. 4, November 2016
2) The beams with high strength torsional
reinforcement failed due to concrete crushing before
yielding of reinforcement.
3) Test results indicated that the limitation on the yield
strength of torsional reinforcement in the ACI 318-
14 design code was appropriate, while the limitation
in the Eurocode 2 was too high.
4) The CATM predicted the torsional strength and
failure mode of RC beams with normal strength
torsional reinforcement with good agreement, while
over-estimated the torsional strength of RC beams
with high strength torsional reinforcement up to
42.5%.
ACKNOWLEDGMENT
The support from the Korea Hydro & Nuclear Power
Co. Ltd. (2014151010169B) and the National Research
Foundation of Korea (2015R1D1A1A01056612) is
gratefully acknowledged.
REFERENCES
[1] ACI Committee 318, Building Code Requirements for Structural
Concrete (ACI 318-14) and Commentary, Farmington Hills, MI: American Concrete Institute, 2014, p. 520.
[2] Comité Européen de Normalisation (CEN), Eurocode 2: Design of Concrete Structures - Part 1-1: General Rules and Rules for
Buildings, EN 1992-1-1, 2004, p. 227.
[3] J. Y. Lee and S. W. Kim, “Torsional strength of RC beams considering tension stiffening effect,” Journal of Structural
Engineering, vol. 136, no. 11, pp. 1367-1378, Nov. 2010. [4] S. K. Yoon, “Failure modes of reinforced concrete beams with
high-strength steel bars subjected to pure torsion,” M.S. thesis,
Dept. of Civil, Architectural and Environmental System Engineering, Sungkyunkwan Univ., Suwon, Republic of Korea,
2012. [5] T. T. C. Hsu, Unified theory of Reinforced Concrete, Boca Raton,
FL: CRC Press, 1993, p. 313.
[6] A. Belarbi and T. T. C. Hsu, “Constitutive laws of softened concrete in biaxial tension-compression,” ACI Structural Journal,
vol. 92, no. 5, pp. 562-573, Sep. 1995. [7] A. Belarbi and T. T. C. Hsu, “Constitutive laws of concrete in
tension and reinforcing bars stiffened by concrete,” ACI Structural
Journal, vol. 91, no. 4, pp. 465-474, July 1994. [8] S. Tamai, H. Shima, J. Izumo, and H. Okamura, “Average stress-
strain relationship in post yield range of steel bar in concrete,” Concrete Library of JSCE, no. 11, pp. 117-129, June 1988.
[9] T. T. C. Hsu, “Softened truss model theory for shear and torsion,”
ACI Structural Journal, vol. 85, no. 6, pp. 624-635, Nov. 1988. [10] S. C. Lee, “Torsional failure modes of RC beams with high-
strength reinforcement,” M.S. thesis, Dept. of Mega Building and Bridges, Sungkyunkwan Univ., Suwon, Republic of Korea, 2013.
[11] I. K. Fang and J. K. Shiau, “Torsional behavior of normal- and
high-strength concrete beams,” ACI Structural Journal, vol. 101, no. 3, pp. 304-313, May-June 2004.
[12] N. E. Koutchoukali and A. Belarbi, “Torsion of high-strength reinforced concrete beams and minimum reinforcement
requirement,” ACI Structural Journal, vol. 98, no. 4, pp. 462-469, July 2004.
Seung Hoon Lee was born in Taebaek,
Republic of Korea, at January 25, 1991. He received his B.S. degree in architectural
engineering from the Sungkyunkwan
University, Suwon, Republic of Korea in 2015. His research interest includes shear and
torsional behavior on reinforced concrete structures.
He is in the master’s course in the Dept. of
Civil, Architectural and Environmental System Engineering at Sungkyunkwan University, Republic of Korea.
Seok-Kwang Yoon was born in Pyeongtaek,
Republic of Korea, at October 1, 1986. He
received his M.S. degree in architectural engineering from the Sungkyunkwan
University, Suwon, Republic of Korea in 2013. His research interest includes shear and
torsional behavior on reinforced concrete
structures. He works in the Dohwa Engineering Co., Ltd.,
Seoul, Republic of Korea.
Sung Hyun Yoon was born in Seoul,
Republic of Korea, at December 14, 1975. He received his M.S. degree in architectural
engineering from the Sungkyunkwan University, Suwon, Republic of Korea in
2003. His research interest includes shear and
torsional behavior on reinforced concrete structures.
He is in the doctor’s course in the Dept. of
Civil, Architectural and Environmental
System Engineering at Sungkyunkwan University, Republic of Korea.
Yoon Ki Hong was born in Suwon, Republic
of Korea, at July 23, 1988. He received his B.S. degree in architectural engineering from
the University of Seoul, Seoul, Republic of
Korea in 2014. His research interests include reinforced concrete structure and seismic
design. He is in the master’s course in the Dept. of
Global Construction Engineering at
Sungkyunkwan University, Republic of Korea.
Jung-Yoon Lee was born in Buan, Republic of Korea, at September 13, 1966. He received
his PhD in structural engineering from the
Kyoto University, Kyoto, Japan in 1998. His
research interests include the shear behavior
and seismic design of reinforced and prestressed concrete buildings.
He is a Professor in the School of Civil and
Architectural Engineering at Sungkyunkwan University, Republic of Korea. He is involved
in the committees, Shear and Torsion and Seismic Design, of the Korean Concrete Institute Committee.