TORSIONAL STRENGTH OF PRESTRESSED CONCRETE BRIDGE GIRDERS by Eugene Buth, Assistant Research Engineer Howard L. Furr, Research Eng.ineer Research Report 150-lF Technk:al Reports Center Texas Transportation Institute Torsional Strength of Prestressed. Concrete Bridge Girders Research Study Number 2-5-70-150 Sponsored by The Texas Highway Department In Cooperation with the U. S. Department of Transportation, Federal Highway Administration August 1971 TEXAS TRANSPORTATION INSTITUTE Texas A&M University College Station, Texas
Transcript
TORSIONAL STRENGTH OF PRESTRESSED CONCRETE BRIDGE GIRDERS
by
Eugene Buth, Assistant Research Engineer
Howard L. Furr, Research Eng.ineer
Research Report 150-lF
Technk:al Reports Center Texas Transportation Institute
Torsional Strength of Prestressed. Concrete
Bridge Girders
Research Study Number 2-5-70-150
Sponsored by
The Texas Highway Department In Cooperation with the
U. S. Department of Transportation, Federal Highway Administration
August 1971
TEXAS TRANSPORTATION INSTITUTE Texas A&M University
College Station, Texas
DISCLAIMER
The opinions, findings and conclusions expressed in this publication
are those of the authors and not necessarily those of the Federal Highway
Administration.
ii
ABSTRACT
Two Texas Highway Department type B prestressed concrete bridge
girders were tested to determine their torsional strength. Applied
torque, angle of twist and strains in the concrete were determined.
The theoretical strength and torque-rotation relationships were
calculated by classical elastic theory.
Experimental and theoretical torque-rotation relationships were
found to agree very closely. The theoretical torsional strength was on
the average about 75 percent of the experimentally determined torsional
strength.
iii
· SUMMARY
Two Texas Highway Department Type B prestressed concrete bridge
girders were loaded to failure in torsion to determine their torsion
strength. One girder was made of normal weight concrete and the other
of lightweight concrete. The torsional loading was applied to each
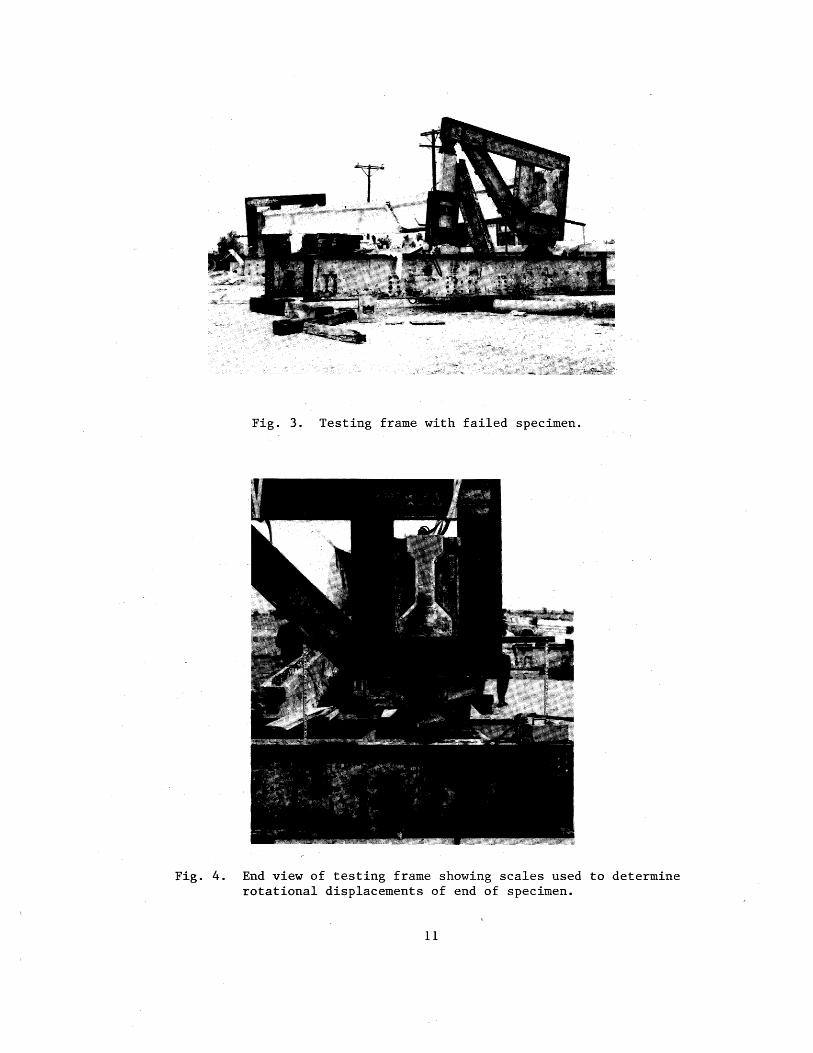
end of the beam through loading yokes with hydraulic jacks. The angle
of twist was measured with a precise level and two ~cales hanging from
cross bars attached to each end of the girder. Strains on the surface
of the girder were measured with electrical resistance strain gauge
rosettes on cross sections at mid span and 15 ft. either side of mid
span.
St. Venant's elastic theory was used to calculate the torsional
stiffness and torsional strength of each of the girders.
6 The effective values of shearing modulus, G, of 2.30 and 1.65xl0
psi found in the full scale torsion tests, compare well with values of
2.44 and 1.56 psi determined by ASTM C215 for the normal weight and
Figure 10: Stresses computed from measured.strains.
Change in stresses, due to applied torque only, at torques of 76.8, 82.4, 88.8, and 91.2 ft-kips for normalweight girder. Note that stresses due to dead load and prestress are not reflected in these numbers.
N N
1 I
I I ~ 187, 201, 208, 220 \ I
~07, 232, 254, 269 ' ~
~ 177, 199, 217, 236 WEST
' ~ SIDE
I I' 182' 202' 213' 233
~91, 207, 226, 278, I
I l I ~ I AlB, 242. 257. 271 I
~ / 160, 167' 175, 182
t } TOP )
I ~172, 190, 210, 207
I I
l
)~237, 259, 272, 293
~90, 204, 232, 251 I ~239, 270, 287, 298
I / 200, 212, 224, 238
~157, 181, 197, 219 EAST SIDE
/ 202' 224' 240' 264
I ~215, 237, 260, 237
' ~46, 168, 181, 165
: ~18, 240, 224, 299
I ~
~271, 303, 341, 391 ~312, 369, 425, 520 BOTTOM
\ ~269, 292, 334, 391
j --25 10' Distance from north end of girder
Fig. 11. Strains in micro-in. per in. (due to applied torque only) at torques of 64.8, 70.4 76.8 and 82.4 ft~kips for lightweight concrete girder.
N w
t
, J
~
I /584, 627, 649, 686
~46, 723, 792, 839 ~552, 621, 677, 736
Jl'568, 630, 665, 727
680, 755, 802, 846 /499, 521, 546, 568
~40, 808, 849, 914 ~624, 661, 699, 743
~93, 636, 724, 783 ~ 490, 565, 615, 683
' A6 /630, 699, 749, 824
~46, 945,1064,1220 ~ 973,1151,1326,1622
40' 25'
) l
WEST ' SIDE
TOP ~
EAST SIDE
I
BOTTOM I
I
~ 596, 646, 705, 867
~37, 593, 655, 635
-~71, 739, 811, 739
/ 456, 524, 565, 515
<so, 749, 699, 924
~39, 911,1042,1220
10' Distance from north end of girder.
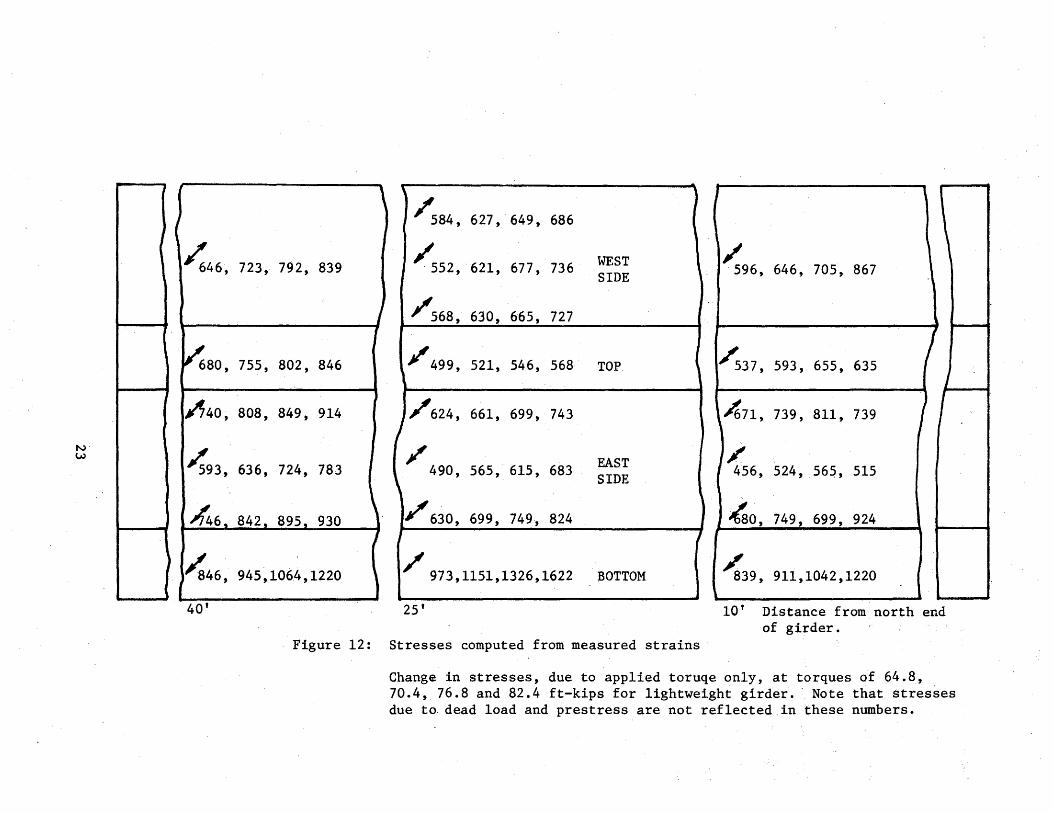
Figure 12: Stresses computed from measured strains
Change in stresses, due to applied toruqe only, at torques of 64.8, 70.4, 76.8 and 82.4 ft-kips for lightweight girder. Note that stresses due to dead load and prestress are not reflected in these numbers.
Comparison of theoretical with experilnental results
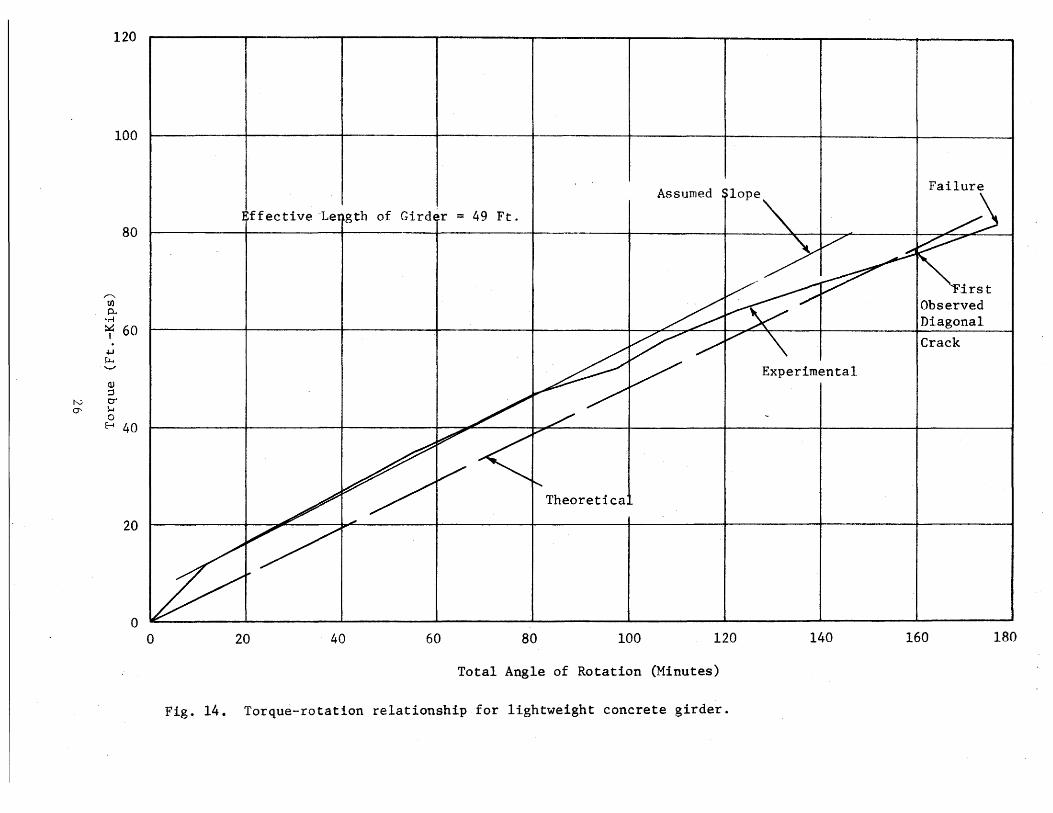
The relationships between the torque and angle·of twist for the two
girders are illustrated in Figures 13 and 14. On each graph a line has
beendrawn through the portion of the curve most nearly approximating a
straight line. This line is assumed to be the slope of the torque-rotation
4 ' relationship. Using these data with K = 7,600 in the expression T =KGB
1 T 6 or K 0 = G, one finds G to be 2.30 and 1.65Xl0 psi for the normal weight and
lightweight girders respectively. This compares with values of G = 2.44
and 1.56Xl06 psi determined by ASTM C215, "Test for Fundamental Transverse,
Longitudinal, and Torsional Frequencies of Concrete Specimens", for the two
girders.
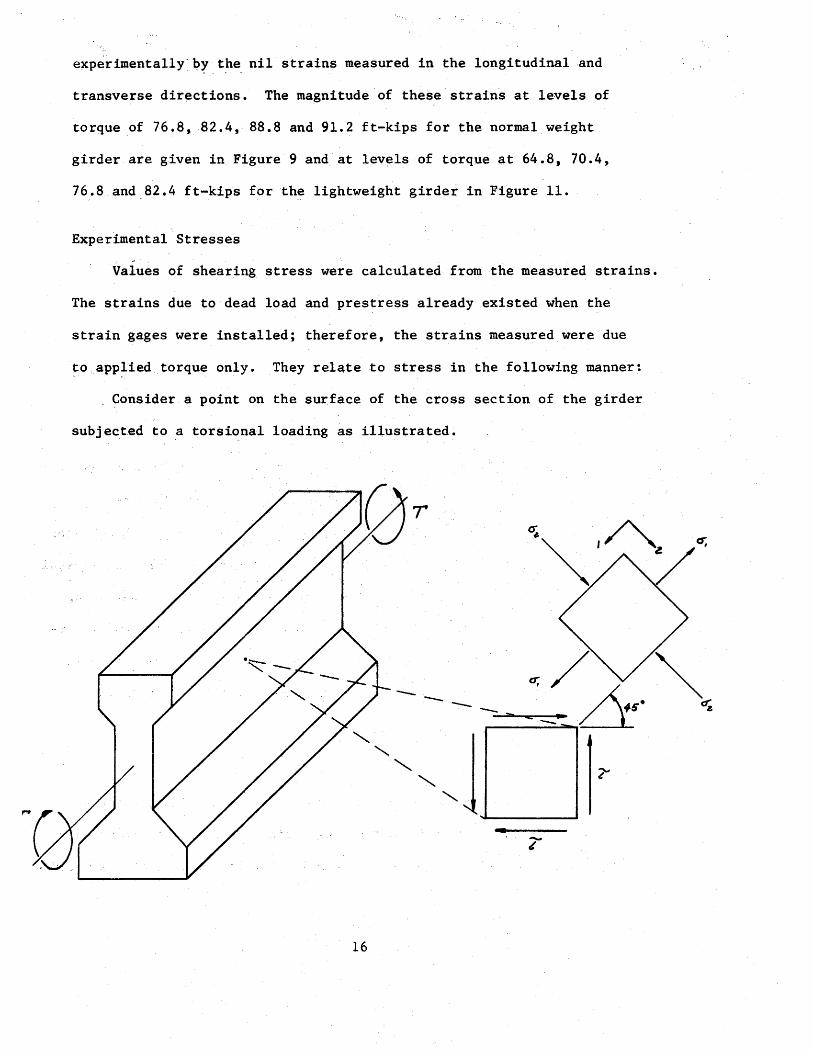
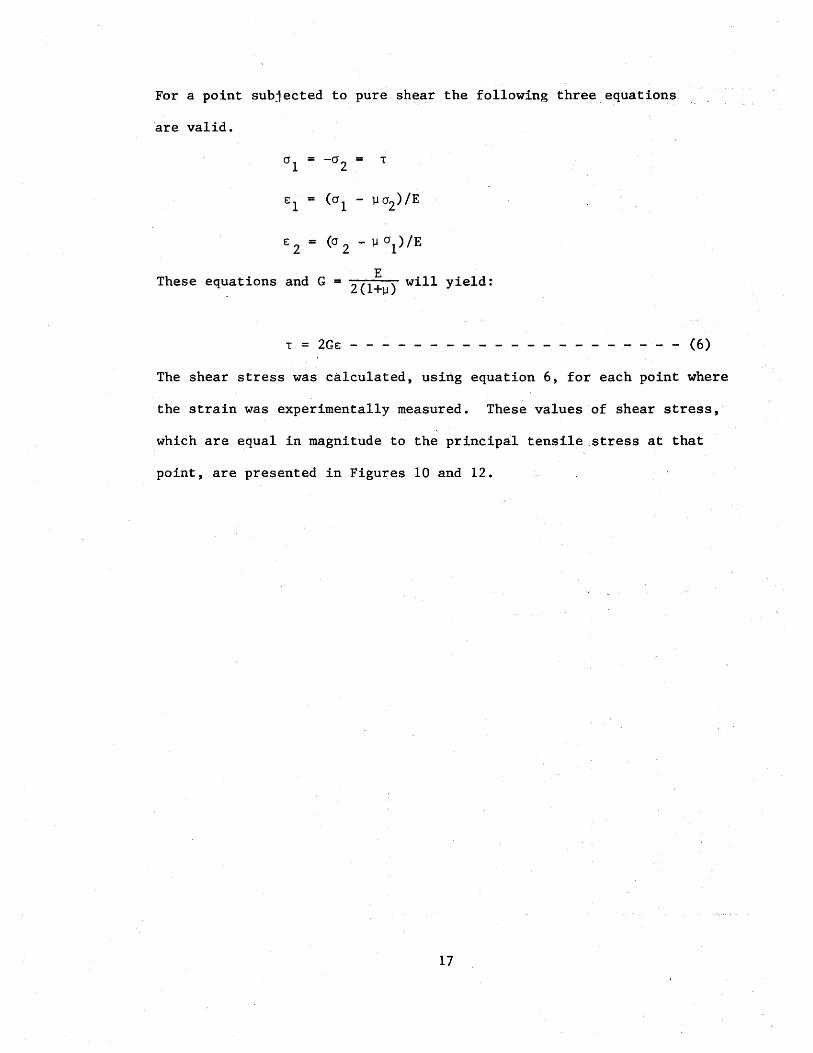
If the stresses due to the applied torque are combined with those due to
prestress and dead load the resulting principal stresses (neglecting stress
concentrations at the reentrant corners) are greatest in the middle of the
face of the top flange at points 5 ft. on either side of midspan of the girder.
The expressions relating maximum tensile stress to applied torque are:
cr = 68.5 + ~ /4 700 ~ 127.3 T2 1
-t \1 cr
(8)
and
cr = 116.6 + \./13,6000 + 127.3 T21
- (9) t \1 cr
for the normal weight and lightweight girders respectively. A more detailed
treatment of these relationships is given in Appendix C. If the tensile
strength of the concrete is taken as 10 f' , the resulting torques necessary c
to cause cracking of the concrete as 66.1 ft-kips for the normal weight and
66.5 ft-kips for the lightweight girder.
Two standard 6Xl2 cylinders were available for each of the girders.
24
N U1
-til p.. or-f ~ I
120
100
80
~ 60 ILl .._,
cu =' 0" 1-1 0
E-t 40
20
0 0
Assumed Slope
Experimental 1 ~
First observed diagqnal crack
Failure
Effective Length~of Girder= 49ft.
ationship
20 40 60 80 100
Total Angle of Rotation (Minutes)
Fig. 13, Torque-rotation relationship for normal weight girder.
120 140 160 180
120
100
,........, (J) p.
•rl
80
~ 60 ~ ~ ..._,
<1)
:J N 0" 0" )-I
0 ~ 40
20
0 0
Assumed
ffective ~ength of Gird~r = 49 Ft.
Theoretica
20 40 60 80 100 120
Total Angle of Rotation (Minutes)
Fig. 14. Torque-rotation relationship for lightweight concrete girder.
Experimental
140
Failure
irst Observed Diagonal
Crack
160 180
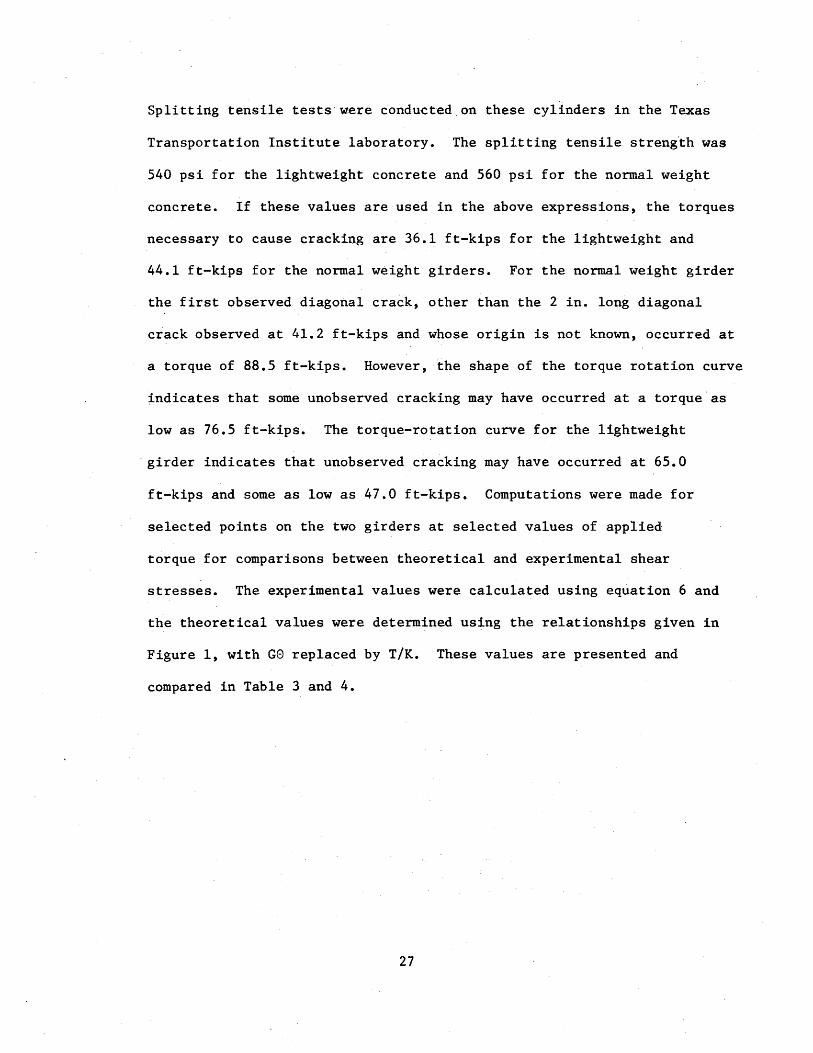
Splitting tensile tests·w.ere conducted.on these cylinders in the Texas
Transportation Institute laboratory. The splitting tensile streng~h was
540 psi for the lightweight concrete and 560 psi for the normal weight
concrete. If these values are used in the above expressions, the torques
necessary to cause cracking are 36.1 ft-kips for the lightweight and
44.1 ft-kips for the normal weight girders. For the normal weight girder
the first observed diagonal crack, other than the 2 in. long diagonal
crack observed at 41.2 ft-kips and whose origin is not known, occurred at
a torque of 88.5 ft-kips. However, the shape of the torque rotation curve
indicates that some unobserved cracking may have occurred at a torque·as
low as 76.5 ft-kips. The torque-rotation curve for the lightweight
·girder indicates that unobserved cracking may have occurred at 65.0
ft-kips and some as low as 47.0 ft-kips. Computations were made for
selected points on the two girders at selected values of applied
torque for comparisons between theoretical and experimental shear
stresses. The experimental values were calculated using equation 6 and
the theoretical values were determined using the relationships given in
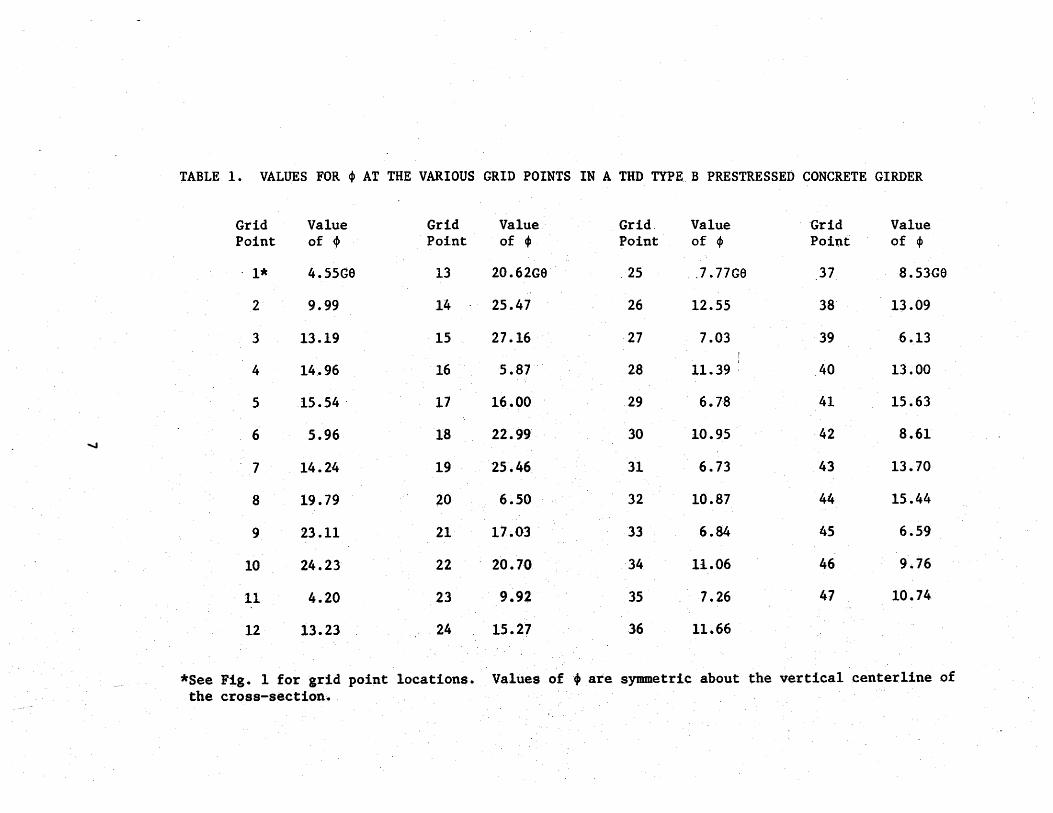
Figure 1, with G0 replaced by T/K. These values are presented and
compared in Table 3 and 4.
27
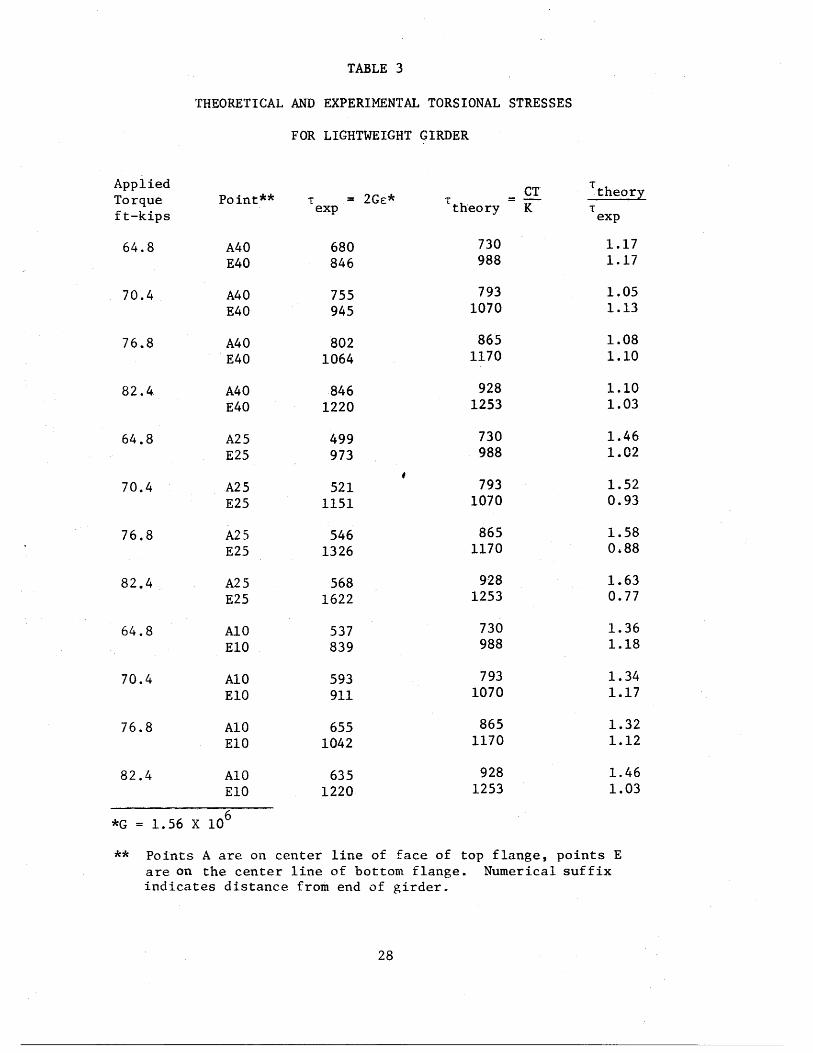
TABLE 3
THEORETICAL AND EXPERIMENTAL TORSIONAL STRESSES
FOR LIGHTWEIGHT GIRDER
Applied CT T
Torque Point** T 2GE* T =-theory
ft-kips exp theory K T exp
64.8 A40 680 730 1.17 E40 846 988 1.17
70.4 A40 755 793 1.05 E40 945 1070 1.13
76.8 A40 802 865 1.08 E40 1064 1170 1.10
82.4 A40 846 928 1.10 E40 1220 1253 1.03
64.8 A25 499 730 1.46 E25 973 988 1.02
70.4 A25 521 793 1.52 E25 1151 1070 0.93
76.8 A25 546 865 1.58 E25 1326 1170 0.88
82.4 A25 568 928 1.63 E25 1622 1253 0.77
64.8 A10 537 730 1.36 E10 839 988 1.18
70.4 A10 593 793 1.34 E10 911 1070 1.17
76.8 A10 655 865 1.32 E10 1042 1170 1.12
82.4 AlO 635 928 1.46 ElO 1220 1253 1.03
*G = 1.56 X 10⁶
** Points A are on center line of face of top flange, points E are on the center line of bottom flange. Numerical suffix indicates distance from end of girder.
28
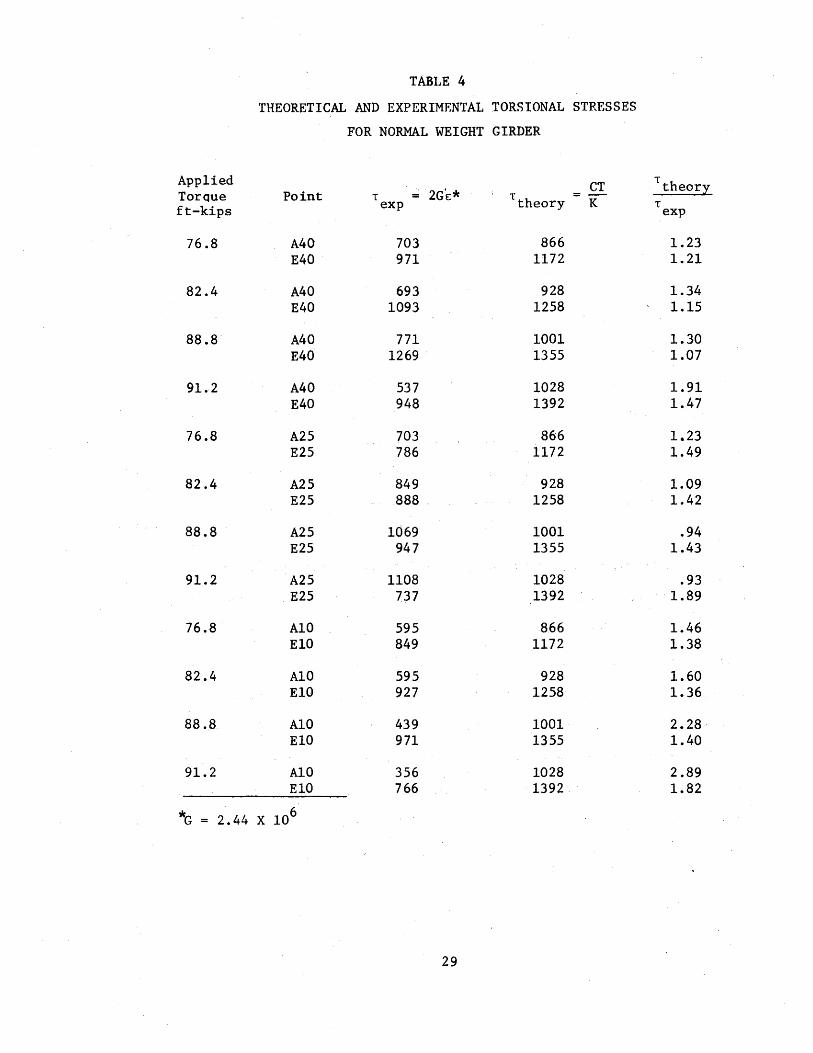
TABLE 4
THEORETICAL AND EXPERIMENTAL TORSIONAL STRESSES
FOR NORMAL WEIGHT GIRDER
Applied CT T
TorQue Point T 2G£* T =-theory
ft-kips exp theory K T exp
76.8 A40 703 866 1.23 E40 971 1172 1.21
82.4 A40 693 928 1.34 E40 1093 1258 1.15
88 .8· A40 771 1001 1.30 E40 1269 1355 1.07
91.2 A40 537 1028 1.91 E40 948 1392 1.47
76.8 A25 703 866 1.23 E25 786 1172 1.49
82.4 A25 849 928 1.09 E25 888 . 1258 1.42
88.8 A25 1069 1001 .94 E25 947 1355 1.43
91.2 A25 1108 1028 .93 E25 737 1392 1.89
76.8 A10 595 866 1.46 E10 849 1172 1.38
82.4 A10 595 928 1.60 E10 927 1258 1.36
88.8 A10 439 1001 2.28· E10 971 1355 1.40
91.2 AlO 356 1028 2.89 ElO 766 1392 1.82
*G = 2.44 X 10⁶
29
Stress concentrations
The torsional shear stress is increased in magnitude.at reentrant
corners of a cross section. The amount of stress concentration· is
dependent upon the angle of the corner and the radius that exists
between the two adjoining faces. Calculations were made to determine
the shear stress at the reentrant corners between the top flange and
the web and between the bottom flange and the web of the girders. The
values of these shear stresses are 11.80 Ge and 10.9 G8 for the reentrant
corners at the top and bottom flanges respectively. For the top flange
reentrant corners at points five feet either side of midspah of the
girder, the expressions for principal tensile stress are:
cr = -134 + t
at = -165 +
17,950 + (11.80Ge) 2 -
27,200 + (11.80Ge) 2
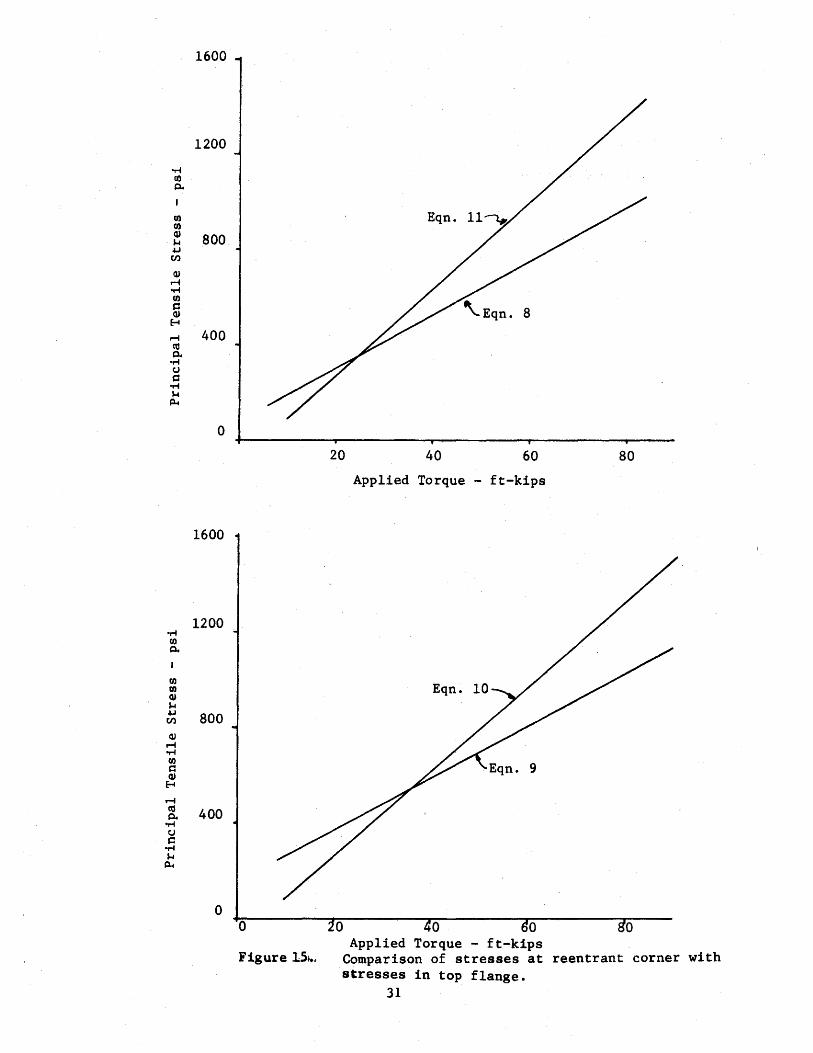
for the lightweight and normal weight girders respectively. Equations
8 and 10 are compared in Figure 15a and equations 9 and 11 are compared
in Figure 15b. From these plots, it is seen that the location of the
point on the girder where the maximum tensile stress occurs is dependent
upon the relative magnitude of the applied torque and the bending
-(10)
-(11)
stresses. The stresses at the reentrant corner do not exceed those in the
top flange for low value torques. For values of torque near the failure
torque, the concentrated stresses at the reentrant corner significantly
exceed those in the top flange. It should be remembered that the
stress concentrations are confined to a very small atea and that
30
~ Cl)
0.
I
Cl) Cl) Q) .,... ~ (/.)
Q) ,.... of"'4 Cl)
t::: Q) ~ ,.... co 0.
of"'4 (J
t::: of"'4 ~ ~
•r-f Cl)
0.
Ul CD Q) ,... ~ (/.)
QJ ...... of"'4 (I)
t::: QJ
E-1
...... co 0. ~ (J s:: ~ ,... ~
1600
1200
800
400
0
1600
1200
800
400
0 0
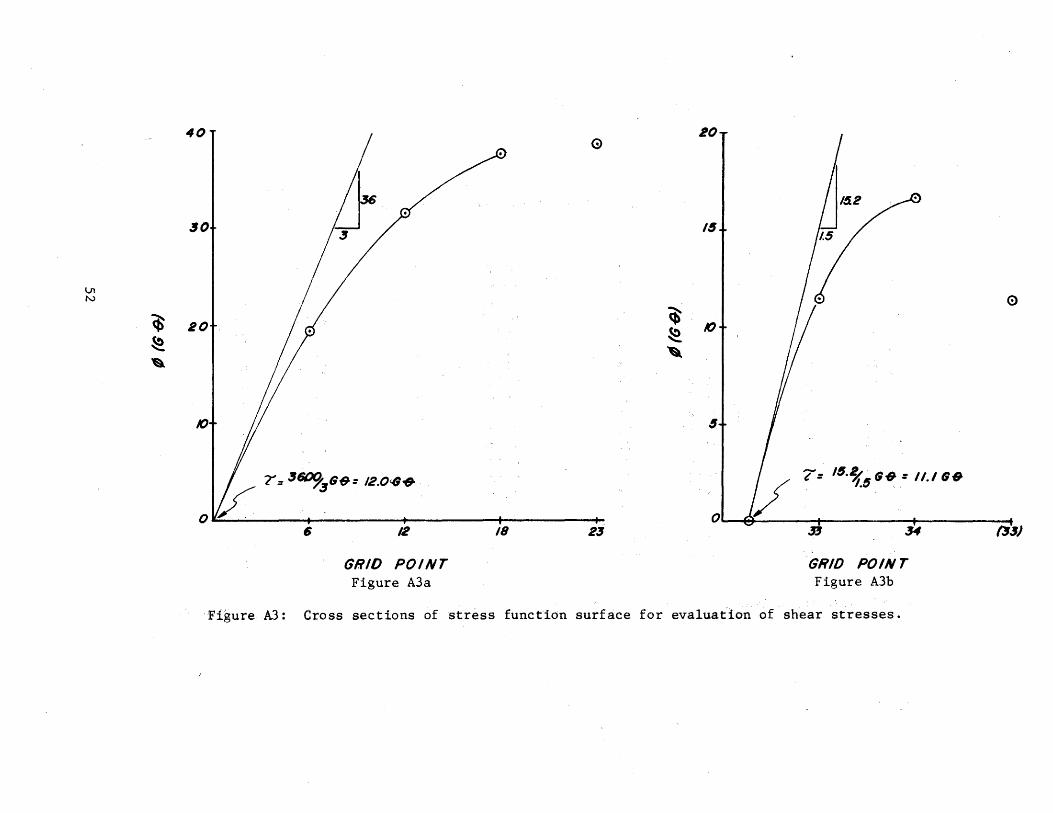
Figure 1St..
20 40 60 80
Applied Torque - ft-kips
0 0 0 0 Applied Torque - ft-kips
Comparison of stresses at reentrant corner with stresses in top flange.
31
significantly lower stresses exist either side of the corner. Localized
plastic yielding could account for the fact that pronounced early
failure did not occur at the reentrant corner in the tests.
32
CONCLUSION
On the basis of the two tests and the analysis conducted in
this study the following conclusions are indicated.
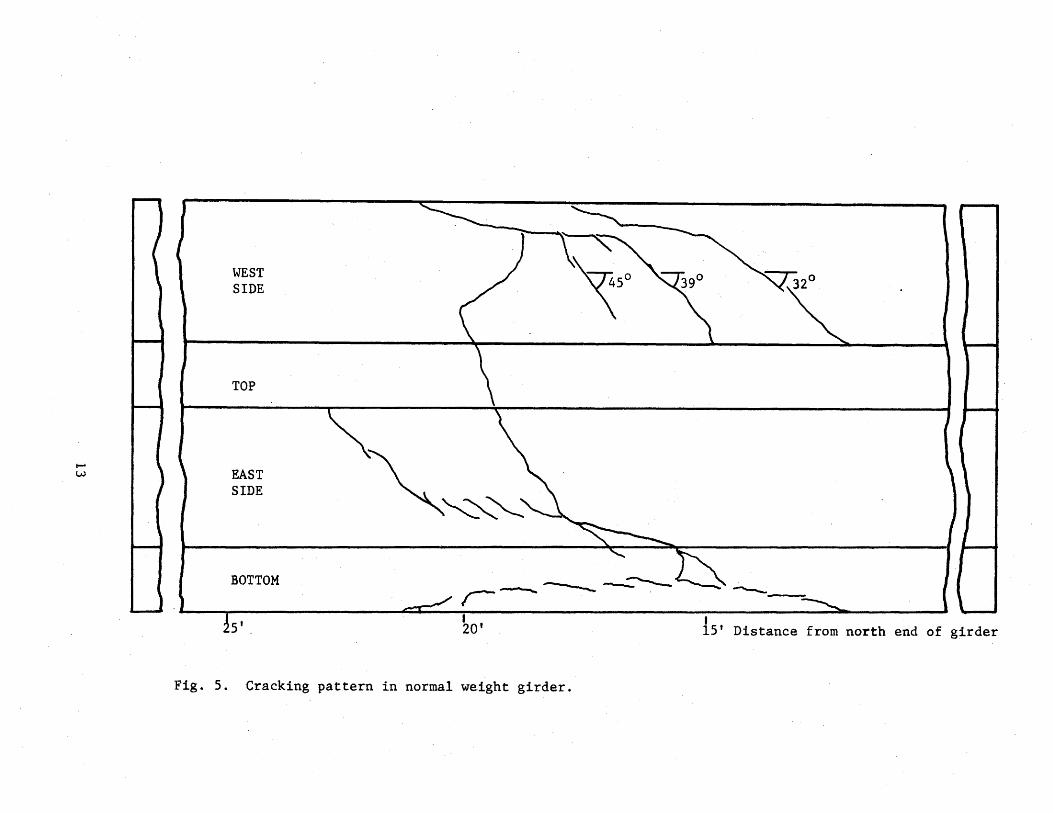
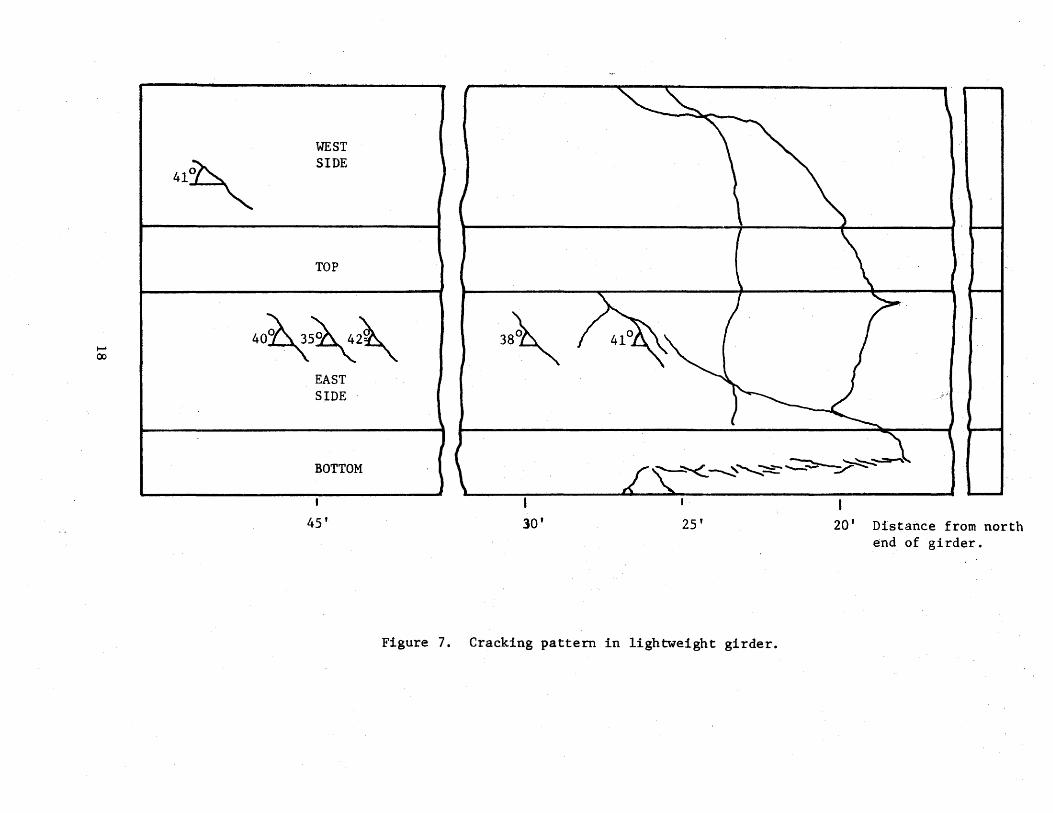
(1) When subjected to a torsional load, the prestressed concrete
girders failed in tension along a diagonal line which made an angle of
approximately 40 degrees on the sides and. 50 degrees on the top flange.
The ends of this crack were connected by a line on the bottom flarige
running longitudinally with the axis of the girder.
(2) The effective values of shearing modulus, G, of 2.30 and 1.65X
106 psi found in the full scale torsion tests compare well with values
of 2.44 and 1.56Xl06 psi determined by ASTM C215 for the normal weight and
lightweight girders respectively~
(3) Theoretically derived torsional capacity using 10~ as the c
ultimate tensile strength was about 75 percent of the experimental
torsional capacity, which is on the conservative side. If strengths
obtained from split cylinder tests· are used as the ultimate strength the
theoretical torsional capacity is about 50 percent of the experimental
torsional capacity.
33
REFERENCES
1. Timoshenko, S. and Goodier, J. N., Theory of Elasticity, Second Edition, McGraw-Hill, New York, 1951.
2. Tamberg, K. G., "Elastic Torsional Stiffness of Prestressed Concrete AASHO Girders," Journal of American Concrete Institute, Proceedings, V. 62, No. 4, April 1965.
3. Gersch, B. c. and Moore, Willard H., "Flexure, Shear and Torsion Tests on Prestressed Concrete !-Beam," Highway Research Board· Bulletin 339, Washington, D. C., 1962.
4. Furr, H. L., Sinno, R., and Ingram, L. I., "Prestress Loss and Creep Camber in Highway Bridge with Reinforced Concrete Slab on Pre tensioned Pres tressed Concrete Beams," Research Report No. 69-3 (Final) Texas Transportation Institute, Texas A&M University, Oct. 1968.
5. Zia, Paul, "Torsional Strength of Prestressed Concrete Members," Journal of the American Concrete .Insti'tute, Proceedings, V. 57, April 1961.
6. Gesund, Hans, and Boston, L. A •. , "Ultimate Strength in Combined Bending and Torsion of Concrete Beams Containing Only Logitudinal Reinforcement," Journal of the American Concrete Institute, Proceedings, V. 61, November 1964.
7. Walsh, et. al, . "The Ul ti'mate Strength· Design of Rectangular Reinforced Concrete Beams Subjected to Combined Torsion, Bending and Shear," Civil Engineering Transactions, The Institute of Engineers, Australia, October 1966.
B. Hsu, T. T. C., "Torsion of Structural Concrete-Uniformly Prestressed Rectangular Members without ·Web Reinforcement," Journal of Pres tressed Concrete Institute, April 1968.
9. Higdon, A., Ohlsen, E. H., Stiles, W. B., and Weese, J. A., Mechanics of Materials, Second Edition, John Wiley and Sons, Inc.,. New York, 1968.
34
APPENDIX A
35
APPENDIX A
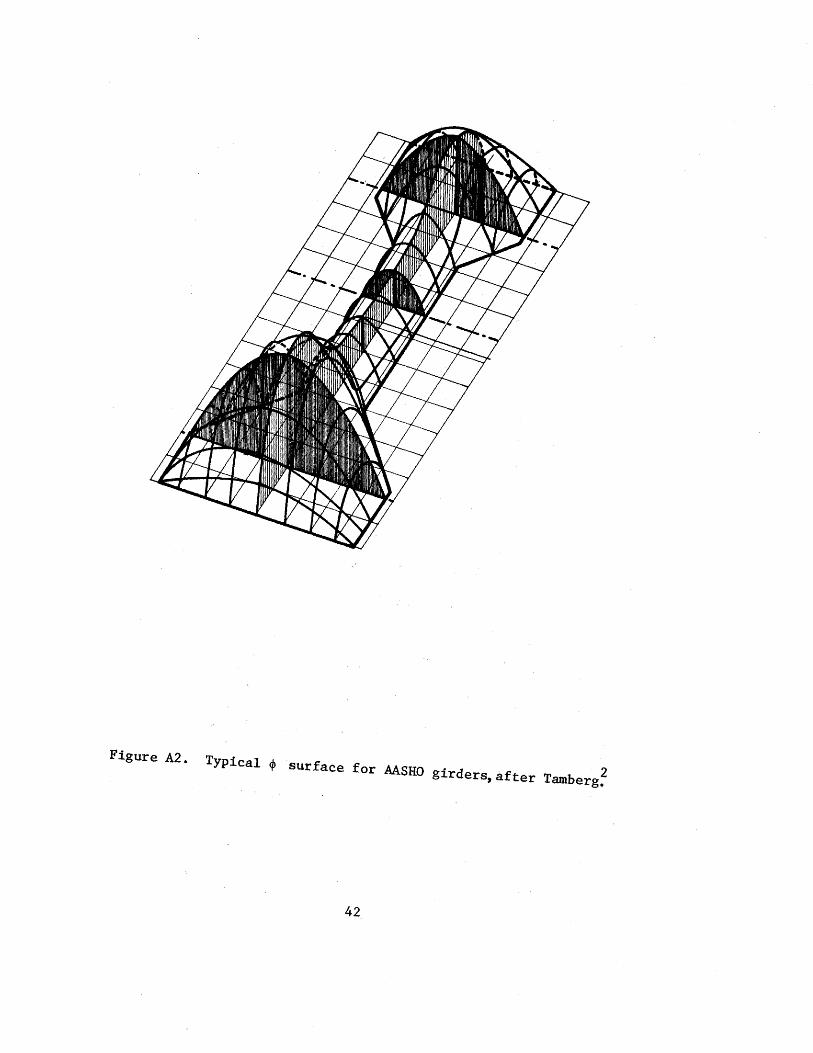
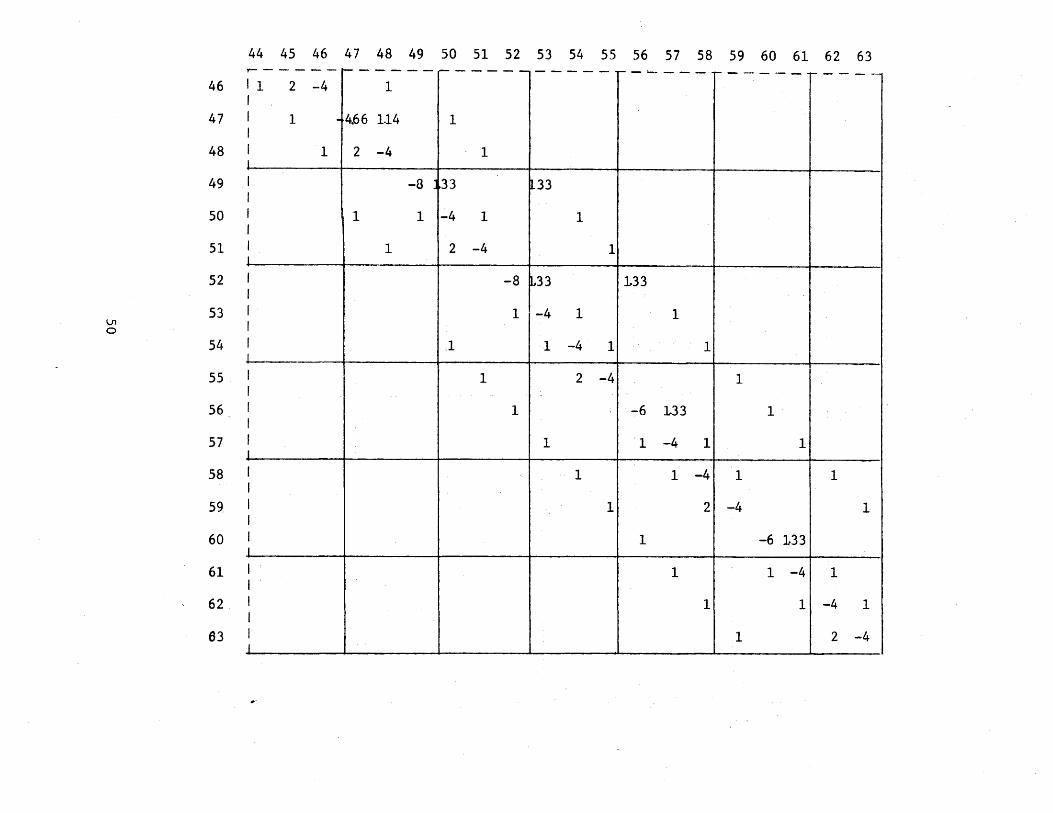
Method for calculating shear stresses and torsional stiffness, "K".1
'2
Outline of Steps:
(a) Layout a square grid on the cross section and number
each point.
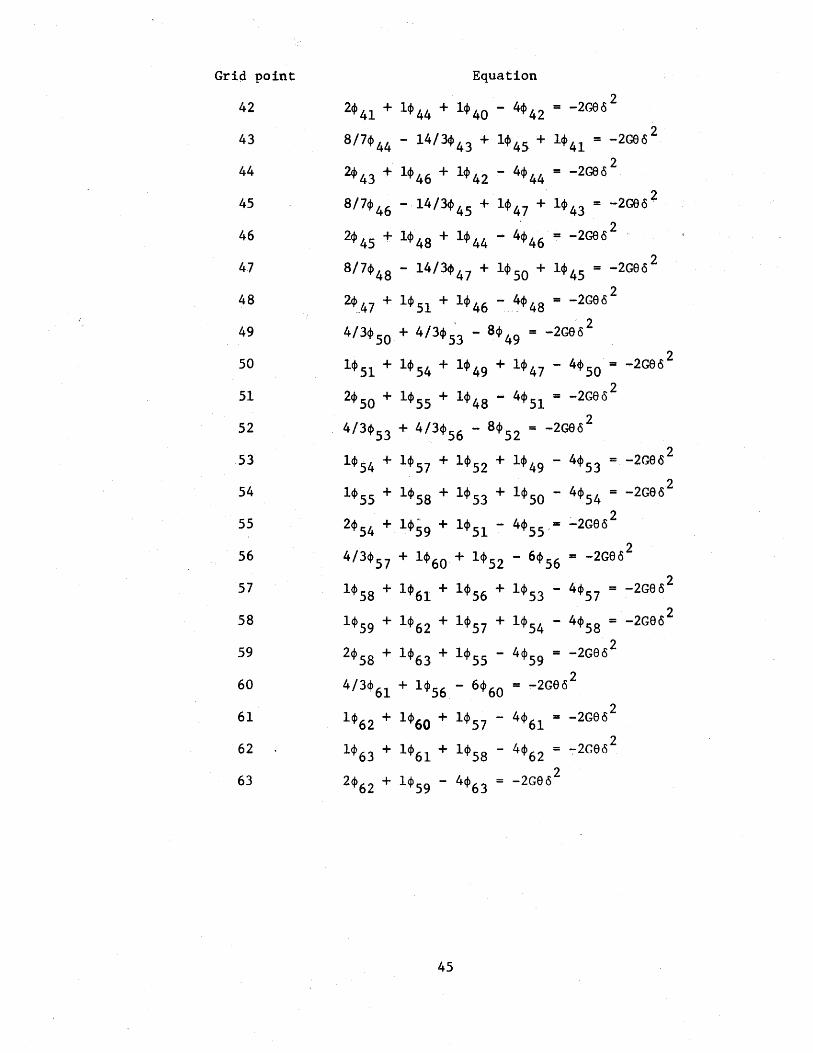
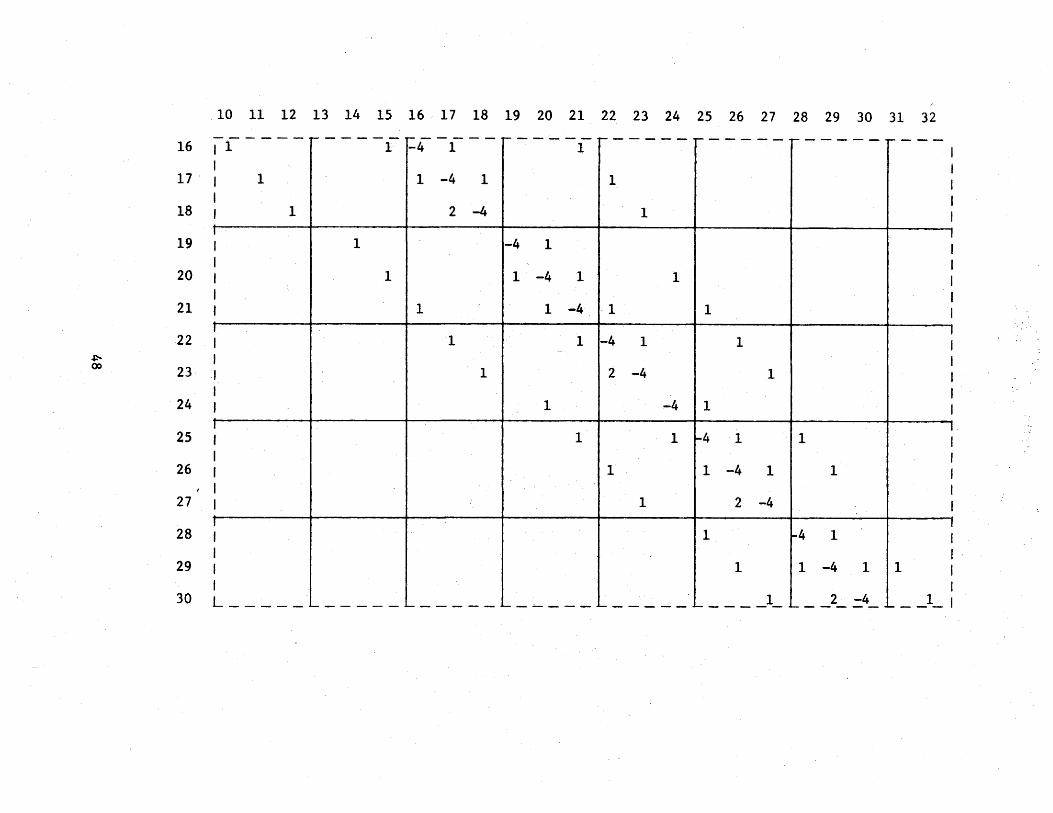
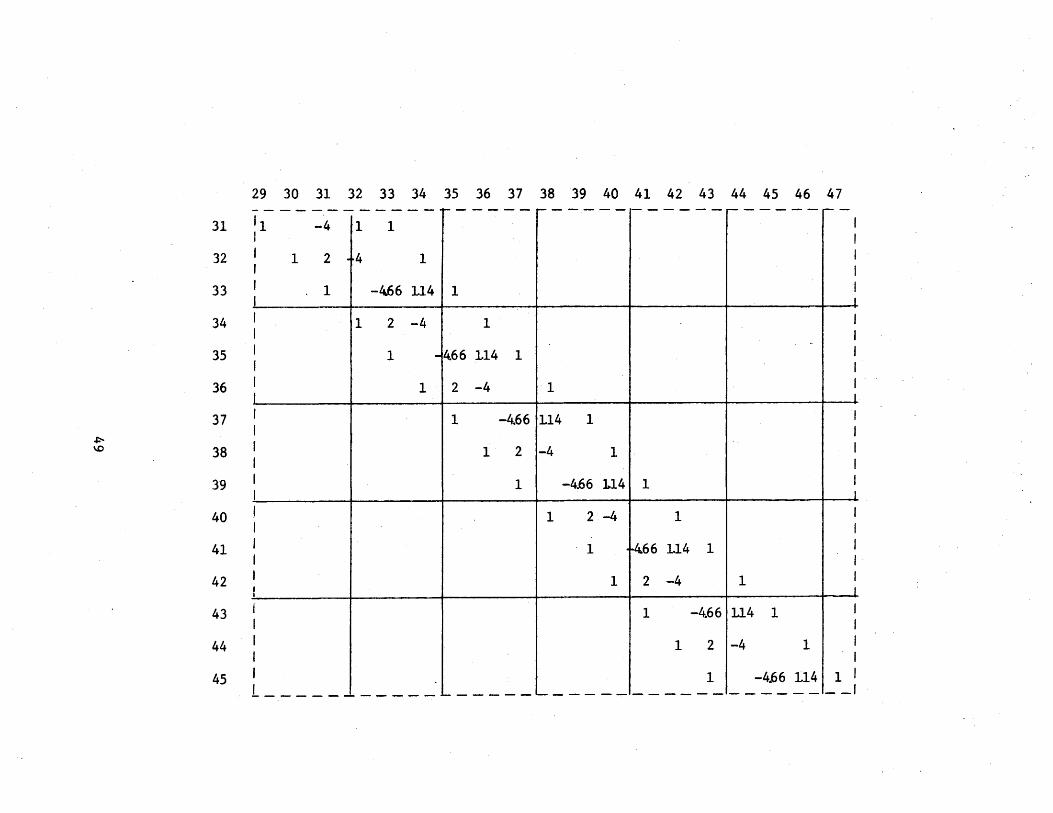
(b) For each point of the grid, write the finite difference
a2<!> a2<!> , form of the equation aiZ + ayz = -2G6.
This will result in a system of equations which can
be solved simultaneously for values of ~ in terms of Ge.
This can best be done using a matrix inversion and
multiplication routine on the computer. Such a routine
was used in this study.
(c) Using numerical techniques, evaluate the intergal
T = 2 4dxdy = KGB J~rea ·
(d) Solve this expression for the torsional stiffness ''K".
Note that the integral will be in tenns of Ge and that
Ge will cancel out of this expression. K is a property
of the geometry of the cross section only and does not
reflect any properties of the material such as shear
modulus, strength, presence of prestress, etc.
This procedure is the shortest and simplist known
and calculations were not made for beams other than THD
I
typesBtC. However, once the value of K is calculated for
any given cross section, the value will not change for
36
that cross section. Values of K for AASHO girders. given
by Tamberg are: 4 900 . 4 8 30 . 4 Type I - , in. , Type II - , 0 1n. ,
. Type III - 19,000 in. 4 and Type IV - 34,500 in. 4
The following set of calculations were made for a THD type C beam
and will illustrate the application of the procedure outlined above. The
governing differential equation is evalua-ted numerically as follows: