Title: TOS Protocol and Procedure: Measurement of Leaf Area Index Date: 9/16/2015 NEON Doc. #: NEON.DOC.014039 Author: Courtney Meier Revision: G TOS PROTOCOL AND PROCEDURE: MEASUREMENT OF LEAF AREA INDEX PREPARED BY ORGANIZATION DATE Courtney Meier FSU 7/08/2015 Jennifer Everhart FSU 7/08/2015 Katherine Jones FSU 7/08/2015 APPROVALS ORGANIZATION APPROVAL DATE Mike Stewart PSE 8/31/2015 Dave Tazik SCI 8/06/2015 RELEASED BY ORGANIZATION RELEASE DATE Anne Balsley CM 9/16/2015 See configuration management system for approval history. 2015 NEON Inc. All rights reserved. The National Ecological Observatory Network is a project solely funded by the National Science Foundation and managed under cooperative agreement by NEON, Inc. Any opinions, findings, and conclusions or recommendations expressed in this material are those of the author(s) and do not necessarily reflect the views of the National Science Foundation.
Transcript
Title: TOS Protocol and Procedure: Measurement of Leaf Area Index Date: 9/16/2015
NEON Doc. #: NEON.DOC.014039 Author: Courtney Meier Revision: G
TOS PROTOCOL AND PROCEDURE: MEASUREMENT OF LEAF AREA INDEX
PREPARED BY ORGANIZATION DATE
Courtney Meier FSU 7/08/2015
Jennifer Everhart FSU 7/08/2015
Katherine Jones FSU 7/08/2015 APPROVALS ORGANIZATION APPROVAL DATE
Mike Stewart PSE 8/31/2015
Dave Tazik SCI 8/06/2015
RELEASED BY ORGANIZATION RELEASE DATE
Anne Balsley CM 9/16/2015
See configuration management system for approval history.
2015 NEON Inc. All rights reserved.
The National Ecological Observatory Network is a project solely funded by the National Science Foundation and managed under cooperative agreement by NEON, Inc. Any opinions, findings, and conclusions or recommendations expressed in this material are those of the author(s) and do not necessarily reflect the views of the
National Science Foundation.
Title: TOS Protocol and Procedure: Measurement of Leaf Area Index Date: 9/16/2015
NEON Doc. #: NEON.DOC.014039 Author: Courtney Meier Revision: G
B 01/13/2014 ECO-01140 Updates from 2013. Will be finalized in next rev
C 03/25/2014 ECO-01665 Production release, template change, and other changes as detailed in Appendix C (rev C only)
D 04/10/2014 ECO-01792 Added Appendix C with site-specific information
E 11/03/2014 ECO-02386 Migration to new protocol template, changes to histogram interpretation and optimizing exposure for upward-facing images.
F 04/14/2015 ECO-02559 Update of TOS protocol based on 2014 field experience and budget analysis.
G 9/16/2015 ECO-03118
Revisions for protocol baselining: • Updated downward-facing camera settings in Table 9 • Added standardized data entry and safety text • New histogram figures, and histogram interpretations in
Table 12 • Added camera memory card configuration options to
SOP A • Removed Appendix E, DSLR configuration, due to
forthcoming DSLR Configuration SOP
Title: TOS Protocol and Procedure: Measurement of Leaf Area Index Date: 9/16/2015
NEON Doc. #: NEON.DOC.014039 Author: Courtney Meier Revision: G
APPENDIX A QUICK REFERENCES .............................................................................................. 49
APPENDIX B REMINDERS ......................................................................................................... 50
APPENDIX C ESTIMATED DATES FOR ONSET AND CESSATION OF SAMPLING ............................. 51
APPENDIX D DAY OF YEAR CALENDARS .................................................................................... 54
APPENDIX E DATASHEETS ........................................................................................................ 56
APPENDIX F SITE-SPECIFIC INFORMATION................................................................................ 57
LIST OF TABLES AND FIGURES
Table 1. Number of plots and frequency of sampling guidelines for DHP collection in Distributed/Gradient and Tower plots. ........................................................................................................ 5 Table 2. Number of plots and sampling start/stop guidelines for DHP collection in Distributed/Gradient and Tower plots. ........................................................................................................................................... 6 Table 3. Contingency decisions..................................................................................................................... 7 Table 4. Equipment list – A team of two people collecting DHPs from a plot ............................................. 9 Table 5. Equipment list –Transferring DHPs from the camera to the server, and handling field-collected sampling metadata ..................................................................................................................................... 11 Table 6. Equipment list – Processing DHPs. Note that software will be made available by the NEON IT and CI teams, and will not be locally installed by Domain Managers or technicians. ................................ 12 Table 8. Desired Nikon DSLR settings for collecting DHPs in the field. ...................................................... 15 Table 9. Guidelines for determining proper camera positioning when taking DHPs. ................................ 17 Table 10. Camera settings for downward-facing DHPs .............................................................................. 19 Table 11. Initial camera settings for upward-facing DHPs. Settings may be adjusted after a test image is acquired ...................................................................................................................................................... 22 Table 12. Strategy for optimizing image exposure while taking upward-facing DHPs in manual exposure mode. .......................................................................................................................................................... 23 Table 13. Common issues encountered during acquisition of upward-facing DHPs, and available solutions. ..................................................................................................................................................... 27 Table 14. Criteria for determining placement of DHP images within required file path and folder structure. ..................................................................................................................................................... 28 Table 15. Sliders and their effects in the “Basic” panel of Adobe Camera Raw1. ...................................... 31 Table 16. Image parameters ....................................................................................................................... 31 Table 17. Details to examine in JPG images created via batch process from DHP RAW images. .............. 33
Title: TOS Protocol and Procedure: Measurement of Leaf Area Index Date: 9/16/2015
NEON Doc. #: NEON.DOC.014039 Author: Courtney Meier Revision: G
iii
Table 18. Creating the optical center and projection function for LAI analysis in CanEye. ........................ 35 Table 19. Elements in each DHP that should be masked prior to LAI estimation with CanEye. ................ 36 Table 20. Guidelines for classifying pixels into “Green” and “Soil” categories in downward-facing images. .................................................................................................................................................................... 38 Table 21. Guidelines for classifying pixels into “Green” and “Sky” categories in upward-facing images. . 41 Table 22. Guidelines for transcribing LAI output from the CanEye Excel file to the NEON Data Ingest Workbook. .................................................................................................................................................. 46 Table 23. Site-specific sampling start and end dates for LAI timecourse sampling in Tower plots, and peak greenness sampling date ranges for spatially-intensive Distributed plot LAI sampling. All dates are provided in day-of-year format. ................................................................................................................. 51 Table 24. Datasheets associated with this protocol ................................................................................... 56 Figure 1. Distributed base plot (or 20 m x 20 m Tower plot) showing the location and spacing of DHP photo points relative to plot center.............................................................................................................. 4 Figure 2. Example of a properly exposed downward-facing DHP at the D01 Harvard Forest site (photo by B. Chemel) ................................................................................................................................................... 21 Figure 3. An example histogram from a properly exposed image ............................................................. 25 Figure 4. An example of a properly exposed upward-facing DHP, and its associated histogram .............. 26 Figure 6. A field researcher acquiring an upward-facing DHP with the monopod/camera ensemble held at shoulder height ....................................................................................................................................... 27 Figure 7. Example of an upward-facing hemispherical image successfully classified into sky (orange) and plant material (purple). Grey represents ambiguous pixels in the “Mixed” category that the user has not classified. ..................................................................................................................................................... 44 Figure 8. Example CanEye output from the “PAI, ALA” tab. Values that may be transcribed are circled in red. .............................................................................................................................................................. 47
Title: TOS Protocol and Procedure: Measurement of Leaf Area Index Date: 9/16/2015
NEON Doc. #: NEON.DOC.014039 Author: Courtney Meier Revision: G
2014 NEON Inc. All rights reserved.
Page 1 of 58
1 OVERVIEW
1.1 Background
Leaf area index (LAI) is a useful proxy variable for numerous other variables of ecological interest including plant biomass, plant productivity, forage quality, carbon balance, ecosystem energy flux, plant density, and the heterogeneity of plant cover. LAI is also used widely as a key input variable to models that seek to predict ecological processes such as carbon cycling. Regional to continental scale estimates of LAI are typically derived from satellite data, but validation of satellite data with aircraft and ground-collected data is relatively uncommon. By leveraging NEON’s aircraft and ground-collected estimates of LAI, it will be possible to develop ground-validated estimates of LAI at the continental scale.
There are numerous methods available for estimating LAI, and these fall into two general categories: direct and indirect. Direct methods are conceptually the most straightforward, and involve the destructive harvest and measurement of individual leaves from selected plants. Direct methods are also laborious relative to indirect methods, and as such, are not suitable for further consideration given the budgetary and logistical concerns that these methods pose at the continental scale of the Observatory. With indirect methods, on the other hand, it is possible to rapidly and non-destructively estimate LAI using a variety of optical instruments that measure the canopy gap-fraction, and then mathematically relate the gap-fraction to LAI.
NEON is using the Digital Hemispherical Photo (DHP) system (aka fisheye photos) to estimate LAI, since it is rapid and non-destructive. The image-derived gap-fraction (i.e., the proportion of visible sky, un-obscured by vegetation, calculated as a function of the direction of sky relative to image center) of a DHP is then used to calculate LAI. The benefits of using a DHP system include: 1) measurements of LAI in systems with tall woody stems are economical and efficient for field technicians to carry out; 2) measurement of low-stature vegetation – e.g. short-grass steppe – is possible without interfering with the vegetation itself during data collection; 3) because the data produced by the DHP method are in the form of an image file, it is straightforward to perform QA/QC both in the field and at NEON HQ; and 4) as data analysis algorithms evolve in the future, digital images are readily archived and can easily be re-analyzed for LAI by the user community as desired.
1.2 Scope
This document provides a change-controlled version of Observatory protocols and procedures. Documentation of content changes (i.e. changes in particular tasks or safety practices) will occur via this change-controlled document, not through field manuals or training materials.
Title: TOS Protocol and Procedure: Measurement of Leaf Area Index Date: 9/16/2015
NEON Doc. #: NEON.DOC.014039 Author: Courtney Meier Revision: G
2014 NEON Inc. All rights reserved.
Page 2 of 58
1.2.1 NEON Science Requirements and Data Products
This protocol fulfills Observatory science requirements that reside in NEON’s Dynamic Object-Oriented Requirements System (DOORS). Copies of approved science requirements have been exported from DOORS and are available in NEON’s document repository, or upon request.
Execution of this protocol procures samples and/or generates raw data satisfying NEON Observatory scientific requirements. These data and samples are used to create NEON data products, and are documented in the NEON Scientific Data Products Catalog (RD[03]).
1.3 Acknowledgments
N/A
2 RELATED DOCUMENTS AND ACRONYMS
2.1 Applicable Documents
Applicable documents contain higher-level information that is implemented in the current document. Examples include designs, plans, or standards.
AD[01] NEON.DOC.004300 EHS Safety Policy and Program Manual AD[02] NEON.DOC.004316 Operations Field Safety and Security Plan AD[03] NEON.DOC.000724 Domain Chemical Hygiene Plan and Biosafety Manual AD[05] NEON.DOC.050005 Field Operations Job Instruction Training Plan AD[06] NEON.DOC.000914 TOS Science Design for Plant Biomass, Productivity, and Leaf Area
Index AD[07] NEON.DOC.014051 Field Audit Plan
2.2 Reference Documents
Reference documents contain information that supports or complements the current document. Examples include related protocols, datasheets, or general-information references.
RD[01] NEON.DOC.000008 NEON Acronym List RD[02] NEON.DOC.000243 NEON Glossary of Terms RD[03] NEON.DOC.005003 NEON Scientific Data Products Catalog RD[04] NEON.DOC.001271 NEON Protocol and Procedure: Manual Data Transcription RD[05] NEON.DOC.001575 Datasheets for TOS Protocol and Procedure: Measurement of Leaf
Area Index RD[06] NEON.DOC.001398 NEON Raw Data Ingest Workbook for TOS Digital Hemispherical Photos RD[07] NEON.DOC.001236 NEON Algorithm Theoretical Basis Document: TOS Leaf Area Index -
QA/QC of Digital Hemispherical Photos RD[08] NEON.DOC.001718 TOS SOP: DSLR Camera Use and Settings
Title: TOS Protocol and Procedure: Measurement of Leaf Area Index Date: 9/16/2015
NEON Doc. #: NEON.DOC.014039 Author: Courtney Meier Revision: G
2014 NEON Inc. All rights reserved.
Page 3 of 58
2.3 Acronyms
Acronym Definition CV Coefficient of Variation DHP Digital Hemispherical Photo DOY Day of Year DSLR Digital Single Lens Reflex [camera] LAI Leaf Area Index NDVI Normalized Differential Vegetation Index (a proxy for vegetation greenness) PAI Plant Area Index
2.4 Definitions
N/A
3 METHOD
There are two high-level components to this LAI data collection protocol, which serve to capture LAI data across space and through time: 1) data are collected on the ground every 3 years from Distributed and Gradient plots, and these data are used in conjunction with AOP LAI data products to estimate LAI at the site scale; and 2) data are collected every two weeks from a subset of Tower plots (n=3) that will be used to construct a time-series dataset that will complement the spatially-extensive snapshot of LAI generated from AOP data.
The plotIDs for the Distributed and Gradient plots that will be used for LAI sampling will be provided by Science Operations. In order to speed data collection from Tower Plots, those plots permanently selected for LAI measurement should be the three plots that are closest to, or most readily accessed from, roads near the TIS Tower, as determined by Field Operations. For more details of the LAI spatial and temporal sampling strategy, see the Plant Biomass and Productivity Science Design (AD[06]).
Digital hemispherical photos are taken at 12 points within each of the specified plots, and these photo points radiate outward from the plot center in the cardinal directions (Figure 1). Collection of quality LAI data with a DHP system at each point-location is highly dependent on taking the hemispherical photos in appropriate light conditions, and on properly exposing the images. If vegetation is on average shorter than waist height (roughly 1 m), downward-facing images will suffice for a given plot (Table 8); the goal is to maintain a minimum distance of approximately 50 cm between the lens and the vegetation for the ‘average’ technician height. Otherwise, upward-facing images are also required to properly capture LAI for the plot. In the laboratory, image files are processed with imaging software to adjust image size and ensure that leaf elements are properly exposed. Sets of 12 images are then analyzed using LAI photo analysis software to generate plot-level and point-level LAI estimates.
Title: TOS Protocol and Procedure: Measurement of Leaf Area Index Date: 9/16/2015
NEON Doc. #: NEON.DOC.014039 Author: Courtney Meier Revision: G
2014 NEON Inc. All rights reserved.
Page 4 of 58
Figure 1. Distributed base plot (or 20 m x 20 m Tower plot) showing the location and spacing of DHP photo points relative to plot center; grey numbers represent subplotIDs. Spacing between points and number of points is the same for both 20 m x 20 m and 40 m x 40 m Tower plots, and photo points are always centered on the plot centroid.
A critical component of analyzing DHPs for LAI is the classification of pixels into plant and non-plant categories. In order to ‘calibrate’ pixel classification across different technicians, technicians performing the image analysis will analyze a standard set of images provided by Science Operations before proceeding to analyze additional images. The standard image set will be analyzed at least three times in order to calculate a coefficient of variation (CV) for the individual technician. The CV must be < 10%, and the mean LAI value produced by the technician with this standard image set must be within ± 10% of the LAI value provided for the standard image set before the technician may proceed to analyze additional images. The CV is calculated as follows:
Standard Operating Procedures (SOPs) in Section 7 of this document provide detailed step-by-step directions, contingency plans, sampling tips, and best practices for implementing this sampling procedure. To properly collect and process samples, field technicians must follow the protocol and associated SOPs. Use NEON’s problem reporting system to resolve any field issues associated with implementing this protocol.
The value of NEON data hinges on consistent implementation of this protocol across all NEON domains, for the life of the project. It is therefore essential that field personnel carry out this protocol as outlined in this document. In the event that local conditions create uncertainty about carrying out these steps, it is critical that technicians document the problem and enter it in NEON’s problem tracking system.
The procedures described in this protocol will be audited according to the Field Audit Plan (AD[07]). Additional quality assurance will be performed on data collected via these procedures according to the
Title: TOS Protocol and Procedure: Measurement of Leaf Area Index Date: 9/16/2015
NEON Doc. #: NEON.DOC.014039 Author: Courtney Meier Revision: G
2014 NEON Inc. All rights reserved.
Page 5 of 58
NEON Algorithm Theoretical Basis Document: TOS Leaf Area Index - QA/QC of Digital Hemispherical Photos (RD[07]).
4 SAMPLING SCHEDULE
4.1 Sampling Frequency and Timing
The frequency and timing of DHP image collection depends on whether Distributed/Gradient plots will be sampled, or whether Tower plots will be sampled (Table 1).
Table 1. Number of plots and frequency of sampling guidelines for DHP collection in Distributed/Gradient and Tower plots.
Plot type Plot Number Sampling Events Yearly Interval
Distributed plot n<=20 1X per sampling year Every 3 y. One site per domain per year
Gradient plot n<=5 1X per sampling year Every 3 y; sampled concomitantly with Distributed plots at a given site.
Tower plot n=3 * Every 2 weeks Annual
* Should sampling events for Distributed/Gradient plots and Tower plots overlap, simultaneous sampling may not be possible if sufficient camera bodies and fisheye lenses are not available. Should this event arise, prioritize sampling Distributed/Gradient plots over Tower plots.
Title: TOS Protocol and Procedure: Measurement of Leaf Area Index Date: 9/16/2015
NEON Doc. #: NEON.DOC.014039 Author: Courtney Meier Revision: G
2014 NEON Inc. All rights reserved.
Page 6 of 58
4.2 Criteria for Determining Onset and Cessation of Sampling
Onset and cessation of DHP image collection depends on whether Distributed/Gradient plots will be sampled, or whether Tower plots will be sampled (Table 2).
Table 2. Number of plots and sampling start/stop guidelines for DHP collection in Distributed/Gradient and Tower plots.
Plot type Plot Number Sampling Start Sampling Stop
Distributed plot n<=20
Start date must be chosen such that sampling is completed within a 1 month window that includes the AOP flight date (or beginning of flight date range)1
1 month after sampling Start Date.
Gradient plot n<=5 Same as Distributed plots Same as Distributed plots
Tower plot n=3 Start of growing season, as new leaves and needles become visible and begin to expand2
Whichever is first: 1. DOY > 305 (1st November) 2. Site-specific NDVI returns to pre-
growing-season level3 1 Provided the flight date (or range of possible dates) is confirmed and not subject to change more than ± 1 week. If no AOP flight is scheduled in a given year, postpone ground LAI sampling at Distributed and Gradient plots to the next year in which an AOP flight is scheduled. The annual schedule for AOP flights is provided by Science Operations, and Domain Managers should communicate with AOP managers to keep abreast of current flight plans. 2 Based on multi-year averages; dates provided by Field Operations. Field Operations may also rely on phenology observations made on the indicator individuals to inform start of LAI sampling. 3 Determined by Science Operations (Appendix C).
It is the responsibility of Field Operations to determine the exact timing of sampling within a given day.
4.3 Timing for Processing and Analysis
DHP images collected in the field may be processed for LAI with the selected software packages anytime after images have passed automated QA/QC tests. However, it requires approximately 30-60 min per plot to process and analyze the images (depending on whether 12 or 24 images were taken per plot), so it is good practice to process images as they are collected throughout the field season.
Title: TOS Protocol and Procedure: Measurement of Leaf Area Index Date: 9/16/2015
NEON Doc. #: NEON.DOC.014039 Author: Courtney Meier Revision: G
2014 NEON Inc. All rights reserved.
Page 7 of 58
4.4 Sampling Timing Contingencies
When unexpected field conditions require deviations from this protocol, the guidance provided here must be followed to ensure that basic data quality standards are met (Table 3).
Table 3. Contingency decisions.
Delay/Situation Action Outcome for Data Products
Hours
If 1) Delay interrupts data collection mid-plot: a) stop data collection for the plot, and delete any images taken; b) upon resuming, ensure light conditions are favorable; and c) repeat data collection for entire plot on the same day if possible.
A delay of hours can lead to poor light conditions for collection of LAI data. This can lead to overestimation or imprecise estimation of LAI.
If 2) Delay occurs between plots: a) Ensure light conditions are favorable for data collection; and b) resume data collection for next plot.
A delay of hours can lead to poor light conditions for collection of LAI data. This can lead to overestimation or imprecise estimation of LAI.
1-7 days
If 1) Delay interrupts data collection mid-plot: a) stop data collection for the plot, and delete any images taken; b) on the next possible sampling day within 7 days of the delay, ensure light conditions are favorable; and c) repeat data collection for the plot.
None
If 2) Delay occurs between plots: a) Return to the field ASAP; b ) ensure light conditions are favorable for data collection from an entire plot; and c) resume data collection for the next plot.
None
8+ days
If 1) Delay interrupts data collection mid-plot: a) stop data collection for the plot, and delete any images taken; b) skip sampling for current boutID and continue sampling as part of the next boutID.
Decreased sample size resulting in imprecise estimation of LAI.
If 2) Delay occurs between plots: a) skip sampling for current boutID and continue sampling as part of the next boutID.
Decreased sample size
Title: TOS Protocol and Procedure: Measurement of Leaf Area Index Date: 9/16/2015
NEON Doc. #: NEON.DOC.014039 Author: Courtney Meier Revision: G
2014 NEON Inc. All rights reserved.
Page 8 of 58
5 SAFETY
This document identifies procedure-specific safety hazards and associated safety requirements. It does not describe general safety practices or site-specific safety practices.
Personnel working at a NEON site must be compliant with safe field work practices as outlined in the Operations Field Safety and Security Plan (AD[02]) and EHS Safety Policy and Program Manual (AD[01]). Additional safety issues associated with this field procedure are outlined below. The Field Operations Manager and the Lead Field Technician have primary authority to stop work activities based on unsafe field conditions; however, all employees have the responsibility and right to stop their work in unsafe conditions.
Because DHP images are often collected in the field at dawn or dusk, it is advisable to bring a headlamp to aid navigation between plots.
Make sure headlamp is turned off during data collection!
Title: TOS Protocol and Procedure: Measurement of Leaf Area Index Date: 9/16/2015
NEON Doc. #: NEON.DOC.014039 Author: Courtney Meier Revision: G
2014 NEON Inc. All rights reserved.
Page 9 of 58
6 PERSONNEL AND EQUIPMENT
6.1 Equipment
The following equipment is needed to implement the procedures in this document. Equipment lists are organized by task. They do not include standard field and laboratory supplies such as charging stations, first aid kits, drying ovens, ultra-low refrigerators, etc.
Table 4. Equipment list – A team of two people collecting DHPs from a plot
Item No. R/S Description Purpose
Qua
ntity
*
Spec
ial
Hand
ling
Durable Items
MX100320 R Compass with mirror and declination adjustment Orient to image locations 1 N
MX104649 R DSLR camera body Capture DHP images 1 N
MX104654 R DSLR memory card (16 Gb minimum) Store and backup DHP images on camera 2 N
MX104651 R Fisheye lens Capture DHP images 1 N
MX100703 S GPS receiver, recreational accuracy Navigate to sampling location 1 N
MX101632 S Headlamp Hands-free lighting at dusk and dawn 2 N
S Laser rangefinder Measure overstory height 1 N
Title: TOS Protocol and Procedure: Measurement of Leaf Area Index Date: 9/16/2015
NEON Doc. #: NEON.DOC.014039 Author: Courtney Meier Revision: G
2014 NEON Inc. All rights reserved.
Page 10 of 58
Item No. R/S Description Purpose
Qua
ntity
*
Spec
ial
Hand
ling
S Microfiber or paper lens cleaning cloth Clean camera lens 1 N
S Wireless remote shutter release (Vello FreeWave Plus for Nikon or similar)
Remotely focus camera and trip shutter release 1 N
Consumable items
S AA battery Spare battery for GPS receiver
MX104653 R EN-EL15 lithium ion battery Spare battery for DSLR camera 2 N
MX104659 R Camera bag Protect DSLR camera body and lenses 1 N
MX104736 R Camera monopod Hold camera steady away from body 1 N
Resources
RD[05] R Datasheet LAI field Record sampling event metadata Varies N
R/S=Required/Suggested
Title: TOS Protocol and Procedure: Measurement of Leaf Area Index Date: 9/16/2015
NEON Doc. #: NEON.DOC.014039 Author: Courtney Meier Revision: G
2014 NEON Inc. All rights reserved.
Page 11 of 58
Table 5. Equipment list –Transferring DHPs from the camera to the server, and handling field-collected sampling metadata
Item No. R/S Description Purpose
Qua
ntity
Spec
ial
Hand
ling
Durable items
MX104654 R DSLR memory card Contains field-collected DHPs 2 N
MX104657 R DSLR memory card reader Transfer images from memory card to Domain Support Facility temporary storage following sampling event 1 N
Resources
RD[05] R Completed LAI field datasheets Contains field-collected DHP metadata Varies N
R Disk storage Available disk space to temporarily store and backup images before they are transferred to the NEON Data Center 1 N
R/S=Required/Suggested
Title: TOS Protocol and Procedure: Measurement of Leaf Area Index Date: 9/16/2015
NEON Doc. #: NEON.DOC.014039 Author: Courtney Meier Revision: G
2014 NEON Inc. All rights reserved.
Page 12 of 58
Table 6. Equipment list – Processing DHPs. Note that software will be made available by the NEON IT and CI teams, and will not be locally installed by Domain Managers or technicians.
Item No. R/S Description Purpose
Qua
ntity
*
Spec
ial
Hand
ling
Resources
R Adobe Photoshop (version CS5 or CS6 are suitable) Perform batch resize, shadow adjust, format conversion 1
R CanEye (current version) with associated Matlab libraries Calculate plot and point-level LAI from JPG images 1
R/S=Required/Suggested
Title: TOS Protocol and Procedure: Measurement of Leaf Area Index Date: 9/16/2015
NEON Doc. #: NEON.DOC.014039 Author: Courtney Meier Revision: G
2014 NEON Inc. All rights reserved.
Page 13 of 58
6.2 Training Requirements
All technicians must complete required safety training and protocol-specific training for safety and implementation of this protocol as required in Field Operations Job Instruction Training Plan (AD[05]). Technicians must also be trained to configure, use, and care for the DSLR system when acquiring high-quality hemispherical photos.
Technicians should be trained to properly use a mirror-site compass, including looking up and setting the appropriate declination. Declination changes with time at each site, and should be looked up annually at http://www.ngdc.noaa.gov/geomag-web/. Additionally, being able to repeatedly pace off accurate distances in the field will speed collection of LAI data considerably, compared to laying out a meter tape in two directions for guidance at each plot.
Finally, technicians must be trained to process DHP image files with required software packages. Before technicians analyze any DHP images, image processing technique must be evaluated according to the QA criteria in Section 5 on a per technician basis using standard image sets provided by Science Operations.
6.3 Specialized Skills
For image acquisition in the field, it is required that one technician have a proficient, working knowledge of manual image exposure, and evaluation of image exposure with the specified camera hardware. Technicians must become familiar with camera hardware and techniques to obtain proper image exposure prior to data collection in the field.
For analysis of DHP images to calculate LAI, technician(s) must be able to distinguish between yellow, purple, and grey colors as these colors are used in image pixel classification. Prior to image analysis with the specified software, it must be verified that the technician is capable of analyzing images within specified QA/QC parameters (see Method section, above).
6.4 Estimated Time
The time required to implement a protocol will vary depending on a number of factors, such as skill level, system diversity, environmental conditions, and distance between sample plots. The timeframe provided below is an estimate based on completion of a task by a skilled two-person team (i.e., not the time it takes at the beginning of the field season). Use this estimate as framework for assessing progress. If a task is taking significantly longer than the estimated time, a problem ticket should be submitted.
Taking a set of upward- and downward-facing DHPs: Approximately 15 minutes or less per plot.
Exposure adjustment with imaging software: Approximately 10 minutes or less for a batch of 12 upward- or downward-facing images from a plot.
Title: TOS Protocol and Procedure: Measurement of Leaf Area Index Date: 9/16/2015
NEON Doc. #: NEON.DOC.014039 Author: Courtney Meier Revision: G
2014 NEON Inc. All rights reserved.
Page 14 of 58
Analysis of DHP images for LAI with specialty-purpose software: Approximately 20 minutes, and no more than 30 minutes, to analyze a batch of 12 upward- or downward-facing images from a plot. These time estimates are based on the current selected software (CanEye), and assume the software does not crash, and will allow you to analyze 12 images at once. Should the software crash, the time required will increase.
Title: TOS Protocol and Procedure: Measurement of Leaf Area Index Date: 9/16/2015
NEON Doc. #: NEON.DOC.014039 Author: Courtney Meier Revision: G
2014 NEON Inc. All rights reserved.
Page 15 of 58
7 STANDARD OPERATING PROCEDURES
SOP A Preparing for Sampling
1. Prepare equipment and materials as specified in Table 4. 2. Configure the DSLR for DHP image acquisition according to settings below (Table 7). More
detailed instructions are included in the TOS SOP: DSLR Camera Use and Settings (RD[08]).
Table 7. Desired Nikon DSLR settings for collecting DHPs in the field. Details in the ‘How to Change’ field are specific to the Nikon D800/D810; for additional camera models see RD[08].
Camera Parameter Desired Setting How to Change
Image quality RAW, compressed Bit-depth = 12
“QUAL” button, primary wheel
White balance Auto (A) “WB” button, primary wheel
Shutter Mode Single shot (S) Left knob, outer ring
Metering Mode Matrix Back knob, upper-right
Focus Mode Auto-area Auto Focus (AF-S auto) Focus switch/button, primary and secondary wheels
Playback display options Overview Playback Menu
File naming DXX (where XX is NEON Domain number) Shooting Menu
Color space sRGB Shooting Menu
Active D-lighting Auto Shooting Menu
High ISO NR Normal Shooting Menu
ISO sensitivity settings
Auto-ISO sensitivity control = ON; Maximum sensitivity = Hi2; Minimum shutter speed = 1/30
Shooting Menu
Time Zone and Date
Time Zone = Domain specific Date and Time = Current local (24h format) Date Format = Y/M/D Daylight Savings = current local
Setup Menu
Card options Save images to both cards simultaneously Shooting Menu
Title: TOS Protocol and Procedure: Measurement of Leaf Area Index Date: 9/16/2015
NEON Doc. #: NEON.DOC.014039 Author: Courtney Meier Revision: G
2014 NEON Inc. All rights reserved.
Page 16 of 58
A.1 Scheduling the field day
The following timing considerations arise with respect to collecting high-quality LAI data on a given day:
• DHP images should not be collected when water droplets will form on the lens (i.e. it is raining, misting, there is heavy condensation, etc.). Check the local weather forecast prior to initiating field work to ensure that data collection will be possible.
• Upward-facing DHPs must only be collected when direct sunlight is NOT visible on the foliage. That is, upward facing images may be acquired during an approximately 45 min period at dawn or dusk, or any time during the day when it is sufficiently overcast such that a person does not cast a visible shadow. Sites at extreme latitude may not experience traditional sunrise/sunset during summer months, see guidelines in Appendix F.
• Downward-facing DHPs may be collected either with or without sunlight on the foliage. However, target times of day to avoid situations that generate deep shadows. If possible, select overcast or mid-day conditions when shadows are minimal. DO NOT take downward-facing images either before the sun has come up or after the sun has set. Shadows and low-light make it difficult to distinguish green from brown colors during image analysis.
• On a given measurement day, plan on arriving at the location of the first plot to be measured at least 20 minutes before light conditions are appropriate.
A.2 Prepare equipment
The following preparatory actions may need to be taken: • Micro-fiber lens cleaning cloth: Clean soiled cloth if necessary. • DSLR fisheye lens: Clean with lens cloth if necessary. • DSLR batteries: Charge. • DSLR memory card: Check that any images on memory card are backed up, and empty memory
o Declination changes with time and should be looked up annually per site: http://www.ngdc.noaa.gov/geomag-web/
• Meter tape: Calibrate technician pacing: determine # paces equivalent to 4 m (distance between photo points). o Being able to repeatedly pace off accurate distances in the field will speed collection of LAI
data, compared to laying out a meter tape in two directions for guidance at each plot. • LAI field datasheets (RD[05]): Print.
o The LAI field datasheet is provided as a companion document, and is intended as an interim data collection medium until a PDA application is available.
Title: TOS Protocol and Procedure: Measurement of Leaf Area Index Date: 9/16/2015
NEON Doc. #: NEON.DOC.014039 Author: Courtney Meier Revision: G
2014 NEON Inc. All rights reserved.
Page 17 of 58
SOP B Field Sampling: Preparing to Collect DHPs from a Plot
• Keep an eye on lighting conditions. They may change while images are being acquired. • Place backpacks and other gear outside the plot and out of the potential field of view of the
camera. • Record header data on the LAI field datasheet (RD[05])
o boutNumber = a two digit number assigned by Field Operations. For Tower plots, boutNumber starts over with boutNumber = 01 at the beginning of each sampling season, and increments sequentially throughout the season each time the designated Tower plots are photographed. For Distributed/Gradient plots, always assign boutNumber = 00.
B.1 Determining camera orientation and height
• To decide which combination of camera orientation and camera position are required for a given plot, visually survey the vegetation structure in the entire plot and refer to Table 8.
• The camera orientation and camera position may change throughout the year for a given plot if fast-growing herbaceous plants are present – e.g. in tall-stature grasslands, croplands, etc.
• Record the following in the LAI field datasheet (RD[05]). o understoryHeight = visually estimated average understory height for the entire plot,
recorded to the nearest 0.1 m o overstoryHeight = visually estimated average overstory height for the entire plot, recorded
to the nearest 1 m (Note: A rangefinder may be used for this purpose, but is optional, as the accuracy is not required for this measurement).
Table 8. Guidelines for determining proper camera positioning when taking DHPs.
Understory Vegetation1
Overstory Vegetation
Required Camera Orientations Camera Position(s)2
Protocol Reference
Majority < 0.75–1m height None Single downward-facing
photo per point Shoulder height SOP C
Majority > 0.75–1m height
None, or Majority < 3 m height
Single upward-facing photo per point Ground level SOP D
Majority < 0.75–1m height
Majority > 3 m height
Upward and downward-facing photos per point Shoulder height SOP C &
SOP D
Majority > 0.75–1m height
Majority > 3 m height
Two upward-facing photos per point
Shoulder height and ground level SOP C
Title: TOS Protocol and Procedure: Measurement of Leaf Area Index Date: 9/16/2015
NEON Doc. #: NEON.DOC.014039 Author: Courtney Meier Revision: G
2014 NEON Inc. All rights reserved.
Page 18 of 58
1 >50% of vegetation is characterized by the specified height criteria. For shoulder height camera position, height criteria is based on desired 50 cm minimum distance of vegetation from the camera lens. 2 See Figure 6 for an example of a researcher holding a camera at shoulder height
Title: TOS Protocol and Procedure: Measurement of Leaf Area Index Date: 9/16/2015
NEON Doc. #: NEON.DOC.014039 Author: Courtney Meier Revision: G
2014 NEON Inc. All rights reserved.
Page 19 of 58
SOP C Field Sampling: Downward-Facing DHPs
C.1 Image acquisition guidelines
Configure the camera for acquiring downward-facing DHPs according to the settings specified in Table 9. Consult RD[08] for detailed instructions on how to configure the DSLR.
Table 9. Camera settings for downward-facing DHPs
Camera Position
Exposure Mode Focus ISO Shutter Aperture
Shoulder height
Aperture priority (A)
Auto-area Auto Focus
ISO-auto = ON Initial = 100
Open no longer than 1/30 s
≥ f/8 best, no lower than f/4
• Take DHPs along the cardinal axes that bisect the plot in the following sequence (Figure 1): o 1st : North axis o 2nd: East axis o 3rd: South axis o 4th: West axis
• Along each cardinal plot axis, always take DHPs at photo-points in the following sequence Figure 1): o 1st: 2m photo-point o 2nd: 6m photo-point o 3rd: 10m photo-point
• Keep the camera lens pointed perpendicular to the ground at all times. If the terrain at an individual photo-point is sloped, tilt the camera so that the photo is taken as close to perpendicular to the slope as possible.
Title: TOS Protocol and Procedure: Measurement of Leaf Area Index Date: 9/16/2015
NEON Doc. #: NEON.DOC.014039 Author: Courtney Meier Revision: G
2014 NEON Inc. All rights reserved.
Page 20 of 58
C.2 Taking downward-facing DHPs
1. Use a declination-corrected mirror-sight compass and calibrated pacing to locate the target photo point. • Make sure that no ferrous metal objects are within at least 50 cm of the compass at all
times. 2. Orient the camera lens perpendicular to the cardinal axis at shoulder height, and visually assess
the distance between the lens and the vegetation. Foliage should be ≥ 50cm from the lens; if foliage is < 50cm from the lens: a. Select an alternate spot as close as possible to the designated photo-point
• Alternate point should be ≤ 1 meter from the designated photo-point
b. If (a) is not possible at ≥ 50% of points, consider taking upward-facing photos (SOP D) instead of downward-facing photos.
If foliage is < 50 cm from the camera lens, select an alternative location as close to the photo point as possible.
3. Adjust the camera for proper image exposure: a. Look through the viewfinder while aiming the lens at the ground. Looking through the
viewfinder ensures the camera is metering the scene you want to record, and allows you to observe how changes in f/stop affect shutter speed.
b. Push the shutter-release button half-way until a “beep” ” is heard, indicating the camera has achieved focus lock and has determined the correct shutter speed.
c. To maintain the greatest depth of field without sacrificing image quality, adjust the f/stop value so it is as high as possible, while not allowing the shutter to be open longer than 1/30 second. ISO values should not exceed 12800.
4. Place the monopod at shoulder height with the lens facing down. 5. Stand on the cardinal axis at the selected photo location. To minimize inclusion of trampled
vegetation in the photo, point the camera/monopod perpendicular to the cardinal axis (either direction). • Choose a direction so that the photographer’s shadow is minimized in the image.
6. Keep the camera so that the lens is as close to perpendicular to the ground as possible. 7. Focus the lens every time you change camera position. Press the shutter release button half
way. You should hear a “beep” indicating the camera has achieved focus lock. 8. Carefully press the shutter release button the rest of the way to take the photo. 9. Check the photo for quality:
• Make sure the image is not blurry. • Check that appropriate shutter speed and f/stop values were obtained. • Make sure the exposure is such that vegetation is clearly distinguishable from soil or litter.
Title: TOS Protocol and Procedure: Measurement of Leaf Area Index Date: 9/16/2015
NEON Doc. #: NEON.DOC.014039 Author: Courtney Meier Revision: G
2014 NEON Inc. All rights reserved.
Page 21 of 58
• If necessary, delete and re-shoot until a satisfactory image is taken (see Figure 2). • If it is not possible to obtain an image with f/stop > 4, with ISO ≤ 12800, and with the
shutter open less than 1/30 s, collect DHPs when more light is available. Unlike upward-facing DHPs, downward-facing DHPs may be taken with direct sunlight on the foliage.
10. Fill out the LAI field datasheet as images are acquired so that sampling metadata and image file data may be linked to specific pointIDs and plotIDs.
• pointID = A value derived from the cardinal direction of the plot axis (i.e. N, S, E, W) plus the distance from the plot-center to the photo-point in meters. Examples: N2, E10, etc.
• cameraOrientation = A categorical indicator; for downward-facing images, assign ‘D’ • cameraPosition = A categorical indicator; for images taken at shoulder height, assign ‘S’ • imageType = A categorical indicator classifying the photo subject matter; assign ‘U’ for
understory. Record “U” for all downward-facing images, even if there is no overstory vegetation (e.g. grassland, cropland).
• imageFileNumber = the numeric portion of the file name automatically generated by the camera. o Example: Record ‘0492’ for an image named ‘D05_0492.NEF’ by the camera.
11. Proceed to the next photo-point, and return to step 1.
Figure 2. Example of a properly exposed downward-facing DHP at the D01 Harvard Forest site (photo by B. Chemel). Note that green leaves are clearly distinguishable from soil and litter. It is normal for a technician’s feet and a portion of the legs to be included in the photo. These will be masked out during image analysis.
Title: TOS Protocol and Procedure: Measurement of Leaf Area Index Date: 9/16/2015
NEON Doc. #: NEON.DOC.014039 Author: Courtney Meier Revision: G
2014 NEON Inc. All rights reserved.
Page 22 of 58
SOP D Field Sampling: Upward-Facing DHPs
D.1 Image acquisition guidelines
Configure the camera for acquiring upward-facing DHPs according to the settings specified in Table 10. Consult RD[08] for detailed instructions on how to configure the DSLR. These settings allow as much light as possible to be recorded by the camera while still enabling capture of a “good” quality image. Guidelines for modifying these settings are provided in the SOP below.
Table 10. Initial camera settings for upward-facing DHPs. Settings may be adjusted after a test image is acquired
Camera Placement
Exposure Mode Focus ISO Shutter Aperture
Shoulder height Manual (M) Manual, set to “∞” ISO-auto = OFF Initial = 400 1/30 s f/8
Ground level Manual (M) Auto-area Auto Focus ISO-auto = OFF Initial = 400 1/30 s f/8
• Take DHPs along the cardinal axes that bisect the plot in the following sequence (Figure 1): o 1st : North axis o 2nd: East axis o 3rd: South axis o 4th: West axis
• Along each cardinal plot axis, always take DHPs at photo-points in the following sequence (Figure 1): o 1st: 2m photo-point o 2nd: 6m photo-point o 3rd: 10m photo-point
• Keep the camera perpendicular to the ground at all times. If the terrain at an individual photo-point is sloped, tilt the camera so that the photo is taken as close to perpendicular to the slope as possible.
• When upward-facing photos are taken with the camera at ground level, minimize disturbance to the vegetation as the camera is placed into position.
Title: TOS Protocol and Procedure: Measurement of Leaf Area Index Date: 9/16/2015
NEON Doc. #: NEON.DOC.014039 Author: Courtney Meier Revision: G
2014 NEON Inc. All rights reserved.
Page 23 of 58
D.2 Taking Upward-Facing DHPs
1. Use a declination-corrected mirror-sight compass and calibrated pacing to locate the target photo point. Make sure that no ferrous metal objects are within at least 50 cm of the compass at all times.
2. Find a position at or as close to the photo-point possible with distinct sky and foliage elements overhead and acquire a test image. The goal is to avoid saturating bright sky, and to maintain foliar elements as dark as possible – i.e., the image should show high contrast between leaves and sky, but without overly bright sky “bleeding through” and washing out small leaves and needles. a. Looking through the camera viewfinder, point the lens straight up toward the canopy, and
press the shutter-release button half way to activate the viewfinder light meter. b. With the lens still pointing up, adjust the f/stop, shutter speed, and ISO according to Table
11 until the built-in light meter (also know as the ‘exposure indicator’ in some camera models) indicates proper exposure).
c. Press the shutter-release button all the way down to take the test image.
Table 11. Strategy for optimizing image exposure while taking upward-facing DHPs in manual exposure mode.
Exposure Problem
Histogram Characteristics Optimization Steps (in order of preference)
Too much light Pixels “pile up” against right edge
Increase f/stop up to f/16 Decrease ISO to lowest numeric value (e.g., 100) Decrease time shutter is open.
Too little light
Large gap between brightest pixels and right edge
Increase ISO up to 12800 Decrease f/stop to f/4 If still unacceptable, light conditions are too poor.
3. Check the test image exposure results. a. Press the “Play” button on the back of the camera to review the test image in the large LCD
screen. b. Select the “histogram” view using the up/down arrow buttons.
• Always press “Play” to bring up the image and histogram, rather than viewing the histogram immediately after acquiring the image. The initial histogram generated WITHOUT first pressing “Play” is only an on-the-fly approximation of the true histogram; it is different than the histogram available in review mode and is not reproducible.
Title: TOS Protocol and Procedure: Measurement of Leaf Area Index Date: 9/16/2015
NEON Doc. #: NEON.DOC.014039 Author: Courtney Meier Revision: G
2014 NEON Inc. All rights reserved.
Page 24 of 58
c. Check the white saturation levels in the test image. Whites become saturated when the histogram is pushed too far to the right, and the bright parts of the image overflow the available luminance range. • Figure 3 and Figure 4 show histograms from a properly exposed image; although the
brightest pixels reach the right-most edge of the histogram, there is no significant peak of pixels, or “pile-up” at the right edge. It is also acceptable for a gap to exist between the brightest pixels and the right-most edge.
• Figure 5 shows a histogram from an overexposed image. If the exposure is too bright, the white peak will reach the right-most extent of the histogram, and pixels will “pile-up,” creating a peak at the right edge.
4. If necessary, adjust the exposure according to Table 11 and take another test image until a correctly exposed image is produced (Figure 3 and Figure 4). Tips for adjusting exposure: • Higher f/stops reduced light to the sensor, greater depth of field, more of the subject in
focus. • Shutter open for less time reduced light to sensor, better ability to “freeze” motion and
avoid blurriness associated with subject motion or camera shake. • Lower ISO sensor is less sensitive to light but image grain is less prominent; below ISO
12800, images will have fewer “noise” artifacts.
5. At the designated photo-point, briefly, orient the camera lens perpendicular to the ground, pointed upward, and visually assess the distance between the lens and the vegetation. Foliage should be ≥ 50cm from the lens. If foliage is < 50cm from the lens: a. Select an alternate spot within 1 m of the designated photo-point. b. If (a) is not possible, consult the “Troubleshooting” section of this SOP.
6. Stand at the selected photo location.
7. For upward-facing photos taken at ground level, minimize inclusion of areas with trampled vegetation near the cardinal axis by pointing the camera/monopod into undisturbed vegetation perpendicular to the cardinal axis (either direction).
8. Place the monopod either at shoulder height or on the ground (Figure 6).
9. Orient the camera so that the lens is as close to perpendicular to the ground as possible.
10. Press the shutter-release button carefully, to avoid moving the camera too much. The camera does not beep when the shutter-release button is pushed in manual focus mode.
11. Check the photo for quality: • Make sure histogram white saturation values are appropriate. • Make sure the image is not blurry. • Check that appropriate shutter speed and f/stop values were obtained. • Check that there is clear distinction between foliage and sky.
Title: TOS Protocol and Procedure: Measurement of Leaf Area Index Date: 9/16/2015
NEON Doc. #: NEON.DOC.014039 Author: Courtney Meier Revision: G
2014 NEON Inc. All rights reserved.
Page 25 of 58
• If necessary, delete and re-shoot until a satisfactory image is taken (see Figure 4). • If it is not possible to obtain an image with f/stop ≥ 4 and with the shutter open for less than
1/30 s, collect DHPs when more light is available.
12. Fill out the LAI field datasheet as images are acquired so that camera placement metadata and image file names may be linked to specific pointIDs and plotIDs.
• pointID = A value derived from the cardinal direction of the plot axis (i.e. N, S, E, W) plus the distance from the plot-center to the photo-point in meters. Examples: N2, E10, etc.
• cameraOrientation = A categorical indicator; for upward-facing images, assign ‘U’ • cameraPosition = A categorical indicator; values = ‘S’, ‘G’, or ‘O’; where S = shoulder height,
G = ground level, and O = other. • imageType = A categorical indicator classifying the photo subject matter; assign either ‘U’ or
‘O’, where U = understory and O = overstory. Use “U” for images taken at ground level, and “O” for upward-facing images taken at shoulder height.
• imageFileNumber = the numeric portion of the file name automatically generated by the camera. o Example: Record ‘0492’ for an image named ‘D05_0492.NEF’ by the camera
• remarks = for example, “no N2 image; impenetrable thicket”
13. Proceed to the next photo-point and return to step 1.
Figure 3. An example histogram from a properly exposed image. The red, green, and blue histograms are shown in their respective colors, and a combined luminance histogram is shown in white (the latter is shown on the Nikon DSLR).
Title: TOS Protocol and Procedure: Measurement of Leaf Area Index Date: 9/16/2015
NEON Doc. #: NEON.DOC.014039 Author: Courtney Meier Revision: G
2014 NEON Inc. All rights reserved.
Page 26 of 58
Figure 4. An example of a properly exposed upward-facing DHP, and its associated histogram. Note that the brightest pixels reach the right edge of the histogram, but there is no significant peak at the right.
Figure 5. An example image and histogram of an overexposed upward-facing DHP. Note that the brightest pixels “pile-up” into a peak at the right-most edge of the histrogram.
Title: TOS Protocol and Procedure: Measurement of Leaf Area Index Date: 9/16/2015
NEON Doc. #: NEON.DOC.014039 Author: Courtney Meier Revision: G
2014 NEON Inc. All rights reserved.
Page 27 of 58
Figure 6. A field researcher acquiring an upward-facing DHP with the monopod/camera ensemble held at shoulder height
D.3 Troubleshooting
Table 12. Common issues encountered during acquisition of upward-facing DHPs, and available solutions.
Issue Encountered Camera Placement Solution(s)
1) f/stop < 4 and 2) Shutter open longer than 1/30 s
Shoulder height or Ground level
Collect DHPs when more light is available, and ensure direct sunlight is NOT on the foliage.
Vegetation is < 50 cm from the lens at the photo point, and there is no location within 1 m of the photo point where vegetation is ≥ 50 cm from the lens.
Shoulder height, upward-facing
Preferred: Lower the camera height until foliage is ≥ 50 cm from the lens. Record alternate photo height in “remarks” column of field datasheet.
Second choice: Maximize the distance between the foliage and lens. Record alternate photo height and distance to foliage in “remarks” column of field datasheet.
Shoulder height, downward-facing Consider an upward-facing ground level photo
Vegetation is < 50 cm from the lens at the photo point. Ground level None. This issue cannot be avoided with DHPs
acquired under these conditions.
Title: TOS Protocol and Procedure: Measurement of Leaf Area Index Date: 9/16/2015
NEON Doc. #: NEON.DOC.014039 Author: Courtney Meier Revision: G
2014 NEON Inc. All rights reserved.
Page 28 of 58
SOP E Post-Field- Sampling Tasks
E.1 DHP handling
1. DHPs should be duplicated on each memory card in the camera. Copy images from one of the memory cards to the temporary storage location in the Domain Support Facility.
2. Use the field collected metadata to make sure the DHPs are organized into the following directories after they are copied:
\\...\YYYY\boutID\plotID\imageType
where:
• YYYY = the current year • boutID = XXXXZZ, where XXXX is the unique 4-letter NEON site code, and ZZ = bout # from
the LAI field datasheet; bout # = 00 for Distributed or Gradient plots. Field Operations is responsible for keeping track of and creating the correct bout # for Tower Plots.
• plotID = a separate sub-folder for images from each plot • imageType = a subfolder named either “understory” or “overstory”
3. Use Table 13 to determine the correct directory for each image type.
Table 13. Criteria for determining placement of DHP images within required file path and folder structure.
Camera Orientation Camera Position File Path
Downward Shoulder …\boutID\plotID\understory
Upward Ground …\boutID\plotID\understory
Upward Shoulder …\boutID\plotID\overstory
4. After successfully copying all of the images from the sampling event to the NEON Domain Lab temporary storage location, images files on the camera memory cards may be deleted.
Title: TOS Protocol and Procedure: Measurement of Leaf Area Index Date: 9/16/2015
NEON Doc. #: NEON.DOC.014039 Author: Courtney Meier Revision: G
2014 NEON Inc. All rights reserved.
Page 29 of 58
E.2 Data Handling
Transcribe field collected sampling and DHP metadata according to SOP H.1.
E.3 Refreshing the Sampling Kit
• Check battery levels on the DSLR; recharge if necessary. • Recharge batteries on the GPS unit. • Clean the micro-fiber cloth, if necessary.
E.4 Equipment Maintenance, Cleaning and Storage
• Clean the hemispherical lens with a clean micro-fiber cloth or paper lens cleaning tissue, if necessary.
Title: TOS Protocol and Procedure: Measurement of Leaf Area Index Date: 9/16/2015
NEON Doc. #: NEON.DOC.014039 Author: Courtney Meier Revision: G
2014 NEON Inc. All rights reserved.
Page 30 of 58
SOP F Batch Processing DHPs with Photoshop
Important: The following SOP should only be performed on DHP images that have passed through QA/QC tests described in the NEON DHP QA/QC Algorithm and Theoretical Basis Document (ATBD). Tests described in the ATBD will be carried out by the NEON CyberInfrastructure. Field Ops will receive an automatically generated report indicating when directories of DHPs have passed through the ATBD.
Once DHP images have been processed through the QA/QC ATBD (conducted on the Domain Lab server), DHPs in RAW image format (.NEF) must be resized, adjusted to improve visible detail in shadows, and converted to JPG format for analysis in CanEye.
F.1 Creating a Photoshop Batch Processing “Droplet”
In Photoshop, a “Droplet” is an icon onto which files can be dragged, dropped, and then processed according to a standard set of actions encoded in the Droplet. Following the instructions below, you will create a Droplet that processes DHP RAW files into JPG files with Quality = 10 (out of 100).
1. Login to the machine that runs Adobe Photoshop, and make available the file path that is used for DHPs copied from the camera.
2. Select a test image file – either upward or downward-facing. Create a test image by copying a DHP file to the Desktop.
• It is important that the test image is exposed similarly to the .NEF images for which processing is desired.
3. Open Adobe Photoshop. 4. Make sure the “Actions” pane is visible: from the drop-down menus click “Window → Action”
(Alt-F9). 5. Within the “Actions” pane, create a new set of actions by clicking the folder icon at the bottom
of the pane, and name the new action set “CanEye processing”. 6. Create a new action within the “CanEye processing” set by clicking the “Create New Action”
button at the bottom of the pane (post-it icon). 7. Name the new action “RAW to JPG Q10”. Click “OK” to begin recording the new action – from
this point onward, until you click the “Stop” button at the bottom of the Action pane, Photoshop will record everything you do as part of the new action.
• The “Q10” indicates the JPG files will be generated with quality set to 10 out of 100, which should be a relatively small, low-quality JPG image.
8. Open the test image file: “File → Open”
Title: TOS Protocol and Procedure: Measurement of Leaf Area Index Date: 9/16/2015
NEON Doc. #: NEON.DOC.014039 Author: Courtney Meier Revision: G
2014 NEON Inc. All rights reserved.
Page 31 of 58
9. In the “Camera RAW” plug-in that opens with the image, adjust the exposure using the sliders in Table 14 below. The goal is to obtain good tonal information and detail in darker areas of the image, and avoid losing information in any very bright, highly exposed portions of the image.
Table 14. Sliders and their effects in the “Basic” panel of Adobe Camera Raw1.
Slider Effect Reason to Use
Exposure Adjusts brightness of mid-tones to shadows
Image is underexposed across the tonal range
Contrast Adjusts contrast of mid-tones, some shadows, some highlights
Detail in a broadly mid-tone range are washed out
Highlights Manipulates tonal values for the upper ¼ of the image tonal range
Decreasing highlights can bring out detail in an overexposed sky
Shadows Manipulates tonal values for the lower ¾ of the image tonal range
Brings out color tones and detail previously cloaked in shadow
Whites Manipulates the very brightest white pixels in the image.
Image contains highly overexposed areas.
Blacks Manipulates the very darkest black pixels in the image.
Image contains deeply underexposed areas.
Clarity Adjusts contrast on image mid-tones, but not shadows and highlights
Improves the ability to discern fine details in the image.
1 Multiple droplets may be created in order to accommodate variation in image exposure for image sets taken at different times of day, or with different shadow strengths, etc.
10. To adjust the size of the photo, click the link at the bottom of the Camera RAW window that states the image size, and in the “Workflow Options” window that opens, make the following selections, then click “OK”:
Table 15. Image parameters
Parameter Desired Setting
Space sRGB IEC61966-2.1
Depth 8 bits/channel
Size 2048 x 1368 pixels (2.8 MP)
Resolution 240 pixels per inch
Sharpen for None; amount = standard
Title: TOS Protocol and Procedure: Measurement of Leaf Area Index Date: 9/16/2015
NEON Doc. #: NEON.DOC.014039 Author: Courtney Meier Revision: G
2014 NEON Inc. All rights reserved.
Page 32 of 58
11. In the Camera RAW window, click “Open Image” in the bottom-right. 12. Verify that the image has changed size by clicking “Image → Image size” from the drop-down
menus. Click “OK”. 13. Select “File → Save for web”, which will open a new “Save for Web & Devices” window. In the
top-right of this window, select “Quality = 10”. 14. Click “Save”, and save the image to the Desktop. 15. When saving is complete, click “Stop Recording” at the bottom of the Photoshop “Action” pane. 16. To create the Droplet, select “File → Automate → Create Droplet” and name the Droplet “RAW
to JPG Q10 [light condition]”; where [light condition] = dusk, strongShadowsDay, softShadowsDay, etc. (when unique light conditions arise for which existing droplets do not produce images with acceptable exposure, define the light condition in a useful manner; e.g. “dusk” may be broken out into “closedCanopyDusk” and “openCanopyDusk”. Note: camelCase has been suggested here as a naming convention to be consistent with data ingest sheets, but is not required.
17. Click “Save”. The Droplet can be saved to the Desktop for ease of use, or to any other location. 18. A new menu will appear requesting you to assign an Action to the Droplet. Select the Action that
you just created above. 19. Check the “Override action ‘Open’ commands” box. This ensures that Photoshop will batch
process photos without opening the Camera RAW plugin. 20. Set the destination folder.
a. First create a “Batch Output” folder on the Desktop. b. Select the “Batch Output” folder as the destination.
21. Check the “Override action ‘Save as’ commands” box. 22. Set the file naming scheme so that the original file names are preserved. 23. The Droplet will now be saved to your Desktop and be available for use.
F.2 Processing DHP Images with a Photoshop Droplet
1. To batch process a group of 12 RAW .NEF images from:
\\...\boutID\plotID\imageType\
First create a create a subfolder in “imageType” named “processed”.
2. Select .NEF photos from the “imageType” folder within Windows Explorer, and drag onto the Droplet. Processed JPG photos will appear in the “Batch Output” folder.
3. Check batch processed images to determine whether the Droplet created satisfactory JPGs (Table 16).
Title: TOS Protocol and Procedure: Measurement of Leaf Area Index Date: 9/16/2015
NEON Doc. #: NEON.DOC.014039 Author: Courtney Meier Revision: G
2014 NEON Inc. All rights reserved.
Page 33 of 58
Table 16. Details to examine in JPG images created via batch process from DHP RAW images.
Camera Orientation Potential Issue
Downward
Inability to distinguish green leaves from soil, litter, rocks, etc. in areas of strong shadow.
Inability to discern fine detail in mid-tones
Overexposed areas lacking tonal detail – i.e. photos of a grassland taken during the day. Difficult to distinguish green from other colors in everexposed areas.
Upward
Inability to distinguish green leaves from underexposed sky in areas of strong shadow.
Inability to discern fine detail in mid-tones
Inability to distinguish leaves from sky in overexposed areas
4. If processed images are satisfactory, move processed images from “Batch Output” to:
\\...\boutID\plotID\imageType\processed\
5. If processed images are unsatisfactory, create a Photoshop droplet (or use a different existing one) that will produce a quality test image, and re-process the batch of .NEF files. A subset of images may also be re-processed if desired.
Title: TOS Protocol and Procedure: Measurement of Leaf Area Index Date: 9/16/2015
NEON Doc. #: NEON.DOC.014039 Author: Courtney Meier Revision: G
2014 NEON Inc. All rights reserved.
Page 34 of 58
SOP G Analyzing JPG Images for Leaf Area Index with Caneye Software
Important: The following SOP should only be performed on DHP images that have passed through QA/QC tests described in the RD[07]. Tests described in the ATBD will be carried out by the NEON CyberInfrastructure team. Field Ops will receive an automatically generated report indicating when directories of DHPs have passed through the ATBD.
Once DHP images have been processed through the QA/QC ATBD, use CanEye software to analyze the overstory and understory photos from a given plot in separate batches. Note: Image processing cannot occur until images have been processed according to RD[07].
It is necessary to analyze a minimum of 8 distinct images per batch in CanEye. The software makes assumptions about the distribution of canopy gaps in the images, and these assumptions are violated when the image sample size drops below n=8. Images will first be analyzed in batches of n=12, and sample size will be reduced only if necessary (details on which images to exclude are provided below).
G.1 Starting and parameterizing CanEye
The following steps are performed each time images are analyzed in CanEye. Do not reuse existing parameter files from past sessions.
1. Login to the virtual machine on the Domain Lab server that runs CanEye image analysis software.
2. Launch CanEye using the “Run as Administrator” command. To do this, R-click on the CanEye program icon and select “Run as Administrator”.
3. From the menu bar, select “Hemispherical Images → RGB images”, and then select either “Upward” or “Downward,” depending on the type of images to be analyzed.
• The program may indicate “No directory selected” and return to the launch screen. This is a known bug, and if this happens, simply re-select the image type according to the step above, and a “Browse for Folder” window will appear.
4. Select the directory containing the JPG images to be analyzed. A “Can-Eye Parameterization” window will appear. The generalized directory path will be:
\\...\boutID\plotID\imageType\processed\
5. In the “comment” field, enter the following:
• boutID • plotID • “overstory” or “understory”, depending on imageType
Title: TOS Protocol and Procedure: Measurement of Leaf Area Index Date: 9/16/2015
NEON Doc. #: NEON.DOC.014039 Author: Courtney Meier Revision: G
2014 NEON Inc. All rights reserved.
Page 35 of 58
6. In the “Calibration Parameters” portion of the window, click “Create” under “Optical Center and Projection Function”. DO NOT reuse a pre-existing Calibration Parameter file. In the window that opens, enter the following values, then click “OK”:
Table 17. Creating the optical center and projection function for LAI analysis in CanEye.
Field Field Description Desired Value
Lines Pixel number corresponding to the image center (vertical direction)
Lines = (Total vertical pixel #)/2; Lines = 1363/2 = 681.5 for a 2048 x 1363 pixel JPG
Columns Pixel number corresponding to the image center (horizontal direction)
Columns = (Total horizontal pixel #)/2; Columns = 2048/2 = 1024 for a 2028 x 1363 pixel JPG
Projection Function Slope
The relationship between zenith angle (y-axis) and column pixel # (x-axis)
For an image with 2048 px showing a 180˚ zenith view: Slope = 180/1024 = 0.08789
7. Returning to the “Calibration Parameters” window, enter the following values, overwriting existing values where necessary:
• COI (Circle of Interest) = 75˚ • For “Angular Resolution”, Azimuth = 5˚
8. Enter the day-of-year (DOY) the images were collected. a. Obtain the correct date by checking the file creation date on one of the RAW (.NEF) image
files. b. Convert the date from YYYY-MM-DD format to DOY by checking: http://www-
air.larc.nasa.gov/tools/jday.htm 9. Enter the latitude (nearest 0.1 degrees) of the site at which images were collected. Latitude can
be estimated using Google Earth and the current version of the NEON site .kmz file. 10. Click “Save”. A window will open as the images are processed. 11. Click “Save” parameter file. 12. A grid of images will appear. Click “OK”, and proceed to “Image Masking” below.
G.2 Image Masking and Color Reduction
Ultimately, you will assign image pixels to three categories: green, sky/soil, and mixed. In this step, you will mask features in each DHP image that do not fit into these categories (see masking guidelines in Table 18).
Title: TOS Protocol and Procedure: Measurement of Leaf Area Index Date: 9/16/2015
NEON Doc. #: NEON.DOC.014039 Author: Courtney Meier Revision: G
2014 NEON Inc. All rights reserved.
Page 36 of 58
Table 18. Elements in each DHP that should be masked prior to LAI estimation with CanEye.
Camera Orientation Masking Guidelines
Downward
Mask “large”, vertically oriented trunks, boles, stems, or branches. Look at the edges of the photos for vertical stems.
Photographer’s feet, plot markers/flags, other objects that are neither litter/soil/rock nor green plant matter. For masking feet: if possible, use one mask applied across all images. Fewer masks make CanEye less likely to crash.
DO NOT mask understory leaves that are attached to overhanging branches.
Upward
Mask “large” trunks in each image.
Stop masking an individual trunk BEFORE it becomes difficult to discern trunk from branches and leaves.
Both
Stay within the boundary of the element being masked in order to avoid masking sky, soil, or green plant matter.
“Large” is relative: use time as a guide. Do not spend more than 1 min per image masking trunks.
TO CREATE MASKS USING CANEYE:
1. On the screen with the grid of open images, click the “Select” button at the bottom. Then click on the first image to which you want to apply masks, and click “Mask”.
2. Choose the first object to mask. a. L-click around the perimeter of the object to create the mask. b. R-clicking will close the mask polygon and complete the mask.
3. Continue masking objects in the selected image until: a. All “large” objects are masked, or b. 1 min has elapsed
4. Click “Done” in the bottom ribbon after masking is complete. You should return to the gridded display screen showing all the images in the set.
5. Repeat steps 1 through 4 for each image in the set, as needed. 6. Select “Done” from the bottom ribbon.
• A color reduction process bar appears. When processing is done, a new window opens. • Be patient… the processing takes time. When done, the “Class Definition” window opens. If
after 15 min this window does not open: o Proceed to step (7).
Title: TOS Protocol and Procedure: Measurement of Leaf Area Index Date: 9/16/2015
NEON Doc. #: NEON.DOC.014039 Author: Courtney Meier Revision: G
2014 NEON Inc. All rights reserved.
Page 37 of 58
o Otherwise, once the “Class Definition” window opens, proceed to step 8.
7. If CanEye has crashed, it appears to depend on the total amount of masked area, and/or the total number of masks created. The solution is to reduce the number of images analyzed, one at a time:
• Randomly remove an image from one of the 2m photo-points (i.e. N2, E2, S2, or W2) and return to step 1 under G.1, “Starting and parameterizing CanEye”.
• If the crash re-occurs, remove another randomly selected 2m photo-point image, and try again.
• You may remove the photos from all 4 of the 2m photo-points, but DO NOT analyze fewer than n=8 images.
• If images are removed from the analysis, record: o imageNumber: The number of DHP images used in the LAI analysis o remarks: Indicate which pointIDs were removed from the analysis
• If CanEye crashes with n=8 images, record: o laiPlot = ‘NA’ o remarks: ‘CanEye crash: no data’
8. In the “Class Definition” window, select “This Option” from the right-hand pane, and click “Done”.
• An array of images with a color grid on the right will appear. This is the “Classification Window”.
9. Set the colors used to represent pixels classified into “Soil” (or “Sky”) and “Green” classes. Colors are chosen so that they stand out in relation to background colors. To assign a color: a. Click on a category box (i.e. “Soil” or “Sky”, or “Green”). DO NOT click on either the round or
square radio buttons on either side of the box. A color strip window opens. b. Click on the desired color. The following colors provide good contrast with multiple
backgrounds:
• Soil/Sky = Yellow or Orange • Green = Purple
10. Proceed to either G.3 (Downward-facing image pixel classification) or G.6 (Upward-facing image pixel classification).
Title: TOS Protocol and Procedure: Measurement of Leaf Area Index Date: 9/16/2015
NEON Doc. #: NEON.DOC.014039 Author: Courtney Meier Revision: G
2014 NEON Inc. All rights reserved.
Page 38 of 58
G.3 Downward-facing image pixel classification
The procedures for processing downward- and upward-facing images, although similar, have some critical differences. To process upward-facing images, follow the procedure in G.6 (Upward-facing image pixel classification).
Pixel classification is an iterative process, in which you move back and forth classifying pixels into either the “Green” or “Soil” categories (Table 19). In these directions, we will begin with “Green” plant matter, but you may begin with soil if you prefer. See digital tutorial “Classifying Pixels” for a demonstration of assigning pixels to classes in CanEye.
Table 19. Guidelines for classifying pixels into “Green” and “Soil” categories in downward-facing images.
Pixel Category Qualifying Material
Green Live leaves, needles, green moss, and flowers
Other material capable of performing photosynthesis
Soil
Lichen, brown moss, litter, downed woody debris
Bare soil, rocks
Other material not capable of photosynthesizing
Senesced leaves (yellow, orange, brown) that are on the ground or still attached to stems.
G.4 Classifying pixels as green or soil
1. First, zero-out pre-classification of pixels into the “Soil” category. a. Click on the round radio button to the left of the “Soil” box. This opens the “Class Pre-
classification” window. b. In the “Class Pre-classification” window, move the “Brightness Index” option slider all the
way to the left, to a value of 0.000 c. Click “OK”.
2. L-click on one of the images in the grid; it does not matter which one. 3. Zoom in (L-click) on a leaf or dense leafy area in the image.
• Zoom in until individual pixels are clearly visible and the entire screen is filled with the leaf.
4. Select the radio button next to “Green.” 5. L-click on the lots of pixels in the image that are unambiguously plant matter (this should be
everything on your screen if you zoomed in on a leaf).
Title: TOS Protocol and Procedure: Measurement of Leaf Area Index Date: 9/16/2015
NEON Doc. #: NEON.DOC.014039 Author: Courtney Meier Revision: G
2014 NEON Inc. All rights reserved.
Page 39 of 58
• You do not need to be systematic in your L-clicking. By randomly clicking on pixels that are all part of the leaf, you will have selected a variety of the true colors that should be classified as “Green.”
6. R-click to apply the purple color to the selected pixels.
• CanEye automatically assigns all pixels in the entire set of images with the same color to the “Green” class.
• The category boxes (lower right) keeps a tally of the percent of pixels assigned to each class. • The color palette (upper right) shows the true colors placed into the “Green” class in the
region bounded by purple lines on three sides and a gray line on the bottom.
7. Zoom out to verify that your classification makes sense for the entire image. Use “Select All” to verify that it also makes sense for all the images in the set.
8. Repeat steps 2 through 7, zooming in on different parts of multiple images until all obvious and unambiguous plant leaf pixels are classified as “Green.”
9. After classifying the obvious/easy plant elements, classify the obvious and unambiguous soil elements. Proceed in the same manner as for plant matter (steps 2 through 8 above).
G.5 Strategies for classifying additional pixels
After classifying the easily identifiable plant and soil elements in an image set, finding additional pixels to classify can be difficult. The strategies below will aid in identifying and classifying additional pixels. See the digital tutorial “Classifying Pixels” for demonstrations on using these techniques. In general, it is best to err on the side of caution: Classify a pixel/color as “Mixed” rather than misclassify it as “Soil” or “Green”.
1. Look closely at the edges of foliage for pixels to assign to “Green” or “Soil” classes.
• Toggling back and forth between true colors and classified colors is a good way to locate unassigned pixels.
• Move your head (or angle of computer screen) to change the angle of your view – colors look a little different at different angles.
2. Use the color palette to identify colors to move from “Mixed” to either the “Green” or “Soil” class.
• For example, look at the colors in the “Green” class, then look for similar colors that are in the “Mixed” class. These are good candidates for colors to move in the “Green” class.
• Focus particularly on colors with red dots, as these represent the greatest number of pixels in the image set.
Title: TOS Protocol and Procedure: Measurement of Leaf Area Index Date: 9/16/2015
NEON Doc. #: NEON.DOC.014039 Author: Courtney Meier Revision: G
2014 NEON Inc. All rights reserved.
Page 40 of 58
3. Look at all the images in a set: There may be a group of easily classified pixels in one image that is not present in the other images.
4. Look at the color palette. Does anything look out of place? If yes, move it to the “Mixed” class, and be conservative.
5. Look carefully at commonly misclassified colors that are often mistakenly placed in the “Soil” or “Green” class (rather than “Mixed’). In particular:
• Greenish, even olive to drab olive colors in the “Soil” class. • Grays and browns in the “Green” class.
It may be helpful to toggle back and forth between true colors and classified colors to identify suspect areas.
6. To move a color that has been assigned to “Soil” or “Green” back to the “Mixed” class:
• Select round radio button next to “Mixed.” • L-click on suspect true color(s) in the color palette. • R-click. • Repeat as needed.
7. Determining when you are finished with pixel classification: a. Keep an eye on the percent of pixels assigned to the “Mixed” category. Once “Mixed” pixels
represent between 15%-20% of the total, classification is complete. b. Click “Done” at the bottom of the image grid. c. Click “Yes”.
• A series of computations occur. When computations are complete, the screen returns to the CanEye launch screen.
• LAI results from the image analysis are stored in a subfolder located in the folder with DHP images that was initially selected.
G.6 Upward-facing image pixel classification
The procedures for processing downward- and upward-facing images, although similar, have some critical differences. To process downward-facing images, follow the procedure in the “Downward-facing Image Pixel Classification” section.
Pixel classification is an iterative process, in which you move back and forth classifying pixels into either the “Green” or “Sky” categories (Table 20). In these directions, we will begin with “Green” plant matter, but you may begin with sky if you prefer. See digital tutorial “Classifying Pixels” for a demonstration of assigning pixels to classes in CanEye.
Title: TOS Protocol and Procedure: Measurement of Leaf Area Index Date: 9/16/2015
NEON Doc. #: NEON.DOC.014039 Author: Courtney Meier Revision: G
2014 NEON Inc. All rights reserved.
Page 41 of 58
Table 20. Guidelines for classifying pixels into “Green” and “Sky” categories in upward-facing images.
Pixel Category Qualifying Material
Green
Live leaves, needles, green moss, and flowers
Other material capable of performing photosynthesis
Twigs, branches, and “small” trunks that were not previously masked
Senesced leaves (yellow, orange, red, brown) still attached to living stems
Sky Open sky, clouds
G.7 Pre-classifying sky pixels
Classifying pixels in a set of upward-facing images begins with pre-classification of sky pixels. Pre-classification provides a first cut at classifying pixels as sky. The goal is to assign pixels that are CLEARLY and UNAMBIGUOUSLY sky to the “Sky” category. You will then refine the auto-classification performed in this step by manually classifying additional pixels.
1. L-click on one of the DHP images. 2. Zoom in on an area in the image that has lots of sky as well as some small branches and leaves.
• Zoom in until the image is only slightly pixelated and leaves and branches are still easily discerned -- two L-clicks is typically enough.
3. Click on the round radio button to the left of the “Sky” box. This opens the “class pre-classification” window.
4. On the “class pre-classification” window, move the “Brightness Index” option slider all the way to the right, for a value of 1.000.
• It is helpful to move the window so that it does not cover the DHP image.
5. Adjust the slider, moving it in small increments to the left.
• As you move the slider, pixels that are classified as “Sky” will be highlighted in orange (or whatever color you selected for the “Sky” class). Keep nudging the slider to the left.
• When it appears that pixels that are not sky (i.e., branches or leaves) are becoming orange, back off the slider and click “OK.”
Note: Once you click “OK” the “pre-classification” window can only be re-opened by clicking the “reset” button (on the bottom ribbon), which undoes all classifications.
6. Click “Display All” on the bottom ribbon. 7. Check that pre-classification produced satisfactory results for ALL images.
Title: TOS Protocol and Procedure: Measurement of Leaf Area Index Date: 9/16/2015
NEON Doc. #: NEON.DOC.014039 Author: Courtney Meier Revision: G
2014 NEON Inc. All rights reserved.
Page 42 of 58
G.8 Classifying pixels as green or sky
1. L-click on one of the images in the displayed grid; it does not matter which one. 2. Zoom in (L-click) on a leaf, dense leafy area, or stem in the image.
• Zoom in until individual pixels are clearly visible and the entire screen is filled with the selected plant matter.
3. Select the radio button next to “Green.” 4. L-click on the numerous pixels in the image that are unambiguously plant matter.
• If you zoomed in on a stem so that it fills the entire screen, you do not need to be systematic in your L-clicking. By randomly clicking on pixels that are all part of the stem, you will have selected a variety of the true colors that should be classified as “Green.”
• For dense leafy areas, you need to be more intentional with your L-clicking. The lighter/light gray pixels may be sky filtering through the leaves. If in doubt, do not classify a pixel as “Green,” leave it in the “Mixed” class. (See series of images on page 24 for an example of classifying pixels in a dense leafy area.)
5. R-click to apply the purple color to the selected pixels.
• CanEye automatically assigns all pixels in the entire set of images with the same color to the “Green” class.
• The category boxes (lower right) keep a tally of the percent of pixels assigned to each class. • The color palette (upper right) shows the true colors placed into the “Green” class in the
region bounded by purple lines on three sides and a gray line on the bottom.
6. Zoom out to verify that your classification makes sense for the entire image. Use “Select All” to verify that it also makes sense for all the images in the set.
7. Repeat steps 1 through 6, zooming in on different parts of the image until all obvious and unambiguous plant leaf pixels are classified as “Green.”
8. Check other images in the set to make sure all unambiguous elements in the set are classified as “Green”.
9. After classifying the obvious/easy plant elements, classify the obvious and unambiguous sky elements. Proceed in the same manner as for plant matter (steps 1 through 8 above).
Title: TOS Protocol and Procedure: Measurement of Leaf Area Index Date: 9/16/2015
NEON Doc. #: NEON.DOC.014039 Author: Courtney Meier Revision: G
2014 NEON Inc. All rights reserved.
Page 43 of 58
G.9 Strategies for classifying additional pixels
After classifying the easily identifiable plant and sky elements in an image set, finding additional pixels to classify can be difficult. The strategies below will aid in identifying and classifying additional pixels. See the digital tutorial “Classifying Pixels” for demonstrations on using these techniques. In general, it is best to err on the side of caution: Classify a pixel/color as “Mixed” rather than misclassify it as “Sky” or “Green”.
1. Look closely at the edges of foliage elements for pixels to assign to the “Green” or “Sky” classes.
• Toggling back and forth between true colors and classified colors is a good way to locate unassigned pixels.
• Compare the true colors of the unclassified pixels to those in the color palette. If they are not similar, then leave the pixels in the “Mixed” class.
2. Use the color palette to identify colors to move from “Mixed” to either the “Green” or “Sky” class if it seems to make sense. In particular look for:
• Bright/light grays to move into the “Sky class. • Dark greens, very dark greys, and black to move into the “Green” class. • Focus particularly on colors with red dots, as these represent the greatest number of pixels.
3. Look at the color palette. Does anything look out of place? If yes, move it to the “Mixed” class. 4. Look at all the images in a set: There may be a group of easily classified pixels in one image that
is not present in the other images. 5. Determining when you are finished with pixel classification:
a. Keep an eye on the percent of pixels assigned to “Mixed” category. Once it is down to 15% - 20%, classification is complete (Figure 7).
b. Click “Done” at the bottom of the image grid. c. Click “Yes”
• A series of computations occur. When they are done, the screen returns to the CanEye launch screen.
• LAI results from the image analysis are stored in a subfolder located in the folder with DHP images that was initially selected.
Title: TOS Protocol and Procedure: Measurement of Leaf Area Index Date: 9/16/2015
NEON Doc. #: NEON.DOC.014039 Author: Courtney Meier Revision: G
2014 NEON Inc. All rights reserved.
Page 44 of 58
Figure 7. Example of an upward-facing hemispherical image successfully classified into sky (orange) and plant material (purple). Grey represents ambiguous pixels in the “Mixed” category that the user has not classified.
Title: TOS Protocol and Procedure: Measurement of Leaf Area Index Date: 9/16/2015
NEON Doc. #: NEON.DOC.014039 Author: Courtney Meier Revision: G
2014 NEON Inc. All rights reserved.
Page 45 of 58
SOP H Data Entry and Verification
H.1 Field collected sampling and DHP metadata
The importance of thorough, accurate data transcription cannot be overstated; the value of the efforts in the field is only manifested once the data are properly entered for delivery to NEON’s end users.
As a best practice, field data collected on paper datasheets should be digitally transcribed within 7 days of collection or the end of a sampling bout (where applicable). However, given logistical constraints, the maximum timeline for entering data is within 14 days of collection or the end of a sampling bout (where applicable).
Before entering data, all personnel must read RD[04] for complete instructions regarding manual data transcription. Prior to entering data via a web user interface (webUI), each technician shall enter a plot (or subplot) of data from one bout into the protocol-specific webUI housed on the Training portal, as described in RD[04].
Protocol-specific instructions and the associated data ingest workbook for entering Digital Hemispherical Photo data can be found on the NEON intranet in the FSU-FOPs folder. Be sure to enter data for all plots sampled within a bout. If an entire bout is missed, no data need to be entered.
There are two data ingest tables associated with digital hemispherical photo for LAI data:
• perplot: Data and metadata recorded on a per plot, per bout basis. • perimagefile: Data and metadata linking DHP file names to plotID, pointID, camera orientation,
camera position, and image type.
1. Transcribe data from the header table and the left-most 5 columns on the LAI field datasheet into the perplot ingest table.
• Consult the digital hemispherical photo for LAI data ingest document (RD[06]) to determine appropriate values and formats for each field, and to see correctly formatted examples.
2. Transcribe remaining required data from the main table on the LAI field datasheet into the perimagefile ingest table.
H.2 LAI data derived from DHP images
Results from the CanEye image analysis are automatically stored in a subfolder within the “processed” folder created earlier. Data from the CanEye Excel output file are manually transcribed into the NEON Data Ingest Workbook for Digital Hemispherical Photos (RD[09]).
1. Navigate to the folder containing the CanEye output files:
2. Open the Excel file (.xls) that CanEye produced. There should be several tabs within this file. 3. Click on the “PAI, ALA” tab. These data are calculated LAI values for the entire plot.
Note: CanEye actually reports “PAI” – i.e. Plant Area Index – rather than LAI. PAI is roughly equivalent to LAI, but includes the contribution of non-leaf plant parts such as twigs, branches, and some trunks. In practice, LAI is rarely calculated, and PAI is reported and referred to as LAI.
4. Transcribe values from the “PAI, ALA” tab into the “plotLAI” field in the “lai_perPlot_in” table in the Ingest Workbook (RD[09]). Consult Table 21 to determine which values in the “PAI, ALA” tab are required (see Figure 8 for an example “PAI, ALA” tab).
Table 21. Guidelines for transcribing LAI output from the CanEye Excel file to the NEON Data Ingest Workbook.
Camera Orientation Vegetation Type Transcribed Value
Downward All Column = True PAI Row = CE V6.1
Upward
Forest overstory (> 3m average height for the plot)
Column = True PAI Row = CE V5.1
All others Column = True PAI Row = CE V6.1
5. Record the number of images CanEye analyzed in the “imageNumber” field in the perplot table.
6. Transcribe values from column C in the “P57 results” tab into the “pointLAI” field in the perpoint table in the Ingest Workbook (RD[09]). These data are calculated LAI values for each image (and hence each pointID).
• Assign the appropriate “pointID” value to each value of “pointLAI”. • To assign the correct “pointID” to values of “pointLAI,” use previously entered data from the
“imageFileNumber” and “pointID” fields in the perimagefile ingest table.
7. Once data have been transcribed from all plots for a given bout, create a .csv file for each ingest table containing only the newly entered data in that table. These .csv files will be processed by the NEON CYI team.
Title: TOS Protocol and Procedure: Measurement of Leaf Area Index Date: 9/16/2015
NEON Doc. #: NEON.DOC.014039 Author: Courtney Meier Revision: G
2014 NEON Inc. All rights reserved.
Page 47 of 58
Figure 8. Example CanEye output from the “PAI, ALA” tab. Values that may be transcribed are circled in red.
Title: TOS Protocol and Procedure: Measurement of Leaf Area Index Date: 9/16/2015
NEON Doc. #: NEON.DOC.014039 Author: Courtney Meier Revision: G
2014 NEON Inc. All rights reserved.
Page 48 of 58
8 REFERENCES
N/A
Title: TOS Protocol and Procedure: Measurement of Leaf Area Index Date: 9/16/2015
NEON Doc. #: NEON.DOC.014039 Author: Courtney Meier Revision: G
2014 NEON Inc. All rights reserved.
Page 49 of 58
APPENDIX A QUICK REFERENCES
A.1 Taking Hemispherical Images
1. Determine number and type(s) of images needed for sample plot. 2. Assess if lighting conditions are favorable. 3. Dawn/Dusk sampling
a. Dawn sampling: Start with upward-facing images b. Dusk sampling: Start with downward-facing images
4. Take test image to assess lighting conditions. Adjust camera settings as needed. 5. Begin on north axis, taking downward-facing photos at 2 m, 6 m, and 10 m. 6. Check each image for exposure. Delete and reshoot as needed. 7. Record pointID and other required information on datasheet. 8. Continue taking downward-facing images, moving sequentially to east, south, and then west
axes, always starting at the photo point closest to the plot origin. 9. Take images of other required cameraOrientation (if needed) and test image. 10. Begin on north axis, take pictures sequentially at 2 m, 6m, and 10 m and continue sequentially
to east, south, and then west axes. 11. Check white saturation, exposure, and focus of each image. Delete and reshoot as needed. 12. Record pointID and other required information on datasheet. 13. Transcribe datasheet and download camera images to NEON computer.
Title: TOS Protocol and Procedure: Measurement of Leaf Area Index Date: 9/16/2015
NEON Doc. #: NEON.DOC.014039 Author: Courtney Meier Revision: G
2014 NEON Inc. All rights reserved.
Page 50 of 58
APPENDIX B REMINDERS
B.1 Getting Ready for Image Collection
At least two days before field effort: Make sure…
Fisheye lens is clean and not scratched. Primary and backup batteries for camera are charged. Default camera settings are correct. See table below. Mirror-site compass is set to correct declination. Sample locations are uploaded to GPS. You can accurately pace 4 m. LAI Field QC datasheets are printed. All equipment is gathered and in working order.
B.2 Taking Quality Hemispherical Images
When you arrive at site: Make Sure…
Direct sunlight is NOT visible on foliage in upward facing images. It is not raining. Backpacks and other gear are placed outside the plot and out of view of the camera. There are no ferrous metal objects with 50 cm of the site-mirror compass. You’ve determined number and type of photographs needed.
B.3 When taking images: Check that…
Camera settings are correct. Downward-facing image: Aperture-priority mode, focus automatic Upward-facing shoulder height image: Manual exposure mode, focus manually set to infinity
(∞). Proper lighting conditions are present. Photos are taken in the correct order for the time of day Test photo indicates proper exposure. Images are taken sequentially at 2 m, 6 m, and 10 m from plot origin, beginning on the north
axis before proceeding to the photo-point locations on east, south, and west axes. Foliage is not within 50 cm of camera lens. Camera is held as close to perpendicular to ground surface as possible. Quality of every image is assessed immediately after taking it. Point ID and other required information are recorded on LAI field datasheet. Any deviations from protocol are described in notes section of datasheet.
Title: TOS Protocol and Procedure: Measurement of Leaf Area Index Date: 9/16/2015
NEON Doc. #: NEON.DOC.014039 Author: Courtney Meier Revision: G
2014 NEON Inc. All rights reserved.
Page 51 of 58
APPENDIX C ESTIMATED DATES FOR ONSET AND CESSATION OF SAMPLING
Temporally-intensive LAI sampling begins in Tower plots at the start of the growing season, as new leaves and needles become visible and begin to expand. Table 22 below, provides estimated Start and End Dates for LAI sampling in Tower plots based on MODIS-EVI phenology data, averaged for 2001-2009. The Peak Greenness field represents the date range during which AOP is expected to fly each site, and during which spatially-intensive LAI sampling in Distributed plots is expected to occur. An additional contingency for Distributed plot LAI sampling is that all plots should be measured within a 1 month window that includes the actual AOP flight date. See Appendix D for conversions from day of year to Gregorian date.
Table 22. Site-specific sampling start and end dates for LAI timecourse sampling in Tower plots, and peak greenness sampling date ranges for spatially-intensive Distributed plot LAI sampling. All dates are provided in day-of-year format.
Mediterranean system: End Date and Peak Greenness dates are in same growing season as Start Date, but next calendar year. Start and End dates are variable, pay attention to within year phenology.
SOAP 90 290 155-185 TEAK 120 300 180-205
18 BARO 175 220 195-210 TOOL 160 240 185-205
19
DEJU 130 250 170-210 HEAL 135 245 180-210 POKE 135 250 180-205 BONA 135 250 165-200
20
OLAA 0 365 NA Year-round Tower plot sampling; no peak greenness.
PUFO 0 365 NA Year-round Tower plot sampling; no peak greenness.
PUGR 0 365 NA Year-round Tower plot sampling; no peak greenness.
Title: TOS Protocol and Procedure: Measurement of Leaf Area Index Date: 9/16/2015
NEON Doc. #: NEON.DOC.014039 Author: Courtney Meier Revision: G
2014 NEON Inc. All rights reserved.
Page 54 of 58
APPENDIX D DAY OF YEAR CALENDARS
D.1 Day of Year Calendar for Non-Leap Years
Title: TOS Protocol and Procedure: Measurement of Leaf Area Index Date: 9/16/2015
NEON Doc. #: NEON.DOC.014039 Author: Courtney Meier Revision: G
2014 NEON Inc. All rights reserved.
Page 55 of 58
D.2 Day of Year Calendars for Leap Years
Title: TOS Protocol and Procedure: Measurement of Leaf Area Index Date: 9/16/2015
NEON Doc. #: NEON.DOC.014039 Author: Courtney Meier Revision: G
2014 NEON Inc. All rights reserved.
Page 56 of 58
APPENDIX E DATASHEETS
The following datasheets are associated with this protocol:
Table 23. Datasheets associated with this protocol
NEON Doc. # Title NEON.DOC.001575 Datasheets for TOS Protocol and Procedure: Measurement of
Leaf Area Index NEON.DOC.001398 NEON Raw Data Ingest Workbook for TOS Digital
Hemispherical Photos
These datasheets can be found in Agile or the NEON Document Warehouse.
Title: TOS Protocol and Procedure: Measurement of Leaf Area Index Date: 9/16/2015
NEON Doc. #: NEON.DOC.014039 Author: Courtney Meier Revision: G
2014 NEON Inc. All rights reserved.
Page 57 of 58
APPENDIX F SITE-SPECIFIC INFORMATION
Domain Number Site ID Specific Issues Solutions
01 BART BURL HARV
02 BLAN SCBI SERC
03 DSNY JERC OSBS
04 GUAN LAJA
05 STEI TREE UNDE
06 KONA KONZ KUFS
07 GRSM MLBS ORNL
08 CHOC DELA TALL
09 DCFS NOGP WOOD
10
CPER RMNP
STER Herbicide application kills plants Do not alter photo strategy due to
herbicide application. Important for dataset to contain zero LAI points.
11 CLBJ
KLEM
Title: TOS Protocol and Procedure: Measurement of Leaf Area Index Date: 9/16/2015
NEON Doc. #: NEON.DOC.014039 Author: Courtney Meier Revision: G
2014 NEON Inc. All rights reserved.
Page 58 of 58
Domain Number Site ID Specific Issues Solutions
12 YELL
13 MOAB NIWO
14 JORN SRER
15 ONAQ
16 ABBY WREF
17 SJER SOAP TEAK
18
BARO Sun may not set during summer months.
Upward-facing photos: Light is as indirect as possible.Take photos as late or early in the day as is feasible, avoid photos with the sun directly behind foliage. Downward-facing photos: Light must be strong enough to differentiate greens from browns; avoid strong shadows if possible.


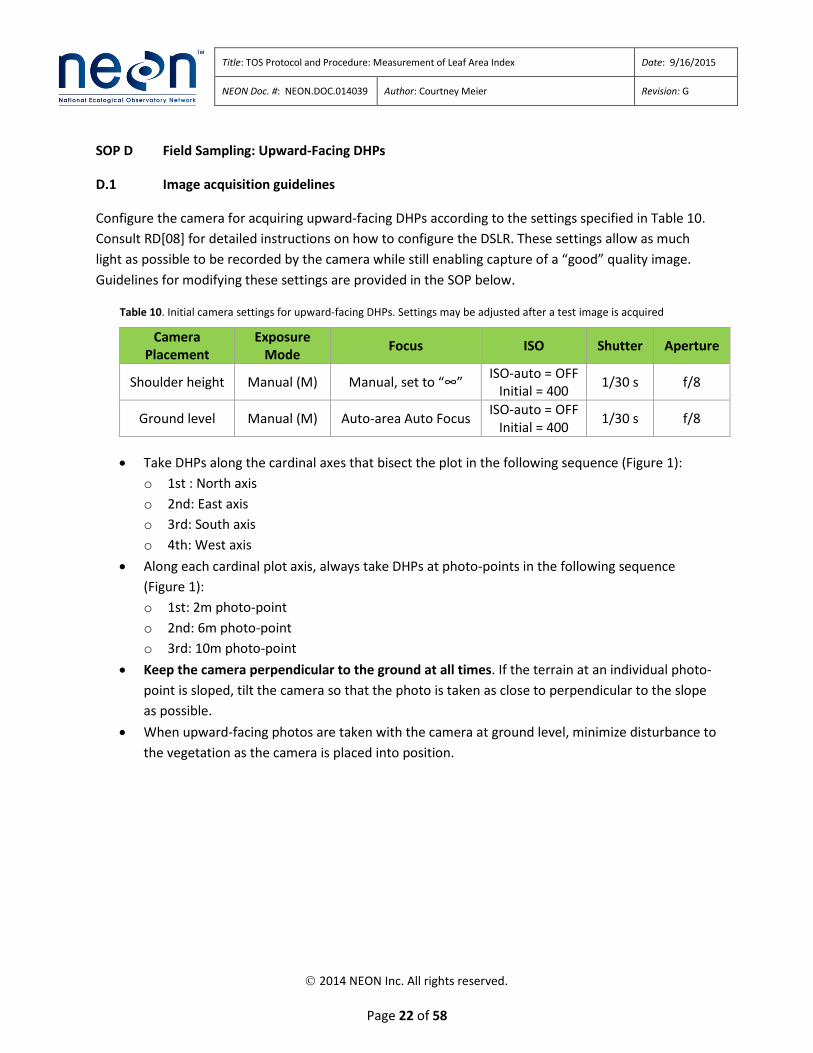
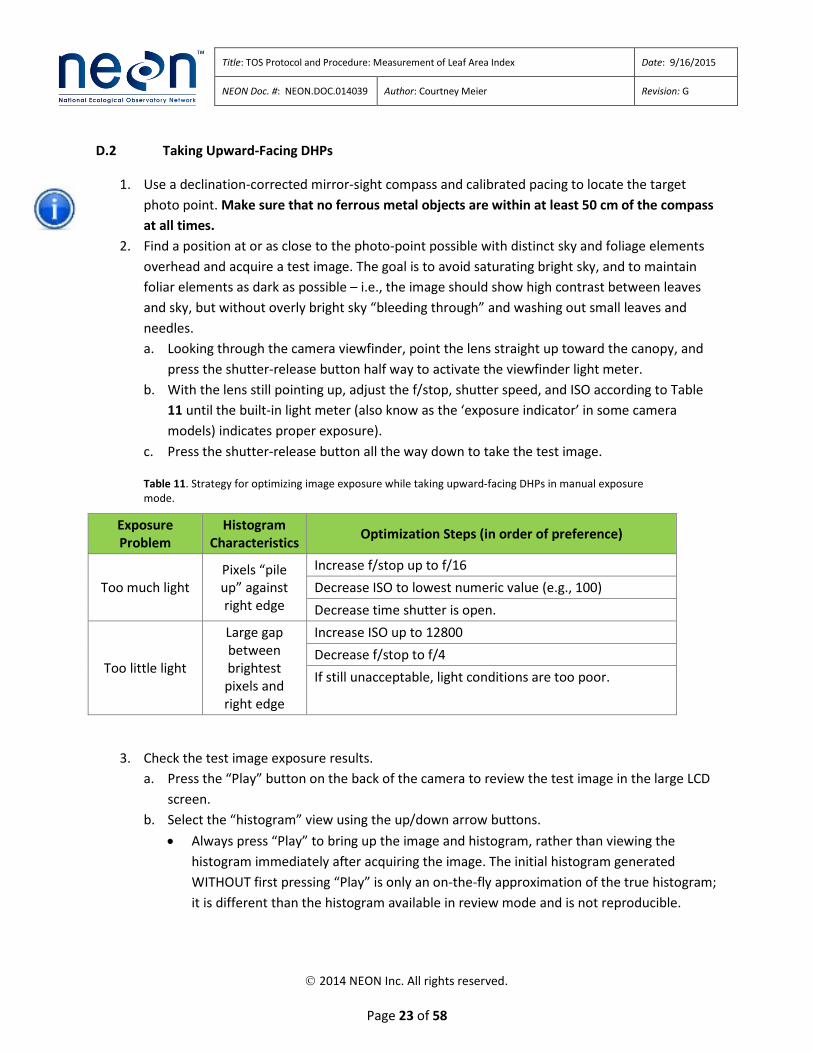


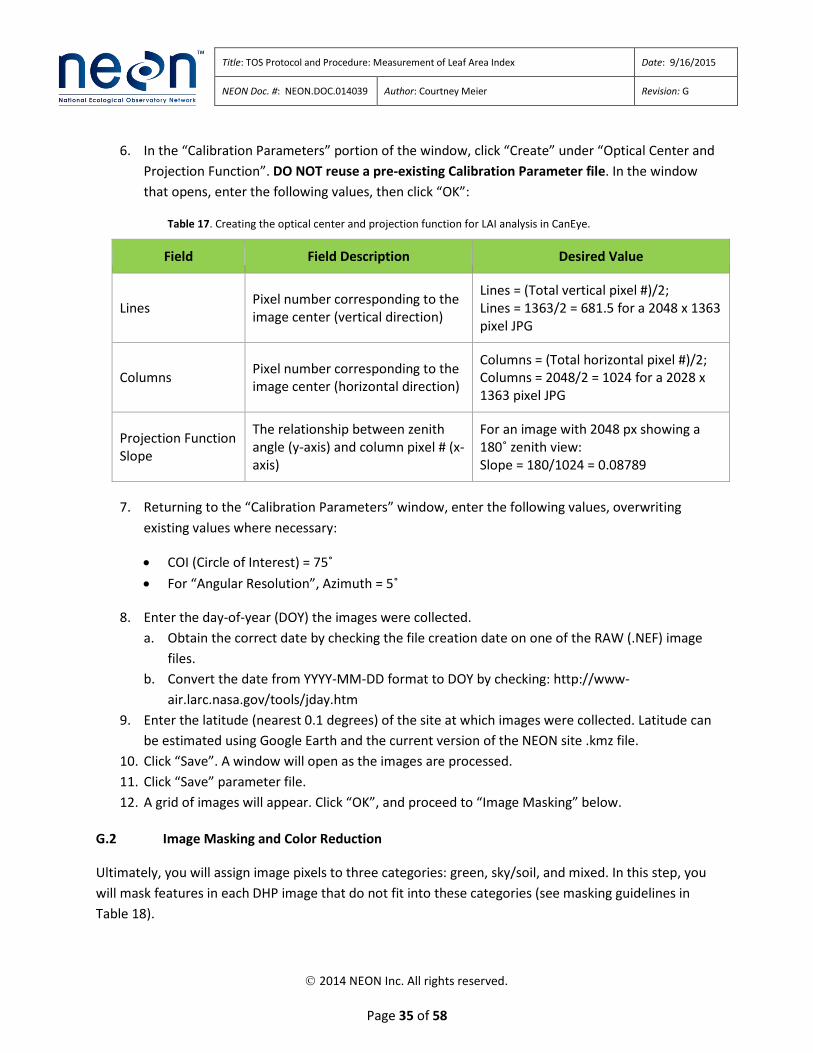


![AOS/TOS Protocol and Procedure: [Soils]](https://static.documents.pub/doc/80x56/623ab2fc66ef0d090519d8b4/aostos-protocol-and-procedure-soils.jpg)


