Total Maximum Daily Load Development for Linville Creek: Bacteria and General Standard (Benthic) Impairments Submitted by: Virginia Department of Environmental Quality Virginia Department of Conservation and Recreation Prepared by: Department of Biological Systems Engineering, Virginia Tech March 2003
Transcript
Total Maximum Daily Load Development forLinville Creek: Bacteria and General Standard
(Benthic) Impairments
Submitted by:
Virginia Department of Environmental QualityVirginia Department of Conservation and Recreation
Prepared by:
Department of Biological Systems Engineering, Virginia Tech
March 2003
Project Personnel
Virginia Tech, Department of Biological Systems EngineeringBrian Benham, Assistant Professor and Extension SpecialistKevin Brannan, Research AssociateTheo Dillaha, III., ProfessorSaied Mostaghimi, ProfessorJeff Wynn, Research AssociateGene Yagow, Research ScientistRebecca Zeckoski, Research Associate
Virginia Department of Environmental QualitySandra Mueller, Project CoordinatorJutta SchneiderBill Van WartGary FloryLarry Hough
Virginia Department of Conservation and Recreation (VADCR)Mike Shelor, Project CoordinatorTamara KeelerMark HollbergCrawford Patterson
For additional information, please contact:Virginia Department of Environmental Quality (VADEQ)
Water Quality Assessment Office, Richmond: Sandra Mueller, (804) 698-4324Valley Regional Office, Harrisonburg: Gary Flory, (540) 574-7840
1.5. Public Participation .......................................................................................................................................... 18CHAPTER 2: INTRODUCTION ...................................................................................................................................19
2.1. Background........................................................................................................................................................ 192.1.1. TMDL Definition and Regulatory Information............................................... 192.1.2. Impairment Listing.......................................................................................... 192.1.3. Watershed Location and Description.............................................................. 202.1.4. Pollutants of Concern ..................................................................................... 20
2.2. Designated Uses and Applicable Water Quality Standards ...................................................................... 232.2.1. Designation of Uses (9 VAC 25-260-10)......................................................... 232.2.2. Bacteria Standard (9 VAC 25-260-170).......................................................... 232.2.3. General Standard (9 VAC 25-260-20) ............................................................ 24
CHAPTER 3: WATERSHED CHARACTERIZATION..............................................................................................273.1. Water Resources ............................................................................................................................................... 273.2. Ecoregion ........................................................................................................................................................... 273.3. Soils and Geology............................................................................................................................................. 293.4. Climate................................................................................................................................................................ 293.5. Land Use............................................................................................................................................................ 293.6. Stream Flow Data ............................................................................................................................................. 303.7. Water Quality Data........................................................................................................................................... 30
3.7.1. Historic Data – Fecal Coliform ...................................................................... 303.7.2. Bacteria Source Tracking ............................................................................... 383.7.3. Historic Data – Benthic Macro-invertebrates ................................................ 39
CHAPTER 4: SOURCE ASSESSMENT OF FECAL COLIFORM ........................................................................434.1. Humans and Pets .............................................................................................................................................. 43
4.1.1. Point Sources .................................................................................................. 44
Total Maximum Daily Load Development for Linville Creek: Bacteria and GeneralStandard (Benthic) Impairments
4.2. Cattle ................................................................................................................................................................... 504.2.1. Distribution of Dairy and Beef Cattle in the Linville Creek Watershed......... 504.2.2. Direct Manure Deposition in Streams ............................................................ 544.2.3. Direct Manure Deposition on Pastures .......................................................... 554.2.4. Land Application of Liquid Dairy Manure ..................................................... 554.2.5. Land Application of Solid Manure.................................................................. 57
4.3. Poultry................................................................................................................................................................. 584.4. Sheep and Goats ............................................................................................................................................... 604.5. Horses ................................................................................................................................................................. 614.6. Wildlife ............................................................................................................................................................... 624.7. Summary: Contribution from All Sources ................................................................................................... 64
CHAPTER 5: MODELING PROCESS FOR FECAL COLIFORM TMDL DEVELOPMENT .............................665.1. Model Description ............................................................................................................................................ 665.2. Selection of Sub-watersheds........................................................................................................................... 675.3. Input Data Requirements................................................................................................................................. 68
5.3.1. Climatological Data........................................................................................ 685.3.2. Hydrology Model Parameters......................................................................... 68
5.4. Land Use............................................................................................................................................................ 695.5. Accounting for Pollutant Sources .................................................................................................................. 72
8.3. GWLF Model Description ............................................................................................................................1038.4. Input Data Requirements...............................................................................................................................104
8.4.1. Climatic Data................................................................................................ 1048.4.2. Land Use ....................................................................................................... 1068.4.3. Hydrologic Parameters................................................................................. 1088.4.4. Sediment Parameters .................................................................................... 110
8.7. Model Calibration for Hydrology................................................................................................................113CHAPTER 9: TMDL ALLOCATIONS...................................................................................................................... 121
CHAPTER 10: TMDL IMPLEMENTATION AND REASONABLE ASSURANCE........................................... 13610.1. Reasonable Assurance Using Phased Implementation...........................................................................13710.2. Phase 1 Implementation Scenario for Linville Creek.............................................................................13810.3. Follow-up Monitoring..................................................................................................................................14010.4. Potential Funding Sources ..........................................................................................................................14110.5. Current Efforts to Control Bacteria ...........................................................................................................14110.6. Addressing Wildlife Contributions ...........................................................................................................141
CHAPTER 11: PUBLIC PARTICIPATION.............................................................................................................. 145CHAPTER 12: REFERENCES ................................................................................................................................. 146APPENDIX A GLOSSARY OF TERMS .................................................................................................................. 148APPENDIX B SAMPLE CALCULATION OF DAIRY CATTLE (SUB WATERSHED B46-02)..................... 155APPENDIX C DIE-OFF FECAL COLIFORM DURING STORAGE.................................................................... 157APPENDIX D WEATHER DATA PREPARATION................................................................................................ 159APPENDIX E FECAL COLIFORM LOADING IN SUB-WATERSHEDS........................................................... 162APPENDIX F REQUIRED REDUCTIONS IN FECAL COLIFORM LOADS BY SUB-WATERSHED –ALLOCATION SCENARIO........................................................................................................................................ 169APPENDIX G SIMULATED STREAM FLOW CHART FOR TMDL ALLOCATION PERIOD ....................... 181APPENDIX H OBSERVED FECAL COLIFORM CONCENTRATIONS AND ANTECEDENT RAINFALL.183APPENDIX I CAFOS IN THE LINVILLE CREEK WATERSHED....................................................................... 187
Total Maximum Daily Load Development for Linville Creek: Bacteria and GeneralStandard (Benthic) Impairments
iv
List of TablesTable 1.1. Allocation scenarios for Linville Creek watershed............................................ 5Table 1.2. Annual nonpoint source fecal coliform loads under existing conditions and
corresponding reductions for TMDL allocation scenario (Scenario 07)..................... 6Table 1.3. Annual direct nonpoint source fecal coliform loads under existing conditions
and corresponding reductions for TMDL allocation scenario (Scenario 07).............. 6Table 1.4. Average annual E. coli loadings (cfu/year) at the watershed outlet used for the
Linville Creek bacteria TMDL.................................................................................... 8Table 1.5. Existing Sediment Loads.................................................................................. 14Table 1.6. Linville Creek Sediment TMDL (t/yr)............................................................. 14Table 1.7. Alternative Load Reduction Scenarios............................................................. 15Table 2.1. Linville Creek Impairments. ............................................................................ 23Table 3.1. Linville Creek BST results............................................................................... 39Table 3.2. Rapid Bioassessment Protocol II Scores for Linville Creek (LNV000.71 and
LNV000.16) .............................................................................................................. 41Table 3.3. Macroinvertebrate Aggregated Index for Streams Assessment Results for
Linville Creek............................................................................................................ 42Table 3.4. Habitat Evaluation Scores for Linville Creek .................................................. 42Table 4.1. Potential fecal coliform sources and daily fecal coliform production by source
in Linville Creek watershed. ..................................................................................... 44Table 4.2. VPDES Permits in Linville Creek.................................................................... 45Table 4.3. General Permits discharging into Linville Creek............................................. 46Table 4.4. Estimated number of unsewered houses by age category, number of failing
septic systems, and pet population in Linville Creek watershed............................... 49Table 4.5. Distribution of dairy cattle, dairy operations and beef cattle among Linville
Creek sub-watersheds................................................................................................ 50Table 4.6. Time spent by cattle in confinement and in the stream.................................... 52Table 4.7. Pasture acreages contiguous to stream. ............................................................ 53Table 4.8. Distribution of the dairy cattle population. ...................................................... 53Table 4.9. Distribution of the beef cattle population......................................................... 54Table 4.10. Schedule of cattle and poultry waste application in the Linville Creek
watershed................................................................................................................... 57Table 4.11. Estimated population of dry cows, heifers, and beef cattle, typical weights,
per capita solid manure production, and fecal coliform concentration in fresh solidmanure in individual cattle type................................................................................ 58
Table 4.12. Estimated daily litter production, litter fecal coliform content for individualpoultry types, and weighted average fecal coliform content..................................... 59
Table 4.13. Sheep and Goat Populations in Linville Creek Sub-Watersheds................... 61Table 4.14. Horse Populations among Linville Creek Sub-Watersheds........................... 62Table 4.15. Wildlife habitat description and acreage, and percent direct fecal deposition
in streams................................................................................................................... 63Table 4.16. Distribution of wildlife among sub-watersheds. ............................................ 64Table 4.17. Annual fecal coliform loadings to the stream and the various land use
categories in the Linville Creek watershed. .............................................................. 65Table 5.1. Stream Characteristics of the Linville Creek Watershed. ................................ 69Table 5.2. Consolidation of VADCR land use categories for Linville Creek watershed. 70Table 5.3. Land use distribution in the Linville Creek watershed (acres). ....................... 71
Total Maximum Daily Load Development for Linville Creek: Bacteria and GeneralStandard (Benthic) Impairments
v
Table 5.4. First order decay rates for different animal waste storage as affected bystorage/application conditions and their sources....................................................... 73
Table 5.5. Linville Creek calibration simulation results (September 1987 to December1993). ........................................................................................................................ 78
Table 5.6. Linville Creek validation simulation results (January 1993 to September 2001).................................................................................................................................... 80
Table 5.7. Partition of flow among surface flow, interflow, and groundwater flow for theJanuary 1993 to September 2001 validation period.................................................. 83
Table 5.8. Input parameters used in HSPF simulations for Linville Creek. ..................... 87Table 7.1. Comparison of Physical and Sediment-Related Characteristics .................... 100Table 8.1. Weather Data Sources.................................................................................... 105Table 8.2. Consolidation of MRLC Land Use Categories .............................................. 107Table 8.3. Land Use Distributions .................................................................................. 108Table 8.4. Average Annual Existing Point Source TSS Loads (t/yr).............................. 112Table 8.5. Available USGS Daily Flow Data ................................................................. 114Table 8.6. Results from HYSEP Baseflow Separation................................................... 115Table 8.7. Calibration Flow Distributions – Linville Creek – 1988-1997...................... 118Table 8.8. Calibration Flow Distributions – Upper Opequon Creek .............................. 119Table 8.9. GWLF Hydrology Calibration Parameters .................................................... 120Table 8.10. GWLF Watershed Parameters...................................................................... 120Table 8.11. Monthly Evapo-Transpiration Cover Coefficients....................................... 120Table 8.12. Land Use-Related GWLF Erosion Parameters. ........................................... 121Table 9.1. Relative contributions of different E. coli sources to the overall E. coli
concentration for the existing conditions in the Linville Creek watershed............. 124Table 9.2. Bacteria allocation scenarios for Linville Creek watershed........................... 127Table 9.3. Annual nonpoint source fecal coliform loads under existing conditions and
corresponding reductions for TMDL allocation scenario (Scenario 07)................. 128Table 9.4. Annual direct nonpoint source fecal coliform loads under existing conditions
and corresponding reductions for TMDL allocation scenario (Scenario 07).......... 129Table 9.5. Average annual E. coli loadings (cfu/year) at the watershed outlet used for the
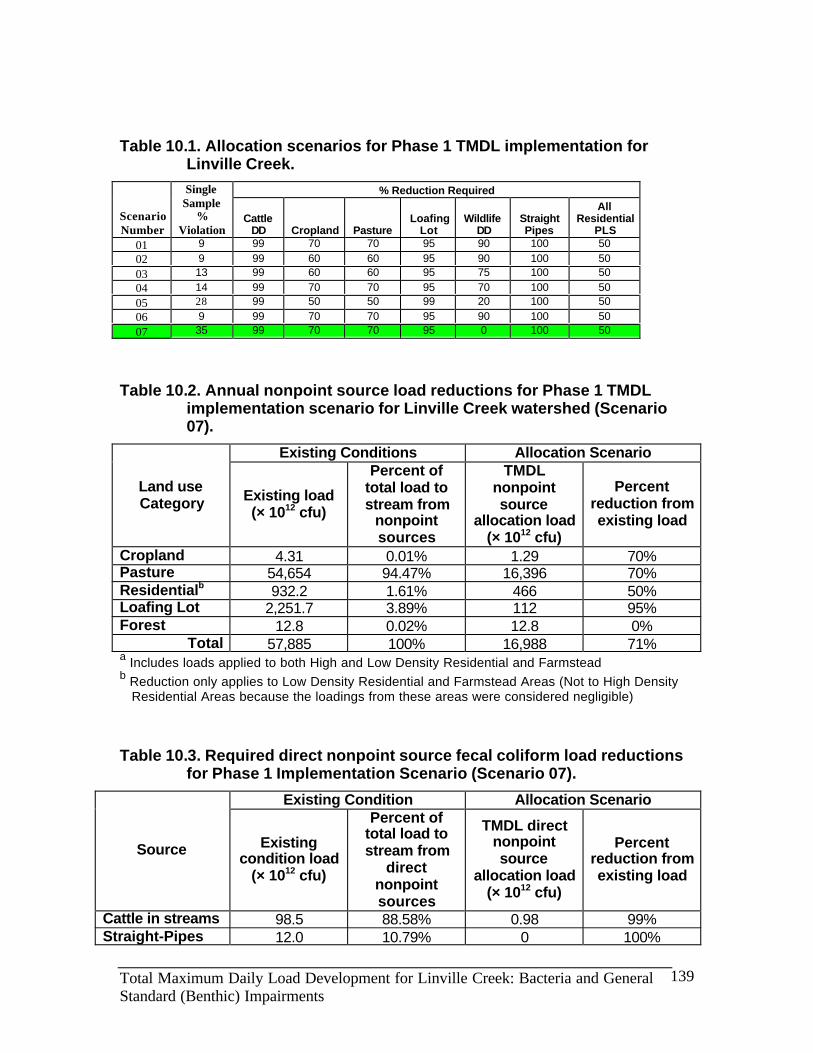
Linville Creek bacteria TMDL................................................................................ 131Table 9.6. Existing Sediment Loads............................................................................... 132Table 9.7. Linville Creek Sediment TMDL (t/yr).......................................................... 132Table 9.8. Alternative Load Reduction Scenarios........................................................... 134Table 10.1. Allocation scenarios for Phase 1 TMDL implementation for Linville Creek.
scenario for Linville Creek watershed (Scenario 07).............................................. 139Table 10.3. Required direct nonpoint source fecal coliform load reductions for Phase 1
Total Maximum Daily Load Development for Linville Creek: Bacteria and GeneralStandard (Benthic) Impairments
vi
List of FiguresFigure 1.1. Successful E. coli TMDL allocation, 126 cfu/100mL geometric mean goal,
and 235 cfu/100mL single sample goal for Linville Creek......................................... 7Figure 2.1. Location of Linville Creek watershed. ........................................................... 22Figure 3.1. Linville Creek Sub-Watersheds...................................................................... 28Figure 3.2. Location of sampling stations in the Linville Creek watershed...................... 32Figure 3.3. Time series of fecal coliform concentration in Linville Creek....................... 33Figure 3.4. Time series of E. coli concentration in Linville Creek. Two samples were
analyzed from November 28, 2001 and reported the same concentration, and thusonly 23 points are visible on the graph. .................................................................... 34
Figure 3.5. Relationship between stream flow and fecal coliform concentration fromSeptember 1993 through September 2001. ............................................................... 35
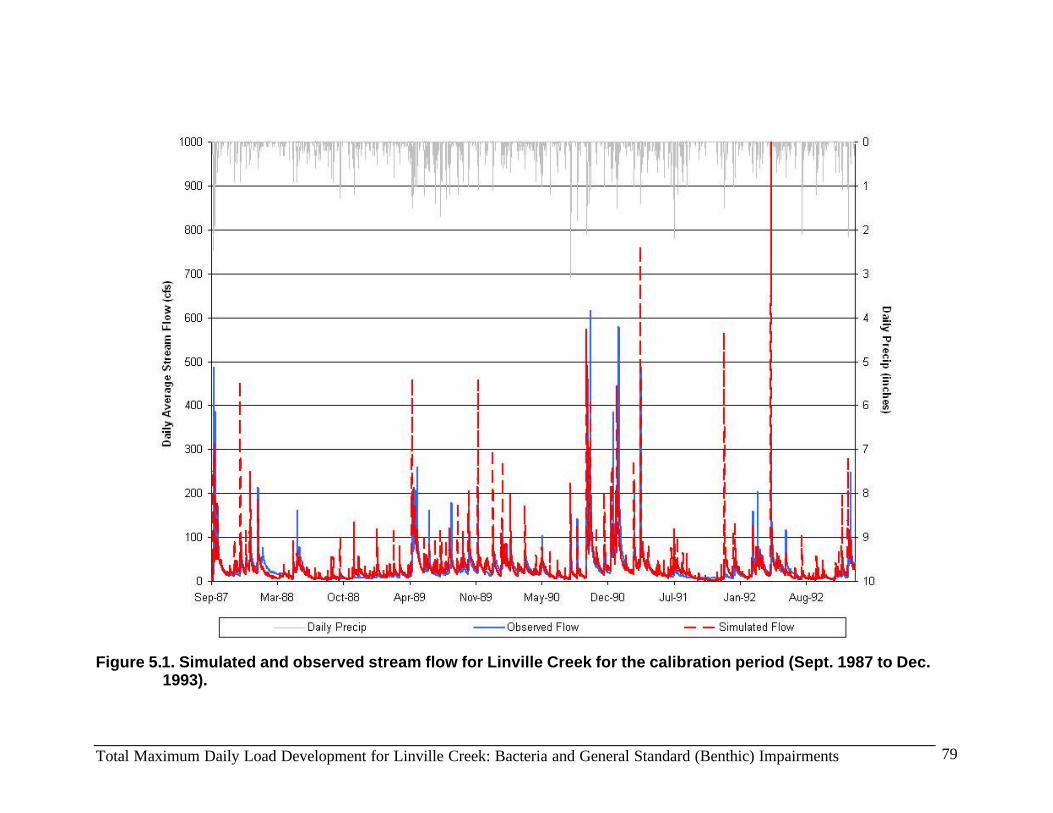
Figure 3.6. Impact of seasonality on fecal coliform concentrations. ................................ 37Figure 5.1. Simulated and observed stream flow for Linville Creek for the calibration
period (Sept. 1987 to Dec. 1993). ............................................................................. 79Figure 5.2. Simulated and observed average daily stream flow for Linville Creek for the
validation period (January 1993 to September 2001). ............................................. 82Figure 5.3. Linville Creek fecal coliform calibration for existing conditions................... 86Figure 6.1. Suspended Solids Concentration in Linville and Upper Opequon Creeks. .... 90Figure 6.2. Turbidity Data for Linville Creek................................................................... 90Figure 6.3. Water Temperature in Linville Creek............................................................. 91Figure 6.4. Field pH Data for Linville Creek Samples. .................................................... 92Figure 6.5. Alkalinity Concentration in Linville Creek. ................................................... 92Figure 6.6. Total Organic Carbon Concentration in Linville Creek ................................. 94Figure 6.7. Volatile Suspended Solids Concentration in Linville Creek .......................... 94Figure 6.8. Monthly Dissolved Oxygen Concentration in Linville and Upper Opequon
Creeks........................................................................................................................ 95Figure 6.9. Diurnal Dissolved Oxygen Concentration in Linville Creek: July 24-25, 2002.
................................................................................................................................... 95Figure 6.10. BOD (5-day) Concentration in Linville Creek ............................................. 96Figure 6.11. COD Concentration in Linville Creek.......................................................... 96Figure 6.12. Nitrogen Concentrations in Linville and Upper Opequon Creeks................ 97Figure 6.13. Phosphorus Concentrations in Linville and Upper Opequon Creeks. .......... 97Figure 8.1. Location of USGS Flow Gages and NWS Weather Stations for Linville and
Upper Opequon Watersheds.................................................................................... 106Figure 8.2. Calibration Monthly Runoff Time Series – Linville Creek......................... 117Figure 8.3. Calibration Cumulative Runoff – Linville Creek ......................................... 117Figure 8.4. Calibration Monthly Runoff Time Series – Upper Opequon Creek............ 119Figure 8.5. Calibration Cumulative Runoff – Upper Opequon Creek ........................... 119Figure 9.1. Relative contributions of different E. coli sources to the calendar-month
geometric mean E. coli concentration for existing conditions in the Linville Creekwatershed................................................................................................................. 125
Figure 9.2. Calendar-month geometric mean standard, single sample standard, andsuccessful E. coli TMDL allocation for Linville Creek.......................................... 127
Two sediment source categories in the watershed – Agriculture and
Channel Erosion – were responsible for the majority of the sediment load in
Linville Creek. The sediment TMDL for Linville Creek is 34,549 t/yr and will
require an overall reduction of 12.3% from existing loads. TMDL Scenario 3 is
the recommended alternative, because it accounts for the sediment reduction
due to restricting livestock access to streams at the level called for in the
companion bacteria TMDL, thus minimizing the remaining reduction needed to
meet the TMDL from Agriculture.
The Linville Creek sediment TMDL was developed to meet the sediment
unit area load of a selected reference watershed – Upper Opequon Creek. The
TMDL was developed to take into account all sediment sources in the watershed
from both point and nonpoint sources. The sediment loads were averaged over
a 10-year period to take into account both wet and dry periods in the hydrologic
cycle, and the model inputs took into consideration seasonal variations and
critical conditions related to sediment loading. An explicit 10% margin of safety
was added into the final TMDL load calculation.
Total Maximum Daily Load Development for Linville Creek: Bacteria and GeneralStandard (Benthic) Impairments
16
1.3.9. Phase 1 Implementation
The reductions required from the bacteria TMDL phase 1 implementation
plan will reduce the sediment loads to a level below those required for the final
sediment TMDL. Therefore, the phase 1 implementation plan for sediment is the
same as that for bacteria (Section 1.2.7).
1.4. Reasonable Assurance of Implementation
1.4.1. Follow-Up Monitoring
The Department of Environmental Quality (VADEQ) will continue to
monitor Linville Creek in accordance with its ambient monitoring program.
VADEQ and the Virginia Department of Conservation and Recreation (VADCR)
will use data from Linville Creek monitoring stations to evaluate reductions in
fecal bacteria counts and the effectiveness of the TMDL in attaining and
maintaining water quality standards.
1.4.2. Regulatory Framework
The goal of this TMDL is to establish a three-step path that will lead to
expeditious attainment of water quality standards. The first step in this process is
to develop an implementable TMDL. The second step is to develop a TMDL
implementation plan, and the final step is to implement the TMDL and attain
water quality standards.
Section 303(d) of the Clean Water Act (CWA) and current USEPA
regulations do not require the development of implementation strategies.
However, including implementation plans as a TMDL requirement has been
discussed for future federal regulations. Additionally, Virginia’s 1997 Water
Quality Monitoring, Information and Restoration Act (WQ MIRA) directs VADEQ
in section 62.1-44.19.7 to “develop and implement a plan to achieve fully
supporting status for impaired waters”. The Act also establishes that the
implementation plan shall include that date of expected achievement of water
Total Maximum Daily Load Development for Linville Creek: Bacteria and GeneralStandard (Benthic) Impairments
17
quality objectives, measurable goals, corrective actions necessary and the
associated cost, benefits and environmental impact of addressing the
impairments. The US Environmental Protection Agency outlines the minimum
elements of an approvable implementation plan in its 1999 “Guidance for Water
Quality-Based Decisions: The TMDL Process”. The listed elements include
implementation actions/management measures, time line, legal or regulatory
controls, time required to attain water quality standards, monitoring plan and
milestones for attaining water quality standards. Watershed stakeholders will
have opportunities to provide input and to participate in the development of the
implementation plan, which will also be supported by regional and local offices of
VADEQ, VADCR, and other cooperating agencies.
Once developed, VADEQ intends to incorporate the TMDL implementation
plan into the appropriate Water Quality Management Plan (WQMP), in
accordance with the CWA’s Section 303(e). In response to a Memorandum of
Understanding (MOU) between USEPA and VADEQ, VADEQ also submitted a
draft Continuous Planning Process to USEPA in which VADEQ commits to
regularly updating the WQMPs. Thus, the WQMPs will be, among other things,
the repository for all TMDLs and TMDL implementation plans developed within a
river basin.
1.4.3. Implementation Funding Sources
One potential source of funding for TMDL implementation is Section 319
of the Clean Water Act. In response to the federal Clean Water Action Plan,
Virginia developed a Unified Watershed Assessment that identifies watershed
priorities. Watershed restoration activities, such as TMDL implementation, within
these priority watersheds are eligible for Section 319 funding. Increases in
Section 319 funding in future years will be targeted towards TMDL
implementation and watershed restoration. Other funding sources for
implementation include the USDA’s Conservation Reserve Enhancement
Program (CREP), the state revolving loan program, and the Virginia Water
Quality Improvement Fund.
Total Maximum Daily Load Development for Linville Creek: Bacteria and GeneralStandard (Benthic) Impairments
18
1.5. Public Participation
Public participation was elicited at every stage of the TMDL development
in order to receive inputs from stakeholders and to apprise the stakeholders of
the progress made. In May of 2002, members of the Virginia Tech TMDL group
traveled to Rockingham County to become acquainted with the watershed.
During that trip, the Virginia Tech TMDL group spoke with various stakeholders.
In addition, personnel from Virginia Tech, the Headwaters Soil and Water
Conservation District (SWCD), and the Natural Resource Conservation Service
(NRCS) visited some watershed residents and contacted others via telephone to
acquire their input. Two public meetings were held. The first public meeting was
organized on September 26, 2002, at the Linville-Edom Elementary School, to
inform the stakeholders of TMDL development process and to obtain feedback
on animal numbers in the watershed, fecal production estimates and to discuss
the hydrologic calibration. The draft TMDL report was discussed at the final
public meeting held on March 5, 2003 at Broadway High School.
Total Maximum Daily Load Development for Linville Creek: Bacteria and GeneralStandard (Benthic) Impairments
19
CHAPTER 2: INTRODUCTION
2.1. Background
2.1.1. TMDL Definition and Regulatory Information
Section 303(d) of the Federal Clean Water Act and the U.S.
Environmental Protection Agency’s (USEPA) Water Quality Planning and
Management Regulations (40 CFR Part 130) require states to identify water
bodies that violate state water quality standards and to develop Total Maximum
Daily Loads (TMDLs) for such water bodies. A TMDL reflects the total pollutant
loading a water body can receive and still meet water quality standards. A TMDL
establishes the maximum allowable pollutant loading from both point and
nonpoint sources for a water body, allocates the load among the pollutant
contributors, and provides a framework for taking actions to restore water quality.
2.1.2. Impairment Listing
Linville Creek is listed as impaired on Virginia’s 1998 Section 303(d) Total
Maximum Daily Load Priority List and Report (VADEQ, 1998) due to water quality
violations of both
• the Fecal Coliform Standard, and
• the General Standard (listed as a benthic impairment).
The Virginia Department of Environmental Quality (VADEQ) has
delineated the impairments on Linville Creek on a stream length of 13.55 miles.
The impaired stream segment begins at the Linville Creek headwaters and
continues downstream to its confluence with the North Fork of the Shenandoah
River. Linville Creek is targeted for TMDL development and completion by 2004.
Total Maximum Daily Load Development for Linville Creek: Bacteria and GeneralStandard (Benthic) Impairments
20
2.1.3. Watershed Location and Description
A part of the Potomac and Shenandoah River basin, Linville Creek
watershed (Watershed ID VAV-B46R) is located in Rockingham County, Virginia,
bounded by Broadway to the north and Harrisonburg to the south (Figure 2.1).
The watershed is 29,647 acres in size. Linville Creek is mainly an agricultural
watershed (about 71.3%) and is characterized by a rolling valley with the Blue
Ridge Mountains to the east and the Appalachian Mountains to the west. The
majority of the remaining 28.7% of the watershed area is divided between forest
and rural developments. Linville Creek flows northeast and discharges into the
North Fork of the Shenandoah River (USGS Hydrologic Unit Code 02070006),
which is a tributary of the Potomac River; the Potomac River discharges into the
Chesapeake Bay.
2.1.4. Pollutants of Concern
Pollution from both point and nonpoint sources can lead to fecal coliform
bacteria contamination of water bodies. Fecal coliform bacteria are found in the
intestinal tract of warm-blooded animals; consequently, fecal waste of warm-
blooded animals contains fecal coliform. Even though most fecal coliform are not
pathogenic, their presence in water indicates contamination by fecal material.
Because fecal material may contain pathogenic organisms, water bodies with
high fecal coliform counts are potential sources of pathogenic organisms. For
contact recreational activities, e.g., boating and swimming, health risks increase
with increasing fecal coliform counts in the water body. If the fecal coliform
concentration in a water body exceeds state water quality standards, the water
body is listed for violation of the state fecal coliform standard for contact
recreational uses. As will be discussed in Section 2.2.2, the state has moved to
an Escherichia coli (E. coli) standard for water quality. The concentration of E.
coli (a subset of the fecal coliform group) in the water is considered to be a better
indicator of pathogenic exposure than the concentration of the entire fecal
coliform group in the water body.
Total Maximum Daily Load Development for Linville Creek: Bacteria and GeneralStandard (Benthic) Impairments
21
Pollution from both point and nonpoint sources can also lead to a violation
of the general standard for water quality (Section 2.2.4). This violation is
assessed on the basis of measurements of the benthic macro-invertebrate
community in the stream, with pollution impacts referred to as a benthic
impairment. Water bodies having a benthic impairment are not fully supportive of
the aquatic life use designated for Virginia’s waters.
Total Maximum Daily Load Development for Linville Creek: Bacteria and GeneralStandard (Benthic) Impairments
22
Figure 2.1. Location of Linville Creek watershed.
Total Maximum Daily Load Development for Linville Creek: Bacteria and GeneralStandard (Benthic) Impairments
23
2.2. Designated Uses and Applicable Water Quality Standards
2.2.1. Designation of Uses (9 VAC 25-260-10)“A. All state waters are designated for the following uses: recreational uses(e.g. swimming and boating); the propagation and growth of a balancedindigenous population of aquatic life, including game fish, which mightreasonably be expected to inhabit them; wildlife; and the production of edibleand marketable natural resources (e.g., fish and shellfish).” SWCB, 2002.
Linville Creek does not support the recreational (swimming) and aquatic
life designated uses due to violations of the bacteria criteria and the general
EPA has recommended that all States adopt an E. coli or enterococci
standard for fresh water and enterococci criteria for marine waters, because
there is a stronger correlation between the concentration of these organisms (E.
coli and enterococci) and the incidence of gastrointestinal illness than there is
with fecal coliform. E. coli and enterococci are both bacteriological organisms
that can be found in the intestinal tract of warm-blooded animals and are subsets
of the fecal coliform and fecal streptococcus groups, respectively. In line with
this recommendation, Virginia adopted and published revised bacteria criteria on
June 17, 2002. The revised criteria became effective on January 15, 2003. As
of that date, the E. coli standard described below applies to all freshwater
Total Maximum Daily Load Development for Linville Creek: Bacteria and GeneralStandard (Benthic) Impairments
24
streams in Virginia. Additionally, prior to June 30, 2008, the interim fecal coliform
standard must be applied at any sampling station that has fewer than 12 samples
of E. coli.
For a non-shellfish water body to be in compliance with Virginia’s revised
bacteria standards (as published in the Virginia Register Volume 18, Issue 20)
the following criteria shall apply to protect primary contact recreational uses:
Interim Fecal Coliform Standard:
Fecal coliform bacteria shall not exceed a geometric mean of 200 fecalcoliform bacteria per 100 mL of water for two or more samples over acalendar month nor shall more than 10% of the total samples taken duringany calendar month exceed 400 fecal coliform bacteria per 100 mL of water.
Escherichia coli Standard:
E. coli bacteria concentrations for freshwater shall not exceed a geometricmean of 126 counts per 100 mL for two or more samples taken during anycalendar month and shall not exceed an instantaneous single samplemaximum of 235 cfu/100mL.
During any assessment period, if more than 10% of a station’s samples
exceed the applicable standard, the stream segment associated with that station
is classified as impaired and a TMDL must be developed and implemented to
bring the station into compliance with the water quality standard. The original
impairment to Linville Creek was based on exceedences of an earlier fecal
coliform standard that included a numeric single sample maximum limit of 1000
cfu/100 mL. Because the TMDL must be based on current standards, and
because more than 12 samples of E. coli are available for Linville Creek, the
TMDL will be developed to meet the E. coli standard. As recommended by
VADEQ, the modeling will be conducted with fecal coliform inputs, and then a
translator equation will be used to convert the output to E. coli.
2.2.3. General Standard (9 VAC 25-260-20)
The general standard for a water body in Virginia states:
“A. All state waters, including wetlands, shall be free from substancesattributable to sewage, industrial waste, or other waste in concentrations,amounts, or combinations which contravene established standards or interfere
Total Maximum Daily Load Development for Linville Creek: Bacteria and GeneralStandard (Benthic) Impairments
25
directly or indirectly with designated uses of such water or which are inimical orharmful to human, animal, plant, or aquatic life.
Specific substances to be controlled include, but are not limited to: floatingdebris, oil scum, and other floating materials; toxic substances (including thosewhich bioaccumulate); substances that produce color, tastes, turbidity, odors,or settle to form sludge deposits; and substances which nourish undesirable ornuisance aquatic plant life. Effluents which tend to raise the temperature of thereceiving water will also be controlled.” SWCB, 2002.
The first paragraph of this standard describes the designated uses for a
water body in Virginia. Linville Creek is violating the general standard for aquatic
life use, and thus has a general standard (benthic) impairment.
The Department of Environmental Quality runs the Biological Monitoring
Program in Virginia. Evaluations of monitoring data from the program focus on
the benthic (bottom-dwelling) macro (large enough to see with the naked eye)
invertebrates (insects, mollusks, crustaceans, and annelid worms) and are used
to determine whether or not a stream segment is supporting the aquatic life use.
Changes in water quality generally result in changes in the types and numbers of
the benthic organisms that live in streams and other water bodies. Besides being
the major intermediate constituent of the aquatic food chain, benthic macro-
invertebrates are "living recorders" of past and present water quality conditions.
This is due to their relative immobility and their variable resistance to the diverse
contaminants that can be introduced into streams. The community structure of
these organisms provides the basis for the biological analysis of water quality.
Qualitative and semi-quantitative biological monitoring has been conducted by
VADEQ since the early 1970's. The USEPA Rapid Bioassessment Protocol II
(RBP II) was employed beginning in the fall of 1990 to utilize standardized and
repeatable methodology. For any single sample, the RBP II produces water
quality ratings of “non-impaired,” “slightly impaired,” “moderately impaired,” and
“severely impaired.” In Virginia, benthic samples are generally taken and
analyzed twice a year, in the spring and in the fall.
The RBP II procedure evaluates the benthic macro-invertebrate
community by comparing ambient monitoring network stations to reference sites.
Total Maximum Daily Load Development for Linville Creek: Bacteria and GeneralStandard (Benthic) Impairments
26
A reference site is one that has been determined to be representative of a
natural, unimpaired water body. The RBP II evaluation also accounts for the
natural variation noted in streams in different ecoregions (regions that share
characteristics such as meteorological factors, elevation, plant and animal
speciation, landscape position, and soils). One additional product of the RBP II
evaluation is a habitat assessment. This assessment provides information on the
comparability of each stream station to the reference site.
Determination of the degree of support for the aquatic life use is based on
conventional water column pollutants (DO, pH, temperature), sediment and
nutrient screening value analyses, biological monitoring data, and the best
professional judgment of the regional biologist, relying mostly on the most recent
data collected during the current 5-year assessment period. In Virginia, any
stream segment with an overall rating of “moderately impaired” or “severely
impaired” is placed on the state’s 303(d) list of impaired streams (VADEQ, 2002).
Total Maximum Daily Load Development for Linville Creek: Bacteria and GeneralStandard (Benthic) Impairments
27
CHAPTER 3: WATERSHED CHARACTERIZATION
3.1. Water Resources
The Linville Creek Watershed was subdivided into 11 sub-watersheds for
fecal coliform modeling purposes, as shown in Figure 3.1. Tributaries to the
impaired segment (Linville Creek B46-1,2,5,7,8,11) include Daphna Creek (B46-
03), Joes Creek (B46-06), West Fork Linville Creek (B46-10), Tide Spring Branch
(B46-04), and an unnamed tributary (B46-09). The main branch of Linville Creek
runs for 13.55 miles from the headwaters until it enters the North Fork of the
Shenandoah River. Linville Creek is perennial and has a trapezoidal channel cross-
section. From September 1993 through September 2001, measured discharge
ranged from 4,700 cubic feet per second (cfs) to 1.7 cfs, with a mean value of 40.5
cfs. Aquifers in this watershed are overlain by limestone (VWCB, 1985). Depth to
the water table is in excess of 6 ft (SCS, 1982). The presence of numerous solution
cavities with intensive agricultural use results in a high potential for groundwater
pollution (VWCB, 1985).
3.2. Ecoregion
The Linville Creek watershed is located in the Central Appalachian Ridges
and Valleys Level III Ecoregion. It is located primarily in the Northern
Limestone/Dolomite Valleys Level IV Ecoregion, with a small portion located in the
Northern Sandstone Ridges Level IV Ecoregion. The Central Appalachian Ridges
and Valleys Ecoregion is characterized by its generation from a variety of geological
materials. The Level III Ecoregion has numerous springs and caves. The ridges
tend to be forested, while limestone valleys are composed of rich agricultural land
(USEPA, 2002). The Northern Limestone/Dolomite Valleys Level IV ecoregion has
fertile land and is primarily agricultural. Steeper areas have scattered forests
composed mainly of oak trees. Streams tend to flow year-round and have gentle
slopes. The Northern Sandstone Ridges Level IV ecoregion has steep ridges.
Streams have steep slopes and a tendency toward being acidic. The ecoregion is
Total Maximum Daily Load Development for Linville Creek: Bacteria and GeneralStandard (Benthic) Impairments
28
composed primarily of Appalachian Oak Forest or Oak-Hickory-Pine forest (Woods
et al., 1999).
Figure 3.1. Linville Creek Sub-Watersheds.
Total Maximum Daily Load Development for Linville Creek: Bacteria and GeneralStandard (Benthic) Impairments
29
3.3. Soils and Geology
The predominant soil groups found in Linville Creek watershed are the
Frederick-Lodi-Rock outcrop, Endcav-Carbo-Rock outcrop, and Chilhowie-Edom
soils (SCS, 1982). The Frederick-Lodi-Rock outcrop (silty loam) soils are deep and
well drained with clayey subsoil and areas of rock outcrop (SCS, 1982). The
EndCav-Carbo-Rock outcrop and Chilhowie-Edom soils are moderately-deep to
deep, well-drained soils with clayey subsoil with areas of rock outcrop (SCS, 1982).
In upland areas, each of these soils is underlain by limestone bedrock; Frederick-
Lodi-Rock outcrop soils are also underlain by dolomite bedrock, and Chilhowie-
Edom soils are also underlain by interbedded shale (SCS, 1982). These three
general soil map units are found on gently sloping to steep topography with medium
to rapid surface runoff (SCS, 1982).
3.4. Climate
The climate of the watershed is characterized based on the meteorological
observations made by the National Weather Service’s stations in the communities
of Dale Enterprise and Timberville. Dale Enterprise, the primary source of climatic
data for Linville Creek, is located 1.5 miles southwest of Linville Creek. Average
annual precipitation at that station is 35.26 in. with 58% of the precipitation
occurring during the crop-growing season (May-October) (SERCC, 2002). Average
annual snowfall is 24.8 in. with the highest snowfall occurring during January
(SERCC, 2002). Average annual daily temperature is 53.4°F. The highest average
daily temperature of 73.7°F occurs in July while the lowest average daily
temperature of 32.5°F occurs in January (SERCC, 2002).
3.5. Land Use
Pasture is the main land use category in Linville Creek, comprising 49% of the
total watershed area, while cropland accounts for about 21% of the watershed area.
Forest acreage accounts for about 16% of the total area. Residential and urban
Total Maximum Daily Load Development for Linville Creek: Bacteria and GeneralStandard (Benthic) Impairments
30
developments, which cover 9% of the total area, are spread throughout the
watershed and are slightly concentrated near the outlet.
3.6. Stream Flow Data
Daily flow rates were available from USGS station 01632082 located near
the mouth of Linville Creek. Monitoring at this station began on August 9, 1985 and
ended on September 30, 2001.
3.7. Water Quality Data
Virginia DEQ monitored chemical and bacterial water quality in the
watershed on a monthly basis from September 1993 through June 2001. From July
2001 through April 2002, data were collected on a bimonthly basis. Data on
biological communities were collected semi-annually from October 1994 through
May 2002. In conjunction with water quality monitoring, VADEQ conducted daily
stream flow monitoring from August 1985 through September 2001. Stream flow
data for the flow monitoring period and bacterial water quality data were both
available for the period of September 1993 through September 2001.
3.7.1. Historic Data – Fecal Coliform
The Virginia Department of Conservation and Recreation has assessed this
watershed as having a high potential for nonpoint source pollution from agricultural
sources. Of the 102 water quality samples collected by VADEQ from September
1993 to April 2002 at the outlet of the watershed (Station ID No. 1BLNV001.22)
(Figure 3.2), 34% exceeded the single sample maximum fecal coliform standard of
1,000 cfu/100 mL. Consequently, this segment of Linville Creek was assessed as
not supporting the Clean Water Act’s Swimming Use Support Goal for the 1998
305(b) report and was included in the 1998 303(d) list (USEPA, 1998a, b).
Virginia DEQ personnel monitored pollutant concentrations at the Linville
Creek watershed outlet over eight and a half years (1993-2002) (VADEQ, 1997).
From September 1993 through June 2001, samples were taken on a monthly basis;
samples have been taken on a bimonthly basis since July 2001. Beginning in July
Total Maximum Daily Load Development for Linville Creek: Bacteria and GeneralStandard (Benthic) Impairments
31
2001, samples were taken at two additional stations, 1BLNV006.49 and
1BLNV007.66. Twenty-three percent of the samples taken at 1BLNV006.49
violated the 1000 cfu/100mL fecal coliform standard, and 50% of the samples taken
at 1BLNV007.66 violated the standard. These stations will be discontinued as of
July 2003.
Total Maximum Daily Load Development for Linville Creek: Bacteria and GeneralStandard (Benthic) Impairments
32
Figure 3.2. Location of sampling stations in the Linville Creek watershed.
Total Maximum Daily Load Development for Linville Creek: Bacteria and GeneralStandard (Benthic) Impairments
33
In addition to fecal coliform, the water quality samples taken at station
1BLNV001.22 were analyzed for nitrate, total nitrogen, and total phosphorus. The
24 samples taken between January 2000 and April 2002 were also analyzed for E.
coli. As mentioned in Section 2.2.2, any sampling station with more than 12 E. coli
samples must attain the new bacteria standard for E. coli, rather than the old
standard for fecal coliform. Therefore, the TMDL for Linville Creek must address
the new E. coli standard. Time series data of fecal coliform concentration over the
September 1993 through April 2002 period are shown in Figure 3.3. Time series
data of E. coli concentration from January 2000 to April 2002 are shown in Figure
3.4.
0
2000
4000
6000
8000
10000
12000
14000
16000
18000
Sep-93 Jan-95 Jun-96 Oct-97 Mar-99 Jul-00 Nov-01
Sample Date
Fec
al C
olif
orm
Conce
ntr
atio
n (c
fu/1
00 m
L)
1000 cfu/100 mL Instantaneous Criterion
Cap
Figure 3.3. Time series of fecal coliform concentration in Linville Creek.
Total Maximum Daily Load Development for Linville Creek: Bacteria and GeneralStandard (Benthic) Impairments
34
0
100
200
300
400
500
600
700
800
900
1/10/00 7/28/00 2/13/01 9/1/01 3/20/02
Date
E. c
oli
Co
nce
ntr
atio
n (c
fu/1
00 m
L)
235 cfu/100 mL Instantaneous Criterion
Cap
Figure 3.4. Time series of E. coli concentration in Linville Creek. Twosamples were analyzed from November 28, 2001 and reported the
same concentration, and thus only 23 points are visible on thegraph.
Prior to March 1995, the Most Probable Number (MPN) method was used for
analyzing water samples for fecal coliform concentration. The MPN method had a
maximum detection limit of 8,000 cfu/100 mL. Another version of the MPN method
was used after March 1995, which allowed detection of fecal coliforms up to a
concentration of 16,000 cfu/100 mL. After October 2000, the more accurate
Membrane Filtration Technique (MFT) was used for the analysis of fecal coliform in
water samples. The MFT also has a maximum detection limit of 16,000 cfu/100 mL.
The sample values shown at the maximum detection limit (Figure 3.3) indicate fecal
coliform concentrations of at least 8,000 cfu/100 mL (prior to March 1995) or 16,000
cfu/100 mL. Similarly, the E. coli samples had a maximum detection limit of 800
Total Maximum Daily Load Development for Linville Creek: Bacteria and GeneralStandard (Benthic) Impairments
35
cfu/100 mL. The sample values shown at the maximum detection limit (Figure 3.4)
indicate E. coli concentrations of at least 800 cfu/100 mL. Violations of the fecal
coliform water quality standard were observed throughout the reporting period.
Thirty-four percent of the 102 water samples collected by VADEQ from
September 1993 through April 2002 contained fecal coliform concentrations in
excess of the instantaneous standard of 1,000 cfu/100 mL (Figure 3.3). Nine
percent of the samples contained the highest concentration of fecal coliform that
could be measured by the method used. Given that water samples were collected
on a monthly basis, the geometric mean criterion could not be calculated.
The relationship between stream flow rates and fecal coliform concentrations
is shown in Figure 3.5. The stream flow rate and fecal coliform concentration data
in Figure 3.5 are for the period from September 1993 through September 2001,
when both data sets were available.
0
2000
4000
6000
8000
10000
12000
14000
16000
0.0 100.0 200.0 300.0 400.0 500.0
Stream Flow (cfs)
Fec
al C
olif
orm
Co
nce
ntr
atio
n (c
fu/1
00m
L)
40.5 cfs Mean Flow
1000 cfu/100 mL instantaneous criterion
Figure 3.5. Relationship between stream flow and fecal coliform concentrationfrom September 1993 through September 2001.
Total Maximum Daily Load Development for Linville Creek: Bacteria and GeneralStandard (Benthic) Impairments
36
Based on daily flow measurements made from September 1993 through
September 2001, mean stream flow in Linville Creek was 40.5 cfs. Thirty five of the
98 fecal coliform samples (35.7%) violated the instantaneous criterion during this
time period, which is shorter than the total period due to the lack of flow data
recorded after September 2001. Thirty percent of fecal coliform samples violated
the instantaneous criterion of 1,000 cfu/100 mL (Figure 3.5) when flows were lower
than the mean value of 40.5 cfs during this period. When flows exceeded the mean
flow (40.5 cfs), 50% of the samples violated the instantaneous standard. However,
most (75.5%) of the measurements were made when flow values were lower than
the mean value. Higher fecal coliform concentrations under summer flow conditions
(Figure 3.6) suggest that fecal coliform directly deposited/discharged into the
stream may be the more dominant source as compared to fecal coliform coming in
runoff from upland areas.
Seasonality of fecal coliform concentration in the streams was evaluated by
plotting the mean monthly fecal coliform concentration values (Figure 3.6). Mean
monthly fecal coliform concentration was determined as the average of eight to nine
values for each month; the number of values varied according to the available
number of samples for each month in the 1993 to 2001 period of record.
Total Maximum Daily Load Development for Linville Creek: Bacteria and GeneralStandard (Benthic) Impairments
37
1112
92
2806
2328 2278
5987
4338
9497
3543
497
957
363
0
1000
2000
3000
4000
5000
6000
7000
8000
9000
10000
Jan Feb Mar Apr May Jun Jul Aug Sep Oct Nov Dec
Month
Feca
l Col
iform
Con
cent
ratio
n, c
fu/1
00 m
L
Figure 3.6. Impact of seasonality on fecal coliform concentrations.
The data indicate seasonal variability with higher in-stream fecal coliform
concentrations occurring during the summer months and lower concentrations
typically occurring during the winter months. During summer (June – August), the
average fecal coliform concentration was 6,607 cfu/100mL compared with 522
cfu/100mL during winter (December – February). Lower fecal coliform
concentrations measured during the winter and spring months (Figure 3.6) could be
due to larger number of animals being in confinement during these periods,
resulting in smaller fecal coliform loading to the pasture, and particularly to streams.
Furthermore, land application of animal waste is limited during the winter months.
Higher fecal concentrations during the summer and fall months (Figure 3.6) could
be due to more cattle in streams and more animal waste land-applied during the
fall. The high fecal coliform concentration observed during August (Figure 3.6)
could also be due to a large proportion of animal waste being applied to crops
during or prior to this month. Similarly, high fecal coliform concentrations observed
in November (Figure 3.6) could be due to land-application of animal waste during
the fall to a winter cover crop and/or to create space in a farm’s waste storage
facility for animal waste generated during winter. Again, it should be noted that due
Total Maximum Daily Load Development for Linville Creek: Bacteria and GeneralStandard (Benthic) Impairments
38
to the cap imposed on the fecal coliform count (8,000 or 16,000), where fecal
coliform levels are equal to these maximum levels, the actual counts could be much
higher, increasing the average shown in Figure 3.6.
3.7.2. Bacteria Source Tracking
Limited bacteria source tracking (BST) was conducted to aid in identification
of potential sources of fecal bacteria in the Linville Creek watershed. The BST
samples were collected at the DEQ ambient water quality monitoring station
(1BLNV001.22) near the mouth of Linville Creek. The Antibiotic Resistance
Analysis (ARA) procedure for enterococci was used in this study (Hagedorn et al.,
1999). The monthly BST samples were collected from May through October 2002.
A total of 6 samples were collected. It should be noted that this short sampling
period was characterized by below normal precipitation, warm temperatures, and
extremely low stream flows. The short time-frame available for field sample
collection and the resulting small number of samples collected makes it difficult to
draw any firm quantitative conclusions regarding bacteria sources in the Linville
Creek watershed.
A total of 48 isolates were analyzed for each BST sample. Isolates from a
few known sources (poultry, dairy, beef, goats, and human) in the watershed were
collected to enhance the source database and improve the accuracy of the results
for the Linville Creek watershed. The ARA results are reported as the percentage of
isolates acquired from samples that were identified as originating from either
human, livestock, cats/dogs, or wildlife sources (Table 3.1). The BST results
indicate that dogs and cats are the major source of fecal bacteria, approximately
56%, in Linville Creek. Wildlife were identified as the second most significant source
and accounted for approximately 33% of the fecal bacteria load. Livestock and
human sources were found to contribute an average of 8 and 3% of the fecal
bacteria load, respectively. Information in Table 3.1 suggest that the ARA method
and/or the BST classification model results employed in the Linville Creek study
should be viewed with great caution. One possible source of uncertainty is that the
ARA method used enterococci as the fecal bacteria source indicator rather than E
Total Maximum Daily Load Development for Linville Creek: Bacteria and GeneralStandard (Benthic) Impairments
39
coli and fecal coliform bacteria used in previous TMDL studies. The wildlife, human
and livestock numbers seem reasonable (plus or minus 15%) for the drought/low
flow conditions at the time, but the cat and dog results are highly skeptical and do
not represent the Linville conditions. As noted previously, the BST samples in the
Linville Creek watershed were collected during extremely low stream flow
conditions and warm temperatures, which precluded a comprehensive assessment
of the impacts of land-based (manure applications, direct deposits) sources.
Furthermore, due to the short time available for BST sample collection, no
evaluation of the seasonal impacts could be made. Therefore, the results presented
here for Linville are inconclusive as they are not representative of general
Percentage of total isolates 3 8 33 56* Source database compiled from 152 isolates collected in the current project area and 2,030isolates from other geographic areas. Average Rate of Correct Classification (ARCC) for thecompiled database is 79%.
3.7.3. Historic Data – Benthic Macro-invertebrates
Two “moderately impaired” benthic ratings during the 5-yr assessment period
(July 1, 1992-June 30, 1997) used for the 1998 303(d) assessment report resulted
in the Linville Creek watershed being assessed as not supporting of the Aquatic Life
Total Maximum Daily Load Development for Linville Creek: Bacteria and GeneralStandard (Benthic) Impairments
40
designated use. VADEQ listed nonpoint source agricultural pollution as the
probable cause of the benthic impairment (VADEQ, 1998).
The Rapid Bioassessment Protocol II (RBP II) is the index used to assess
compliance with the general standard in Virginia. This protocol compares the
conditions of a target stream to those of an unimpaired, or reference, watershed.
Four different watersheds were used as references for Linville Creek. In Fall 1994
and Fall 1996, Jackson River was used as the reference watershed. In Spring and
Fall of 1995, Stony Creek was used as the reference watershed. In Spring 1996,
Fall 1998, and Spring 1999, Bullpasture Creek was used as the reference
watershed. Finally, Cowpasture Creek was used in the three assessments made
since Fall 2001. Of the ten assessments performed between October 1994 and
May 2002, 7 received a rating of moderately impaired, as shown in Table 3.2. On
October 2, 2001, the benthic monitoring station at Linville Creek was changed to a
location further downstream that was determined by the regional biologist to provide
a more representative benthic sample. The subsequent May 17, 2002 sample, as
well as future samplings, will be collected at both the old and new sampling sites in
order to establish a relationship between the two sites.
Total Maximum Daily Load Development for Linville Creek: Bacteria and GeneralStandard (Benthic) Impairments
41
Table 3.2. Rapid Bioassessment Protocol II Scores for Linville Creek(LNV000.71 and LNV000.16)
RBP II (Scores calculated against a reference watershed.) LNV000.16 LNV000.16Sample Date 10/3/94 5/9/95 9/28/95 5/21/96 9/22/97 10/23/98 5/19/99 10/2/01 5/17/02 5/17/02SampleNum 62 240 417 555 976 1324 1420 2932 2982 2981
Total Maximum Daily Load Development for Linville Creek: Bacteria and GeneralStandard (Benthic) Impairments
43
CHAPTER 4: SOURCE ASSESSMENT OF FECALCOLIFORM
Fecal coliform sources in the Linville Creek watershed were assessed using
information from the following sources: VADEQ, VADCR, Virginia Department of
Game and Inland Fisheries (VADGIF), Virginia Cooperative Extension (VCE),
NRCS, public participation, watershed reconnaissance and monitoring, published
information, and professional judgment. Point sources and potential nonpoint
sources of fecal coliform are described in detail in the following sections and
summarized in Table 4.1.
4.1. Humans and Pets
The Linville Creek watershed has an estimated population of 4,930 people
(1815 households at an average of 2.717 people per household; actual people per
household varies according to sub-watershed). Fecal coliform from humans can be
transported to streams from failing septic systems or via straight pipes discharging
directly into streams.
Total Maximum Daily Load Development for Linville Creek: Bacteria and GeneralStandard (Benthic) Impairments
44
Table 4.1. Potential fecal coliform sources and daily fecal coliform productionby source in Linville Creek watershed.
Potential Source Population in Watershed Fecal coliform produced(×106 cfu/head-day)
Humans 4,930 1,950a
Dairy cattleMilk and dry cowsHeifers c
1,446891
20,200b
9,200d
Beef cattle 6,511 20,000Pets 1,815 450e
PoultryBroilersTurkey Toms
11,096,408719,457
136f
93f
SheepEwesLambsGoats
42585060
12,000f
Horses 64 420f
Deer 1,394 0.0725Raccoons 631 50Muskrats 729 25g
Beavers 39 0.2Wild Turkeys 264 93f
Ducks 224 0.0725Geese 263 0.0725a Source: Geldreich et al. (1978)b Based on data presented by Metcalf and Eddy (1979) and ASAE (1998)c Includes calvesd Based on weight ratio of heifer to milk cow weights and fecal coliform produced by milk cowe Source: Weiskel et al. (1996)f Source: ASAE (1998)g Source: Yagow (2001)
4.1.1. Point SourcesPoint sources of fecal coliform bacteria in the Linville Creek watershed
include all municipal and industrial plants that treat human waste, as well as private
residences that fall under general permits. Virginia issues National Pollutant
Discharge Elimination System (NPDES) permits for point sources of pollution. In
Virginia, point sources that treat human waste are required to maintain a fecal
coliform concentration of 200 cfu/100 mL (126 cfu/100 mL E. coli) or less in their
effluent. Tables 4.2 (VPDES permits) and 4.3 (general permits) show the point
Total Maximum Daily Load Development for Linville Creek: Bacteria and GeneralStandard (Benthic) Impairments
45
sources of pollution in the Linville Creek watershed that are permitted by VADEQ to
discharge fecal coliform and sediment into surface water. In allocation scenarios,
the entire allowable point source discharge concentration of 200 cfu/100 mL was
used.
Table 4.2. VPDES Permits in Linville Creek.
PermitNumber Owner Facility Receiving
StreamSub-
WatershedFlow(MGD)
RiverMile
PermittedFC Conc.
FC Load(cfu/year)
PermittedTSS Conc.
TSS Load(t/yr)
VA0085588 Virginia Departmentof Corrections
Field Unit #8STP
LinvilleCreek B46-03 0.03 7.64 200 cfu/
100 mL 8.29*1010 30 mg/L 1.24
VA0079898 Town of Broadway BroadwayWTP
LinvilleCreek B46-01 0.07 0.07 NA NA 30 mg/L 2.90
NA = not applicable; does not discharge fecal coliform
Total Maximum Daily Load Development for Linville Creek: Bacteria and General Standard (Benthic) Impairments 46
Table 4.3. General Permits discharging into Linville Creek.
Harrisonburg SFH B46-11 1000 200 2.76*109 30 0.0415aRetired facilities are included in the TMDL to allow for future increases in general permitted facilities.
Total Maximum Daily Load Development for Linville Creek: Bacteria and GeneralStandard (Benthic) Impairments
48
4.1.2. Failing Septic Systems
Septic system failure can be evidenced by the rise of effluent to the soil
surface. It was assumed that no die-off occurred once effluent containing fecal
coliform reached the soil surface. Surface runoff can transport the effluent
containing fecal coliform to receiving waters. Sewered areas were located using
Autocad drawings from the town of Broadway and watershed reconnaissance.
Three hundred sixteen households were located in sewered areas; these
households’ waste systems were not assumed to be a source of fecal coliform
contamination. Unsewered households were located using E-911 digital data,
(see Glossary) (Rockingham Co. Planning Dept., 2001). Each unsewered
household was classified into one of three age categories (pre-1967, 1967-1987,
and post-1987) based on USGS 7.5-min. topographic maps which were initially
created using 1967 photographs and were photo-revised in 1987. Professional
judgment was applied in assuming that septic system failure rates for houses in
the pre-1967, 1967-1987, and post-1987 age categories were 40, 20, and 3%,
respectively (R.B. Reneau, personal communication, 3 December 1999,
Blacksburg, Va.). Estimates of these failure rates were also supported by the
Holmans Creek Watershed Study (a watershed located just north of Linville
Creek), which found that over 30% of all septic systems checked in the
watershed were either failing or not functioning at all (SAIC, 2001).
Daily total fecal coliform load to the land from a failing septic system in a
particular sub-watershed was determined by multiplying the average occupancy
rate for that sub-watershed (occupancy rate ranged from 2.29 to 3.06 persons
per household (Census Bureau, 2000)) by the per capita fecal coliform
production rate of 1.95×10⁹ cfu/day (Geldreich et al., 1978). Hence, the total
fecal coliform loading to the land from a single failing septic system in a sub-
watershed with an occupancy rate of 2.29 persons/household was 4.47×10⁹
cfu/day. Transport of some portion of the fecal coliform to a stream by runoff
may occur. The number of failing septic systems in the watershed is given in
Table 4.4.
Total Maximum Daily Load Development for Linville Creek: Bacteria and GeneralStandard (Benthic) Impairments
49
4.1.3. Straight Pipes
Of the houses located within 150 ft of streams, in the pre-1967 and 1967-
1987 age categories, 10%, and 2%, respectively, were estimated to have straight
pipes (R.B. Reneau, personal communication, 3 December 1999, Blacksburg,
Va.). Based on these criteria, it was estimated that the watershed had 4 straight
pipes.
4.1.4. Pets
Assuming one pet per household, there are 1815 pets in Linville Creek
watershed. A dog produces fecal coliform at a rate of 0.45×10⁹ cfu/day (Weiskel
et al., 1996); this was assumed to be representative of a ‘unit pet’ – one dog or
several cats. The pet population distribution among the sub-watersheds is listed
in Table 4.4. Pet waste is generated in the rural residential and urban residential
land use types. Surface runoff can transport bacteria in pet waste from
residential areas to the stream.
Table 4.4. Estimated number of unsewered houses by age category,number of failing septic systems, and pet population in LinvilleCreek watershed.
Total Maximum Daily Load Development for Linville Creek: Bacteria and GeneralStandard (Benthic) Impairments
54
December 1403.5 872.8 0.0 0.0 0.1 60.6a Includes milk cows, dry cows, and heifers.b Number of dairy cattle defecating in stream.c Milk cows in loafing lot.
Table 4.9. Distribution of the beef cattle population.
a As percent of annual load applied to each land use type.
4.2.5. Land Application of Solid ManureSolid manure produced by dry cows, heifers, and beef cattle during
confinement is collected for land application. It was assumed that milk cows
produce only liquid manure while in confinement. The number of cattle, their
typical weights, amounts of solid manure produced, and fecal coliform
concentration in fresh manure are given in Table 4.11. Solid Manure is last on
the priority list for application to land (it falls behind liquid manure and poultry
litter). The amount of solid manure produced in each sub-watershed was
estimated based on the populations of dry cows, heifers, and beef cattle in the
sub-watershed (Table 4.5) and their confinement schedules (Table 4.6). Solid
manure from dry cows, heifers, and beef cattle contained different fecal coliform
concentrations (cfu/lb) (Table 4.11).
Total Maximum Daily Load Development for Linville Creek: Bacteria and GeneralStandard (Benthic) Impairments
58
Table 4.11. Estimated population of dry cows, heifers, and beef cattle,typical weights, per capita solid manure production, and fecalcoliform concentration in fresh solid manure in individual cattletype.
Type ofcattle Population
Typicalweight
(lb)
Solid manureproduced(lb/animal-
day)
Fecal coliformconcentration in fresh
manure(× 106 cfu/lb)
Dry cow 107 1,400a 115.0b 176c
Heifer 891 640d 40.7a 226c
Beef 6,511 1,000e 60.0b 333c
a Source: ASAE (1998)b Source: MWPS (1993)c Based on per capita fecal coliform production per day (Table 4.1) and manure productiond Based on weighted average weight assuming that 57% of the animals are older than 10 months
(900 lb ea.), 28% are 1.5-10 months (400 lb ea.) and the remainder are less than 1.5 months(110 lb ea.) (MWPS, 1993).
e Based on input from local producers
Solid manure is applied at the rate of 12 tons/ac-year to both cropland and
pasture, with priority given to cropland. As in the case of liquid manure, solid
manure is only applied to cropland during February through May, October, and
November. Solid manure can be applied to pasture during the whole year,
except December and January. The method of application of solid manure to
cropland or pasture is assumed to be identical to the method of application of
liquid dairy manure. The application schedule for solid manure is given in Table
4.10. Based on availability of land and solid manure, as well as the assumptions
regarding application rates and priority of application, it was estimated that solid
cattle manure was applied to 310 acres (4.9%) of the cropland, 230 acres (2.8%)
of pasture 1, and 54 acres (3%) of pasture 2. Because the areas of cropland,
pasture 1, and pasture 2 were more than adequate to accommodate the solid
manure application, solid manure was not applied to pasture 3.
4.3. Poultry
The poultry population (Table 4.1) was estimated based on the permitted
combined feeding operations (CAFO) located within the watershed and
discussions with local producers and nutrient management specialists. The
permitted CAFOs are included in Appendix I. Poultry litter production was
Total Maximum Daily Load Development for Linville Creek: Bacteria and GeneralStandard (Benthic) Impairments
59
estimated from the poultry population after accounting for the time when the
houses are not occupied (Table 4.12). It is not known which poultry litter (broiler
or broiler breeder or turkey) is applied to land. Hence, a weighted average fecal
coliform concentration was estimated for poultry litter based on relative
proportions of litter from all poultry types and their respective fecal coliform
contents (Table 4.12).
Table 4.12. Estimated daily litter production, litter fecal coliform content forindividual poultry types, and weighted average fecal coliformcontent.
a Source: ASAE (1998)b Based on information from VADCR and producersc Fraction of time when the poultry house is occupied; layer – 46 weeks/48 weeks; broiler – 48
days/61 days; turkey (5 cycles) – 45 weeks/52 weeksd Source: VADCR (1993)e Litter produced per bird per day is equal to the product of production cycles per year and litter
produced per cycle divided by number of days in a year.f Fecal content in litter is equal to fecal coliform produced per day per bird (Table 4.1) multiplied
by the occupancy factor, divided by the litter produced per day per bird.g Broiler Breeders were considered equivalent to Layers.
Because poultry is raised entirely in confinement, all litter produced is
collected and stored prior to land application. The estimated production rate of
poultry litter in the Linville Creek watershed is 41.7x10⁶ lb/year, which
corresponds to a fecal coliform production rate of 3.6x10¹⁶ cfu/year. Poultry litter
is applied at the rate of 3 tons/ac-year first to cropland, and then to pastures at
the same rate. Poultry litter receives priority after all liquid manure has been
applied (i.e., it is applied before solid cattle manure is considered). The method
of poultry litter application to cropland and pastures is assumed to be identical to
Total Maximum Daily Load Development for Linville Creek: Bacteria and GeneralStandard (Benthic) Impairments
60
the method of cattle manure application. Application schedule of poultry litter is
given in Table 4.10. As with liquid and solid manures, poultry litter is not applied
to cropland during June through September. Based on availability of land and
poultry litter, as well as the assumptions regarding application rates and priority
of application, it was estimated that poultry litter was applied to 4,907 acres
(77%) of cropland; 2,019 acres (25%) of pasture 1; and 29 acres (1.6%) of
Pasture 2. Pasture 3 did not receive any poultry litter because there was
insufficient poultry litter to apply to the entire cropland, pasture 1, and pasture 2
areas.
4.4. Sheep and Goats
The sheep and goat populations (Table 4.1) were estimated based on
discussions with nutrient management specialists and observations of the
watershed. The sheep herd was composed of lambs and ewes. The lamb
population was expressed in equivalent sheep numbers. The equivalent sheep
population calculated for lambs was based on the assumption that the average
weight of a lamb is half of the weight of a sheep. The lamb population for the
Linville Creek watershed was estimated to be 850 animals. The equivalent sheep
population for the lambs was 425. A similar approach was used for goats. The
equivalent number of sheep for goats was calculated based on the ratio of animal
weights. It was assumed that the average weight for a goat and a sheep were
140 lb and 60 lb, respectively (ASAE, 1998). The equivalent number of goats
(140) was calculated as the ratio of the goat weight to the sheep weight (140/60)
times the number of goats in the watershed (60). The total number of sheep for
the Linville Creek watershed was the sum of the number of ewes (425),
equivalent number of lambs (425), and the equivalent number of goats (140), for
a total of 990 animals. The sheep were kept on pastures 1 and 2. The relative
stocking density for sheep was estimated to be 0.4 for pasture 1 and 0.6 for
pasture 2 based on discussions with local producers. The equivalent sheep
population for each sub-watershed is shown in Table 4.13. Sheep and goats are
not usually confined and tend not to wade or defecate in the streams. Therefore,
Total Maximum Daily Load Development for Linville Creek: Bacteria and GeneralStandard (Benthic) Impairments
61
the fecal coliform produced by sheep and goats was added to the loads applied
to pastures 1 and 2.
Table 4.13. Sheep and Goat Populations in Linville Creek Sub-Watersheds.
Total Maximum Daily Load Development for Linville Creek: Bacteria and GeneralStandard (Benthic) Impairments
96
Figure 6.10. BOD (5-day) Concentration in Linville Creek
Figure 6.11. COD Concentration in Linville Creek
Nutrients
Nitrate (dissolved nitrogen) (Figure 6.12) and orthophosphate (dissolved
phosphorus) (Figure 6.13) concentrations are above those needed for
eutrophication (eutrophic sufficiency levels). Three samples had phosphorus
concentrations above the DEQ “threatened waters” threshold of 0.2 mg/L.
Linville Creek received a high total nitrogen (TOTN) rank in the VADCR 2000
Nonpoint Source Assessment. The ratio of nitrogen to phosphorus is 54.5, which
indicates that phosphorus is the limiting nutrient. Even though nutrient levels are
0
5
10
15
20
25
30
35
40
Jan-96 Jan-97 Jan-98 Jan-99
CO
D, m
g/L
Total Maximum Daily Load Development for Linville Creek: Bacteria and GeneralStandard (Benthic) Impairments
97
above eutrophic levels, because DO levels are not showing the impacts of
accelerated algal growth, nutrients are not considered a likely stressor.
0
1
2
3
4
5
6
7
8
9
Jan-96 Jan-97 Jan-98 Jan-99 Jan-00 Jan-01 Jan-02
con
cen
trat
ion
, mg
/LLNV_Nitrate OPE_Nitrate Eutrophic Sufficiency
Figure 6.12. Nitrogen Concentrations in Linville and Upper OpequonCreeks.
0
0.2
0.4
0.60.8
1
1.2
1.4
1.6
Jan-96 Jan-97 Jan-98 Jan-99 Jan-00 Jan-01 Jan-02
con
cen
trat
ion
, mg
/L
LNV_Total P OPE_Total P
Eutrophic Sufficiency Threatened
Figure 6.13. Phosphorus Concentrations in Linville and Upper OpequonCreeks.
Total Maximum Daily Load Development for Linville Creek: Bacteria and GeneralStandard (Benthic) Impairments
98
6.4. Most Probable Stressor
Many of the %haptobenthos scores in the MAIS assessment (Table 3.3)
were low, indicating poor habitat for functional groups requiring a coarse, clean
sediment substrate. Linville Creek also received repeated low habitat scores for
bank stability, substrate availability, bank vegetation, riparian vegetation, and
embeddedness (Table 3.3). Additionally, there was observed trampling and
damage to stream banks from livestock having access to the creek. Taken
together, these observations support the case for sediment being the most likely
stressor on the benthic community. Based on this analysis, sediment will be
used as the target pollutant upon which the benthic TMDL for Linville Creek will
be based. In addition, reductions in sediment loadings are usually associated
with reductions in loadings from organic matter and nutrients. Thus, reductions
in sediment loadings will also reduce possible impacts from these other potential
stressors.
Total Maximum Daily Load Development for Linville Creek: Bacteria and GeneralStandard (Benthic) Impairments
99
CHAPTER 7: THE REFERENCE WATERSHEDMODELING APPROACH
7.1. Introduction
Because Virginia has no numeric in-stream criteria for sediment, a
“reference watershed” approach was used to set allowable sediment loading
rates in the impaired watershed.
The reference watershed approach pairs two watersheds – one whose
streams are supportive of their designated uses and one whose streams are
impaired. This reference watershed may or may not be the same as the
biological reference watershed (i.e., the watershed used for determining
comparative biological metric scores). The reference watershed is selected on
the basis of similarity of land use, topographical, ecological, and soils
characteristics with those of the impaired watershed. This approach is based on
the assumption that reduction of the stressor loads in the impaired watershed to
the level of the loads in the reference watershed will result in elimination of the
benthic impairment.
The reference watershed approach involves assessment of the impaired
reach and its watershed, identification of potential causes of impairment through
a benthic stressor analysis, selection of an appropriate reference watershed,
model parameterization of the reference and TMDL watersheds, definition of the
TMDL endpoint using modeled output from the reference watershed, and
development of alternative TMDL reduction (allocation) scenarios.
7.2. Selection of Reference Watershed for Sediment
7.2.1. Comparison
The initial list of potential reference watersheds was composed of all
watersheds previously used as biological references for Linville Creek, the two
Total Maximum Daily Load Development for Linville Creek: Bacteria and GeneralStandard (Benthic) Impairments
100
watersheds most recently used as sediment reference watersheds for the Blacks
Run and Cooks Creek watersheds, and one other watershed also used as a
biological reference watershed in the same region. Because sediment was
identified as the pollutant responsible for the benthic impairment, the comparison
of watershed characteristics focused, not only on geologic and ecologic
similarities, but also on sediment-generating characteristics. Minimal differences
exist among the eco-region classifications for all of the potential reference
watersheds. All watersheds are in the Central Appalachian Ridges and Valleys
Level III ecoregion, and lie predominantly in the Northern Limestone/Dolomite
Valleys Level IV ecoregion.
Table 7.1 compares the various physical and sediment-related
characteristics of the candidate reference watersheds to the characteristics of the
impaired watershed. The characteristics chosen to be representative of
sediment generation and transport were land use distribution, non-forested
average soil erodibility, and average non-forested percent slope. The Universal
Soil Loss Equation (USLE) K-factor was used as an index of the erosivity of the
soils in the watersheds, and was calculated as a weighted average of the soil K-
factors in the watershed.
Table 7.1. Comparison of Physical and Sediment-Related Characteristics
Non-Forested Spring 2002Landuse Distribution K-factor Year 2000 Population RBP II
Station ID Stream NameArea (ha)
Urban (%)
Forest (%)
Agr (%) SSURGO STATSGO
Slope (%)
Elevation (meters)
Non-Sewered Total
Non-Sewered
% Score% of
ReferenceLNV000.71 Linville Creek 12,046 2% 23% 75% 0.29 0.32 8.63 411.6 3,826 5,757 66% 20 47.6OPE034.53 Opequon Creek 15,123 5% 35% 60% 0.31 0.30 5.60 224.1 16,322 19,809 82% 24 57.1STC000.72 Strait Creek 672 0% 71% 29% NA 0.24 18.50 988.3 57 57 100% 46 100STY004.24 Stony Creek 19,768 1% 87% 12% 0.26 0.27 11.67 507.7 2,126 3,112 68% 10 23.8BLP000.79 Bullpasture River 28,495 0% 81% 18% NA 0.25 7.73 794.6 527 527 100% 44 95.6CWP050.66 Cowpasture River 56,604 0% 86% 14% NA 0.26 13.81 748.4 994 994 100% 42 100HYS001.41 Hays Creek 20,801 0% 52% 48% 0.31 0.31 12.53 526.2 1,600 1,600 100% 36* 81.8JKS067.00 Jackson River 31,429 0% 81% 19% NA 0.26 13.93 848.7 705 705 100% 34* 77.3
* Hays Creek and Jackson River were last sampled in Fall 2000.
7.2.2. The Selected Reference Watershed
Based on the information presented in the previous two sections, the
Upper Opequon Creek watershed was selected as the reference watershed for
Total Maximum Daily Load Development for Linville Creek: Bacteria and GeneralStandard (Benthic) Impairments
101
Linville Creek. Land use distribution was considered the most important
characteristic considered in this comparison, and the Upper Opequon was the
only potential reference watershed with a significant urban component that was
still predominantly comprised of agricultural land uses. The Upper Opequon
watershed is located in the same Level III ecoregion as Linville Creek and shares
the same major Level IV ecoregion. The Upper Opequon Creek watershed also
is most similar in size to Linville Creek. The other characteristics - K-factors,
slope, elevation, and percent non-sewered populations were very comparable to
those of Linville Creek.
7.3. Sediment TMDL Modeling Endpoint
The reference watershed approach for Linville Creek uses the sediment
loading rate in the non-impaired Upper Opequon watershed as the TMDL target
endpoint. Reductions from various sources will be specified in the alternative
TMDL scenarios that achieve the TMDL target within the impaired Linville Creek
watershed. Reductions in sediment load to levels found in the reference
watershed are expected to allow benthic conditions to return to a non-impaired
state.
Total Maximum Daily Load Development for Linville Creek: Bacteria and GeneralStandard (Benthic) Impairments
102
CHAPTER 8: MODELING PROCESS FOR SEDIMENTTMDL DEVELOPMENT
8.1. Introduction
8.2. Source Assessment of Sediment
Sediment is generated in the Linville Creek watershed through the
processes of surface runoff; channel erosion, which includes streambank erosion
and trampling by livestock; and from point source inputs. Sediment generation is
accelerated through human-induced land-disturbing activities related to a variety
of agricultural, forestry, and urban land uses.
8.2.1. Surface Runoff
During runoff events, sediment loading occurs from both pervious and
impervious surfaces in the watershed. For pervious areas, soil is detached by
rainfall impact and transported by overland flow to nearby streams. Vegetative
cover, soil erodibility, slope, slope length, rainfall intensity and duration, and land
management practices influence this process. During periods without rainfall,
dirt, dust, and fine sediment build up on impervious areas through dry deposition,
which is then subject to washoff during rainfall events. Sediment generated from
impervious areas can also be influenced through management practices, such as
street sweeping, which can reduce the surface load subject to washoff.
8.2.2. Channel Erosion
Channel erosion is a natural geologic process that occurs within the
stream channel during runoff events, contributing to watershed sediment loads.
Channel erosion is also increased by upstream human-induced land-disturbing
activities that increase the frequency and magnitude of runoff events. Animals
on pastures with access to streams also contribute to channel erosion. Livestock
hooves detach clumps of soil from stream banks, and push the loosened soil
Total Maximum Daily Load Development for Linville Creek: Bacteria and GeneralStandard (Benthic) Impairments
103
downslope into streams adjacent to these areas, delivering sediment to the
stream independent of runoff events.
8.2.3. Point Source TSS Loads
Fine sediment is included in total suspended solids (TSS) loads that are
permitted for various VPDES and 1000 gpd facilities within the watershed (see
Section 8.5.3).
8.3. GWLF Model Description
The Generalized Watershed Loading Functions (GWLF) model was
developed for use in ungaged watersheds (Haith et al., 1992). The Visual Basic
version of GWLF with modifications for use with ArcView (AVGWLF) was used in
this study (Evans et al., 2001). Additional modifications were made to the model
to allow for variable inputs and outputs of sediment buildup and washoff from
impervious surfaces.
Loading functions are used as a compromise between the empiricism of
export coefficients and the complexity of comprehensive water quality simulation
models. GWLF is a continuous simulation spatially-lumped parameter model that
operates on a daily time step. The model estimates runoff, sediment, and
dissolved and attached nitrogen and phosphorus loads to streams from
watersheds with a combination of point and non-point sources of pollution. The
model considers flow inputs from both surface runoff and groundwater, and
nutrient inputs from septic systems. The hydrology in the model is simulated with
a daily water balance procedure that takes into consideration various types of
storages within the system. Runoff is generated based on the Soil Conservation
Service’s Curve Number method as presented in Technical Release 55 (SCS,
1986). Erosion is generated using a modification of the Universal Soil Loss
Equation. The sediment supply component uses a delivery ratio together with
the erosion estimates, and sediment transport is estimated by considering the
transport capacity of the runoff. Channel erosion is modeled using the
Total Maximum Daily Load Development for Linville Creek: Bacteria and GeneralStandard (Benthic) Impairments
104
relationships developed by Evans in AVGWLF (Personal Communication, B. M.
Evans, 2002).
The GWLF model requires three input files for weather, transport, and
nutrient data. The weather file contains daily temperature and precipitation for
the period of simulation. The transport file contains primarily input data related to
hydrology and sediment transport, while the nutrient file contains nutrient values
for the various land uses, point sources, and septic systems.
The following modifications were made to the Penn State Visual Basic version of
the GWLF model, as incorporated in their ArcView interface for the model,
AVGWLF v. 3.2:
• Although the model simulations are hard coded to begin in April the modelwas recoded to output data beginning with the following January forobtaining summary results on a calendar year basis.
• Urban sediment washoff was added to replace an erroneous formula thatcalculated USLE erosion from impervious areas.
• The groundwater flow component was modified in order to matchminimum base flows estimated by the Chesapeake Bay Watershed Modelfor a statewide nonpoint source assessment study conducted for Virginiawatersheds (Yagow, 2002).
• A regional ET adjustment factor was added.• The conditional assignment of dissolved N and P concentrations to each
agricultural land use receiving manure was corrected.• A procedure was developed to automatically calculate a correction factor
to account for differences between calculations of watershed totalsediment yield and summations of sediment yield from individual landuses. Since the correction applied only to the organic component,nutrients were separated into dissolved and organic components.
8.4. Input Data Requirements
8.4.1. Climatic Data
Hourly precipitation and temperature data were obtained from the National
Weather Service stations closest to each watershed, as shown in Table 8.1 and
Figure 8.1. Missing data and distributions in the weather file were filled in based
on the available weather records from surrounding stations. The hourly
precipitation data were summed as daily totals, the hourly temperature data were
Total Maximum Daily Load Development for Linville Creek: Bacteria and GeneralStandard (Benthic) Impairments
105
transformed to daily averages, and both were converted to their respective metric
units (cm and °C) for use with the GWLF model. From earlier work with the
statewide NPS assessment as part of Virginia’s 2002 305(b) report (Yagow,
2002), a statewide Thiessen polygon layer had been created from 153 available
NWS daily weather stations in Virginia. The daily sequence of precipitation and
temperature values for the GWLF model was calculated as a Thiessen weighted
average of the two closest stations using the weights listed in Table 8.1.
Weather data for the Timberville station (4.5 miles NE of the watershed) were not
available after 1995, so during the 1996-1999 period, precipitation and
temperature data for Linville were obtained solely from the Dale Enterprise
station (approximately 1.5 miles southwest of the watershed).
Table 8.1. Weather Data Sources.
Watershed Weather StationNWS
Coop IDThiessen Weight
Linville Creek Dale Enterprise 442208 0.7370Timberville 448448 0.2630
Upper Opequon Creek Winchester WINC 449181 0.6604Winchester 7 SE 449186 0.3396
Total Maximum Daily Load Development for Linville Creek: Bacteria and GeneralStandard (Benthic) Impairments
106
#S
#S
USGS 01632082
DALE ENTERPRISE
TIMBERVILLE 3 E
#S #S
WINCHESTER WINC
WINCHESTER 7 SEUSGS 01615000
Linville Creek
Upper Opequon Creek
#S
#S
USGS 01632082
DALE ENTERPRISE
TIMBERVILLE 3 E
#S #S
WINCHESTER WINC
WINCHESTER 7 SEUSGS 01615000
Linville Creek
Upper Opequon Creek
Figure 8.1. Location of USGS Flow Gages and NWS Weather Stations forLinville and Upper Opequon Watersheds.
8.4.2. Land Use
Linville Creek has a detailed digital land use layer, developed by the
VADCR from digital ortho-photo quarter quads, to assist HSPF model
development for the Linville Creek bacteria TMDL. However, a comparable
digital land use data layer was not available for the Upper Opequon. Therefore,
a decision was made to use the Multi-Resolution Land Characteristics (MRLC)
2000 digital land use layer as the land use source for both watersheds, to
maintain consistency between the two watersheds. As part of the 2002
Statewide Nonpoint Source Pollution Assessment for the Virginia 305(b) Report,
VADCR modified the MRLC land use categorization and included several derived
land use categories to facilitate accounting for best management practice (BMP)
implementation, as shown in Table 8.2. The nine land use categories and their
distribution within the Linville Creek and the Upper Opequon Creek watersheds
are shown in Table 8.3.
Total Maximum Daily Load Development for Linville Creek: Bacteria and GeneralStandard (Benthic) Impairments
107
Table 8.2. Consolidation of MRLC Land Use CategoriesMRLC MRLC Categories Used for GIS Categories for Bay Model Categories for DCRClass Code Original MRLC Categories Parameter Derivation Comparison/Calibration Load Assessment
1 11 open water
8 42 evergreen forest forest9 43 mixed forest
10 41 deciduous forest forest (S) forest disturbed forest2
The Upper Opequon watershed was recently used as a reference
watershed for the Blacks Run TMDL (Tetra Tech, 2002) and was modeled using
the GWLF model. Ideally, this set of calibrated parameters could be used in an
identical fashion with the Linville TMDL. However, as development of the
databases proceeded for the Linville and Upper Opequon watersheds, a different
categorization of land uses was selected to better represent the potential
pollutants. The new categorization process necessitated a re-evaluation and re-
calibration of parameter values for the Upper Opequon. The re-evaluation was
also consistent with our principle of evaluating all parameters using the same
procedures for each watershed, in order to maintain their comparability for the
reference watershed approach. The GWLF parameter values were evaluated
from a combination of GWLF user manual guidance, AVGWLF procedures,
procedures developed during the statewide NPS pollution assessment, best
professional judgment, and values used in the Blacks Run TMDL (Tetra Tech,
2002). Parameters were generally evaluated using GWLF manual guidance,
except where noted otherwise. Hydrologic and sediment parameters are all
included in GWLF’s transport input file with the exception of urban sediment
buildup rates, which are in the nutrient input file.
Total Maximum Daily Load Development for Linville Creek: Bacteria and GeneralStandard (Benthic) Impairments
109
Watershed-Related Parameter Descriptions• Unsaturated Soil Moisture Capacity (SMC): The amount of moisture in the
root zone, evaluated as a function of the area-weighted soil type attribute -available water capacity.
• Recession coefficient (day-1): The recession coefficient is a measure ofthe rate at which streamflow recedes following the cessation of a storm,and is approximated by averaging the ratios of streamflow on any givenday to that on the following day during a wide range of weather conditions,all during the recession limb of each storm’s hydrograph.
• Seepage coefficient (day-1): The seepage coefficient represents theamount of flow lost as seepage to deep storage.
The following parameters were initialized by running the model for a 9-monthperiod prior to the selected period for which loads were calculated:
• Initial unsaturated storage (cm): Initial depth of water stored in theunsaturated (surface) zone.
• Initial saturated storage (cm): Initial depth of water stored in the saturatedzone.
• Initial snow (cm): Initial amount of snow on the ground at the beginning ofthe simulation.
• Antecedent Rainfall for each of 5 previous days (cm): The amount ofrainfall on each of the five days preceding the first day in the weather file.
Month-Related Parameter Descriptions• Month: Months were ordered, starting with April and ending with March, in
keeping with the design of the GWLF model and its assumption thatstored sediment is flushed from the system at the end of each April-Marchcycle. Model output was modified in order to summarize sediment loadson a calendar-year basis.
• ET_CV: Composite evapo-transpiration cover coefficient, calculated as anarea-weighted average from land uses within each watershed.
• Hours per Day: Mean number of daylight hours.• Erosion Coefficient: This is a regional coefficient used in Richardson’s
equation for calculating daily rainfall erosivity. Each region is assignedseparate coefficients for the months of October-March, and for April-September. Values used were from the Blacks Run TMDL (Tetra Tech,2002).
Land Use-Related Parameter Descriptions• Curve Number: The SCS curve number (CN) is used in calculating runoff
associated with a daily rainfall event.
Total Maximum Daily Load Development for Linville Creek: Bacteria and GeneralStandard (Benthic) Impairments
• Sediment delivery ratio: The fraction of erosion – detached sediment –that is transported or delivered to the edge of the stream, calculated as aninverse function of watershed size (Evans et al., 2001).
Land Use-Related Parameter Descriptions• USLE K-factor: The soil erodibility factor was calculated as an area-
weighted average of all component soil types.• USLE LS-factor: This factor is calculated from slope and slope length
measurements by land use. Slope is evaluated by GIS analysis, andslope length is calculated as an inverse function of slope.
• USLE C-factor: The vegetative cover factor for each land use wasevaluated following GWLF manual guidance, Wischmeier and Smith(1978), and Hession et al. (1997).
• Daily sediment buildup rate on impervious surfaces: The daily amount ofdry deposition deposited from the air on impervious surfaces on dayswithout rainfall, assigned using GWLF manual guidance.
Channel Erosion Parameter Descriptions• % Developed land: percentage of the watershed with urban-related land
uses.• Animal density: calculated as the number of beef and dairy 1000-lb
equivalent animal units (AU) divided by the watershed area in acres.• Soil erodibility: Watershed-averaged soil erodibility (USLE K-factor).• Number: Watershed-averaged runoff curve number (CN).• Total stream length in meters.• Stream length with livestock access: calculated as the total stream length
in the watershed where livestock have unrestricted access to streams,resulting in streambank trampling, in meters.
8.5. Sediment Pollutant Sources
8.5.1. Surface Runoff
Pervious area sediment loads were modeled explicitly in the GWLF using
sediment detachment, a modified USLE erosion algorithm, and a sediment
delivery ratio to calculate edge-of-stream (EOS) loads and are reported on a
monthly basis by land use. Impervious area sediment loads were modeled
explicitly in GWLF using an exponential buildup-washoff algorithm.
Total Maximum Daily Load Development for Linville Creek: Bacteria and GeneralStandard (Benthic) Impairments
111
8.5.2. Channel Erosion
Channel erosion was modeled explicitly within GWLF using the algorithms
included in the AVGWLF adaptation of the GWLF model (Evans et al., 2001). In
these equations, channel erosion is calculated as a function of daily stream flow
volume and a coefficient developed through regression. The regression
coefficient is calculated as a function of the percentage of developed land, animal
density, watershed-averaged soil erodibility, the watershed-averaged runoff
curve number, and the total stream length. For the TMDL allocation scenarios,
the reduction from restricting livestock access to streams was calculated as the
product of the percentage of total stream length with livestock access, the
percentage reduction of livestock access corresponding with the fecal coliform
TMDL, and an estimated percentage of the channel erosion due to trampling,
where livestock had stream access.
8.5.3. Point Sources
Because the reference watershed TMDL is calculated based on relative
existing unit area loads, estimates of actual contributions were performed for
existing conditions, rather than permitted conditions. Sediment loads from point
sources were calculated using TSS concentrations and flow volumes. For a
detailed list of general permitted point source dischargers, see Table 4.3. For
permitted VPDES facilities (Table 4.2), available monthly daily monitoring report
(DMR) data for each facility (maximum Concentration and maximum Daily Flow)
were used to calculate TSS daily loads for each monthly sample. The average of
all of these samples was calculated and multiplied by 365¼ days/yr to represent
the average annual existing sediment load from each facility in the Linville and
Upper Opequon watersheds, as reported in Table 8.4. For the TMDL
calculations, permitted point source discharge contributions were calculated as
the maximum permitted daily flow multiplied by the maximum permitted TSS
concentration.
Total Maximum Daily Load Development for Linville Creek: Bacteria and GeneralStandard (Benthic) Impairments
112
Table 8.4. Average Annual Existing Point Source TSS Loads (t/yr).
Linville Creek Point Sources Upper Opequon Creek Point Sources
VPDES ID Name TSS (Mg/yr) VPDES ID Name TSS (Mg/yr)85588 Field Unit #8 0.091 27600 A & K Car Wash 0.00679898 Broadway STP 0.098 75191 Parkins Mill STP 8.084
88471 Frederick Co. Landfill 2.71188722 Stonebrook STP 0.01189010 Franciscan Center 0.001
VPDES Facility Totals 0.19 10.811000 gpd Units 28 units 1.16 15 units 0.62Point Source Totals 1.35 11.43
Because the 1000 gpd facilities are covered under a general permit, no
monthly DMR data were required or available. Therefore, sediment loads for
these facilities were calculated as the number of facilities multiplied by the annual
permitted TSS load for each facility. The permitted daily average TSS
concentration of 30 mg/L translates into an annual TSS load of 0.0415 t/yr for
each unit, with the totals also given in Table 8.4.
Sediment loads from both VPDES and 1000 gpd facilities were calculated
in spreadsheets outside of the GWLF model and added to GWLF model outputs
prior to analysis.
8.6. Critical Conditions and Seasonal Variations
8.6.1. Critical Conditions
The GWLF model is a continuous simulation model that uses daily time
steps for weather data and water balance calculations. The period of rainfall
selected for modeling was chosen as a multi-year period that was representative
of typical weather conditions for the area, and included “dry,” “normal,” and “wet”
years. The model, therefore, incorporated the variable inputs needed to
represent critical conditions during low flow, generally associated with point
source loads, and critical conditions during high flow, generally associated with
nonpoint source loads.
Total Maximum Daily Load Development for Linville Creek: Bacteria and GeneralStandard (Benthic) Impairments
113
8.6.2. Seasonal Variability
The GWLF model used for this analysis considered seasonal variation
through a number of mechanisms. Daily time steps were used for weather data
and water balance calculations. The model also used monthly-variable
parameter inputs for evapo-transpiration cover coefficients, daylight hours/day,
and rainfall erosivity coefficients for user-specified growing season months.
8.7. Model Calibration for Hydrology
The GWLF model was originally developed for use in ungaged
watersheds (Haith et al., 1992). However, the BasinSim adaptation of the model
(Dai et al., 2000) recommends hydrologic calibration of the model, and
preliminary calibrated model results for the gaged Linville Creek watershed
showed an 18% reduction in the percent error between simulated and observed
monthly runoff. Because observed runoff data were available at both Linville
Creek and its reference watershed, Upper Opequon Creek, it was logical to
perform hydrologic calibration on both watersheds. Because GWLF was used to
compare the simulation results between the target and its reference watershed,
both watersheds were calibrated in a similar manner.
The purpose of calibration was to adjust parameter values within the
model so that simulated model output more closely matched observed data. The
reason for performing the hydrologic calibration was to enable simulation of the
hydrology-dependent components as accurately as possible. The purpose of
calibration for the reference watershed approach was to provide a more
representative total flow and flow distribution on which to base the sediment
loading functions. The TMDL modeling runs for future conditions were made
using the same weather files that were used for calibration.
The National Weather Service (NWS) has a much denser network of
stations for recording rainfall than does the U.S. Geological Survey (USGS) for
recording daily flow. Therefore, in any calibration effort, flow data are generally
Total Maximum Daily Load Development for Linville Creek: Bacteria and GeneralStandard (Benthic) Impairments
114
the limiting factor. Fortunately, USGS flow gages are located near the outlets of
both the Linville and the Upper Opequon Creek watersheds. Daily observed flow
measurements were obtained for both stations and compared with GWLF model
output. Figure 8.1 shows the location of both the USGS flow gages and NWS
precipitation gages in relation to each watershed, and Table 8.5 shows the
available period of record for each station.
Table 8.5. Available USGS Daily Flow Data
Watershed USGS Gage# Daily Flow RecordLinville Creek 01632082 08-09-1985 to 09-30-2001Upper Opequon Creek 01615000 10-01-1943 to 10-17-1997
The common period of record between these two stations is 08-09-1985 to
10-17-1997, which contains approximately 12 years of data. The calibration
period was chosen as the most recent 10-year period on a calendar year basis,
1988–1997. This resulted in a calibration period for the Upper Opequon
watershed that was three months shorter than the period for the Linville Creek
watershed.
GWLF uses daily rainfall inputs and generates monthly runoff outputs.
Hydrologic calibration was performed based on monthly runoff (flow) totals. The
parameters adjusted during hydrologic calibration included land use curve
numbers, the recession coefficient, and the seepage coefficient. GWLF can
produce outputs of monthly surface runoff by land use, as well as monthly
groundwater flow, which is assumed to represent the base flow component.
Calibration was performed separately on base flow and surface runoff. The
USGS software program HYSEP (Sloto and Crouse, 1996) was used to estimate
the percentage of base flow for each watershed, as summarized in Table 8.6,
using the local minimum option of that program.
Total Maximum Daily Load Development for Linville Creek: Bacteria and GeneralStandard (Benthic) Impairments
115
Table 8.6. Results from HYSEP Baseflow Separation
Monthly Baseflow %Watershed USGS # Period Assessed Min Mean Max
Linville Creek 01632082 01/88 – 12/97 44.2 61.4 75.0Upper Opequon Creek 01615000 01/88 – 09/97 36.6 48.4 66.4
Spreadsheets were constructed and used to analyze model output after
each model run, and to calculate parameter adjustments for the next iteration of
calibration. Within the spreadsheets, comparisons were made between simulated
and observed runoff for the flow components, seasonal distribution, monthly
runoff time series, and cumulative runoff. Base flow was calibrated through
adjustments to the recession and seepage coefficients, while surface runoff was
calibrated by adjusting the land use-related SCS curve numbers.
The results of the hydrologic calibration for Linville Creek are presented as
the monthly runoff time series in Figure 8.2 and cumulative runoff in Figure 8.3,
along with the flow and seasonal distributions in Table 8.7. Corresponding
results for Upper Opequon Creek are presented in Figures 8.4 and 8.5 and Table
8.8.
The monthly runoff time series for Linville showed a generally good
correspondence between observed and simulated monthly runoff, with a
correlation coefficient of 0.917. Total simulated runoff was 0.2% less than the
observed value. The simulated percentages of runoff distributed among seasons
were all within 10% of observed values, with the exception of summer runoff.
The difference between observed and simulated individual season average
annual runoff totals were within ±0.6 cm/yr.
The monthly runoff time series for Upper Opequon also showed a
generally good correspondence between observed and simulated monthly runoff,
with a correlation coefficient of 0.939. Total simulated runoff was only 2.9% less
than the observed value. The simulated percentages of runoff distributed among
seasons were all within 10% of observed values with the exception of fall runoff.
Total Maximum Daily Load Development for Linville Creek: Bacteria and GeneralStandard (Benthic) Impairments
116
The difference between observed and simulated individual season average
annual runoff totals were within ±1.0 cm/yr.
Table 8.9 summarizes the changes made during calibration for the three
GWLF parameters used for hydrologic calibration. In order to approximate the
percentage of total inflow coming from surface runoff during calibration, it was
necessary to increase the curve numbers to unusually high values. Therefore,
rather than adjusting base flow to the HYSEP average base flow value, a higher
value was chosen within the observed range for each station. The base flow
percentage was increased to the mean + 2/3 x (maximum – mean) in order to
reduce the curve numbers to more reasonable values. Even with the base flow
adjustment, however, it was still necessary to increase most of the land use-
related runoff curve numbers by 15-16% above those recommended by NRCS
and GWLF guidance documents in order to match observed runoff.
In summary, the correlations between simulated and observed total runoff
in both watersheds were quite good with correlation coefficients above 90%.
Cumulative monthly runoff over the 10-year period was matched within 2.7% of
observed totals. The division of flow between surface runoff and base flow was
within 3% of the adjusted HYSEP base flow percentage for each watershed. A
slightly larger variability was seen in the distribution among seasons, although
even these were mostly within 10%. Part of these differences can be explained
by the expected variability between measurements at a single precipitation
station and how rainfall is actually distributed over an entire watershed. The
major part of the differences, however, relate to the fact that the GWLF model is
a daily time-step, lumped parameter model. As such, it would be very surprising
indeed, if it replicated all flow regimes and seasonal distributions consistently
under all conditions. However, because the reference watershed approach uses
average loading over long periods and utilizes comparably parameterized and
calibrated watersheds, the calibrated GWLF model should provide reasonable
load comparisons for development of a TMDL.
Total Maximum Daily Load Development for Linville Creek: Bacteria and GeneralStandard (Benthic) Impairments
117
A complete listing of all GWLF parameter values evaluated for the GWLF
transport file for both watersheds during hydrologic calibration are shown in
Tables 8.10 through 8.12. Table 8.10 lists the various watershed-wide
parameters and their values, Table 8.11 displays the monthly variable evapo-
transpiration cover coefficients, and Table 8.12 details the various land use-
LA = load allocation (nonpoint source contributions); and
MOS = margin of safety.
While developing allocation scenarios to implement the bacteria TMDL, an
implicit margin of safety (MOS) was used by using conservative estimations of all
factors that would affect the bacteria loadings in the watershed (e.g., animal
numbers, production rates, and contributions to streams). These factors were
estimated in such a way as to represent the worst-case scenario; i.e., these
factors would describe the worst stream conditions that could exist in the
watershed. Creating a TMDL with these conservative estimates ensures that the
worst-case scenario has been considered and that no water quality standard
violations will occur if the TMDL plan is followed.
The time period selected for the load allocation study was September
1987 to December 2001, a portion of the period for which observed data were
available. This period was selected because it covers the period in which water
quality violations were observed; it incorporates average rainfall, low rainfall, and
high rainfall years; and the climate during this period caused a wide range of
hydrologic events including both low and high flow conditions.
The calendar-month geometric mean values used in this report are
geometric means of the daily concentrations. Because HSPF was operated with
a one-hour time step in this study, 24 hourly concentrations were generated each
day. To estimate the calendar-month geometric mean from the hourly HSPF
output, we took the arithmetic mean of the hourly values on a daily basis, and
then calculated the geometric mean from these average daily values.
The guidance for developing an E. coli TMDL offered by VADEQ is to
develop input for the model using fecal coliform loadings as the bacteria source
in the watershed. Then, VADEQ suggests the use of a translator equation they
Total Maximum Daily Load Development for Linville Creek: Bacteria and GeneralStandard (Benthic) Impairments
123
developed to convert the daily average fecal coliform concentrations output by
the model to daily average E. coli concentrations. The translator equation is:
E. coli concentration = 2-0.0172 x (FC concentration0.91905) [9.2]
where the bacteria concentrations (FC and E. coli) are in cfu/100mL.
This equation was used to convert the fecal coliform concentrations output
by HSPF to E. coli concentrations. Daily E. coli loads were obtained by using the
E. coli concentrations calculated from the translator equation and multiplying
them by the average daily flow. Annual loads were obtained by summing the
daily loads and dividing by the number of years in the allocation period.
9.1.2. Existing Conditions
Analyses of the simulation results for the existing conditions in the
watershed for the 1987 to 2001 allocation period (Table 9.1) show that direct
deposition of manure by cattle into the stream is the primary source of E. coli in
the stream. Direct deposition of manure by cattle into Linville Creek is
responsible for approximately 45% of the mean daily E. coli concentration. The
next largest contributors are NPS loadings from upland pervious land segments
(manure applied to cropland, pastures, and forests by livestock, wildlife, and
other NPS sources), which is responsible for 31% of the mean daily E. coli
concentration. Direct deposits to streams by wildlife are responsible for 19% of
the mean daily E. coli concentration, while straight pipes contribute 6% of the
concentration. Runoff from impervious areas contributed less than 1% of the
mean daily E. coli concentration.
Total Maximum Daily Load Development for Linville Creek: Bacteria and GeneralStandard (Benthic) Impairments
124
Table 9.1. Relative contributions of different E. coli sources to the overall E.coli concentration for the existing conditions in the Linville Creekwatershed.
Source Mean Daily E. coliConcentration by Source,
cfu/100mL
Relative Contribution bySource
All sources 1,075Direct deposits of cattlemanure to stream 485 45.1%
Figure 9.1. Relative contributions of different E. coli sources to thecalendar-month geometric mean E. coli concentration for existingconditions in the Linville Creek watershed.
9.1.3. Waste Load Allocation
Waste load allocations were assigned to each point source facility in the
Linville Creek watershed. Point sources were represented in the allocation
scenarios (Section 9.1.4) by their current permit conditions; no reductions were
required from point sources in the TMDL. Current permit requirements are
expected to result in attainment of the E. coli WLA as required by the TMDL.
Point source contributions, even in terms of maximum flow, are minimal.
Therefore, no reasonable potential exists for these facilities to have a negative
impact on water quality and there is no reason to modify the existing permits.
The point source facilities are discharging at their criteria and therefore cannot
cause a violation of the water quality criteria. Note that the E. coli WLA value
presented in Section 9.1.5 represents the sum of all point source E. coli WLAs in
Linville Creek.
Total Maximum Daily Load Development for Linville Creek: Bacteria and GeneralStandard (Benthic) Impairments
126
9.1.4. Allocation Scenarios
A variety of allocation scenarios were evaluated to meet the E. coli TMDL
goal of a calendar-month geometric mean of 126 cfu/100mL and the single
sample limit of 235 cfu/100mL. The scenarios and results are summarized in
Table 9.2. Because direct deposition of E. coli by cattle into streams was
responsible for 45% of the mean daily E. coli concentration (Table 9.1) and the
vast majority of the calendar-month geometric mean value, all scenarios
considered required reductions in or elimination of direct deposits by cattle.
In all scenarios considered in Table 9.2, non-permitted straight-pipe
contributions from on-site waste disposal systems were eliminated because
these contributions are illegal under existing state law. Nonpoint source
contributions from impervious land segments were neglected because their
contribution to the calendar-month geometric mean concentration is negligible
(Table 9.1). In scenario 01, straight-pipes were eliminated and high reductions
(at least 90%) were made in direct deposits by cattle and wildlife to streams,
along with large reductions from land surface loads (cropland, pasture, loafing
lots, and residential), yet there were still violations of both the calendar-month
geometric mean (3%) and single sample (9%) E. coli standards (Table 9.2). The
same was true for scenarios 02 and 05. Scenarios 03, 04, 06, and 07 all met the
calendar-month and single sample E. coli standards. Scenario 07 was selected
as the TMDL allocation because this scenario had slightly lower reductions
required for cropland, pasture, residential areas, and wildlife direct deposit
compared to the other scenarios that met the E. coli standards. The
concentrations for the calendar-month and daily average E. coli values are
shown in Figure 9.2 for the TMDL allocation (Scenario 07), along with the
standards.
Total Maximum Daily Load Development for Linville Creek: Bacteria and GeneralStandard (Benthic) Impairments
127
Table 9.2. Bacteria allocation scenarios for Linville Creek watershed.% Violation of E.
coli StandardFecal Coliform Loading Reduction Required to Meet the E coli Standards, %
Calendar-Month Standard Daily Averge Conc Single Sample Standard Calendar-Month Geometric Mean Conc
Figure 9.2. Calendar-month geometric mean standard, single samplestandard, and successful E. coli TMDL allocation (AllocationScenario 07 from Table 9.2) for Linville Creek.
Loadings for existing conditions and TMDL allocation scenario (Scenario
07) are presented for nonpoint sources by land use in Table 9.3 and for direct
nonpoint sources in Table 9.4. It is clear that extreme reductions in both loadings
from land surfaces and from sources directly depositing in the streams of Linville
Creek are required to meet both the calendar-month geometric mean and single
sample standards for E. coli. Cattle and wildlife deposition directly in streams
dominates the E. coli contributions to the stream, particularly during the summer
Total Maximum Daily Load Development for Linville Creek: Bacteria and GeneralStandard (Benthic) Impairments
128
months when cattle spend more time in the stream, flows are lower, and there is
minimum dilution due to reduced stream flow. Loadings from upland areas are
reduced during these periods because there is little upland runoff to transport
fecal coliform to streams. When high flow conditions do occur, however, the large
magnitude of the nonpoint source loadings coming from upland areas will result
in violations of the water quality standard. Because these upland loadings are
intermittent, they are not a primary source of violations of the calendar-month
geometric mean standard, but do cause many violations of the E. coli single
sample standard.
Table 9.3. Annual nonpoint source fecal coliform loads under existingconditions and corresponding reductions for TMDL allocationscenario (Scenario 07).a
Total 57,885 100% 2,208.4 96%a For details on calculation of E. coli loads, see Section 9.1.1 and Equation 9.2b Includes loads applied to both High and Low Density Residential and Farmstead
Total Maximum Daily Load Development for Linville Creek: Bacteria and GeneralStandard (Benthic) Impairments
129
Table 9.4. Annual direct nonpoint source fecal coliform loads underexisting conditions and corresponding reductions for TMDLallocation scenario (Scenario 07).a
Total 57,885 100% 16,988 71%a Includes loads applied to both High and Low Density Residential and Farmsteadb Reduction only applies to Low Density Residential and Farmstead Areas (Not to High Density
Residential Areas because the loadings from these areas were considered negligible)
Total Maximum Daily Load Development for Linville Creek: Bacteria and GeneralStandard (Benthic) Impairments
140
Wildlife inStreams 0.7 0.63% 0.7 0%
Total 111.2 100% 1.68 98.5%
10
100
1,000
10,000
Sep-93 Jan-95 May-96 Oct-97 Feb-99 Jul-00 Nov-01
E.
coli
Dai
ly A
vera
ge
Co
nce
ntr
aio
n (
#/10
0 m
L)
235 #/100mL Standard
Figure 10.1. Phase 1 TMDL implementation scenario for Linville Creek.
10.3. Follow-up Monitoring
VADEQ will continue to monitor Linville Creek and its tributaries in
accordance with its ambient monitoring program. VADEQ and VADCR will
continue to use data from these monitoring stations for evaluating reductions in
bacteria counts and the effectiveness of the TMDLs in attainment of water quality
standards. Sampling under the rotating basin approach will be suspended until
an implementation plan has been developed and implementation measures have
begun in the watershed. Ambient sampling includes field parameters, bacteria,
nutrients and solids. Bacteria sampling will include both fecal coliform and E.
coli.
Total Maximum Daily Load Development for Linville Creek: Bacteria and GeneralStandard (Benthic) Impairments
141
10.4. Potential Funding Sources
One potential source of funding for TMDL implementation is Section 319
of the CWA. In response to the federal Clean Water Action Plan, Virginia
developed a Unified Watershed Assessment that identifies watershed priorities.
Watershed restoration activities, such as TMDL implementation, within these
priority watersheds are eligible for Section 319 funding. Increases in Section 319
funding in future years will be targeted toward TMDL implementation and
watershed restoration. Additional funding sources for implementation include the
USDA Conservation Reserve Enhancement Program (CREP), the Virginia state
revolving loan program, and the Virginia Water Quality Improvement Fund.
10.5. Current Efforts to Control Bacteria
Watershed stakeholders will have opportunities to provide input and to
participate in the development of the implementation plan, with support from
regional and local offices of VADEQ, VADCR, and other participating agencies.
Many efforts are planned or are underway that will help reduce bacteria and
sediment loads to Linville Creek. For example, implementation of these TMDLs
will contribute to ongoing water quality improvement efforts aimed at restoring
water quality in the Chesapeake Bay. Several BMPs known to be effective in
controlling bacteria and sediment have also been identified for implementation as
part of the 2001 Interim Nutrient Cap Strategy for the Shenandoah/Potomac
basin. For example, management of on-site waste management systems,
management of livestock and manure, and pet waste management are among
the components of the strategy described under nonpoint source implementation
mechanisms. New tributary strategies are currently being developed and can be
integrated with a TMDL implementation plan for Linville Creek.
10.6. Addressing Wildlife Contributions
In some streams for which TMDLs have been developed, water quality
modeling indicates that even after removal of all of the sources of fecal coliform
Total Maximum Daily Load Development for Linville Creek: Bacteria and GeneralStandard (Benthic) Impairments
142
(other than wildlife), the stream will not attain standards. As is the case for
Linville Creek, TMDL allocation reductions of this magnitude are not realistic and
do not meet EPA’s guidance for reasonable assurance. Based on the water
quality modeling results, many of these streams will not be able to attain
standards without some reduction in wildlife. Virginia and EPA are not
proposing the elimination of wildlife to allow for the attainment of water
quality standards. This is obviously an impractical action. While managing
over-populations of wildlife remains as an option to local stakeholders, the
reduction of wildlife or changing a natural background condition is not the
intended goal of a TMDL. In such a case, after demonstrating that the source of
fecal contamination is natural and uncontrollable by effluent limitations and
BMPs, the state may decide to re-designate the stream’s use for secondary
contact recreation or to adopt site-specific criteria based on natural background
levels of bacteria. The state must demonstrate that the source of fecal
contamination is natural and uncontrollable by effluent limitations and BMPs
through a so-called Use Attainability Analysis (UAA). All site-specific criteria or
designated use changes must be adopted as amendments to the water quality
standards regulations. Watershed stakeholders and EPA will be able to provide
comment during this process.
The State Water Control Board recently adopted bacteria criteria
applicable to any waters that are designated for secondary contact recreation.
As proposed, the definition for secondary contact recreation means "a water-
based form of recreation, the practice of which has a low probability for total body
immersion or ingestion of waters (examples include but are not limited to wading,
boating, and fishing).” This proposed standard will become effective pending
EPA approval.
While the proposal set up criteria for protection of secondary contact
recreation, no waters have yet been re-designated as such. The re-designation
of the current swimming use in a stream to a secondary contact recreational use
would require the completion of a Use Attainability Analysis (UAA). A UAA is a
Total Maximum Daily Load Development for Linville Creek: Bacteria and GeneralStandard (Benthic) Impairments
143
structured scientific assessment of the factors affecting the attainment of the use,
which may include physical, chemical, biological, and economic factors as
described in the Federal Regulations. The stakeholders in the watershed,
Virginia, and EPA will have an opportunity to comment on these special studies.
Based on the above, EPA and Virginia have developed a TMDL strategy
to address the wildlife issue. The first step in this strategy is to develop an
interim reduction goal such as in Table 10.1. The pollutant reductions for the
interim goal are applied only to controllable, anthropogenic sources identified in
the TMDL, setting aside any control strategies for wildlife. During the first
implementation phase, all controllable sources would be reduced to the
maximum extent practicable using the staged approach outlined above.
Following completion of the first phase, VADEQ would re-assess water quality in
the stream to determine if the water quality standard is attained. This effort will
also evaluate if the modeling assumptions were correct. If water quality
standards are not being met, a UAA may be initiated to reflect the presence of
naturally high bacteria levels due to uncontrollable sources. In some cases, the
effort may never have to go to the second phase because the water quality
standard violations attributed to wildlife in the model are very small and
infrequent and may fall within the margin of error.
Re-designation of the swimming use for secondary contact would only be
considered after TMDL implementation measures to achieve compliance with the
primary contact standard have been implemented without success and one or
more of the following conditions exist:
1. naturally occurring pollutant concentrations prevent the attainment
of the use;
2. natural, ephemeral, intermittent, or low flow conditions or water
levels prevent the attainment of the use unless these conditions
may be compensated for by the discharge of sufficient volume of
Total Maximum Daily Load Development for Linville Creek: Bacteria and GeneralStandard (Benthic) Impairments
144
effluent discharge without violating state water conservation
requirements to enable the uses to be met;
3. human caused conditions or sources of pollution prevent the
attainment of the use and cannot be remedied or would cause more
environmental damage to correct than to leave in place;
4. dams, diversions, or other types of hydrologic modifications
preclude the attainment of the use, and it is not feasible to restore
the waterbody to its original condition or to operate such
modification in a way that would result in the attainment of the use;
5. physical conditions related to the natural features of the waterbody,
such as the lack of a proper substrate, cover, flow, depth, pools,
riffles, and the like, unrelated to water quality, preclude attainment
of aquatic life protection uses; or
6. controls more stringent than those required by Sections 301(b) and
306 of the Clean Water Act would result in substantial and
widespread economic and social impact.
Total Maximum Daily Load Development for Linville Creek: Bacteria and GeneralStandard (Benthic) Impairments
145
CHAPTER 11: PUBLIC PARTICIPATION
Public participation was elicited at every stage of the TMDL development
in order to receive inputs from stakeholders and to apprise the stakeholders of
the progress made. In May of 2002, members of the Virginia Tech TMDL group
traveled to Rockingham County to become acquainted with the watershed.
During that trip, they spoke with various stakeholders. In addition, personnel
from Virginia Tech, the Headwaters Soil and Water Conservation District
(SWCD), and the Natural Resource Conservation Service (NRCS) visited some
watershed residents and contacted others via telephone to acquire their input.
The first public meeting was public noticed on September 9, 2002 and
held on September 26, 2001, at the Linville-Edom Elementary School in Linville,
Virginia to inform the stakeholders of TMDL development process and to obtain
feedback on animal numbers in the watershed, fecal production estimates, and to
discuss the hydrologic calibration. Copies of the presentation materials and
diagrams outlining the development of the TMDL were available for public
distribution at the meeting. Approximately 25 people attended the meeting. The
public comment period ended on October 25, 2002.
The final public meeting was public noticed on February 24, 2003 and held
on March 5, 2003 at the Broadway High School in Broadway, Virginia to present
the draft TMDL report and solicit comments from stakeholders. Approximately 40
people attended the final meeting. Copies of the presentation materials were
distributed to the public at the meeting. The public comment period ended on
April 2, 2003. A summary of the questions and answers discussed at the
meeting was prepared and is located at the VADEQ Valley Regional Office in
Harrisonburg, VA.
Total Maximum Daily Load Development for Linville Creek: Bacteria and GeneralStandard (Benthic) Impairments
146
CHAPTER 12: REFERENCESASAE Standards, 45th edition. 1998. D384.1 DEC93. Manure production and characteristics. St. Joseph,
Mich.: ASAE.Bicknell, B.R., Imhoff, J.C., Kittle, J.L., Jr., Donigian, A.S., Jr. and Johanson, R.C. 1997. Hydrological
Simulation Program -- FORTRAN, User's manual for version 11: U.S. Environmental ProtectionAgency, EPA/600/R-97/080, National Exposure Research Laboratory, Athens, Ga., 755 p.
Census Bureau. 2000. Washington, D.C.: U.S. CensusBureau.(http://www.census.gov)Crane, S.R. and J.A. Moore. 1986. Modeling enteric bacterial die-off: a review. Water, Air, and Soil
Pollution. 27(3/4):411-439.Crane, S.R., P.W. Westerman, and M.R. Overcash. 1980. Die-off of fecal indicator organisms following
land-application of poultry manure. J. Environ. Qual. 9:531-537.Dai, Ting, Richard L. Wetzel, Tyler R. L. Christensen, and E. Amy Lewis. 2000. BasinSim 1.0, A
Windows-Based Watershed Modeling Package. User’s Guide. Special Report in Applied MarineScience and Ocean Engineering #362. Virginia Institute of Marine Science, College of William &Mary. Gloucester Point, Virginia.
Duda, P., J. Kittle, Jr., M. Gray, P. Hummel, R. Dusenbury. 2001. WinHSPF, Version 2.0, An InteractiveWindows Interface to HSPF, User Manual. Contract No. 68-C-98-010. USEPA. Washington D.C.pp. 95.
Evans, Barry M., Scott A. Sheeder, Kenneth J. Corradini, and Will S. Brown. 2001. AVGWLF version3.2. Users Guide. Environmental Resources Research Institute, Pennsylvania State Universityand Pennsylvania Departmetn of Environmental Protection, Bureau of Watershed Conservation.
Geldreich, E.E. 1978. Bacterial populations and indicator concepts in feces, sewage, stormwater and solidwastes. In Indicators of Viruses in Water and Food, ed. G. Berg, ch. 4, 51-97. Ann Arbor, Mich.:Ann Arbor Science Publishers, Inc.
Giddens, J., A.M. Rao, and H.W. Fordham. 1973. Microbial changes and possible groundwater pollutionfrom poultry manure and beef cattle feedlots in Georgia. OWRR Project no. A-031-GA. Athens,Ga.: Univ. of Georgia.
Hagedorn, C., S.L. Robinson, J.R. Filtz, S.M. Grubbs, T.A. Angier, R.B. Reneau. 1999. Determiningsources of fecal pollution in a rural Virginia watershed with antibiotic resistance patterns in fecalstreptococci. Applied Environmental Microbiology. 65(12): 5522-5531.
Haith, Douglas A., Ross Mandel, and Ray Shyan Wu. 1992. GWLF. Generalized Watershed LoadingFunctions, version 2.0. User’s Manual. Department of Agricultural and Biological Engineering,Cornell University. Ithaca, New York.
Hession, W. C., M. McBride, and L. Misiura. 1997. Revised Virginia nonpoint source pollutionassessment methodology. A report submitted to the Virginia Department of Conservation andRecreation, Richmond, Virginia. The Academy of Natural Sciences of Philadelphia, PatrickCenter for Environmental Research. Philadelphia, Pennsylvania.
Maptech Inc. 2000. Fecal Coliform TMDL (Total Maximum Daily Load) Development for South Fork ofthe Blackwater River, Virginia. Submitted to USEPA Washington, D.C.
Metcalf and Eddy. 1979. Wastewater Engineering: Treatment, Disposal, and Reuse (II ed.). New York:McGraw-Hill.
Mostaghimi, S., T. Dillaha, C. Heatwole, M. L. Wolfe, D. Cherry, R. Currie, K. Brannan, S. Shah, M Al-Smadi, J. Miller and G. Yagow. 2000. Fecal Coliform TMDL for Pleasant Run, RockinghamCounty, Virginia. Submitted to USEPA Washington, D.C.
Rockingham Co. Planning Dept. Current as of 1999. 1999 E-911 data. Harrisonburg, Va.: RockinghamCo. Planning Dept.
SAIC (Science Applications International Corporation). 2001. Fecal Coliform TMDL (Total MaximumDaily Load) Development for Holmans Creek, Virginia. Prepared for VADEQ and VADCR.
SCS (Soil Conservation Service). 1982. Soil Survey of Rockingham County, Virginia. Richmond: USDA-SCS.
SCS. 1986. Urban hydrology for small watersheds. Technical Release 55 (TR-55). U. S. Department ofAgriculture, Soil Conservation Service, Engineering Division. Washington, D.C.
Total Maximum Daily Load Development for Linville Creek: Bacteria and GeneralStandard (Benthic) Impairments
147
SERCC (Southeast Regional Climate Center). 2002. South Carolina Department of Natural Resources,2221 Devine Street, Suite 222, Columbia, SC 29205.(http://cirrus.dnr.state.sc.us/cgi-bin/sercc/cliMAIN.pl?va2208)
Sloto, Ronald A. and Michele Y. Crouse. 1996. HYSEP: A computer program for streamflow hydrographseparation and analysis. U. S. Geological Survey Water-Resources Investigations Report 96-4040.Lemoyne, Pennsylvania.
SWCB (Soil and Water Conservation Board). 2002. http://www.deq.state.va.us/wqs/WQS02.pdfTetra Tech, Inc. Draft – March 2002. Total maximum daily load (TMDL) development for Blacks Run
and Cooks Creek. Prepared for Virginia Department of Environmental Quality and Department ofConservation and Recreation, Richmond, Virginia.(www.deq.state.va.us/tmdl/apptmdls/shenrvr/cooksbd2.pdf).
USEPA. 1985. Rates, constants, and kinetics formulations in surface water quality modeling (II ed.).Athens, GA: USEPA
USEPA. 1991. Guidance for Water Quality-based Decisions: The TMDL Process. EPA 440/4-91-001.Washington, D.C.: Office of Water, USEPA.
USEPA. 1998a. Water Quality Planning and Management Regulations (40 CFR Part 130) (Section 303(d)Report). Washington, D.C.: Office of Water, USEPA.
USEPA. 1998b. National Water Quality Inventory: Report to Congress (40 CFR Part 130) (Section 305(b)Report). Washington, D.C.: Office of Water, USEPA.
VADCR. 1993. Nutrient Management Handbook. Richmond, Va.: VADCR.VADEQ. 1997. Total Maximum Daily Load Study on Six Watersheds in the Shenandoah River Basin.
Richmond, Va.: VADEQ.VADEQ. 1998. Virginia Water Quality Assessment Report. 305(b) Report to EPA and Congress.
(http://www.deq.state.va.us/water/303d.html )VWCB. 1985. Ground Water Map of Virginia, ed. P.J. Smith and R.P. Ellison. Richmond, Va.: Virginia
Water Control Board (VWCB) Ground Water Program.Weiskel, P.A., B.L. Howes, and G.R. Heufelder. 1996. Coliform contamination of a coastal embayment:
sources and transport pathways. Environ. Sci. Technol. 30: 1872-1881.Wischmeier, W. H. and D. D. Smith. 1978. Predicting rainfall erosion losses – A guide to conservation
planning. Agriculture Handbook 537. U.S. Department of Agriculture, Science and EducationAdministration. Beltsville, Maryland.
Woods, A.J., J.M. Omernik, D.D. Brown. 1999. Level III and IV Ecoregions of Delaware, Maryland,Pennsylvania, Virginia, and West Virginia. Corvallis, Or.: USEPA.(ftp://ftp.epa.gov/wed/ecoregions/reg3/FinalFullRgnIIIText3).
Yagow, G. 2001. Fecal Coliform TMDL: Mountain Run Watershed, Culpeper County, Virginia.Available at: http://www.deq.state.va.us/tmdl/apptmdls/rapprvr/mtrnfec.pdf
Yagow, Gene, Saied Mostaghimi, and Theo Dillaha. 2002. GWLF model calibration for statewide NPSassessment. Virginia NPS pollutant load assessment methodology for 2002 and 2004 stattewideNPS pollutant assessments. January 1 – March 31, 2002 Quarterly Report. Submitted to VirginiaDepartment of Conservation and Recreation, Division of Soil and Water Conservation.Richmond, Virginia.
Total Maximum Daily Load Development for Linville Creek: Bacteria and GeneralStandard (Benthic) Impairments
148
APPENDIX A
Glossary of Terms
Total Maximum Daily Load Development for Linville Creek: Bacteria and GeneralStandard (Benthic) Impairments
149
Glossary of Terms
AllocationThat portion of a receiving water’s loading capacity that is attributed to one of its existingor future pollution sources (nonpoint or point) or to natural background sources.
Allocation ScenarioA proposed series of point and nonpoint source allocations (loadings from differentsources), which are being considered to meet a water quality planning goal.
Background levelsLevels representing the chemical, physical, and biological conditions that would resultfrom natural geomorphological processes such as weathering and dissolution.
BASINS (Better Assessment Science Integrating Point and Nonpoint Sources)A computer-run tool that contains an assessment and planning component that allowsusers to organize and display geographic information for selected watersheds. It alsocontains a modeling component to examine impacts of pollutant loadings from point andnonpoint sources and to characterize the overall condition of specific watersheds.
Best Management Practices (BMP)Methods, measures, or practices that are determined to be reasonable and cost-effective means for a land owner to meet certain, generally nonpoint source, pollutioncontrol needs. BMPs include structural and nonstructural controls and operation andmaintenance procedures.
Bacteria Source TrackingA collection of scientific methods used to track sources of fecal coliform.
CalibrationThe process of adjusting model parameters within physically defensible ranges until theresulting predictions give a best possible good fit to observed data.
Die-off (of fecal coliform)Reduction in the fecal coliform population due to predation by other bacteria as well asby adverse environmental conditions (e.g., UV radiation, pH).
Direct nonpoint sourcesSources of pollution that are defined statutorily (by law) as nonpoint sources that arerepresented in the model as point source loadings due to limitations of the model.Examples include: direct deposits of fecal material to streams from livestock and wildlife.
Total Maximum Daily Load Development for Linville Creek: Bacteria and GeneralStandard (Benthic) Impairments
150
E-911 digital dataEmergency response database prepared by the county that contains graphical data onroad centerlines and buildings. The database contains approximate outlines ofbuildings, including dwellings and poultry houses.
Failing septic systemSeptic systems in which drain fields have failed such that effluent (wastewater) that issupposed to percolate into the soil, now rises to the surface and ponds on the surfacewhere it can flow over the soil surface to streams or contribute pollutants to the surfacewhere they can be lost during storm runoff events.
Fecal coliformA type of bacteria found in the feces of various warm-blooded animals that is used asindicator of the possible presence of pathogenic (disease causing) organisms.
Geometric meanThe geometric mean is simply the nth root of the product of n values. Using thegeometric mean, lessens the significance of a few extreme values (extremely high or lowvalues). In practical terms, this means that if you have just a few bad samples, theirweight is lessened.Mathematically the geometric mean, gx , is expressed as:
nn
g xxxxx ⋅⋅⋅= K321
where n is the number of samples, and xi is the value of sample i.
HSPF (Hydrological Simulation Program-Fortran)A computer-based model that calculates runoff, sediment yield, and fate and transport ofvarious pollutants to the stream. The model was developed under the direction of theU.S. Environmental Protection Agency (EPA).
HydrologyThe study of the distribution, properties, and effects of water on the earth’s surface, inthe soil and underlying rocks, and in the atmosphere.
Instantaneous criterionThe instantaneous criterion or instantaneous water quality standard is the value of thewater quality standard that should not be exceeded at any time. For example, theVirginia instantaneous water quality standard for fecal coliform is 1,000 cfu/100 mL. Ifthis value is exceeded at any time, the water body is in violation of the state water qualitystandard.
Total Maximum Daily Load Development for Linville Creek: Bacteria and GeneralStandard (Benthic) Impairments
151
Load allocation (LA)The portion of a receiving water’s loading capacity that is attributed either to one of itsexisting or future nonpoint sources of pollution or to natural background.
Margin of Safety (MOS)A required component of the TMDL that accounts for the uncertainty about therelationship between the pollutant loads and the quality of the receiving waterbody. TheMOS is normally incorporated into the conservative assumptions used to developTMDLs (generally within the calculations or models). The MOS may also be assignedexplicitly, as was done in this study, to ensure that the water quality standard is notviolated.
ModelMathematical representation of hydrologic and water quality processes. Effects of Landuse, slope, soil characteristics, and management practices are included.
Nonpoint sourcePollution that is not released through pipes but rather originates from multiple sourcesover a relatively large area. Nonpoint sources can be divided into source activitiesrelated to either land or water use including failing septic tanks, improper animal-keepingpractices, forest practices, and urban and rural runoff.
PathogenDisease-causing agent, especially microorganisms such as bacteria, protozoa, andviruses.
Point sourcePollutant loads discharged at a specific location from pipes, outfalls, and conveyancechannels from either municipal wastewater treatment plants or industrial waste treatmentfacilities. Point sources can also include pollutant loads contributed by tributaries to themain receiving water stream or river.
PollutionGenerally, the presence of matter or energy whose nature, location, or quantity producesundesired environmental effects. Under the Clean Water Act for example, the term isdefined as the man-made or man-induced alteration of the physical, biological, chemical,and radiological integrity of water.
ReachSegment of a stream or river.
Runoff
Total Maximum Daily Load Development for Linville Creek: Bacteria and GeneralStandard (Benthic) Impairments
152
That part of rainfall or snowmelt that runs off the land into streams or other surfacewater. It can carry pollutants from the air and land into receiving waters.
Septic systemAn on-site system designed to treat and dispose of domestic sewage. A typical septicsystem consists of a tank that receives liquid and solid wastes from a residence orbusiness and a drainfield or subsurface absorption system consisting of a series of tile orpercolation lines for disposal of the liquid effluent. Solids (sludge) that remain afterdecomposition by bacteria in the tank must be pumped out periodically.
SimulationThe use of mathematical models to approximate the observed behavior of a naturalwater system in response to a specific known set of input and forcing conditions.Models that have been validated, or verified, are then used to predict the response of anatural water system to changes in the input or forcing conditions.
Straight pipeDelivers wastewater directly from a building, e.g., house, milking parlor, to a stream,pond, lake, or river.
Total Maximum Daily Load (TMDL)The sum of the individual wasteload allocations (WLA’s) for point sources, loadallocations (LA’s) for nonpoint sources and natural background, plus a margin of safety(MOS). TMDLs can be expressed in terms of mass per time, toxicity, or otherappropriate measures that relate to a state’s water quality standard.
Urban RunoffSurface runoff originating from an urban drainage area including streets, parking lots,and rooftops.
Validation (of a model)Process of determining how well the mathematical model’s computer representationdescribes the actual behavior of the physical process under investigation.
Wasteload allocation (WLA)The portion of a receiving water’s loading capacity that is allocated to one of its existingor future point sources of pollution. WLAs constitute a type of water quality-basedeffluent limitation.
Water quality standard
Total Maximum Daily Load Development for Linville Creek: Bacteria and GeneralStandard (Benthic) Impairments
153
Law or regulation that consists of the beneficial designated use or uses of a water body,the numeric and narrative water quality criteria that are necessary to protect the use oruses of that particular water body, and an anti-degradation statement.
Total Maximum Daily Load Development for Linville Creek: Bacteria and GeneralStandard (Benthic) Impairments
154
WatershedA drainage area or basin in which all land and water areas drain or flow toward a centralcollector such as a stream, river, or lake at a lower elevation.
For more definitions, see the Virginia Cooperative Extension publications availableonline:
Glossary of Water-Related Terms. Publication 442-758.http://www.ext.vt.edu/pubs/bse/442-758/442-758.html
and
TMDLs (Total Maximum Daily Loads) - Terms and Definitions. Publication 442-550.http://www.ext.vt.edu/pubs/bse/442-550/442-550.html
Total Maximum Daily Load Development for Linville Creek: Bacteria and GeneralStandard (Benthic) Impairments
155
APPENDIX B
Sample Calculation of Dairy Cattle(Sub Watershed B46-02)
Total Maximum Daily Load Development for Linville Creek: Bacteria and GeneralStandard (Benthic) Impairments
156
Sample Calculation: Distribution of Dairy Cattle(Sub watershed (B46-02) during January)
(Note: Due to rounding, the numbers may not add up.)
Breakdown of the dairy herd is 208 milk cows, 17 dry cows, and 206 heifers.
1. During January, milk cows are confined 75% of the time (Table 4.6). Dry cows andheifers are confined 40% of the time.
Milk cows in confinement = 208 * (75%) = 156Dry cows in confinement = 17 * (40%) = 6.8Heifers in confinement = 206 * (40%) = 82.4
2. When not confined, dairy cows are on the pasture or in the stream.Milk cows on pasture and in the stream = (208 – 156) = 52Dry cows on pasture and in the stream = (17 - 6.8) = 10.2Heifers on pasture and in the stream = (206-82.4) = 123.6
3. Fifteen percent of the pasture acreage has stream access (Table 4.7) (recall dairycows are assumed to graze only on Pasture 1). Hence dairy cattle with stream accessare calculated as:
Milk cows on pastures with stream access = 52 * (15%) = 7.8Dry cows on pastures with stream access = 10.2 * (15%) = 1.5Heifers on pastures with stream access = 123.6 * (15%) = 18.5
4. Dairy cattle in and around the stream are calculated using the numbers in Step 3 andthe number of hours cattle spend in the stream in January (Table 4.6) as:
Milk cows in and around streams= 7.8 * (0.5/24) = 0.16Dry cows in and around streams = 1.5 * (0.5/24) = 0.03Heifers in and around streams = 18.5 * (0.5/24) = 0.39
5. Number of cattle defecating in the stream is calculated by multiplying the number ofcattle in and around the stream by 30% (Section 4.2.1).
Milk cows defecating in streams = 0.16 * (30%) = 0.05Dry cows defecating in streams = 0.03 * (30%) = 0.01Heifers defecating in streams = 0.39 * (30%) = 0.12
6. After calculating the number of cattle defecating in the stream, the number of cattledefecating on the pasture is calculated by subtracting the number of cattle defecating inthe stream (Step 5) from number of cattle in pasture and stream (Step 2).
Milk cows defecating on pasture = (52 – 0.05) = 51.95Dry cows defecating on pasture = (10.2 – 0.01) = 10.19Heifers defecating on pasture = (123.6 – 0.12) = 123.48
Total Maximum Daily Load Development for Linville Creek: Bacteria and GeneralStandard (Benthic) Impairments
157
APPENDIX C
Die-off Fecal Coliform During Storage
Total Maximum Daily Load Development for Linville Creek: Bacteria and GeneralStandard (Benthic) Impairments
158
Die-off of Fecal Coliform During Storage
The following procedure was used to calculate amount of fecal coliform
produced in confinement in dairy manure applied to cropland and pasture. All
calculations were performed on spreadsheet for each sub watershed with dairy
operations in a watershed.
1. It was determined from the producer survey that 15% of the dairy farms had
dairy manure storage for less than 30 days; 10% of the dairy farms had
storage capacities of 60 days, while the remaining operations had 180-day
storage capacity. Using a decay rate of 0.375 (Section 5.5.2) for liquid dairy
manure, the die-off of fecal coliform in different storage capacities at the ends
of the respective storage periods were calculated using Eq. [5.1]. Based on
the fractions of different storage capacities, a weighted average die-off was
calculated for all dairy manure.
2. Based on fecal coliform die-off, the surviving fraction of fecal coliform at the
end of storage period was estimated to be 0.0078 in dairy manure.
3. The annual production of fecal coliform based on ‘as-excreted’ values (Table
4.1) was calculated for dairy manure.
4. The annual fecal coliform production from dairy manure was multiplied by the
fraction of surviving fecal coliform to obtain the amount of fecal coliform that
was available for land application on annual basis. For monthly application,
the annual figure was multiplied by the fraction of dairy applied during that
month based on the application schedule given in Table 4.10.
Total Maximum Daily Load Development for Linville Creek: Bacteria and GeneralStandard (Benthic) Impairments
159
APPENDIX D
Weather Data Preparation
Total Maximum Daily Load Development for Linville Creek: Bacteria and GeneralStandard (Benthic) Impairments
160
Weather Data Preparation
A weather data file for providing the weather data inputs into the HSPF
Model was created for the period September 1984 through December 2001 using
the WDMUtil. Raw data required for creating the weather data file included
hourly precipitation (in.), average daily temperatures (maximum, minimum, and
dew point) (°F), average daily wind speed (mi./h), total daily solar radiation
(langleys), and percent sun. The primary data source was the National Climatic
Data Center’s (NCDC) Cooperative Weather Station at Dale Enterprise,
Rockingham Co., Virginia; data from three other NCDC stations were also used.
Locations and data periods fro the stations used are listed in Table D-1. Daily
solar radiation data was generated using WDMUtil. The raw data required
varying amounts of preprocessing prior to input into WDMUtil or within WDMUtil
to obtain the following hourly values: precipitation (PREC), air temperature
(ATEM), dew point temperature (DEWP), solar radiation (SOLR), wind speed
(WIND), potential evapotranspiration (PEVT), potential evaporation (EVAP), and
cloud cover (CLOU). The final WDM file contained the above hourly values as
well as the raw data. Weather data in the variable length format were obtained
from the NCDC’s weather stations in Dale Enterprise, VA (Lat./Long.
38.5N/78.9W, elevation 1400 ft); Timberville, VA (Lat./Long. 38.7N/78.7W,
elevation 1001 ft); Lynchburg Airport, VA (Lat./Long. 37.3N/79.2W, elevation 940
ft); and Elkins Airport, WV (Lat./Long. 38.9N/79.9W, elevation 1948 ft). While
deciding on the period of record for the weather WDM file, availability of flow and
water quality data was considered in addition to the availability and quality of
weather data. Given these considerations, the weather WDM file was prepared
for the period of September 1984 through December 2001.
Total Maximum Daily Load Development for Linville Creek: Bacteria and GeneralStandard (Benthic) Impairments
161
Table D.1. Meteorological data sources.
Type ofData
Location Source RecordingFrequency
Period ofRecord
LatitudeLongitude
Rainfall (in) DaleEnterprise NCDC 1 Hour1
Day
1/1/73 –12/31/998/1/48
– 12/31/01
38°10’52”79°05’25”
Rainfall (in) Timberville,VA
LocalResident 1 Day 1/1/84 –
12/31/0138°10’52”79°05’25”
Min AirTemp (°F)
StauntonSewage
TreatmentPlant
NCDC 1 Day 8/1/48 –12/31/01
38°10’52”79°05’25”
Max AirTemp (°F)
StauntonSewage
TreatmentPlant
NCDC 1 Day 8/1/48 –12/31/01
38°10’52”79°05’25”
Min AirTemp (°F)
DaleEnterprise NCDC 1 Day 8/1/48 –
12/31/0138°27’19”78°56’07”
Max AirTemp (°F)
DaleEnterprise NCDC 1 Day 8/1/48 –
12/31/0138°27’19”78°56’07”
CloudCover (%)
LynchburgRegionalAirport
NCDC 1 Hour 8/1/48 –12/31/01
37°20’15”79°12’24”
Dew PointTemp (°F)
LynchburgRegionalAirport
NCDC 1 Hour 1/1/48 –12/31/01
37°20’15”79°12’24”
WindSpeed
(360° andknots)
Elkins-RandolphElkins WV
NCDC 1 Hour 1/1/64 –12/31/01
38°53’07”79°51’10”
Total Maximum Daily Load Development for Linville Creek: Bacteria and GeneralStandard (Benthic) Impairments
162
APPENDIX E
Fecal Coliform Loading in Sub-Watersheds
Total Maximum Daily Load Development for Linville Creek: Bacteria and GeneralStandard (Benthic) Impairments
163
Table E.1. Monthly nonpoint fecal coliform loadings in sub-watershed B46-01.