Total Maximum Daily Load (TMDL) Development - pH (H + Ion Mass) - For Brier Creek Watershed (Muhlenberg County, Kentucky) Kentucky Department for Environmental Protection Division of Water Frankfort, Kentucky May 2001
Transcript
Total Maximum Daily Load (TMDL) Development
- pH (H+ Ion Mass) -
For
Brier Creek Watershed
(Muhlenberg County, Kentucky)
Kentucky Department for Environmental Protection
Division of Water
Frankfort, Kentucky
May 2001
Brier Creek Watershed pH TMDL Development
1
Total Maximum Daily Load (TMDL) Development- pH (H+ Ion Mass) -
ForBrier Creek Watershed
(Muhlenberg County, Kentucky)
Kentucky Department for Environmental ProtectionDivision of Water
Frankfort, Kentucky
List of Contributors
Dr. Lindell Ormsbee, Supervisor
Heather Willis, Data Analysis and Report Preparation
Nick Uhren, Data Analysis, Report Preparation, GIS Mapping
The Natural Resources and Evironmental Protection Cabinet does not discriminate on thebasis of race, color, natural origin, sex, age, religion, or disability and provides onrequest, reasonable accommodations including auxiliary aids and services necessary toafford an individual with a disability an equal opportunity to participate in all services,programs, and activities.
Printed on Recycled Paper
Brier Creek Watershed pH TMDL Development
2
Table of Contents
Page
List of Contributors ............................................................................................................. 1
Table of Contents................................................................................................................ 2
List of Figures and Tables................................................................................................... 3
TMDL Fact Sheet...............................................................Error! Bookmark not defined.
Literature Cited ................................................................................................................. 31
Brier Creek Watershed pH TMDL Development
3
List of Figures and Tables
Figures Page
Schematic of Brier Creek Watershed.................................................................................. 6
Figure 1: Location of Brier Creek Watershed..................................................................... 7
Figure 2: Pond River Watershed, 8-digit HUC 05110006.................................................. 8
Figure 3. Mining Operations and Historic Sampling Sites in Brier Creek Watershed .... 10
Figure 4. Sampling Sites monitored by Murray State Personnel...................................... 14
Figure 5: Distribution Function of TDS Concentration for Terrestrial Waters................. 17
Figure 6: Activity Coefficients of H+ as a Function of Ionic Strength (Snoeyink, 1980) 18
Figure 7. Relationship between discharge and maximum ion loading for a pH of 6....... 20
Figure 8-13. Flow vs. Ion Loading and pH for Sites 1-6................................................. 21
Figure 14. Relationship between return interval and normalized flow............................ 27
Figure 15. Relationship between basin area and 2-year flow.......................................... 28
Tables Page
Summary of Total Maximum Daily Load........................................................................... 6
Table 1. Historic Monitoring Data ................................................................................... 10
Table 2. Murray State Sample Results............................................................................ 15
Table 3. Return interval flow rates (cfs) for stations in regional analysis ........................ 26
Table 4. 3-Year Incremental Flow and Corresponding TMDL ........................................ 27
Table 5. 3-Year Incremental, Predicted Ion Loads (lbs/day) ............................................ 28
Table 6. TMDL Summary and Allocations for Brier Creek ............................................ 29
Brier Creek Watershed pH TMDL Development
4
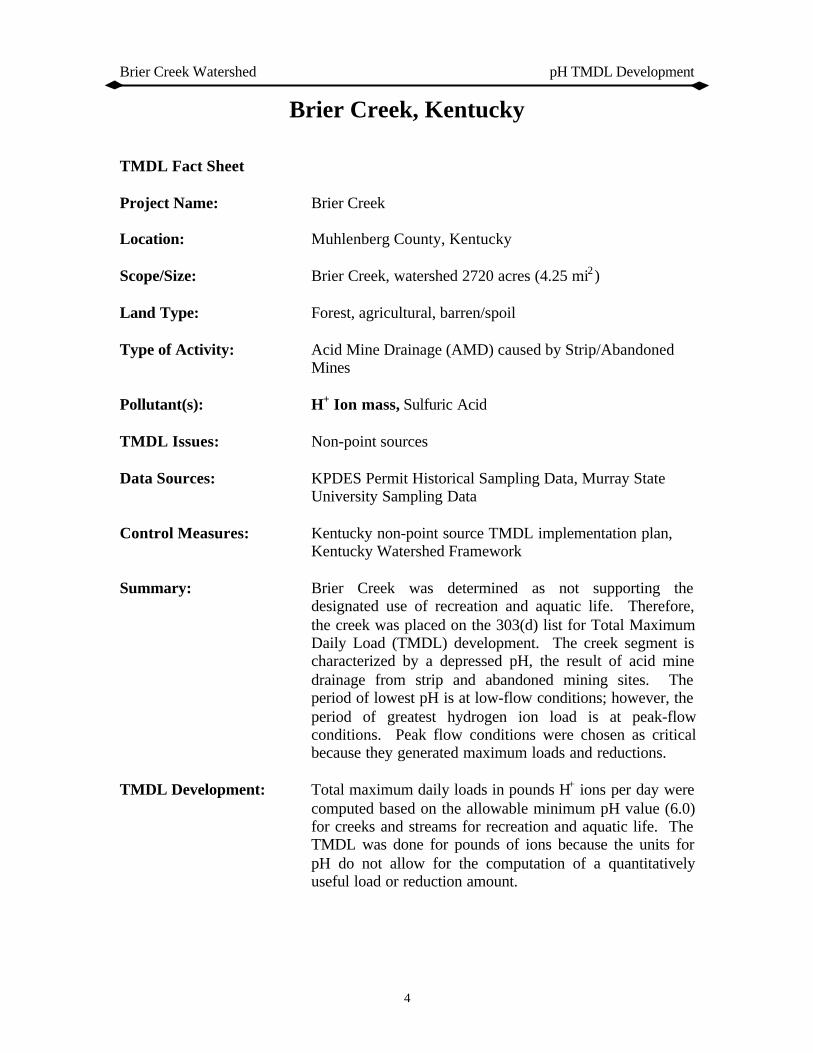
Brier Creek, Kentucky
TMDL Fact Sheet
Project Name: Brier Creek
Location: Muhlenberg County, Kentucky
Scope/Size: Brier Creek, watershed 2720 acres (4.25 mi2)
Land Type: Forest, agricultural, barren/spoil
Type of Activity: Acid Mine Drainage (AMD) caused by Strip/AbandonedMines
Pollutant(s): H+ Ion mass, Sulfuric Acid
TMDL Issues: Non-point sources
Data Sources: KPDES Permit Historical Sampling Data, Murray StateUniversity Sampling Data
Control Measures: Kentucky non-point source TMDL implementation plan,Kentucky Watershed Framework
Summary: Brier Creek was determined as not supporting thedesignated use of recreation and aquatic life. Therefore,the creek was placed on the 303(d) list for Total MaximumDaily Load (TMDL) development. The creek segment ischaracterized by a depressed pH, the result of acid minedrainage from strip and abandoned mining sites. Theperiod of lowest pH is at low-flow conditions; however, theperiod of greatest hydrogen ion load is at peak-flowconditions. Peak flow conditions were chosen as criticalbecause they generated maximum loads and reductions.
TMDL Development: Total maximum daily loads in pounds H+ ions per day werecomputed based on the allowable minimum pH value (6.0)for creeks and streams for recreation and aquatic life. TheTMDL was done for pounds of ions because the units forpH do not allow for the computation of a quantitativelyuseful load or reduction amount.
Brier Creek Watershed pH TMDL Development
5
Implementation/Remediation
In response to the documented problems in the Brier Creek Watershed, the KentuckyDivision of Abandoned Lands developed a remediation project designed to mitigate thepH impairment. Some of the remediation activities are considered experimental. Theremediation project included reclamation of approximately 120 acres of barren or poorlyvegetated areas affected by past strip mining. The restoration included construction ofditches and PVC coated gabion baskets utilized as velocity reducers and energydissipators; bale silt checks and silt trap dug-outs were also utilized for sediment control.The reclamation project consisted of 67 acres of gradework to remove erosion gullies,redistribute sediment deposits, and prepare a surface to receive a soil cover. The areaunder consideration received a two foot soil cover layer, taken from 20 acres ofwatershed area designated for borrow. Gradework areas were treated with an applicationof agricultural limestone to neutralize acidic conditions and all areas were revegetatedusing a combination of seedbed preparation, agricultural limestone, fertilizer, seed,mulch, and crimping.
The reclamation activities focused on only a portion of the area within the watershed thatexhibited significant water quality degradation. The total cost of the Brier Creek projectwas $913,000 (i.e. $7,600/acre). For 2000, the total federal allocation for KentuckyAML was approximately $17 million. However, the bulk of these funds were used tosupport priority 1 (extreme danger of adverse effects to public health, safety, welfare, andproperty) and priority 2 (adverse effects to public health, safety, and welfare) projects.
The strategy employed in Brier Creek is similar in some respects to a remediation projectthat is underway on Rock Creek and a tributary, White Oak Creek in McCreary CountyKentucky. This 12-acre project is a Clean Water Action Plan project and involves theremoval of coal refuse from the banks of Rock Creek, the establishment of vegetativecover on the refuse areas in the watershed, and the application of limestone sand atselected locations to neutralize the effects of AMD. Limestone sand has also been usedto neutralize acid mine drainage in West Virginia.
Brier Creek Watershed pH TMDL Development
6
Total TMDL for Brier Creek = 0.424 lbs H+ Ions/day
Section 303(d) of the Clean Water Act and EPA’s Water Quality Planning andManagement Regulations (40 CFR Part 130) require states to develop total maximumdaily loads (TMDLs) for their water bodies that are not meeting designated uses undertechnology-based controls for pollution. The TMDL process establishes the allowableloadings of pollutants or other quantifiable parameters for a water body based on therelationship between pollution sources and in-stream water quality conditions. Thismethod exists so that states can establish water-quality based controls to reduce pollutionfrom both point and nonpoint sources and restore and maintain the quality for their waterresources (USEPA, 1991). This report provides the TMDL for Brier Creek.
Location
The Brier Creek watershed is entirely contained within Muhlenberg County, insouthwestern Kentucky (Figure 1). Muhlenberg County is bounded on the northeast bythe Green River, on the east by the Indian Camp Creek, and on the west by the PondRiver.
Figure 1: Location of Brier Creek Watershed
Brier Creek Watershed pH TMDL Development
8
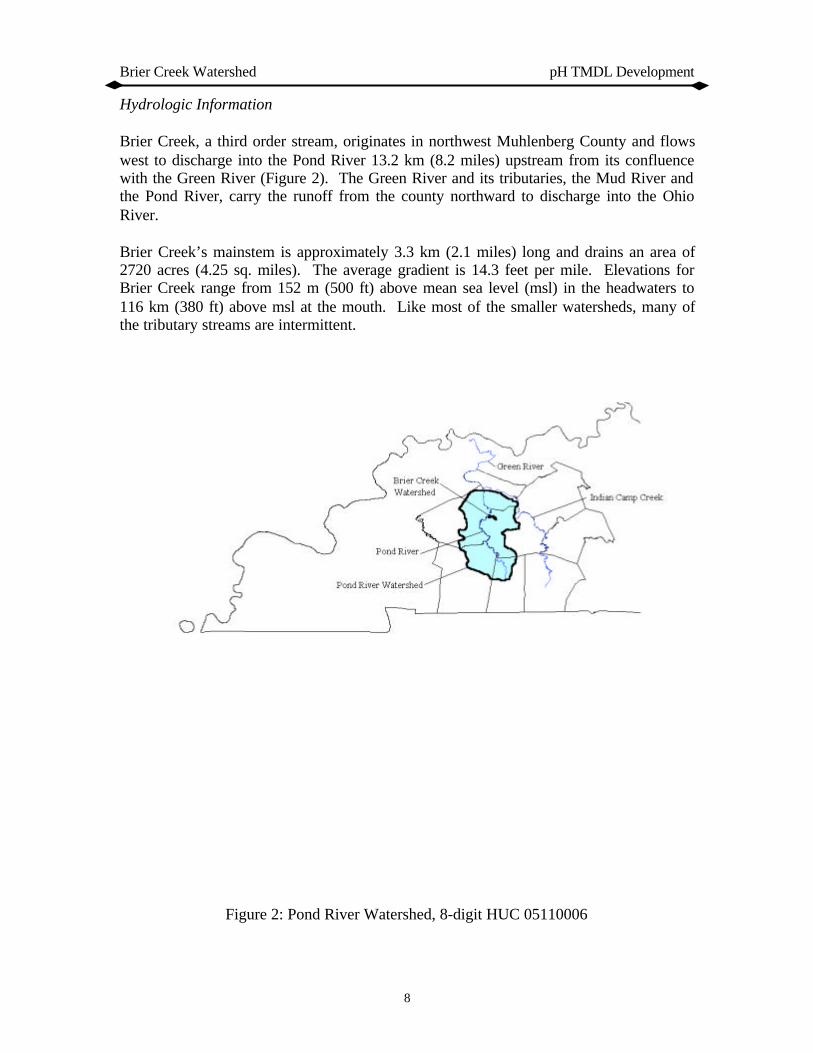
Hydrologic Information
Brier Creek, a third order stream, originates in northwest Muhlenberg County and flowswest to discharge into the Pond River 13.2 km (8.2 miles) upstream from its confluencewith the Green River (Figure 2). The Green River and its tributaries, the Mud River andthe Pond River, carry the runoff from the county northward to discharge into the OhioRiver.
Brier Creek’s mainstem is approximately 3.3 km (2.1 miles) long and drains an area of2720 acres (4.25 sq. miles). The average gradient is 14.3 feet per mile. Elevations forBrier Creek range from 152 m (500 ft) above mean sea level (msl) in the headwaters to116 km (380 ft) above msl at the mouth. Like most of the smaller watersheds, many ofthe tributary streams are intermittent.
Figure 2: Pond River Watershed, 8-digit HUC 05110006
Brier Creek Watershed pH TMDL Development
9
Geologic Information
The Brier Creek watershed is in the Western Coal field physiographic region. Thesurface bedrock is of Pennsylvanian age. Formations of the Pennsylvanian age aremostly sandstone, siltstone, coal, and interbedded limestone and shale; alluvial depositsof siltstone and crossbedded sand or sandstone underlie the extensive lowland areas(USDA, 1980). The relief of the Brier Creek watershed ranges from nearly level to steep.Gently sloping to steep soils are found in the uplands and nearly level soils are found onthe floodplain.
Landuse Information
Coal, oil, and natural gas are among the natural resources of Muhlenberg County. Coal isthe county’s most important revenue-producing natural resource and at one timeMuhlenberg County was the largest coal-producing county in the United States. In 1973,the county strip mined over 19 million tons of coal and mined over 5 million tons fromthe underground. The Brier Creek watershed contains three main landuses: resourceextraction (mining and disturbed land area), forest, and agriculture.
Soils Information
The Brier Creek watershed is dominated by nearly level loamy and clayey soils near tothe mouth and level to steep loamy soils in the headwaters. Nearly 30 percent of thewatershed is Udorthents soil, which consists of strip mine spoil.
Watershed History
In 1945, the Island Creek Coal Company began seam mining in the Brier Creekwatershed. By 1977 the company had ceased all mining activity, making them exemptfrom reclamation efforts and characterizing the watershed under the jurisdiction of theAbandoned Lands division of the federal government. In 1978 the Kentucky Division ofWater's Earlington Field Office conducted studies on several acid mine drainage affectedstreams in the western coal fields and reported a pH of 3.5 at two sites on Brier Creek(DOW, 1981). In August of 1988 a fish kill was reported downstream of the disturbedarea and verified as caused by high iron concentrations and low pH, symptoms of acidmine drainage and pH impairment. In response to this incident and other complaintswithin the watershed, the Kentucky Division of Abandoned Mines investigated the siteand developed a comprehensive remediation for the watershed that was finally approvedand funded in 1996. In 1997 the Kentucky Natural Resources and EnvironmentalProtection Cabinet (KNREPC) conducted a year long stream water sampling program todocument the pH impairment within Brier Creek watershed and provide a baseline forassessment of the remediation project (see Table 1). Finally, in 1998 Kentucky issued itslatest 303(d) list for impaired watersheds, including Brier Creek as a first-level priorityunder pH impairment. Areas of the watershed disturbed by past mining operations areshown in Figure 3.
Brier Creek Watershed pH TMDL Development
10
Table 1. Historic Monitoring Data
Figure 3. Mining Operations and Historic Sampling Sites in Brier Creek Watershed
Site 1 Site 2 Site 3 Site 4 Site 5
DateFlow Rate
(gpm) pHFlow Rate
(gpm) pHFlow Rate
(gpm) pHFlow Rate
(gpm) pHFlow Rate
(gpm) pH4/15/97 No flow No flow No flow No flow No flow No flow No flow No flow No flow4/22/97 191 3.2 6.48 2.7 No flow No flow No flow No flow No flow No flow
5/6/97 234 2.8 2.2 2.4 1047 3.5 No flow No flow No flow No flow5/20/97 220 2.7 6.15 2.4 1764 3.8 68 2.8 1148 6.1
7/22/97 45 2.9 No flow No flow No flow No flow 45 2.9 10 5.28/5/97 13.2 2.9 No flow No flow No flow No flow No flow No flow No flow No flow
8/19/97 16 2.9 9.7 2.6 82 2.8 6.25 2.8 No flow No flow9/2/97 13.2 3 3.3 2.6 33.6 3 3.5 2.9 No flow No flow
9/16/97 22.3 2.9 No flow No flow 218 2.8 7.47 2.7 No flow No flow10/7/97 11.77 2.9 No flow No flow 44 2.8 9.5 2.8 No flow No flow
10/22/97 26 3 No flow No flow No flow No flow No flow No flow No flow No flow11/4/97 33.58 3.2 No flow No flow 64 3 9.6 3.1 No flow No flow
11/18/97 258 3.1 No flow No flow No flow No flow No flow No flow No flow No flow12/2/97 39.75 3.1 No flow No flow 223 3.3 No flow No flow No flow No flow
Brier Creek Watershed pH TMDL Development
11
Problem Definition
The 1998 303(d) list of waters for Kentucky (Ky. Dept. for Environmental ProtectionDivision of Water, 1998) indicates 4.7 miles of Brier Creek, from the headwaters to theconfluence with the Pond River in Muhlenberg County, does not meet its designated usefor both contact recreation (swimming) and aquatic life. The Brier Creek watershedprovides a classic example of impairment caused by acid mine drainage (AMD).Bituminous coal mine drainage, like that found in the Brier Creek watershed, containsvery concentrated sulfuric acid and high concentrations of metals, especially iron,manganese, and aluminum.
Acid mine drainage can (1) ruin domestic and industrial water supplies, (2) decimateaquatic life, and (3) cause waters to be unsuitable for swimming (primary contactrecreation). In addition to these problems, a depressed pH interferes with the naturalstream self-purification processes. At low pH levels, the iron associated with AMD issoluble. However, in downstream reaches where the pH begins to improve, most of theferric sulfate [Fe2(SO4)3] is hydrolyzed to essentially insoluble iron hydroxide [Fe(OH)3].The stream bottom can become covered with a sterile orange or yellow-brown ironhydroxide deposit that is deleterious to benthic algae, invertebrates, and fish.
The sulfuric acid in AMD is formed by the oxidation of sulfur contained in the coaland/or the rock or clay found above and below the coal seams. Most of the sulfur in theunexposed coal is found in a pyritic form as iron pyrite and marcasite (both having thechemical composition FeS2).
In the process of mining, the iron sulfide (FeS2) is uncovered and exposed to theoxidizing action of oxygen in the air (O2), water, and sulfur-oxidizing bacteria. The endproducts of the reaction are as follows:
The subsequent oxidation of ferrous iron and acid solution to ferric iron is generally slow.The reaction may be represented as:
4 Fe2SO4 + O2 + 2 H2SO4 → 2 Fe2(SO4)3 + 2 H2O (2)
As the ferric acid solution is further diluted and neutralized in a receiving stream and thepH rises, the ferric iron (Fe3+ or Fe2(SO4)3) hydrolyses and ferric hydroxide (Fe(OH)3 )may precipitate according to the reaction:
Fe2(SO4)3 + 6 H2O → 2 Fe(OH)3 + 3 H2SO4 (3)
The brownish yellow ferric hydroxide (Fe(OH)3) may remain suspended in the streameven when it is no longer acidic. Although the brownish, yellow staining of thestreambanks and water doesn't cause the low pH, it does indicate that there has been
Brier Creek Watershed pH TMDL Development
12
production of sulfuric acid. The overall stoichiometric relationship is shown in equation(4):
Reaction (4) indicates that a net of 4 moles of H+ are liberated for each mole of pyrite(FeS2) oxidized, making this one of the most acidic weathering reactions known.
Target Identification
The endpoint or goal of the TMDL is to achieve a pH concentration (and associated loadin lbs/day) that allows for the sustainability of aquatic life and swimming uses in thesestream reaches. The chronic pH criterion to protect Warm Water Aquatic Habitat Use inKentucky requires that the pH be maintained between 6 and 9 (Title 401, KentuckyAdministrative Regulations, Chapter 5:031). For a watershed impacted by AMD, thefocus will be on meeting the lower criteria. In the case of violations caused by non-pointsources on small intermittent streams, such standards must be evaluated on the basis of anappropriate critical exceedance frequency as opposed to a critical period or flow (e.g.7Q10). For pH violations on such stream, the Kentucky Division of Water hasdetermined that a one day average 3-year exceedance frequency be used for setting theappropriate TMDL and associated loading reduction.
The Technical Support Document for Water Quality-Based Toxic Control (USEPA,1991) states that daily receiving water concentrations (loads) can be ranked from thelowest to the highest without regard to time sequence. In the absence of continuousmonitoring, such values can be obtained through continuous simulation or monte-carloanalysis. A probability plot can be constructed from these ranked values, and theoccurrence frequency of any 1-day concentration of interest can now be determined.Where the resultant frequency exceeds that of the stated target value (e.g. 3 years)associated load reductions will be required until the resultant concentration satisfies thestated target value and its associated exceedance frequency. As in the case of this study,where the load and the resultant target indicator (i.e. pH) can be directly related throughdischarge (flow rate), the exceedance frequency of the associated discharge can bedirectly related to the exceedance frequency of the target value (e.g. pH).
Source Assessment
Point Source Loads
There are no permitted point sources loads contributing to the existing pH violations inthe watershed.
Non-Point Source Loads
In August of 1988 a fish kill was reported downstream of the disturbed area and verifiedas caused by high iron concentrations and low pH, symptoms of acid mine drainage and
Brier Creek Watershed pH TMDL Development
13
pH impairment. In response to this incident and other complaints within the watershed,the Kentucky Division of Abandoned Mines investigated the site and determined that thecause of the major source of the problem was due to runoff from mine spoils associatedwith previous deep mine activities. In 1997 the Kentucky Natural ResourcesEnvironmental Protection Cabinet (KNREPC) conducted a year long stream watersampling program to document the pH impairment within Brier Creek watershed. Thelocation of the monitoring sites is shown in Figure 3. A summary of the historic pHreadings at these sites is shown in Table 1.
In order to provide a more recent characterization of the pH levels in the watershed, theUniversity of Kentucky (as part of the study contract with the DOW) subcontracted withMurray State University to collect additional data from the watershed at the sitesindicated in Figure 4. A summary of the results obtained from these sites is shown inTable 2. Both data sets (Tables 1 and 2) indicate significant pH degradation in thewatershed and serve as a basis for the establishment of a TMDL.
Brier Creek Watershed pH TMDL Development
14
Figure 4. Sampling Sites monitored by Murray State Personnel
Brier Creek Watershed pH TMDL Development
15
Table 2. Murray State Sample Results
Site 1 Site 2 Site 3
DateFlow Rate
(cfs) pHFlow Rate
(cfs) pHFlow Rate
(cfs) pH10/7/98 17.0 6.6 0.5 7.4 25.0 5.6
10/16/98 0.5 5.4 No flow No flow 1.0 2.910/25/98 0.5 4.3 No flow No flow 3.0 1.011/8/98 0.5 6.0 No flow No flow 3.0 3.2
11/13/98 0.7 5.1 No flow No flow 3.0 3.211/24/98 0.7 4.7 No flow No flow 13.0 2.912/13/98 18.0 5.7 0.6 6.0 30.0 4.112/18/98 0.8 5.1 No flow No flow 3.0 3.312/26/98 5.5 5.3 0.5 5.8 5.0 4.61/17/99 0.8 6.3 0.8 6.2 5.0 4.11/24/99 12.5 6.3 0.7 6.7 46.0 5.71/31/99 22.0 6.0 120.0 6.4 80.0 6.0
The magnitude of the associated hydrogen ion load in a water column (in terms ofactivity) can be determined by measuring the pH of the water. The relationship betweenhydrogen load and pH can be expressed as follows:
{H3O+} = 10-pH or more commonly { H+ } = 10-pH (5)
where pH is the negative log of the H+ ion activity in mol/L. To convert between themeasured activity {H+} and the actual molar concentration [H+], the activity is divided byan activity coefficient, γ.
[H+] = {H+}/γ (6)
The activity coefficient γ is dependent on the ionic strength µ of the source water underconsideration. The ionic strength of a given source water can be approximated byestimating the TDS (total dissolved solids in mg/liter or ppm) and applying the followingrelationship (Snoeyink, 1980):
µ = (2.5 * 10-5) * TDS (8)
In the absence of actual measured values of TDS, a conservative estimate of TDS forAcid Mine Drainage can be obtained using the cumulative probability distribution oftypical terrestrial waters (Figure 5) with an associated conservative probability ofexceedence of 95% (Snoeyink, 1980).
Brier Creek Watershed pH TMDL Development
17
Figure 5: Distribution Function of TDS Concentration for Terrestrial Waters
(Snoeyink, 1980)
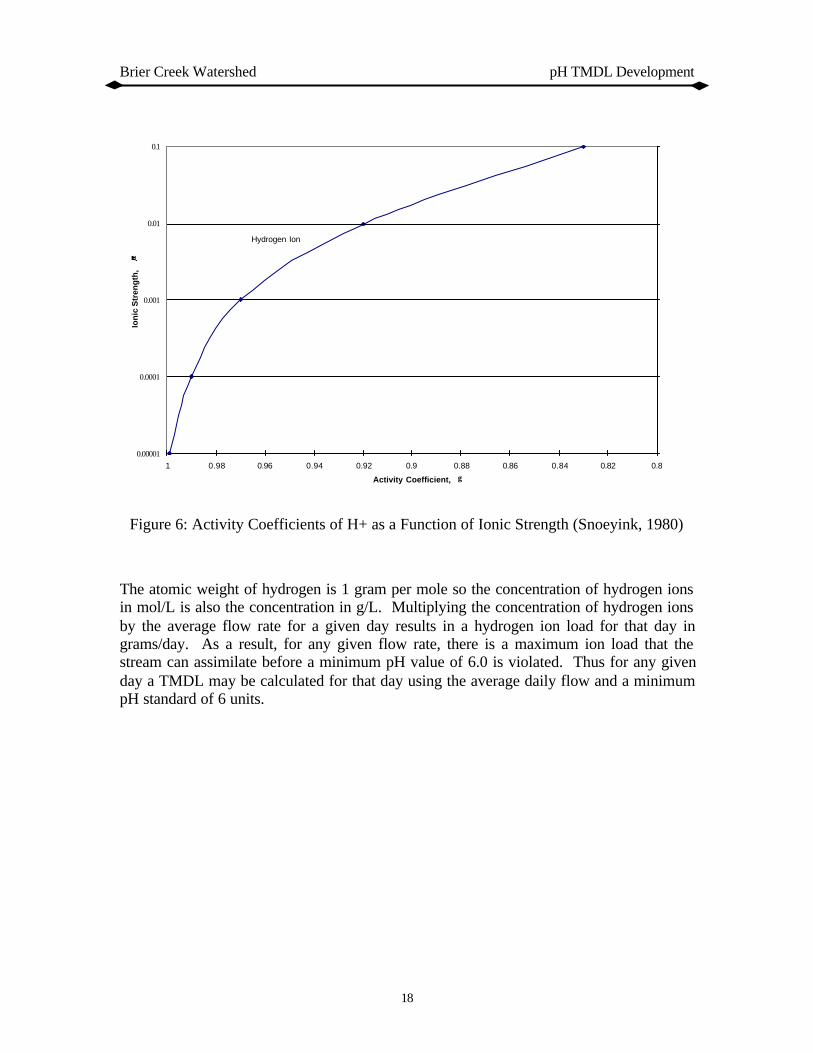
Use of Figure 5 along with an exceedence probability of 95% yields a TDS value ofapproximately 900 ppm. Substitution of a TDS concentration of 900 ppm into equation 8yields an ionic strength of 0.0225. Ionic strength can be converted to an associatedactivity coefficient using the functional relationship shown in Figure 6 (Snoeyink, 1980).Use of an ionic strength of 0.0225 yields an activity coefficient of 0.89.
Hydrogen Ion
0 . 0 0 0 0 1
0 . 0 0 0 1
0 . 0 0 1
0 .01
0.1
0.820.840.860 . 8 80.90.920.940 .960.981
Activity Coeff icient,
Ion
ic S
tren
gth
,µ
γ
Brier Creek Watershed pH TMDL Development
18
Figure 6: Activity Coefficients of H+ as a Function of Ionic Strength (Snoeyink, 1980)
The atomic weight of hydrogen is 1 gram per mole so the concentration of hydrogen ionsin mol/L is also the concentration in g/L. Multiplying the concentration of hydrogen ionsby the average flow rate for a given day results in a hydrogen ion load for that day ingrams/day. As a result, for any given flow rate, there is a maximum ion load that thestream can assimilate before a minimum pH value of 6.0 is violated. Thus for any givenday a TMDL may be calculated for that day using the average daily flow and a minimumpH standard of 6 units.
Hydrogen Ion
0.00001
0.0001
0.001
0.01
0.1
0.80.820.840.860.880.90.920.940.960.981
Activity Coefficient,
Ion
ic S
tren
gth
,
γ
Brier Creek Watershed pH TMDL Development
19
Hydrogen Loading Example Calculation
In order to demonstrate the hydrogen loading conversion procedure, use the followingmonitoring data:
The pH can be converted to a mole/liter measurement (i.e. moles [H+]/liter) by applyingthe following relationship:
pH = -log {H+}
The resulting moles of hydrogen is the anti-log of -6.0, which is 0.000001 moles/liter.The units need to be converted into grams/cubic ft. This is accomplished by applying thefollowing conversion factors:
• There is one gram per mole of Hydrogen.• 1 liter = 0.035314667 cubic feet
The goal is to achieve a loading rate in terms of g/day, or lbs/day. If the amount ofhydrogen in grams/cubic foot is multiplied by the given flow rate in cubic feet/secondand a conversion factor of 86,400 s/day, then the load is computed as:
(0.0000283168 g/ft3)*(70.0 ft3/s)*(86400s/1day) = 171.26 g/day, or 0.38 lbs/day
Assuming an activity correction factor of 0.89, the final load is 192.43 g/day, or 0.424lbs/day:
171.26 g/day / 0.89 = 192.43 g/day, or 0.424 lbs/day
This load is based on a pH of 6.0. The pH determination is based on a logarithmic scalesuch that as the pH decreases by one unit the number of moles per liter of hydrogenincreases by 10. This obviously has a significant effect on the load and subsequent loadreduction needed to attain a pH of 6.0. Using a Q = 70.0 cfs, the load reduction needed toattain a pH of 6.0 if the observed pH is 5.0 is 3.82 lbs/day. For an observed pH of 4.0 thereduction needed is 42.0 lbs/day.
Brier Creek Watershed pH TMDL Development
20
Because pH and equivalent hydrogen ion load can be related as a function of discharge(flow) and ionic strength, a functional relationship can be developed between dischargeand the associated ion loading for a given pH value. By specifying a minimum pH value(e.g. 6) and a minimum activity correction factor (e.g. 0.89), an envelope of maximumion loads may be obtained as a function of discharge (see Figure 6). This figure thusprovides a basis for establishing the maximum ion load for a given discharge.
Figure 7. Relationship between discharge and maximum ion loading for a pH of 6
Once a TMDL is developed for a watershed, the associated load reduction must bespatially allocated. One way to accomplish this objective is through unit load reductionsas associated with different land uses within the watershed. The impacts of suchreductions on the associated water quality standard can then be verified throughmathematical simulation. Alternatively, separate TMDLs (and associated loadreductions) can be developed for individual subbasins within the watershed. In thecurrent study, separate TMDLs and associated load reductions will be developed for eachof the subbasins identified in Figure 4. Attainment of the individual load reductionsshould then meet the TMDL requirement for the complete watershed.
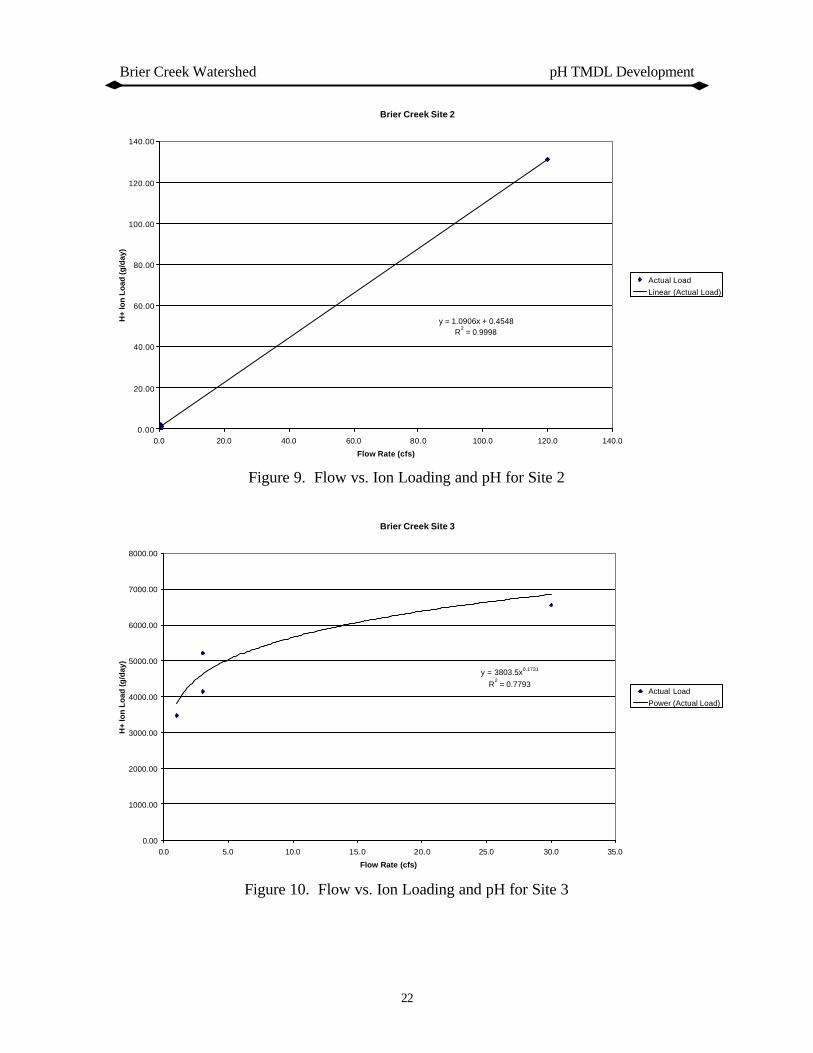
Based on a physical inspection of the watershed, it is hypothesized that the degradation ofthe pH in the stream is directly related to oxidation of sulfur that occurs as runoff flowsover the spoil areas associated with previous mining activities in the basin. Using themost recent monitoring data, inductive models were developed at each monitoring sitethat relate total hydrogen ion loading to streamflow. These models are shown in Figures8-13. It is recognized that the use of multiple sampling points within the basin provides a
Discharge vs. Maximum Ion Loading
Max. Load = 2.749 * Q
0
500
1000
1500
2000
2500
3000
0 200 400 600 800 1000 1200
Discharge (cfs)
Max
imum
Ion
Load
ing
(g/d
ay)
Brier Creek Watershed pH TMDL Development
21
better way to isolate those sections of the basin that are contributing the major loads tothe stream. However, with a limited sampling budget, the use of multiple points comes atthe expense of more accurate models at any one location. This impact is furthercomplicated by the elimination of outliers for the various data sets. Such impacts arereflected to varying degrees in each of the functions. For example, the loading functionfor site 2 is largely defined by one single point. However, due to the limited observedloading associated with this basin, this function has minimal impact on the overallTMDL. Loading functions for sites 3 and 5 are also heavily influenced by singleobservations, however, in each case the observed point is consistent with the rest of thedata and the general functional trend demonstrated in the other functions.
As can be seen from the figures, the total load increases as a function of flow, illustratingthe significant relationship between the pH degradation and non-point sources. Thedeveloped relationships may be used to predict total ion loading to a stream on the basisof streamflow.
The Total Maximum Daily Load (TMDL) is a term used to describe the maximumamount of a pollutant a stream can assimilate without violating water quality standardsand includes a margin of safety. The units of a load measurement are mass of pollutantper unit time (i.e. mg/hr, lbs/day). In the case of pH there is no associated mass unit (pHis measured in Standard Units).
Total maximum daily loads (TMDLs) are comprised of the sum of individual wasteloadallocations (WLAs) for point sources, and load allocations (LAs) for both nonpointsources and natural background levels for a given watershed. The sum of thesecomponents may not result in exceedance of water quality standards (WQSs) for thatwatershed. In addition, the TMDL must include a margin of safety (MOS), eitherimplicitly or explicitly, that accounts for the uncertainty in the relation between pollutantloads and the quality of the receiving water body. Conceptually, this definition isdenoted by the equation:
TMDL = Sum (WLAs) + Sum (LAs) + MOS (9)
Wasteload Allocations
There are no permitted point sources in this watershed. As a result, the wasteloadallocations for the Brier Creek Watershed are assumed to be zero.
Load Allocations
Load allocations for the Brier Creek Watershed are assumed to be directly related to acidmine drainage as a result of water leaching from abandoned mines. The total loadallocation for Brier Creek is assumed to be an explicit function of the average daily flowin the stream and an associated pH standard of 6 units. Predicted daily loads for eachsubbasin within the watershed can be obtained using the inductive loading models shownin Figures 8-13.
Margin of Safety
The margin of safety (MOS) is part of the TMDL development process (Section303(d)(1)(C) of the Clean Water Act). There are two basic methods for incorporating theMOS (USEPA, 1991a):
1) Implicitly incorporate the MOS using conservative model assumptions todevelop allocations, or
2) Explicitly specify a portion of the total TMDL as the MOS using theremainder for allocations.
Brier Creek Watershed pH TMDL Development
26
In the current TMDL, the MOS is incorporated implicitly through the properties of waterchemistry that determine the relationship between pH and hydrogen ion concentration. Inan electrically neutral solution (such as all natural systems), the activity coefficient (γ ineqn. 6) is assumed to be equal to 1.0, meaning that there is no quantitative differencebetween activity and molar concentration. In the case of AMD there obviously exists thepossibility of additional ions in the water column that may affect the relationship betweenthe measured activity and the associated ion load. Therefore, taking a conservativeapproach, a minimum activity correction factor of 0.89 is assumed. This means that at allvalues of pH the calculated hydrogen ion concentration is assumed to be higher thanwould normally be calculated under the assumption of a nominal activity correctionfactor. Overestimation of the potential loading rate requires a greater reduction and thusallows for an implicitly defined margin of safety. In addition, all pH degradation belowthe minimum threshold of 6 is assumed to be totally attributable to acid mine drainage.As a result, any load reductions for the watershed will be made irrespective of any naturalbackground sources and thus provide a further conservative reduction strategy.
TMDL Determination
Because maximum hydrogen ion loading values can be directly related to discharge viaFigure 8, the associated allowable ion loading exceedence frequency (i.e. 3 years) can bedirectly related to the frequency of the discharge. In order to find the 3-year averagedaily discharge for Sugar Creek watershed a regional frequency analysis was used.Regional analysis can be used to develop an inductive model using data that has beencollected at streamflow gaging stations that are located in the same hydrologic region asthe watershed of interest. For this study, the following USGS gaging stations wereselected: 03320500, 03384000, 03383000, and 03321350. The data from these gages isused to predict probabilistic discharges based on a 2-year, 5-year, and a 10-year returninterval using a Log-Normal probability distribution (see Table 3). These dischargeswere then normalized by dividing each flow by the 2-year streamflow to produce Figure9 and regressed with watershed area to produce Figures 14 and 15. Using these twofigures, the daily mean discharge for a given frequency and watershed area can be readilydetermined.
Table 3. Return Interval Flow Rates (cfs) for Stations in Regional Analysis
Application of Figures 14 and 15 for the Brier Creek watershed yields a three-year peakaverage daily discharge of 70 cfs assuming a watershed area of 3.07 mi2. Three-yearaverage daily discharges for each individual subbasin can now be obtained using a simplymass balance technique. For a mass balance to be obtained, the flow at the outlet must
equal the summation of the incremental flows at each subbasin. Therefore, the calculatedoutlet flow is distributed throughout the watershed based on subbasin area. This processgives the larger subbasins a larger incremental flow; likewise, it gives the smallersubbasins a lesser flow. These incremental flows can be used in conjunction with Figure6 to obtain incremental TMDL's. The following table shows a summary of the results.
Table 4. 3-Year Incremental Flow and Corresponding TMDL
Figure 14. Relationship between return interval and normalized flow
Figure 15. Relationship between basin area and 2-year flow
Predicted Load
The predicted 3-year frequency hydrogen ion loads for each site may be obtained usingthe 3-year frequency discharges from Table 3 along with the associated load relationshipsshown in Figures 8-13. Application of this approach yields the predicted 3-yearfrequency loads for each site as shown in Table 5.
Table 5. 3-Year Incremental, Predicted Ion Loads (lbs/day)
Note that for an independent tributary the incremental load is equal to the cumulativeload for that tributary. On the other hand, a subbasin that has flows entering fromadjacent subbasins requires a mass balance application to find the incremental load. Forexample, the incremental load at subbasin 5 is found by subtracting the cumulative loadat subbasins 3 and 4 from the cumulative load at subbasin 5. A similar approach is usedto calculate all of the remaining incremental loads.
Load Reduction Allocation
Translation of the TMDL in Table 4 (obtained for a 3-year exceedance frequency) intoassociated daily load reductions for each site may be accomplished by subtracting theincremental TMDL from the incremental predicted load for each of the subbasins. Thisapproach allocatse the total load reduction for Brier Creek (site 6) between each of thecontributing sites in the watershed, so that the entire watershed is rehabilitatesd and thepH is improved throughout the stream network. Application of this approach yields thevalues in Table 6.
Table 6. TMDL Summary and Allocations for Brier Creek
Total TMDL for Brier Creek = 0.424 lbs H+ Ions/day
In response to the documented problems in the Brier Creek Watershed, the KentuckyDivision of Abandoned Lands developed a remediation project designed to mitigate thepH impairment. Some of the remediation activities are considered experimental. Theremediation project included reclamation of approximately 120 acres of barren or poorlyvegetated areas affected by past strip mining. The restoration included construction ofditches and PVC coated gabion baskets utilized as velocity reducers and energydissipators; bale silt checks and silt trap dug-outs were also utilized for sediment control.The reclamation project consisted of 67 acres of gradework to remove erosion gullies,redistribute sediment deposits, and prepare a surface to receive a soil cover. The areaunder consideration received a two foot soil cover layer, taken from 20 acres ofwatershed area designated for borrow. Gradework areas were treated with an applicationof agricultural limestone to neutralize acidic conditions and all areas were revegetatedusing a combination of seedbed preparation, agricultural limestone, fertilizer, seed,mulch, and crimping.
The reclamation activities focused on only a portion of the area within the watershed thatexhibited significant water quality degradation. The total cost of the Brier Creek projectwas $913,000 (i.e. $7,600/acre). For 2000, the total federal allocation for KentuckyAML was approximately $17 million. However, the bulk of these funds were used tosupport priority 1 (extreme danger of adverse effects to public health, safety, welfare, andproperty) and priority 2 (adverse effects to public health, safety, and welfare) projects.
The strategy employed in Brier Creek is similar in some respects to a remediation projectthat is underway on Rock Creek and a tributary, White Oak Creek in McCreary CountyKentucky. This 12-acre project is a Clean Water Action Plan project and involves theremoval of coal refuse from the banks of Rock Creek, the establishment of vegetativecover on the refuse areas in the watershed, and the application of limestone sand atselected locations to neutralize the effects of AMD. Limestone sand has also been usedto neutralize acid mine drainage in West Virginia.
Brier Creek Watershed pH TMDL Development
31
LITERATURE CITED
EPA, Clean Water Act, Section 303(d), 40 CFR Part 130, 1991.
EPA, Compendium of Tools for Watershed Assessment and TMDL Development, EPA841-B-97-006, May 1997.
EPA, Report of the Federal Advisory Committee on the Total Maximum Daily Load(TMDL) Program, EPA 100-R-98-006, The National Advisory Council forEnvironmental Policy and Technology (NACEPT), July 1998.
EPA, Technical Support Document for Water Quality-based Toxics Control, EPA 505/2-90-001, March 1991.
Sawyer, Clair N., Perry L. McCarty and Gene F. Parkin, Chemistry for EnvironmentalEngineering, McGraw-Hill, Inc., New York, NY, 4th Ed., 1994, pp. 107-112.
USGS, Technique for Estimating Magnitude and Frequency of Floods in Kentucky, 1985.
Brier Creek Watershed pH TMDL Development
32
INDEX OF TMDL SUBMITTAL DOCUMENTATION
303(d) LIST INFORMATION
State Kentucky
Name of 303(d) listed waterbody Brier Creek (Muhlenberg County)
Segment as identified from 303(d) list River Mile 0.0 to 4.7
City/County Muhlenberg County
Watershed(s)/8-digit cataloging unit code 05110006
3-digit EPA reach file number 135
Length (mi) or area (acres) of impairment 4.7 miles
Water quality standards being violated pH<6.0
Water use classification Recreation and Aquatic Life
Pollutant of concern pH from acid mine drainage
Location description of waterbody Located in Western Kentucky
Sources of impairment Acid mine drainage (AMD) caused by
strip/abandoned mines
PUBLIC NOTIFICATION INFORMATION
Form of public notification
Beginning/ending dates of public notice March 6, 2000 / April 6, 2000
Notice mentioned TMDL proposal X yes _____no
Comments received from public None Received
Responsiveness summary prepared Not Applicable
Brier Creek Watershed pH TMDL Development
33
INDEX OF TMDL SUBMITTAL DOCUMENTATION (cont.)
TMDL INFORMATION
Critical Conditions ___high flow low flow
X other: max load at high, min pH at low
Seasonality X Annual_Summer/Winter_Monthly
TMDL development tool(s) ___Water quality model(s)
X Mass balance equations
X Other: Intensive synoptic survey
Supporting Models/Documents Technical Support Document for Water
Quality-based Toxics Control, Compendium
of Tools for Watershed Assessment and
TMDL Development
TOTAL MAXIMUM DAILY LOADS
Loadings Wasteload Allocation There are no point sources in this watershed
Load Allocation Distibuted among six subbasins according tothe above chart
Margin of Safety Explicit None X Implicit Adjustment factor for ion activity (γ=0.5)
(conservative assumptions used)
Total TMDL for Brier Creek = 0.424 lbs H+ Ions/day