10
Total Rewards Survey: Initial Findings Summer 2017

Total Rewards Survey: Initial FindingsSummer 2017
Total Rewards Survey: Initial Findings
2
Deloitte Consulting LLP and Empsight International LLC conducted a survey of Total Rewards programs and practices in the fall of 2016. Nearly 200 organizations responded to the survey, sharing views around Total Rewards philosophies, as well as compensation and benefits program designs, costs and practices. This summary focuses on the key findings from the Total Rewards philosophies section of the survey. In the coming weeks we will share additional results on the compensation and benefits areas of the survey. Here’s what we learned:
The workforce landscape has been disrupted. As a result, organizations need to rethink traditional approaches to their Total Rewards program.
Demographic upheaval is changing the workforce in dramatic ways, and while Millennials make up more than half the workforce, Gen Z is right on their heels, and Baby Boomers are now working well into their 70s and 80s. This demographic shift creates pressure on the historical social contract between employer and employee with a greater focus on rapid career growth, the need for a compelling and flexible workplace, and greater importance on creating a sense of purpose at work. These trends are happening while digital technology has emerged everywhere to challenge existing business models, change the workplace, and reshape how work is done.
On top of it all, the pace of change is increasing. In the end, employers now face a more dynamic and complex environment in which they compete for talent. In this new environment, traditional compensation and benefit strategies, programs, and associated service delivery models will need to evolve rapidly. To compete effectively, organizations will need to adopt a more holistic and integrated view of total rewards — one that embraces and leverages the current and pending disruption. This transformation is necessary to allow employers to develop a more agile approach to rewards strategy, programs, delivery, and communication to meet the needs of tomorrow’s workforce. Few organizations are there right now, but many recognize the need for change.
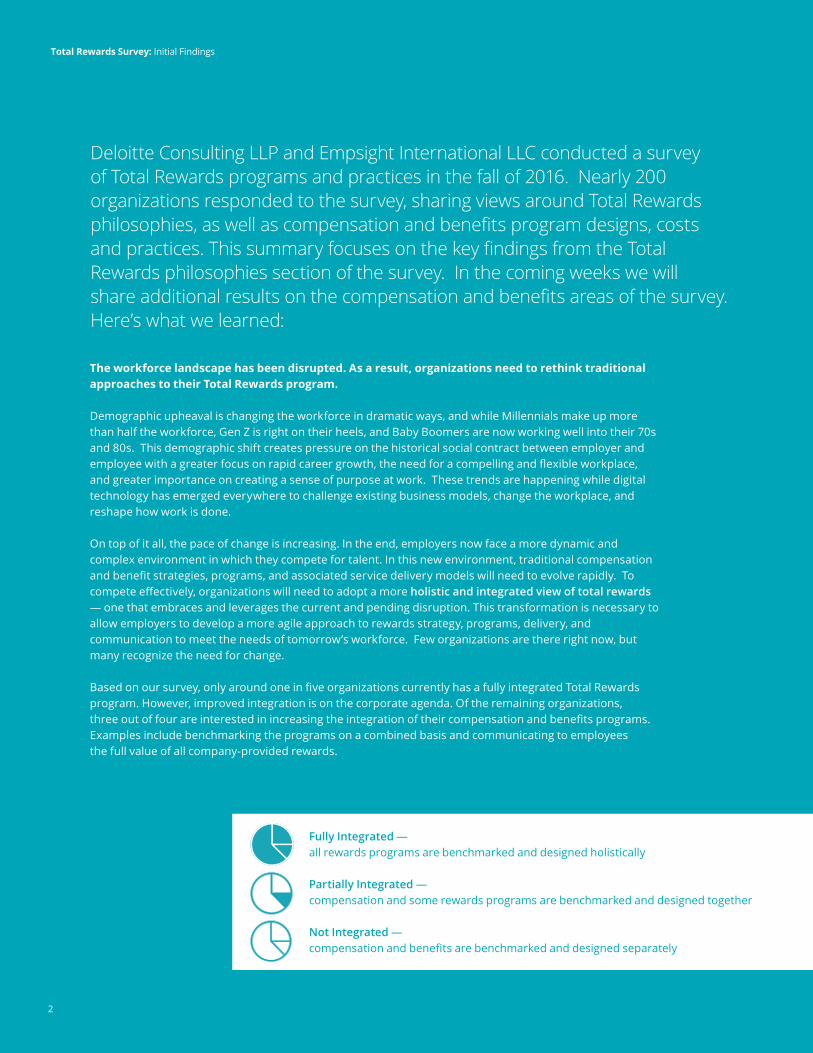
Based on our survey, only around one in five organizations currently has a fully integrated Total Rewards program. However, improved integration is on the corporate agenda. Of the remaining organizations, three out of four are interested in increasing the integration of their compensation and benefits programs. Examples include benchmarking the programs on a combined basis and communicating to employees the full value of all company-provided rewards.
Fully Integrated — all rewards programs are benchmarked and designed holistically
Partially Integrated — compensation and some rewards programs are benchmarked and designed together
Not Integrated — compensation and benefits are benchmarked and designed separately
Total Rewards Survey: Initial Findings
3
Total Rewards Survey: Initial Findings
3
As organizations begin the journey toward a fully integrated total rewards program, one of the challenges they face is understanding the best way to attract and retain a workforce that has varying priorities. Today the majority of surveyed organizations stated their desired position for base pay, total compensation, and benefits is to be at the market median; that may change as organizations continue to focus on attraction and retention in the new millennium.
A few of the more interesting results in the survey showed that:
• Only 13% of large organizations seek to be above the market for total compensation and benefits compared to 42% of small organizations
• Around 28% of organizations believe their philosophy may differ from their actual practices; around 7% are above where they wish to be and 21% are below their desired position
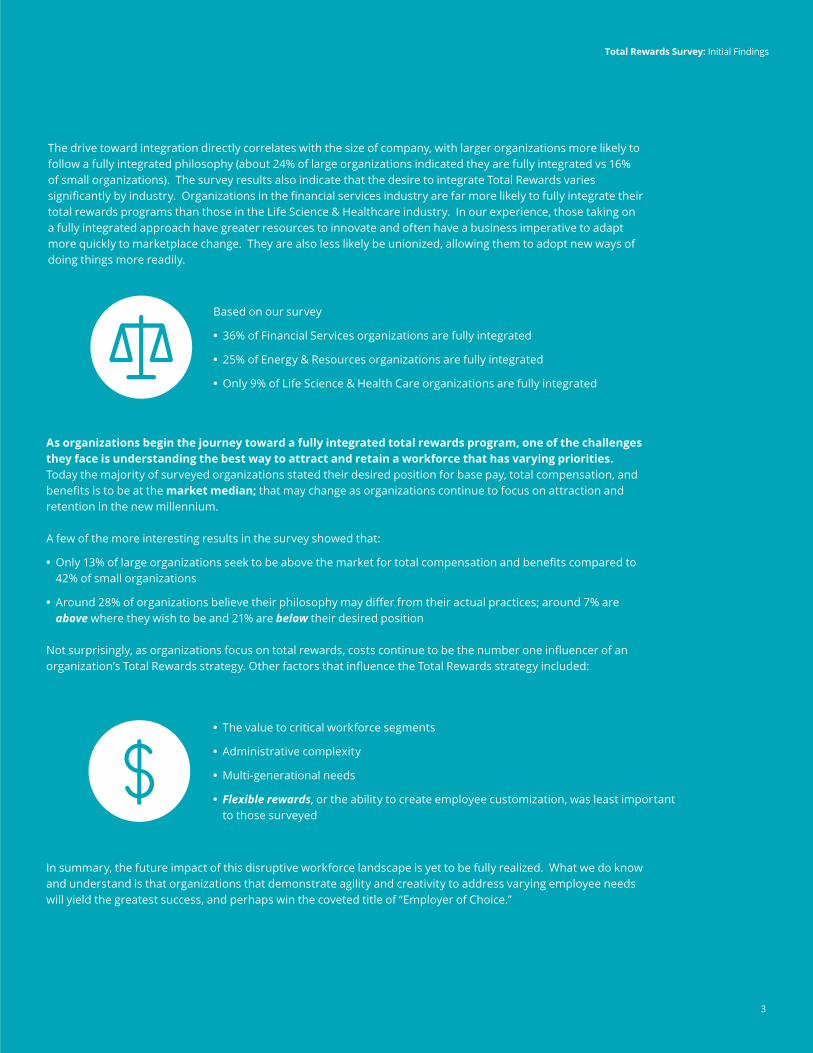
Not surprisingly, as organizations focus on total rewards, costs continue to be the number one influencer of an organization’s Total Rewards strategy. Other factors that influence the Total Rewards strategy included:
The drive toward integration directly correlates with the size of company, with larger organizations more likely to follow a fully integrated philosophy (about 24% of large organizations indicated they are fully integrated vs 16% of small organizations). The survey results also indicate that the desire to integrate Total Rewards varies significantly by industry. Organizations in the financial services industry are far more likely to fully integrate their total rewards programs than those in the Life Science & Healthcare industry. In our experience, those taking on a fully integrated approach have greater resources to innovate and often have a business imperative to adapt more quickly to marketplace change. They are also less likely be unionized, allowing them to adopt new ways of doing things more readily.
In summary, the future impact of this disruptive workforce landscape is yet to be fully realized. What we do know and understand is that organizations that demonstrate agility and creativity to address varying employee needs will yield the greatest success, and perhaps win the coveted title of “Employer of Choice.”
Based on our survey
• 36% of Financial Services organizations are fully integrated
• 25% of Energy & Resources organizations are fully integrated
• Only 9% of Life Science & Health Care organizations are fully integrated
• The value to critical workforce segments
• Administrative complexity
• Multi-generational needs
• Flexible rewards, or the ability to create employee customization, was least important to those surveyed
Total Rewards Survey: Initial Findings
4
In the section that follows, we have provided details on the Total Rewards philosophy questions posed in the survey and summarized the responses for each.
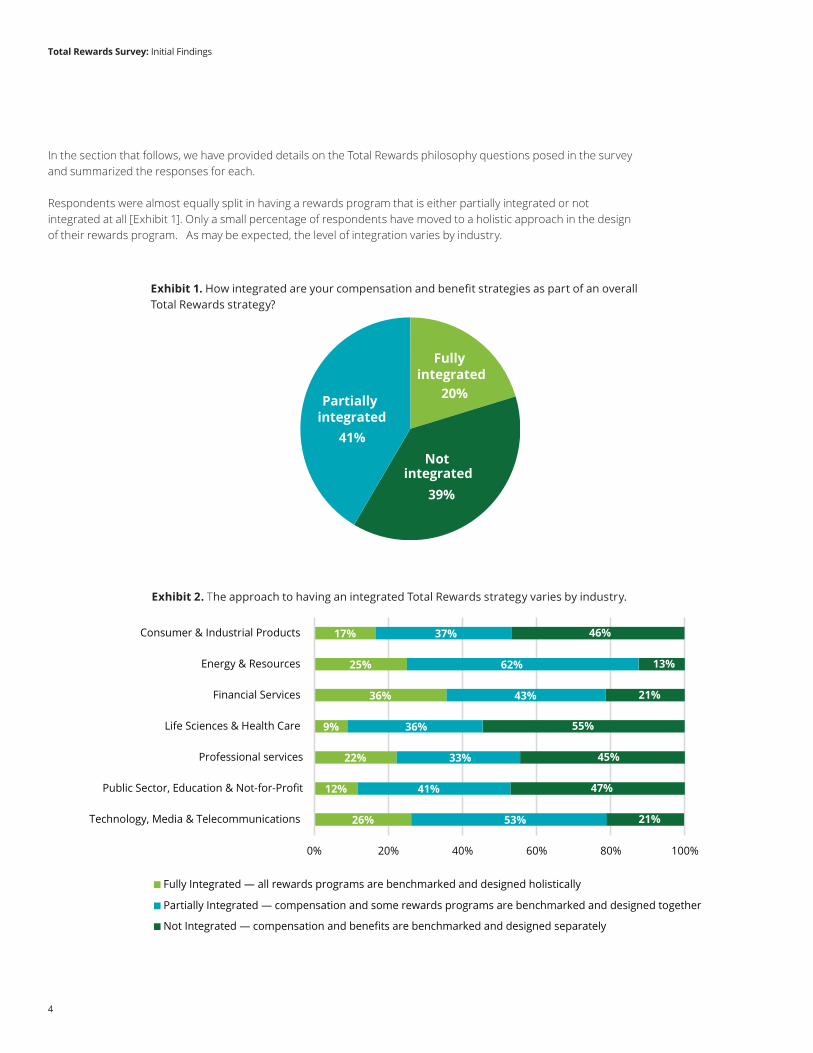
Respondents were almost equally split in having a rewards program that is either partially integrated or not integrated at all [Exhibit 1]. Only a small percentage of respondents have moved to a holistic approach in the design of their rewards program. As may be expected, the level of integration varies by industry.
Exhibit 1. How integrated are your compensation and benefit strategies as part of an overall Total Rewards strategy?
Fully integrated
20%
Not integrated
39%
Partially integrated
41%
Exhibit 2. The approach to having an integrated Total Rewards strategy varies by industry.
26%
12%
22%
9%
36%
25%
17%
21%
47%
45%
55%
21%
13%
46%
53%
41%
33%
36%
43%
62%
37%
0% 20% 40% 60% 80% 100%
Technology, Media & Telecommunications
Public Sector, Education & Not-for-Profit
Professional services
Life Sciences & Health Care
Financial Services
Energy & Resources
Consumer & Industrial Products
Fully Integrated — all rewards programs are benchmarked and designed holistically
Not Integrated — compensation and benefits are benchmarked and designed separately
Partially Integrated — compensation and some rewards programs are benchmarked and designed together

Total Rewards Survey: Initial Findings
5
Integration appears to be a direct correlation with the size of the company; large organizations are slightly more likely to adopt a fully integrated Total Rewards approach [Exhibit 3].
Nearly three out of four organizations (74%) surveyed indicated that they planned to move to a fully integrated or more integrated program philosophy [Exhibit 4].
16% 21% 24%
49% 37%39%
35% 42% 37%
0%
20%
40%
60%
80%
100%
<500 Employees 500 to 4,999 Employees >=5,000 Employees
Leve
l of I
nteg
ratio
n
Not Integrated—compensation and benefits are benchmarked and designed separately
Partially Integrated—compensation and some rewards programs are benchmarked and designed
Fully Integrated—all rewards programs are benchmarked and designed holistically
No—programs work
effectively remaining separate
26%
49%
Yes, more integrated but not fully integrated
Yes, to fully
integrated
25%
Exhibit 3. Level of integration by company size
Exhibit 4. Are there future plans to move to a more integrated philosophy if your program is not yet fully integrated?
Total Rewards Survey: Initial Findings
6 6
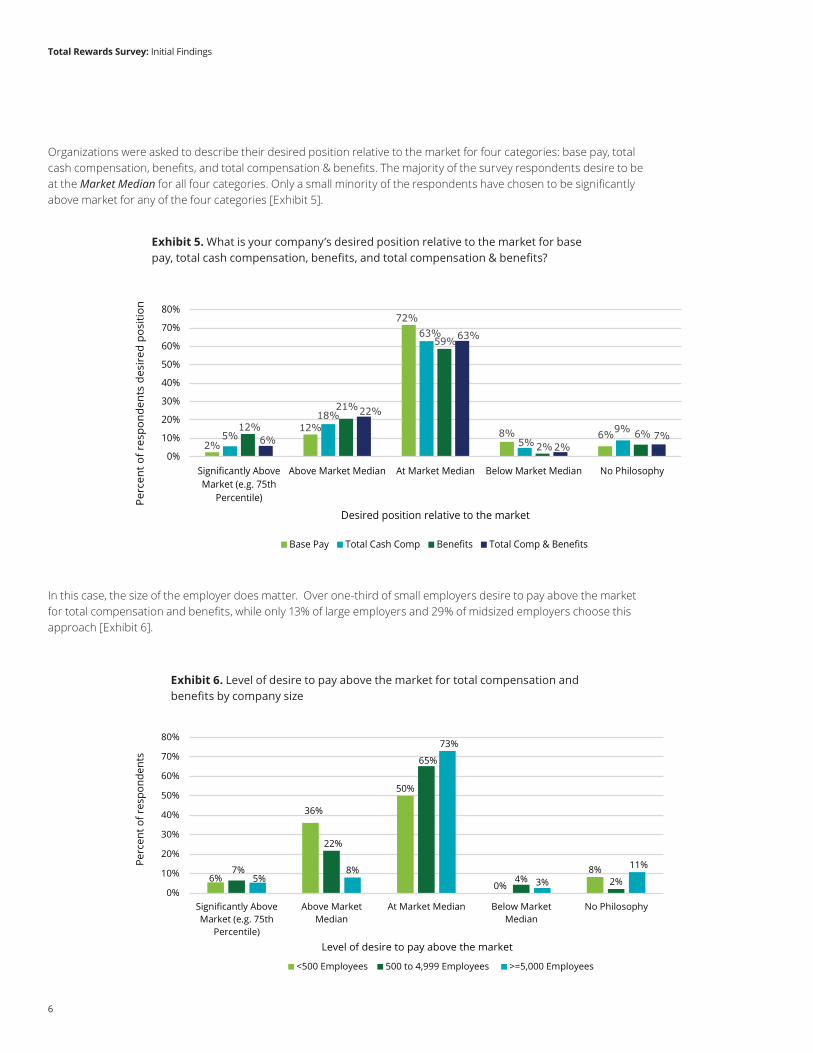
Organizations were asked to describe their desired position relative to the market for four categories: base pay, total cash compensation, benefits, and total compensation & benefits. The majority of the survey respondents desire to be at the Market Median for all four categories. Only a small minority of the respondents have chosen to be significantly above market for any of the four categories [Exhibit 5].
In this case, the size of the employer does matter. Over one-third of small employers desire to pay above the market for total compensation and benefits, while only 13% of large employers and 29% of midsized employers choose this approach [Exhibit 6].
2%
12%
72%
8% 6%5%
18%
63%
5%9%12%
21%
59%
2%6%6%
22%
63%
2%7%
0%
10%
20%
30%
40%
50%
60%
70%
80%
Significantly AboveMarket (e.g. 75th
Percentile)
Above Market Median At Market Median Below Market Median No Philosophy
Perc
ent o
f res
pond
ents
des
ired
pos
ition
Desired position relative to the market
Base Pay Total Cash Comp Benefits Total Comp & Benefits
6%
36%
50%
0%
8%7%
22%
65%
4% 2%5%8%
73%
3%
11%
0%
10%
20%
30%
40%
50%
60%
70%
80%
Significantly AboveMarket (e.g. 75th
Percentile)
Above MarketMedian
At Market Median Below MarketMedian
No Philosophy
Perc
ent o
f res
pond
ents
Level of desire to pay above the market
<500 Employees 500 to 4,999 Employees >=5,000 Employees
Exhibit 5. What is your company’s desired position relative to the market for base pay, total cash compensation, benefits, and total compensation & benefits?
Exhibit 6. Level of desire to pay above the market for total compensation and benefits by company size
Total Rewards Survey: Initial Findings
7
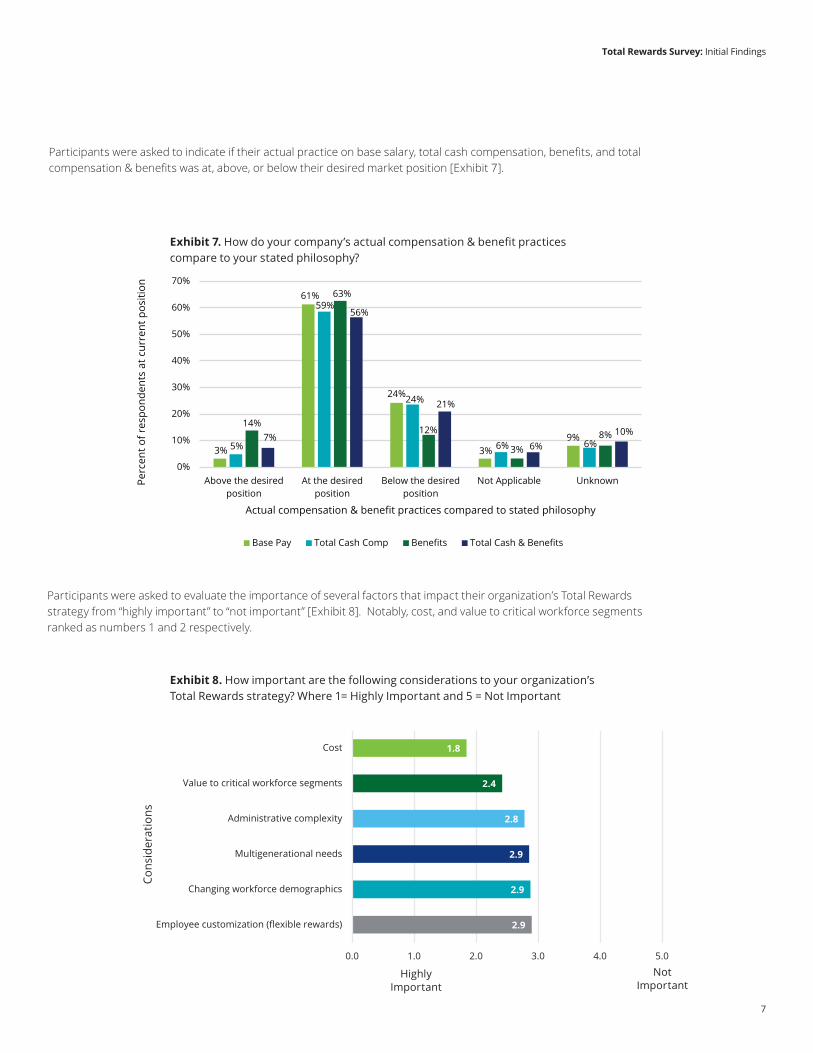
Participants were asked to indicate if their actual practice on base salary, total cash compensation, benefits, and total compensation & benefits was at, above, or below their desired market position [Exhibit 7].
Participants were asked to evaluate the importance of several factors that impact their organization’s Total Rewards strategy from “highly important” to “not important” [Exhibit 8]. Notably, cost, and value to critical workforce segments ranked as numbers 1 and 2 respectively.
3%
61%
24%
3%9%
5%
59%
24%
6% 6%
14%
63%
12%
3%8%7%
56%
21%
6%10%
0%
10%
20%
30%
40%
50%
60%
70%
Above the desiredposition
At the desiredposition
Below the desiredposition
Not Applicable UnknownPerc
ent o
f res
pond
ents
at c
urre
nt p
ositi
on
Actual compensation & benefit practices compared to stated philosophy
Base Pay Total Cash Comp Benefits Total Cash & Benefits
Exhibit 7. How do your company’s actual compensation & benefit practices compare to your stated philosophy?
Exhibit 8. How important are the following considerations to your organization’s Total Rewards strategy? Where 1= Highly Important and 5 = Not Important
2.9
2.9
2.9
2.8
2.4
1.8
0.0 1.0 2.0 3.0 4.0 5.0
Employee customization (flexible rewards)
Changing workforce demographics
Multigenerational needs
Administrative complexity
Value to critical workforce segments
Cost
Cons
ider
atio
ns
Highly Important
Not Important
Total Rewards Survey: Initial Findings
8
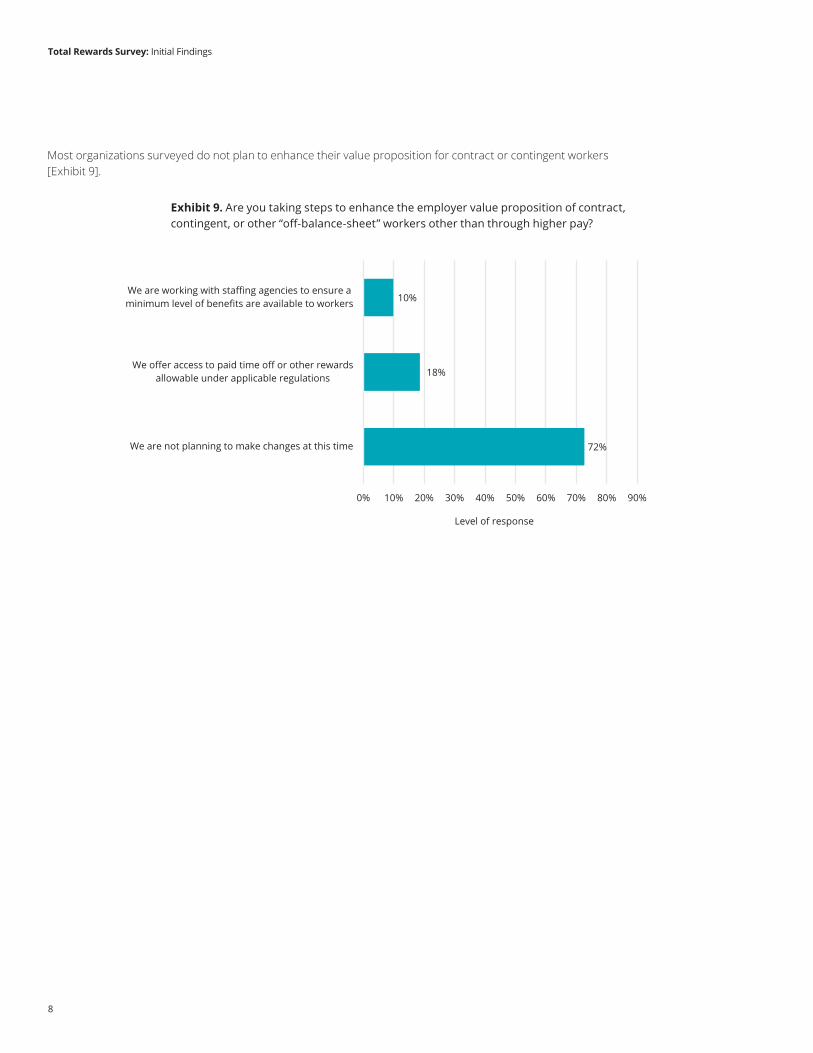
Most organizations surveyed do not plan to enhance their value proposition for contract or contingent workers [Exhibit 9].
72%
18%
10%
0% 10% 20% 30% 40% 50% 60% 70% 80% 90%
We are not planning to make changes at this time
We offer access to paid time off or other rewardsallowable under applicable regulations
We are working with staffing agencies to ensure aminimum level of benefits are available to workers
Level of response
Exhibit 9. Are you taking steps to enhance the employer value proposition of contract, contingent, or other “off-balance-sheet” workers other than through higher pay?
Total Rewards Survey: Initial Findings
9
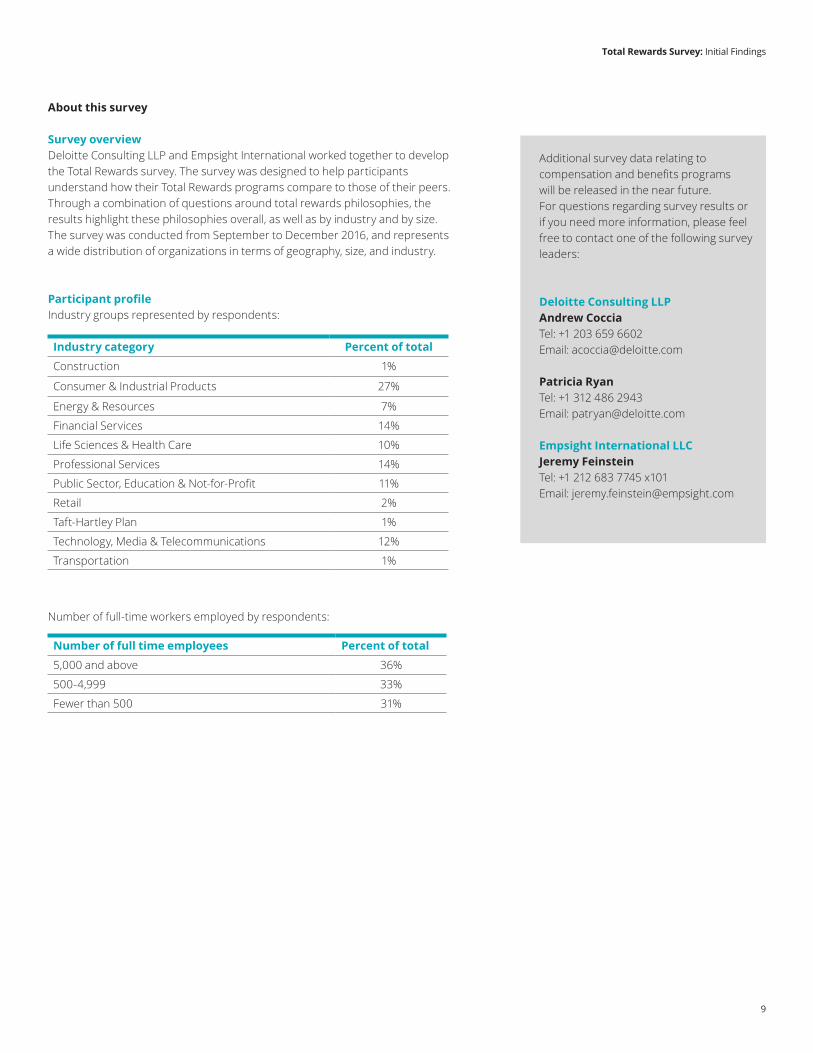
About this survey
Survey overviewDeloitte Consulting LLP and Empsight International worked together to develop the Total Rewards survey. The survey was designed to help participants understand how their Total Rewards programs compare to those of their peers. Through a combination of questions around total rewards philosophies, the results highlight these philosophies overall, as well as by industry and by size. The survey was conducted from September to December 2016, and represents a wide distribution of organizations in terms of geography, size, and industry.
Participant profileIndustry groups represented by respondents:
Number of full-time workers employed by respondents:
Industry category Percent of total
Construction 1%
Consumer & Industrial Products 27%
Energy & Resources 7%
Financial Services 14%
Life Sciences & Health Care 10%
Professional Services 14%
Public Sector, Education & Not-for-Profit 11%
Retail 2%
Taft-Hartley Plan 1%
Technology, Media & Telecommunications 12%
Transportation 1%
Number of full time employees Percent of total
5,000 and above 36%
500-4,999 33%
Fewer than 500 31%
Additional survey data relating to compensation and benefits programs will be released in the near future.For questions regarding survey results or if you need more information, please feel free to contact one of the following survey leaders:
Deloitte Consulting LLPAndrew CocciaTel: +1 203 659 6602Email: [email protected]
Patricia RyanTel: +1 312 486 2943Email: [email protected]
Empsight International LLCJeremy FeinsteinTel: +1 212 683 7745 x101Email: [email protected]

As used in this document, “Deloitte” means Deloitte Consulting LLP, a subsidiary of Deloitte LLP. Please see www.deloitte.com/us/about for a detailed description of our legal structure. Certain services may not be available to attest clients under the rules and regulations of public accounting.
This communication contains general information only, and none of Deloitte Touche Tohmatsu Limited, its member firms or their related entities (collectively, the “Deloitte Network”), is, by means of this communication, rendering professional advice or services. Before making any decisions or taking any action that may affect your finances, or your business, you should consult a qualified professional adviser. No entity in the Deloitte Network shall be responsible for any loss whatsoever sustained by any person who relies on this communication.
Copyright © 2017 Deloitte Development LLC. All rights reserved.


