40
| Date post: | 17-Aug-2015 |
| Category: |
Documents |
| Upload: | wayne-pappas |
| View: | 50 times |
| Download: | 0 times |
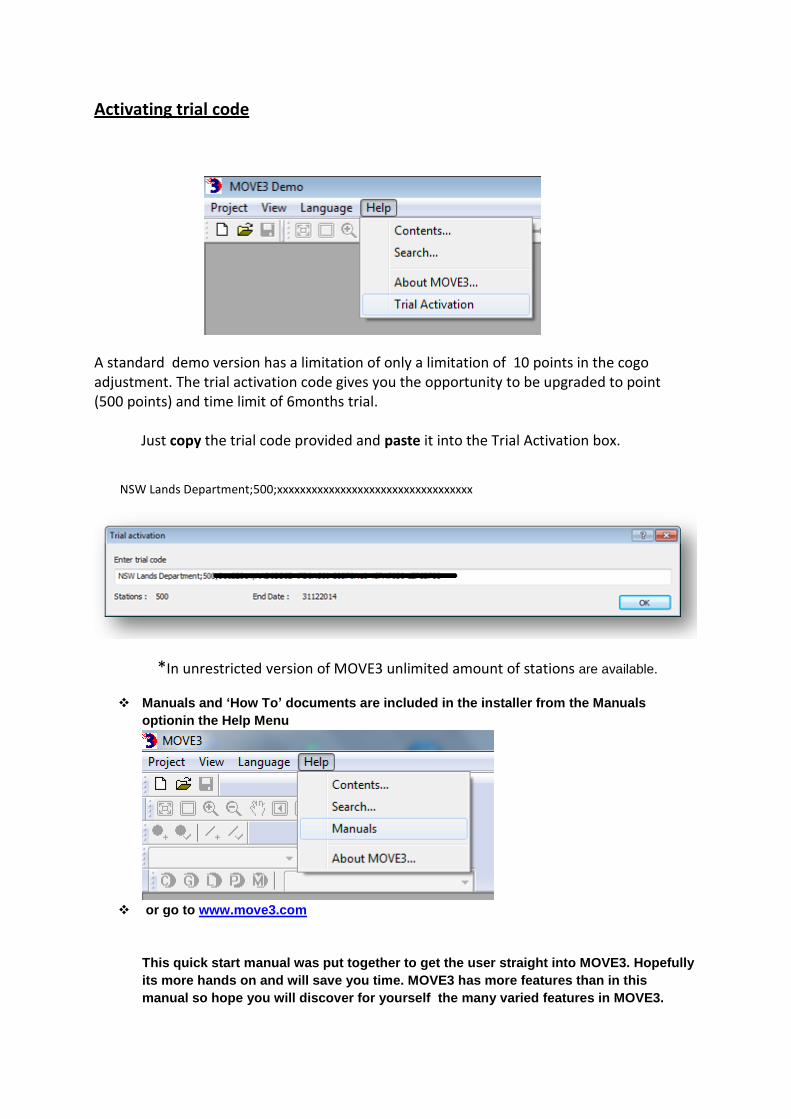
Activating trial code
A standard demo version has a limitation of only a limitation of 10 points in the cogo adjustment. The trial activation code gives you the opportunity to be upgraded to point (500 points) and time limit of 6months trial. Just copy the trial code provided and paste it into the Trial Activation box.
NSW Lands Department;500;xxxxxxxxxxxxxxxxxxxxxxxxxxxxxxxxxx
*In unrestricted version of MOVE3 unlimited amount of stations are available.
Manuals and ‘How To’ documents are included in the installer from the Manuals
optionin the Help Menu
or go to www.move3.com
This quick start manual was put together to get the user straight into MOVE3. Hopefully
its more hands on and will save you time. MOVE3 has more features than in this
manual so hope you will discover for yourself the many varied features in MOVE3.
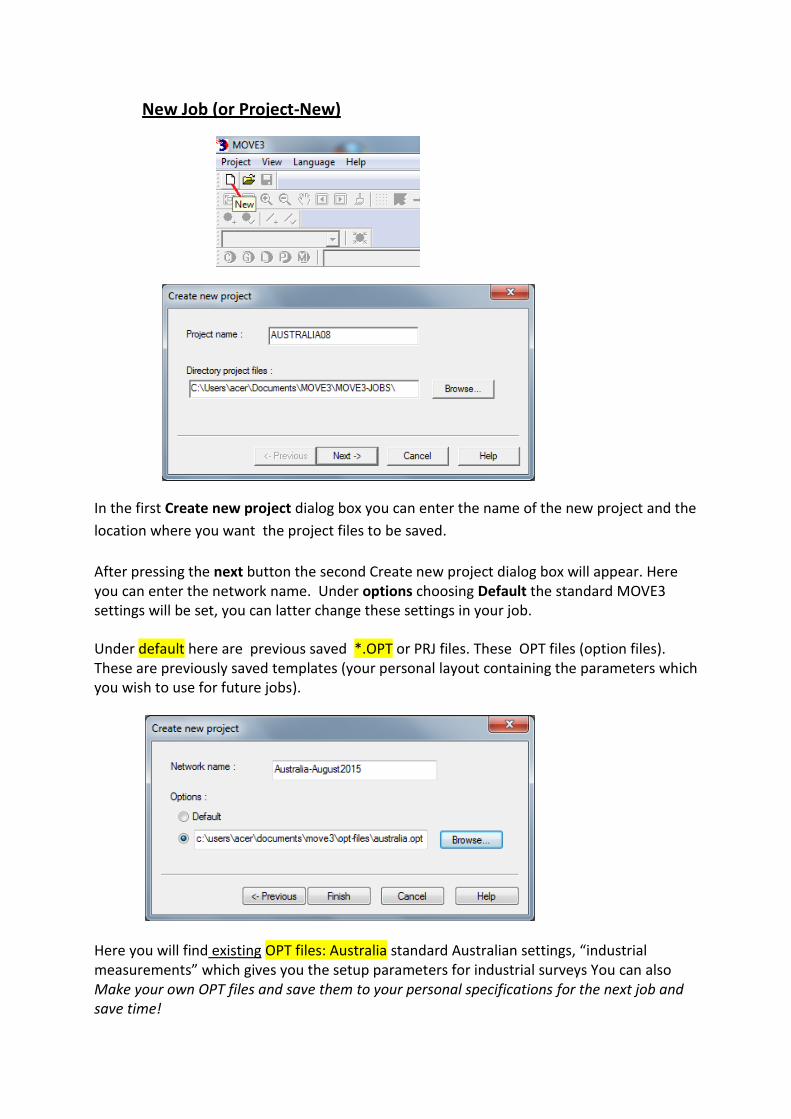
New Job (or Project-New)
In the first Create new project dialog box you can enter the name of the new project and the
location where you want the project files to be saved.
After pressing the next button the second Create new project dialog box will appear. Here you can enter the network name. Under options choosing Default the standard MOVE3 settings will be set, you can latter change these settings in your job.
Under default here are previous saved *.OPT or PRJ files. These OPT files (option files). These are previously saved templates (your personal layout containing the parameters which you wish to use for future jobs).
Here you will find existing OPT files: Australia standard Australian settings, “industrial measurements” which gives you the setup parameters for industrial surveys You can also Make your own OPT files and save them to your personal specifications for the next job and save time!
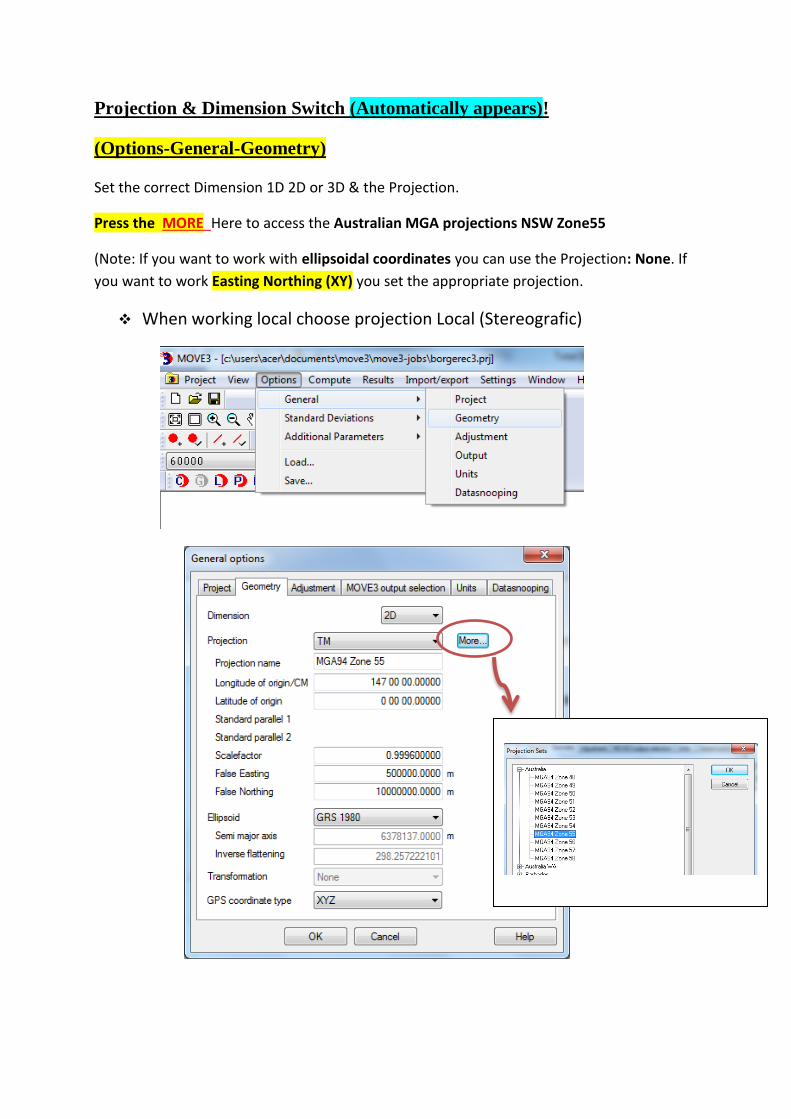
Projection & Dimension Switch (Automatically appears)!
(Options-General-Geometry)
Set the correct Dimension 1D 2D or 3D & the Projection.
Press the MORE Here to access the Australian MGA projections NSW Zone55
(Note: If you want to work with ellipsoidal coordinates you can use the Projection: None. If
you want to work Easting Northing (XY) you set the appropriate projection.
When working local choose projection Local (Stereografic)
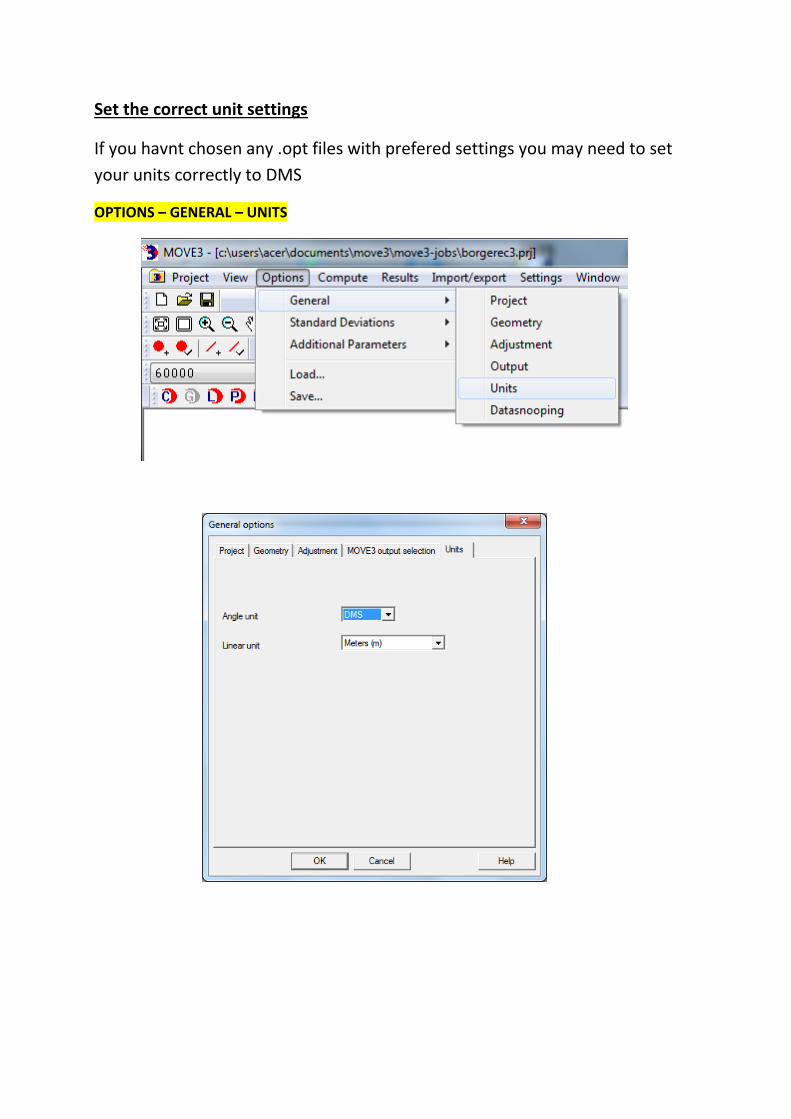
Set the correct unit settings
If you havnt chosen any .opt files with prefered settings you may need to set
your units correctly to DMS
OPTIONS – GENERAL – UNITS
don’t fortget to save your job!
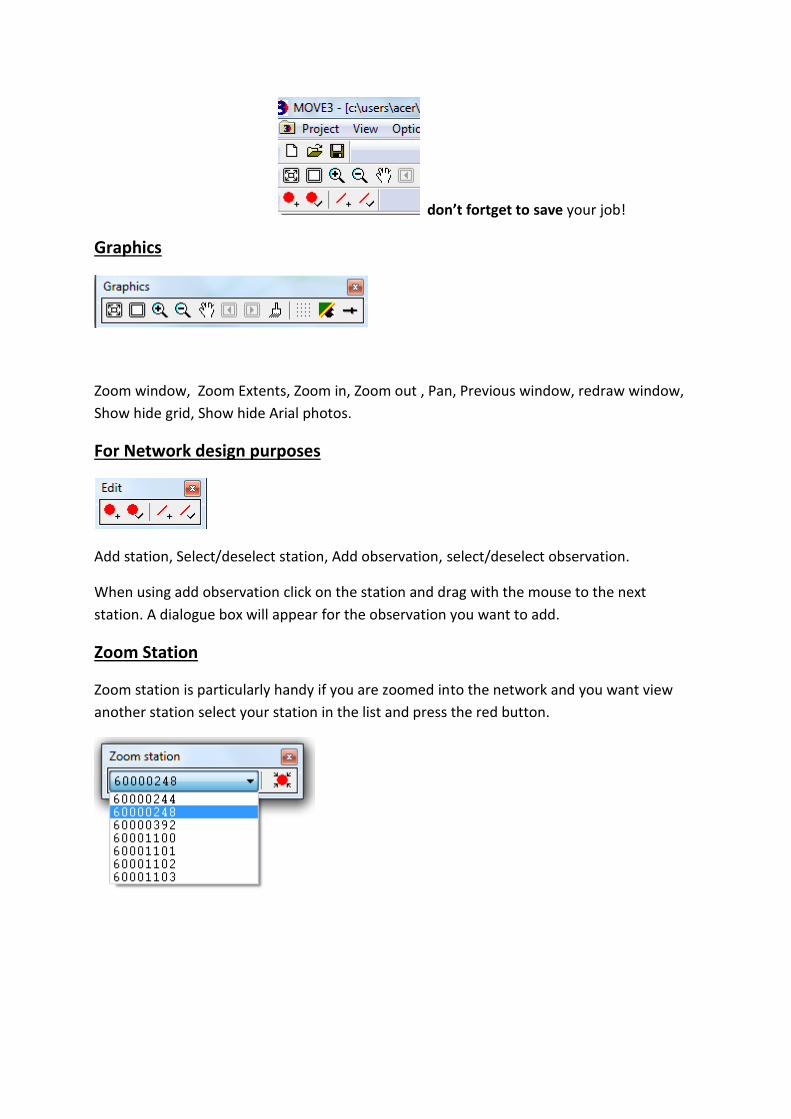
Graphics
Zoom window, Zoom Extents, Zoom in, Zoom out , Pan, Previous window, redraw window,
Show hide grid, Show hide Arial photos.
For Network design purposes
Add station, Select/deselect station, Add observation, select/deselect observation.
When using add observation click on the station and drag with the mouse to the next
station. A dialogue box will appear for the observation you want to add.
Zoom Station
Zoom station is particularly handy if you are zoomed into the network and you want view
another station select your station in the list and press the red button.
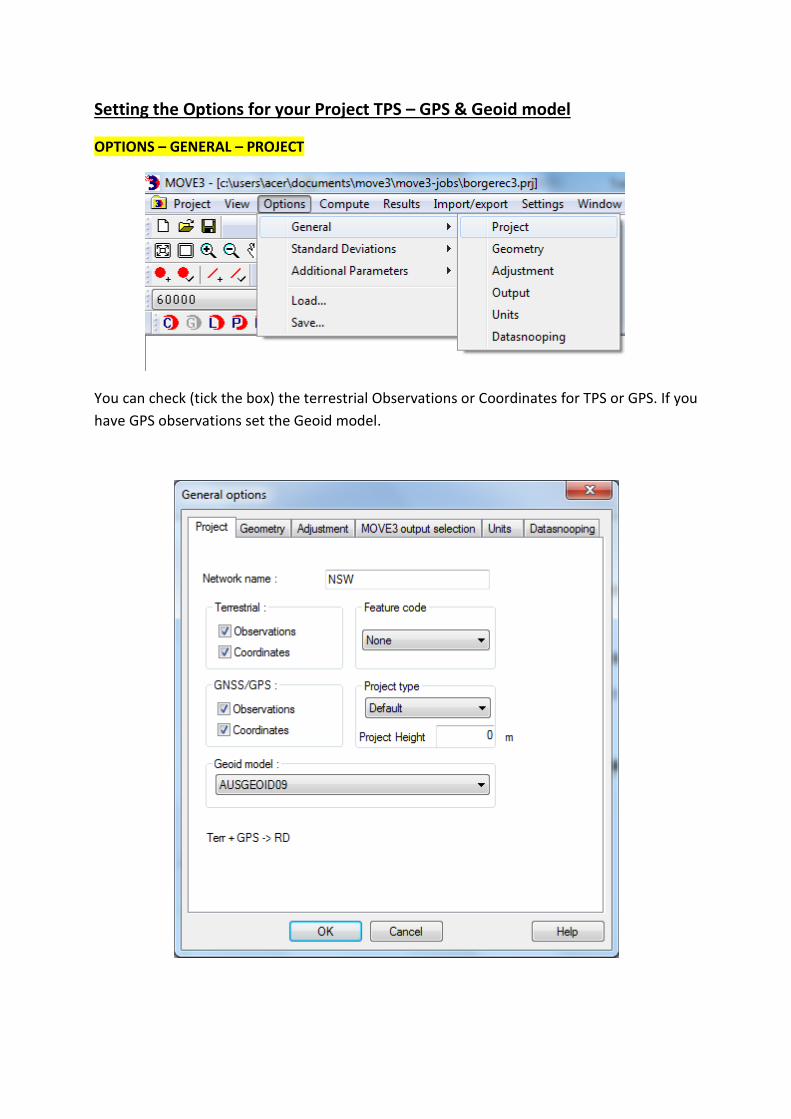
Setting the Options for your Project TPS – GPS & Geoid model
OPTIONS – GENERAL – PROJECT
You can check (tick the box) the terrestrial Observations or Coordinates for TPS or GPS. If you
have GPS observations set the Geoid model.
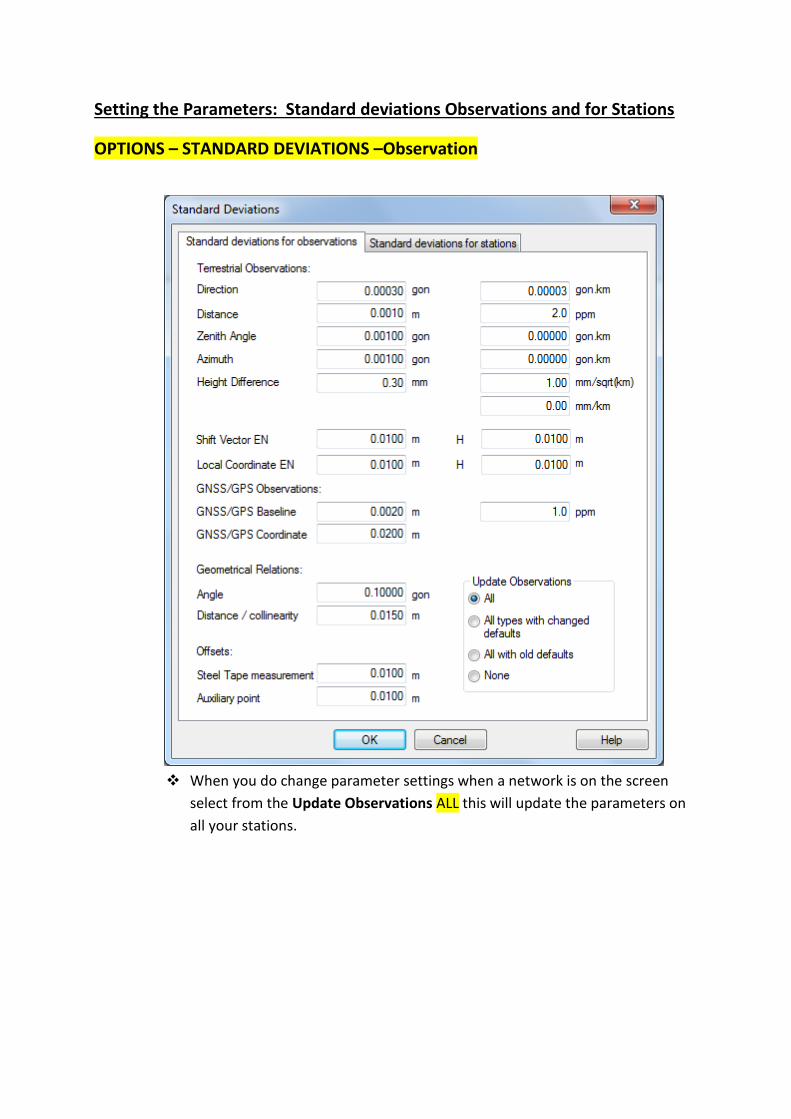
Setting the Parameters: Standard deviations Observations and for Stations
OPTIONS – STANDARD DEVIATIONS –Observation
When you do change parameter settings when a network is on the screen
select from the Update Observations ALL this will update the parameters on
all your stations.
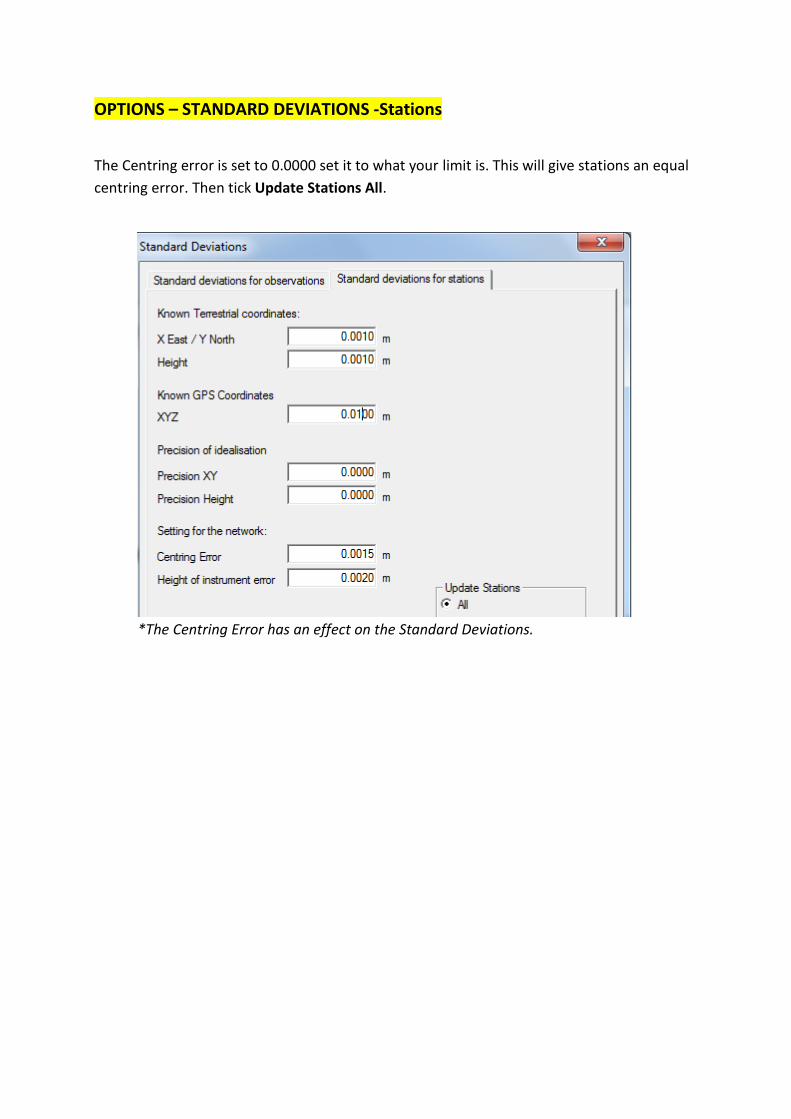
OPTIONS – STANDARD DEVIATIONS -Stations
The Centring error is set to 0.0000 set it to what your limit is. This will give stations an equal
centring error. Then tick Update Stations All.
*The Centring Error has an effect on the Standard Deviations.
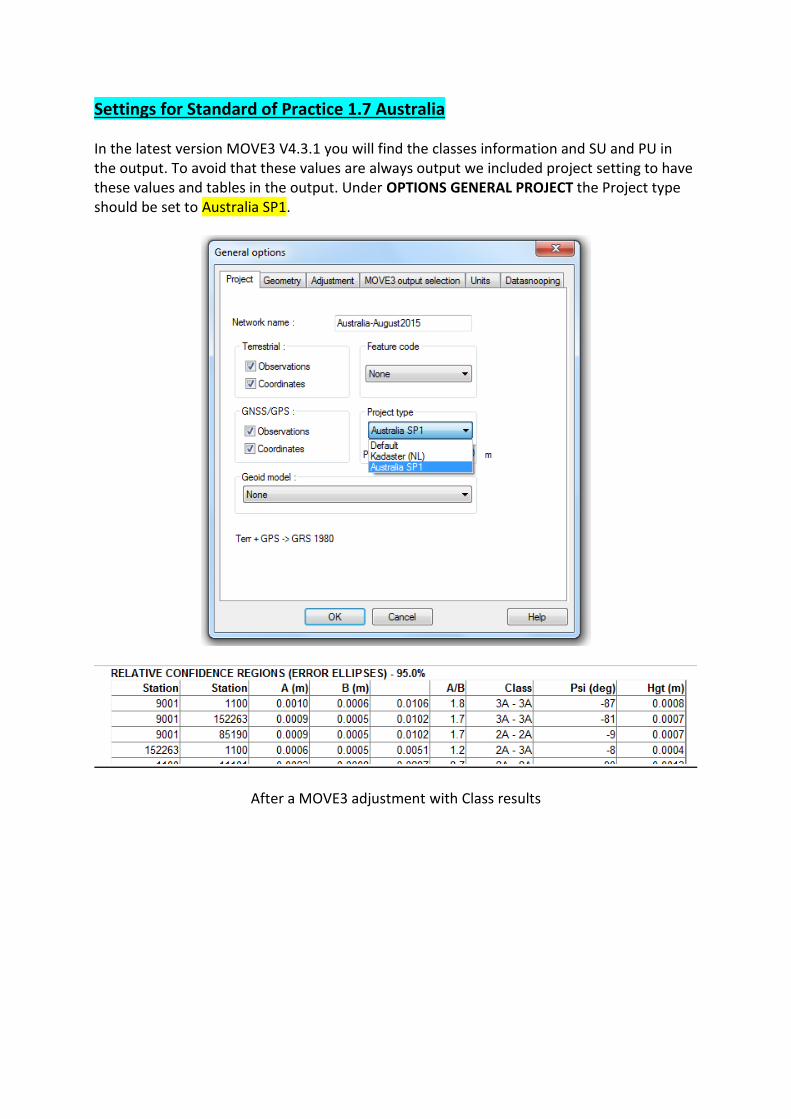
Settings for Standard of Practice 1.7 Australia
In the latest version MOVE3 V4.3.1 you will find the classes information and SU and PU in the output. To avoid that these values are always output we included project setting to have these values and tables in the output. Under OPTIONS GENERAL PROJECT the Project type should be set to Australia SP1.
After a MOVE3 adjustment with Class results
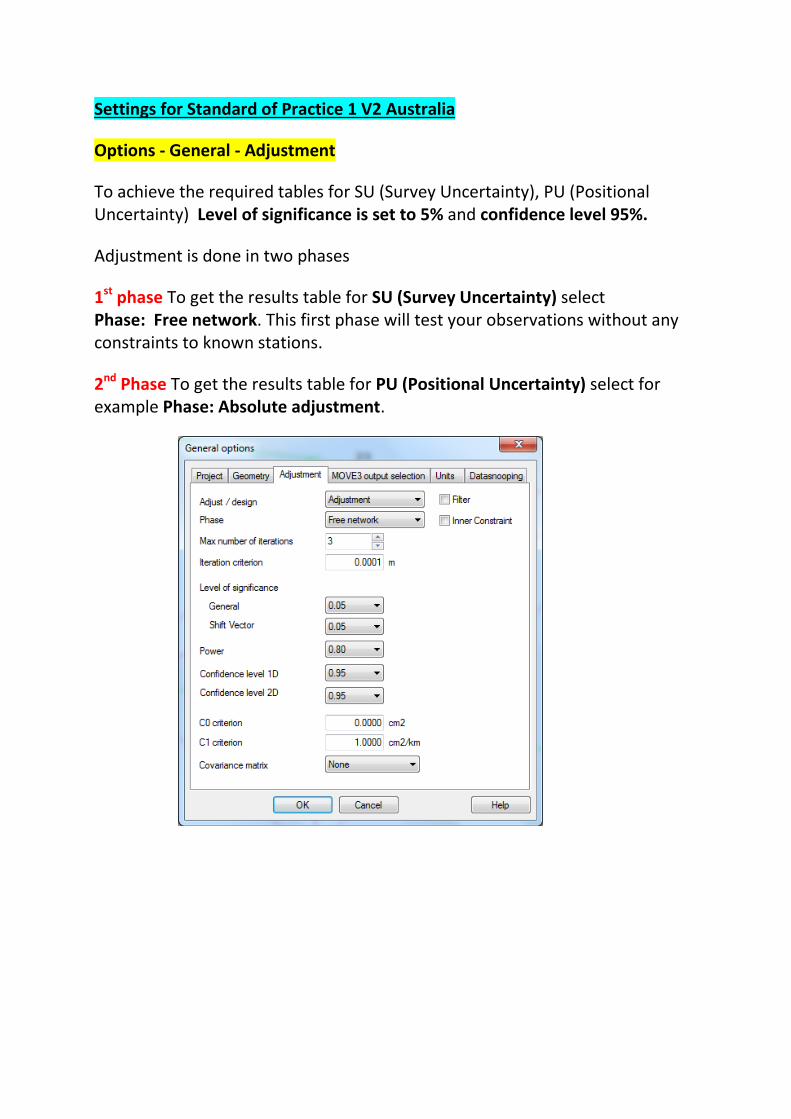
Settings for Standard of Practice 1 V2 Australia
Options - General - Adjustment
To achieve the required tables for SU (Survey Uncertainty), PU (Positional Uncertainty) Level of significance is set to 5% and confidence level 95%.
Adjustment is done in two phases
1st phase To get the results table for SU (Survey Uncertainty) select Phase: Free network. This first phase will test your observations without any constraints to known stations.
2nd Phase To get the results table for PU (Positional Uncertainty) select for example Phase: Absolute adjustment.

1st phase the results table for SU (Survey Uncertainty) after a Free network Adjustment.
2nd Phase the results table for PU (Positional Uncertainty) after a Constrained adjustment.
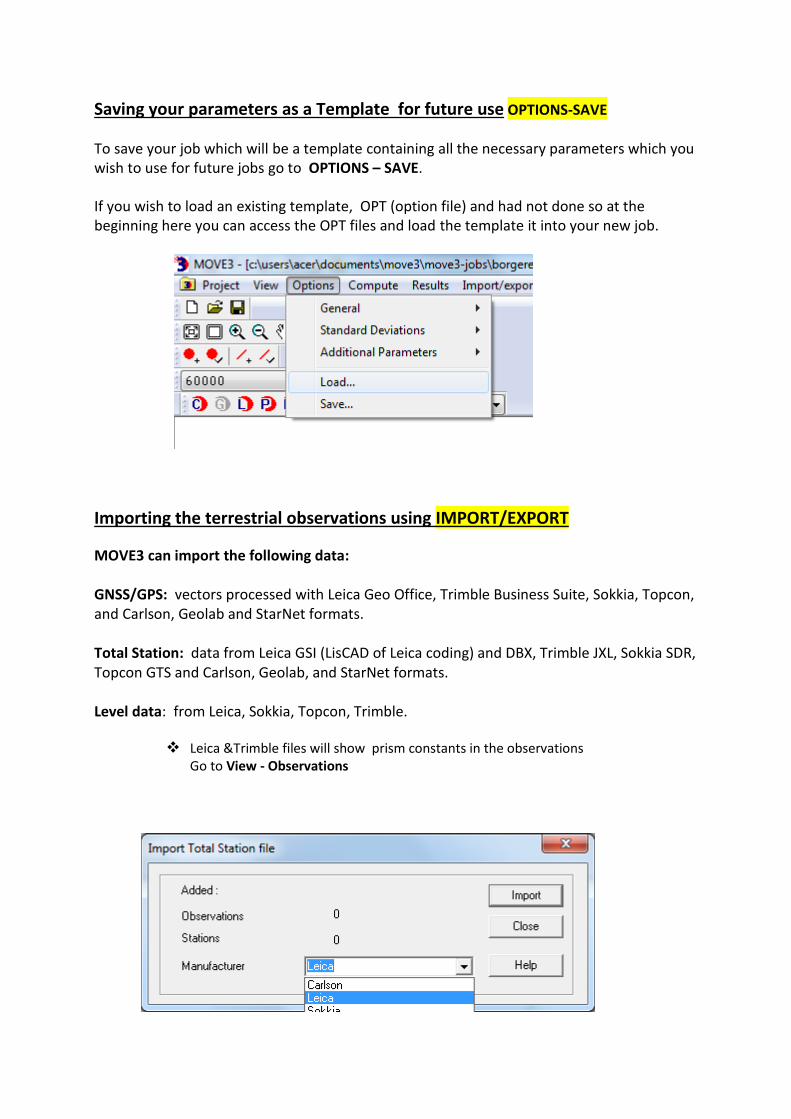
Saving your parameters as a Template for future use OPTIONS-SAVE
To save your job which will be a template containing all the necessary parameters which you wish to use for future jobs go to OPTIONS – SAVE.
If you wish to load an existing template, OPT (option file) and had not done so at the beginning here you can access the OPT files and load the template it into your new job.
Importing the terrestrial observations using IMPORT/EXPORT
MOVE3 can import the following data: GNSS/GPS: vectors processed with Leica Geo Office, Trimble Business Suite, Sokkia, Topcon, and Carlson, Geolab and StarNet formats. Total Station: data from Leica GSI (LisCAD of Leica coding) and DBX, Trimble JXL, Sokkia SDR, Topcon GTS and Carlson, Geolab, and StarNet formats. Level data: from Leica, Sokkia, Topcon, Trimble.
Leica &Trimble files will show prism constants in the observations Go to View - Observations
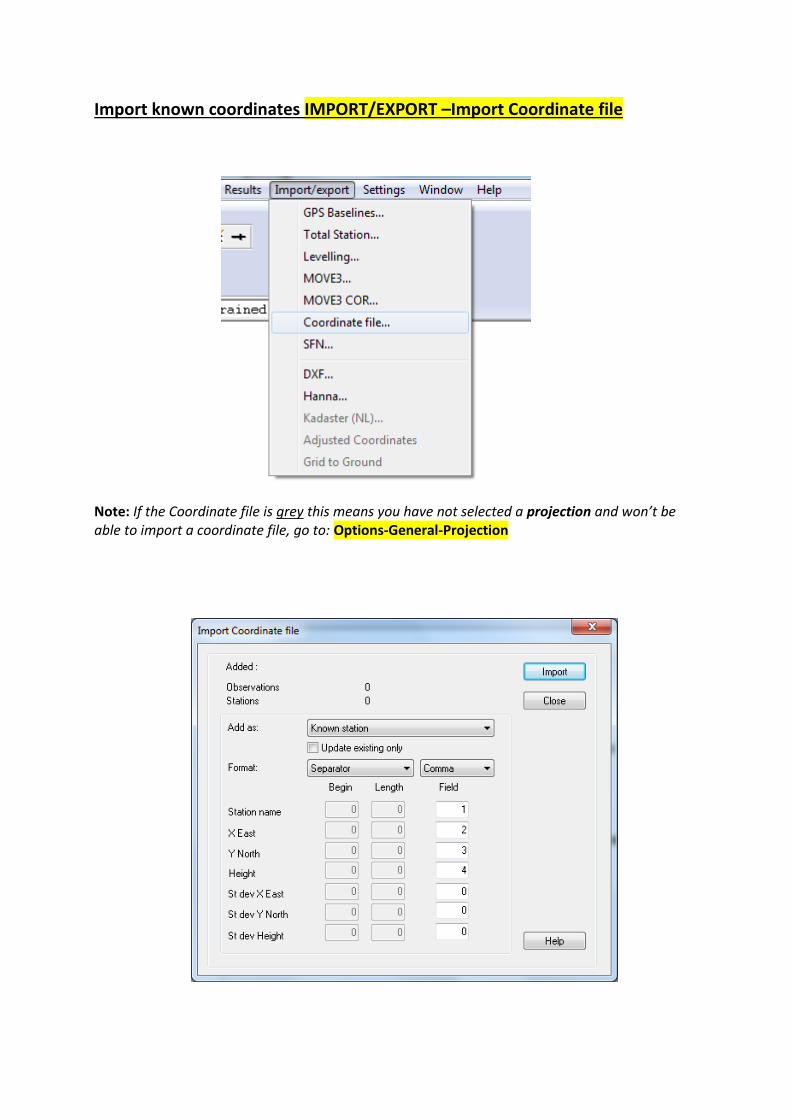
Import known coordinates IMPORT/EXPORT –Import Coordinate file
Note: If the Coordinate file is grey this means you have not selected a projection and won’t be able to import a coordinate file, go to: Options-General-Projection
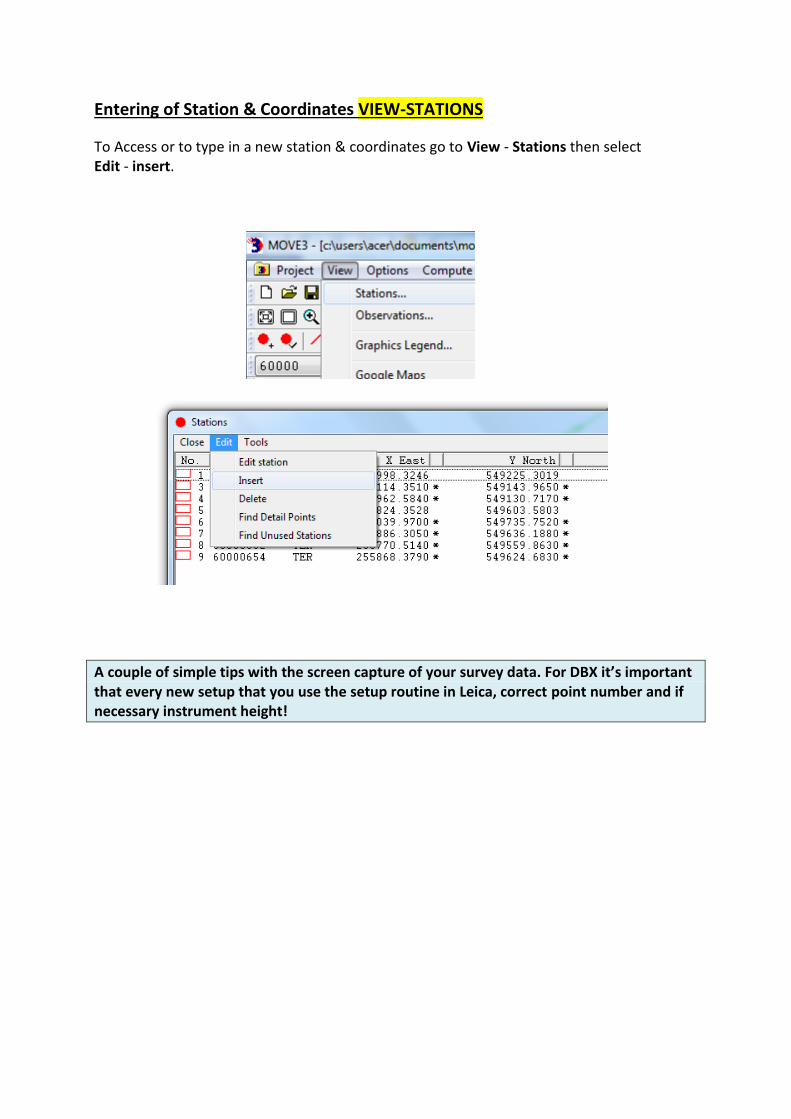
Entering of Station & Coordinates VIEW-STATIONS
To Access or to type in a new station & coordinates go to View - Stations then select Edit - insert.
A couple of simple tips with the screen capture of your survey data. For DBX it’s important that every new setup that you use the setup routine in Leica, correct point number and if necessary instrument height!
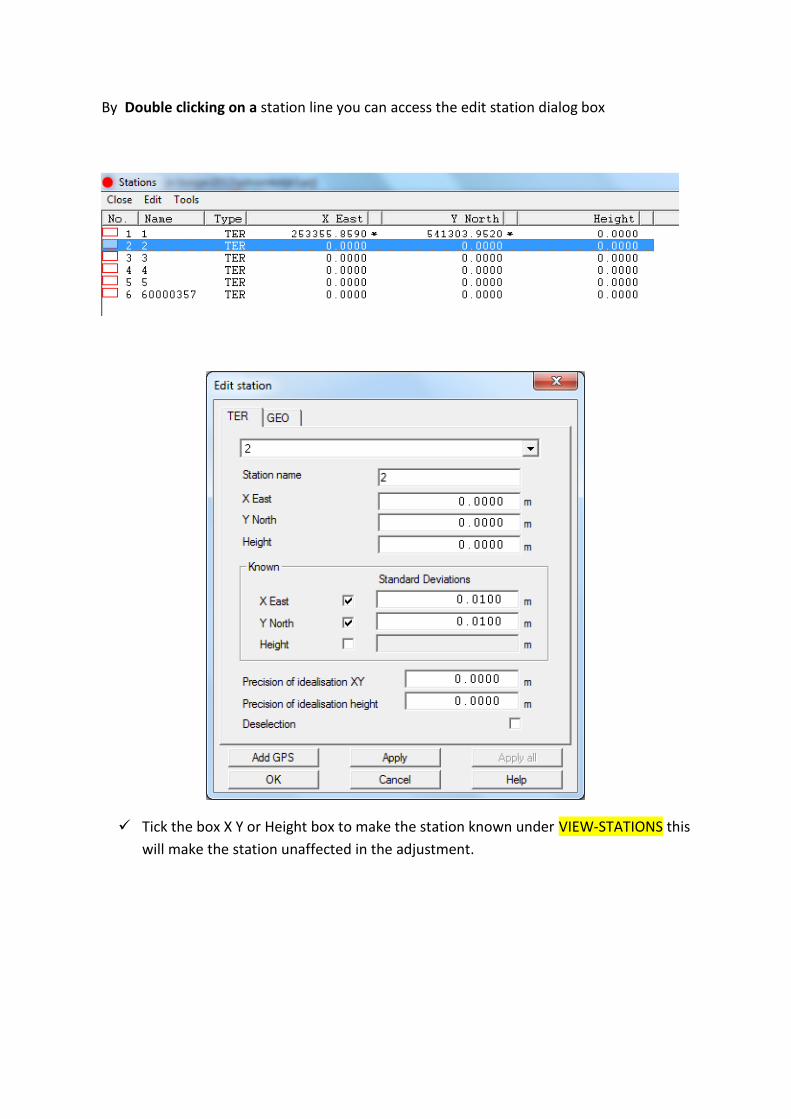
By Double clicking on a station line you can access the edit station dialog box
Tick the box X Y or Height box to make the station known under VIEW-STATIONS this
will make the station unaffected in the adjustment.
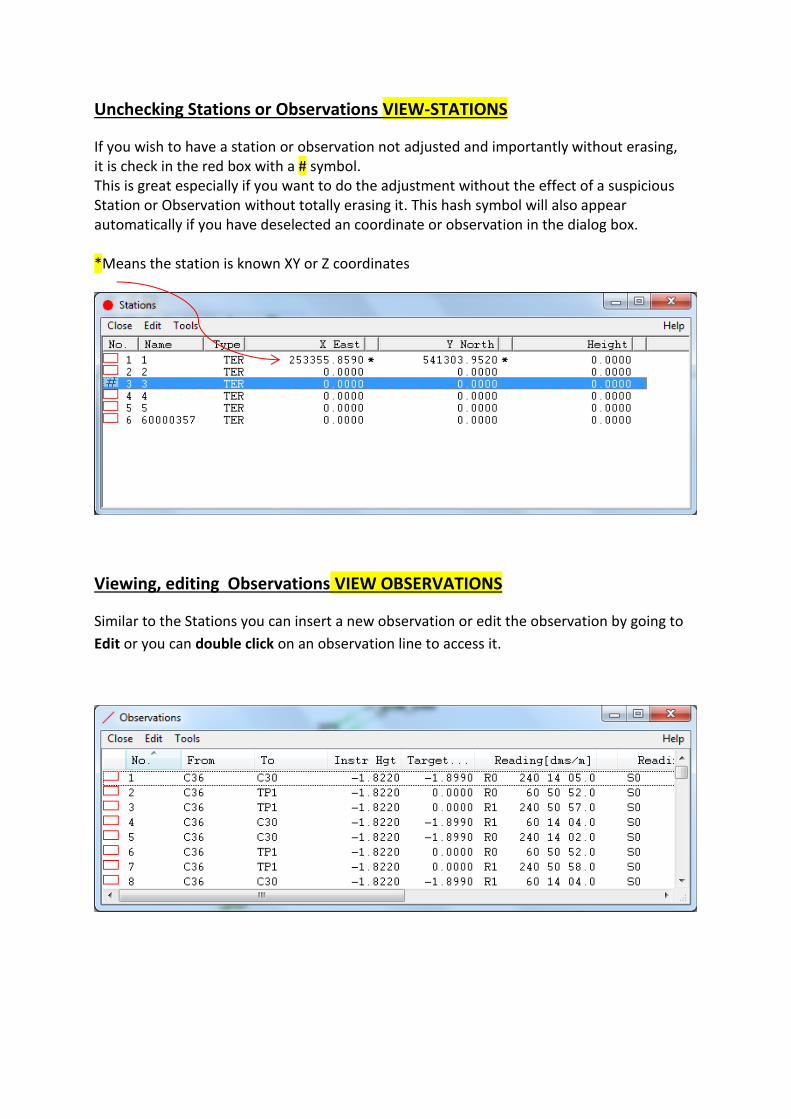
Unchecking Stations or Observations VIEW-STATIONS
If you wish to have a station or observation not adjusted and importantly without erasing, it is check in the red box with a # symbol. This is great especially if you want to do the adjustment without the effect of a suspicious Station or Observation without totally erasing it. This hash symbol will also appear automatically if you have deselected an coordinate or observation in the dialog box. *Means the station is known XY or Z coordinates
Viewing, editing Observations VIEW OBSERVATIONS
Similar to the Stations you can insert a new observation or edit the observation by going to
Edit or you can double click on an observation line to access it.
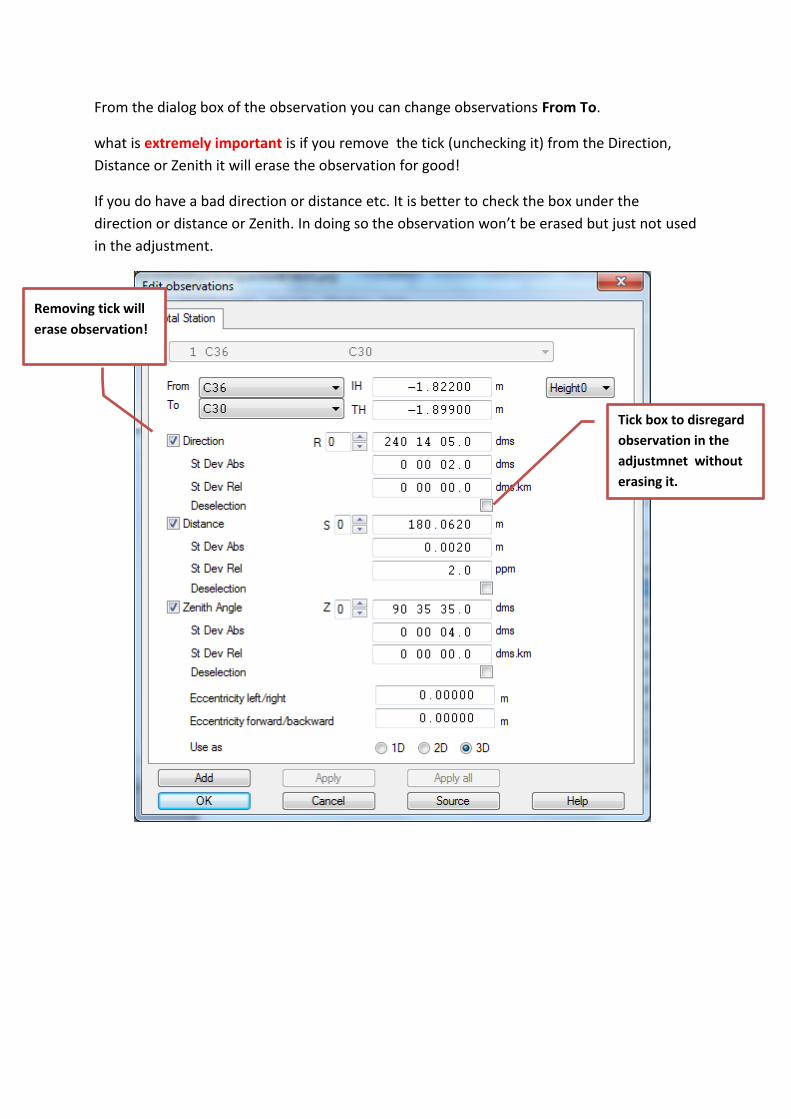
From the dialog box of the observation you can change observations From To.
what is extremely important is if you remove the tick (unchecking it) from the Direction,
Distance or Zenith it will erase the observation for good!
If you do have a bad direction or distance etc. It is better to check the box under the
direction or distance or Zenith. In doing so the observation won’t be erased but just not used
in the adjustment.
Removing tick will
erase observation!
Tick box to disregard
observation in the
adjustmnet without
erasing it.
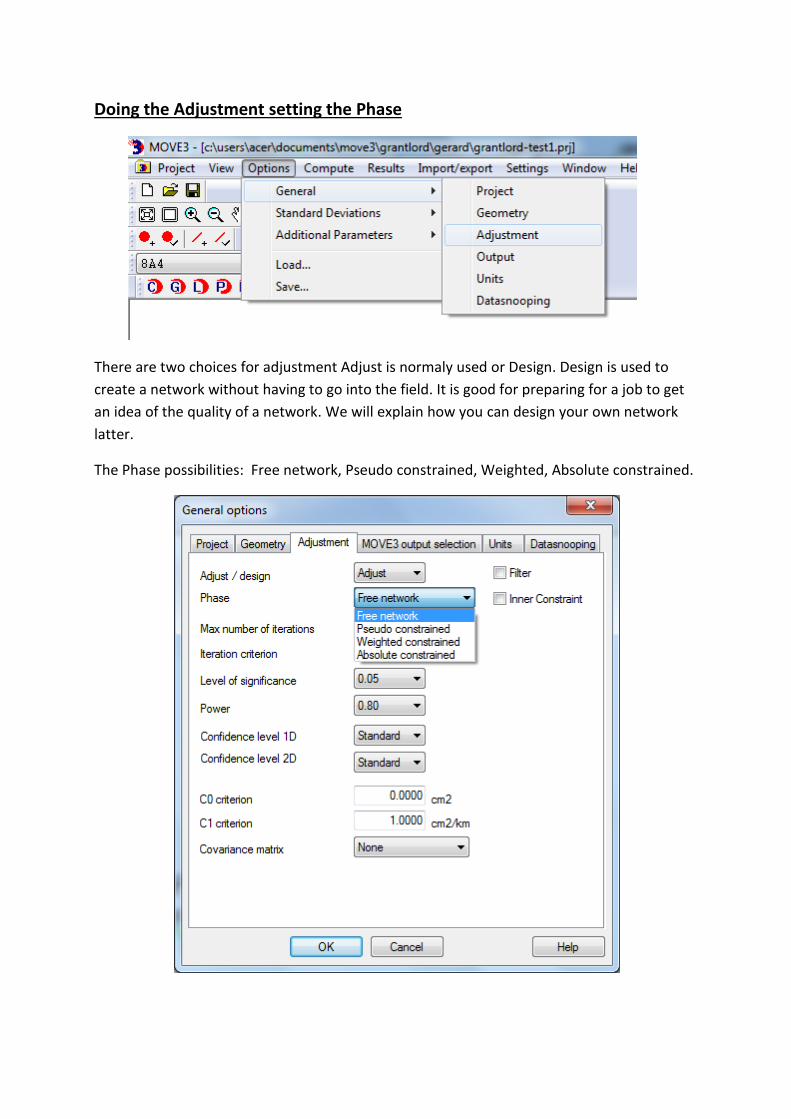
Doing the Adjustment setting the Phase
There are two choices for adjustment Adjust is normaly used or Design. Design is used to
create a network without having to go into the field. It is good for preparing for a job to get
an idea of the quality of a network. We will explain how you can design your own network
latter.
The Phase possibilities: Free network, Pseudo constrained, Weighted, Absolute constrained.
Free network For a free network adjustment with minimum constraint. This will test just
your observations this is normally seen as the first phase in the adjustment checking your
observations for any errors then move to the second phase of the adjustment selecting a
constraint to check errors in the known stations.
Pseudo constrained
a pseudo least squares adjustment with pseudo least
squares precision (coordinates and standard deviations of
the known stations do not change in the adjustment);
weighted constrained for a weighted constrained adjustment (coordinates and
standard deviations of the known stations get a
correction);
absolute constrained for an absolute constrained adjustment (coordinates of the
known stations do not change, standard deviations of these
stations are fixed at zero).
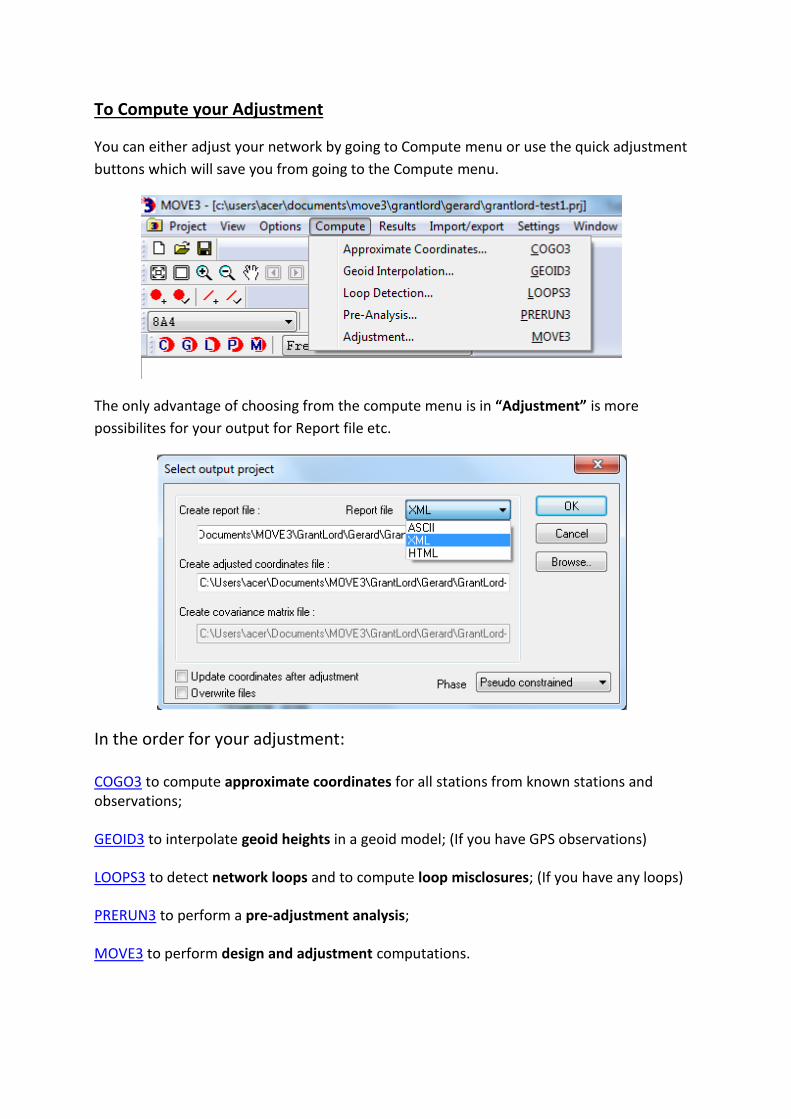
To Compute your Adjustment
You can either adjust your network by going to Compute menu or use the quick adjustment
buttons which will save you from going to the Compute menu.
The only advantage of choosing from the compute menu is in “Adjustment” is more
possibilites for your output for Report file etc.
In the order for your adjustment:
COGO3 to compute approximate coordinates for all stations from known stations and observations;
GEOID3 to interpolate geoid heights in a geoid model; (If you have GPS observations)
LOOPS3 to detect network loops and to compute loop misclosures; (If you have any loops)
PRERUN3 to perform a pre-adjustment analysis;
MOVE3 to perform design and adjustment computations.
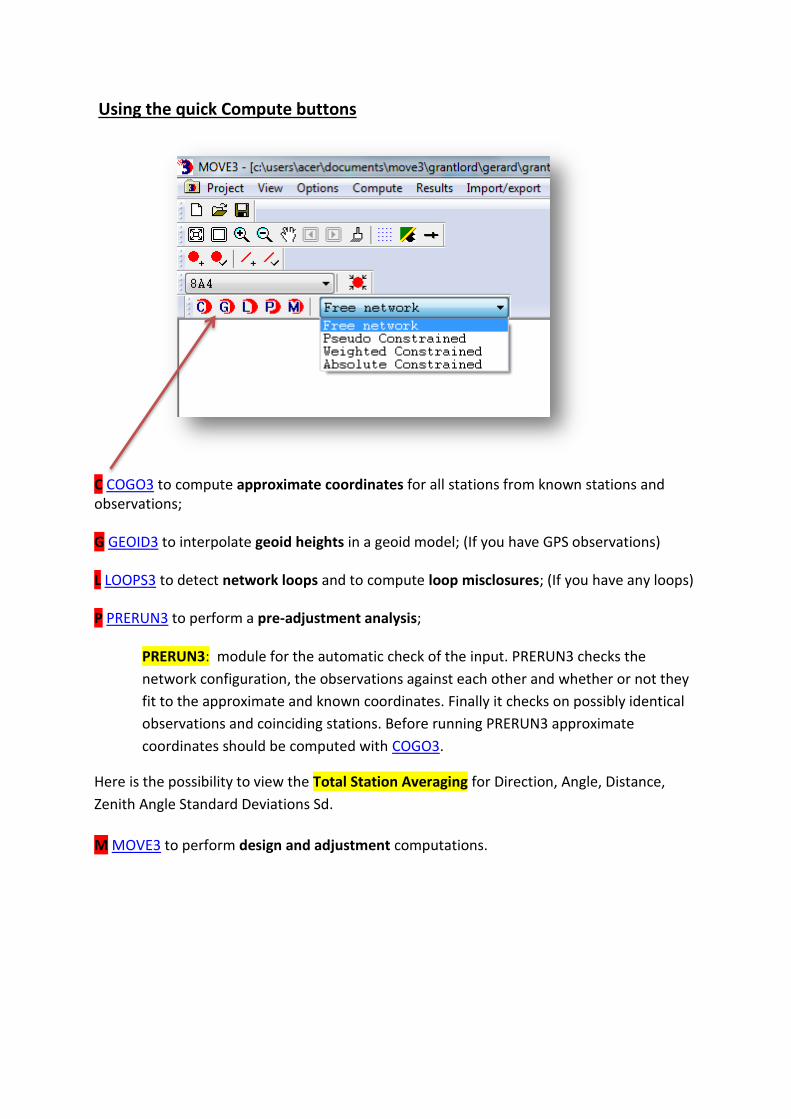
Using the quick Compute buttons
C COGO3 to compute approximate coordinates for all stations from known stations and observations;
G GEOID3 to interpolate geoid heights in a geoid model; (If you have GPS observations)
L LOOPS3 to detect network loops and to compute loop misclosures; (If you have any loops)
P PRERUN3 to perform a pre-adjustment analysis;
PRERUN3: module for the automatic check of the input. PRERUN3 checks the
network configuration, the observations against each other and whether or not they
fit to the approximate and known coordinates. Finally it checks on possibly identical
observations and coinciding stations. Before running PRERUN3 approximate
coordinates should be computed with COGO3.
Here is the possibility to view the Total Station Averaging for Direction, Angle, Distance,
Zenith Angle Standard Deviations Sd.
M MOVE3 to perform design and adjustment computations.
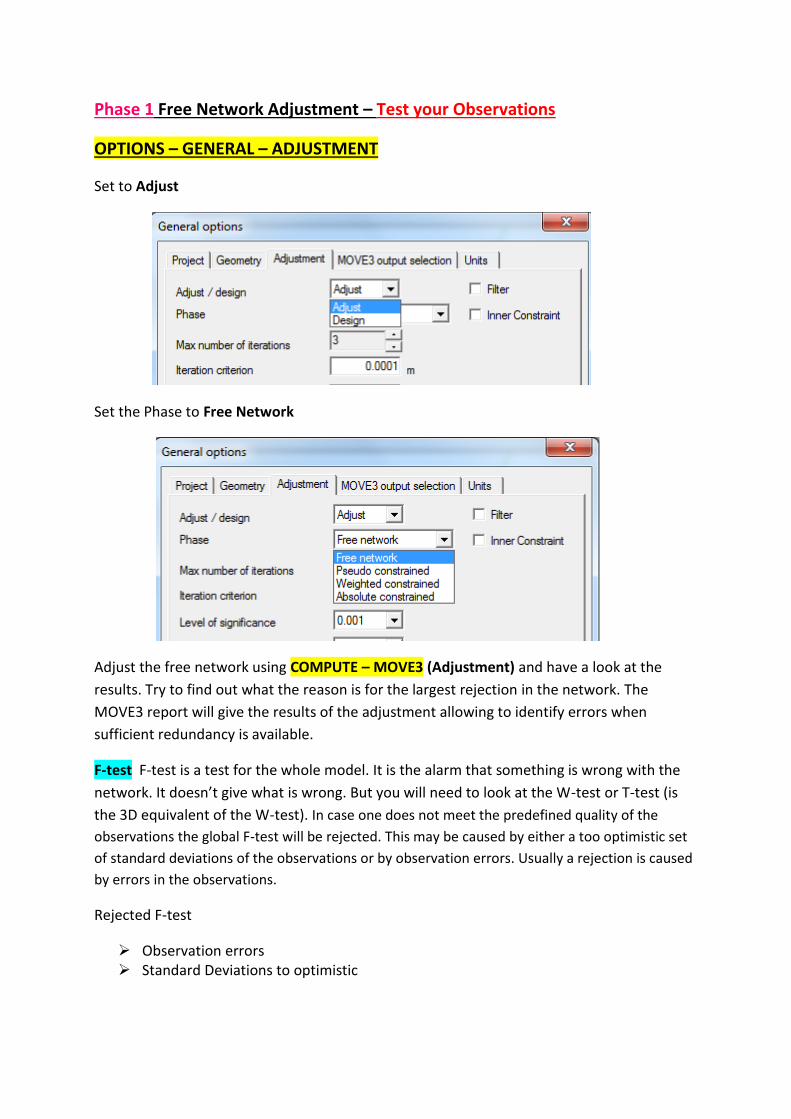
Phase 1 Free Network Adjustment – Test your Observations
OPTIONS – GENERAL – ADJUSTMENT
Set to Adjust
Set the Phase to Free Network
Adjust the free network using COMPUTE – MOVE3 (Adjustment) and have a look at the
results. Try to find out what the reason is for the largest rejection in the network. The
MOVE3 report will give the results of the adjustment allowing to identify errors when
sufficient redundancy is available.
F-test F-test is a test for the whole model. It is the alarm that something is wrong with the
network. It doesn’t give what is wrong. But you will need to look at the W-test or T-test (is
the 3D equivalent of the W-test). In case one does not meet the predefined quality of the
observations the global F-test will be rejected. This may be caused by either a too optimistic set
of standard deviations of the observations or by observation errors. Usually a rejection is caused
by errors in the observations.
Rejected F-test
Observation errors Standard Deviations to optimistic
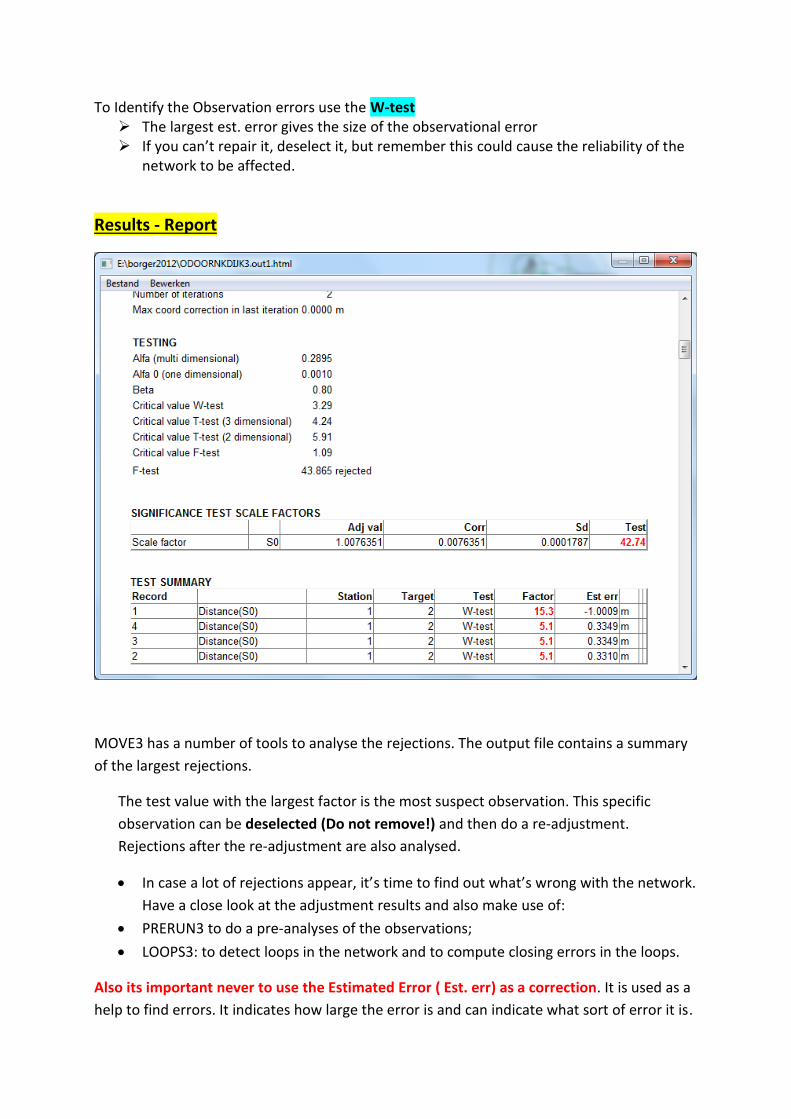
To Identify the Observation errors use the W-test The largest est. error gives the size of the observational error If you can’t repair it, deselect it, but remember this could cause the reliability of the
network to be affected.
Results - Report
MOVE3 has a number of tools to analyse the rejections. The output file contains a summary
of the largest rejections.
The test value with the largest factor is the most suspect observation. This specific
observation can be deselected (Do not remove!) and then do a re-adjustment.
Rejections after the re-adjustment are also analysed.
In case a lot of rejections appear, it’s time to find out what’s wrong with the network.
Have a close look at the adjustment results and also make use of:
PRERUN3 to do a pre-analyses of the observations;
LOOPS3: to detect loops in the network and to compute closing errors in the loops.
Also its important never to use the Estimated Error ( Est. err) as a correction. It is used as a
help to find errors. It indicates how large the error is and can indicate what sort of error it is.
If a very large error- the point numbers may be wrongly switched
Almost round number: error in the coding
8cm to 10cm error- correction prism
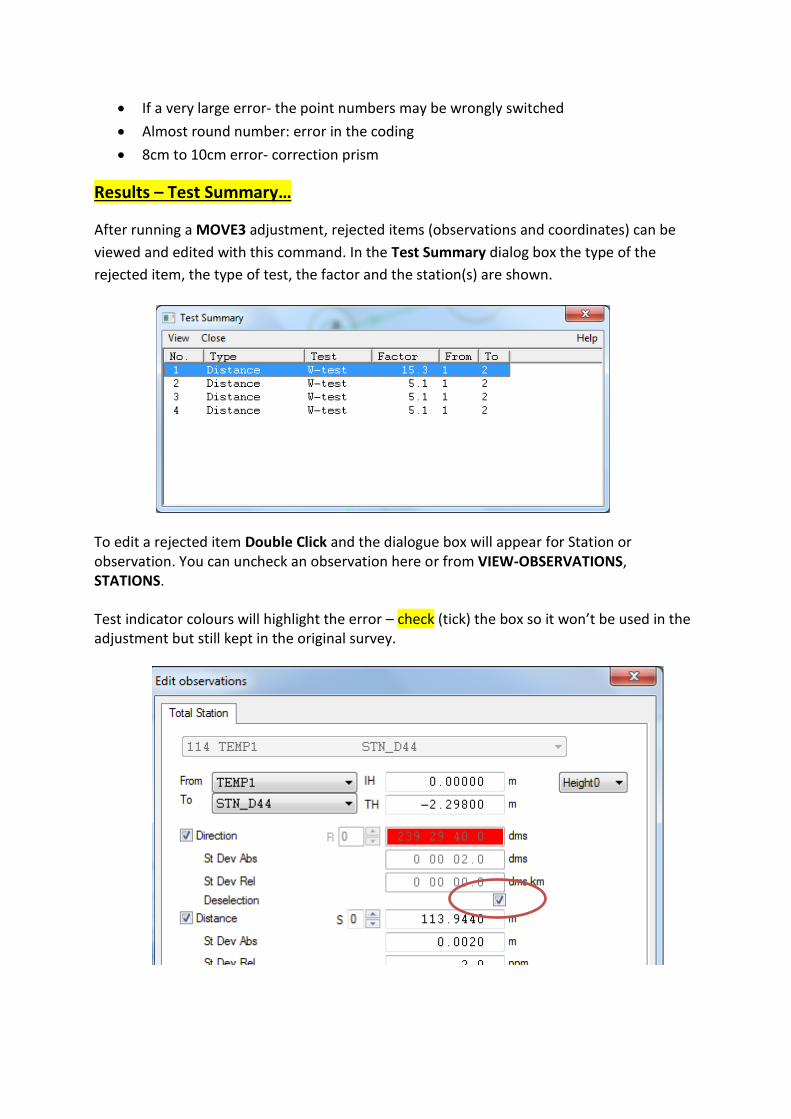
Results – Test Summary…
After running a MOVE3 adjustment, rejected items (observations and coordinates) can be
viewed and edited with this command. In the Test Summary dialog box the type of the
rejected item, the type of test, the factor and the station(s) are shown.
To edit a rejected item Double Click and the dialogue box will appear for Station or observation. You can uncheck an observation here or from VIEW-OBSERVATIONS, STATIONS.
Test indicator colours will highlight the error – check (tick) the box so it won’t be used in the adjustment but still kept in the original survey.
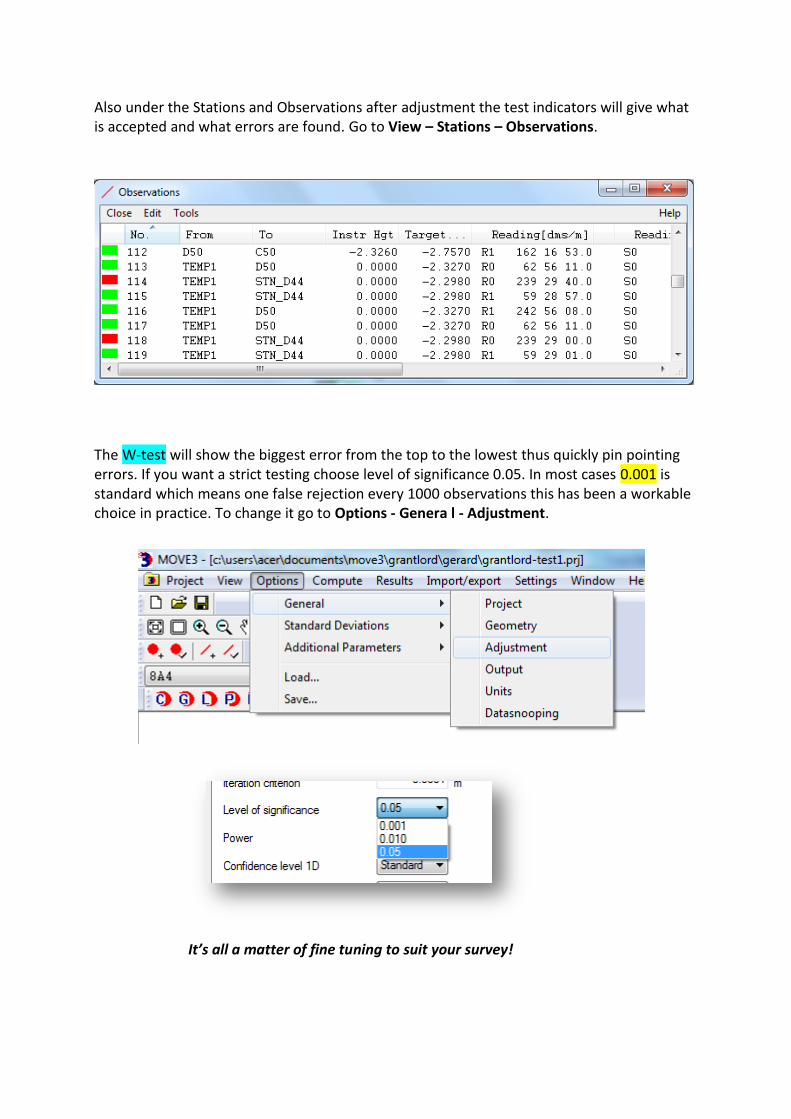
Also under the Stations and Observations after adjustment the test indicators will give what is accepted and what errors are found. Go to View – Stations – Observations.
The W-test will show the biggest error from the top to the lowest thus quickly pin pointing errors. If you want a strict testing choose level of significance 0.05. In most cases 0.001 is standard which means one false rejection every 1000 observations this has been a workable choice in practice. To change it go to Options - Genera l - Adjustment.
It’s all a matter of fine tuning to suit your survey!
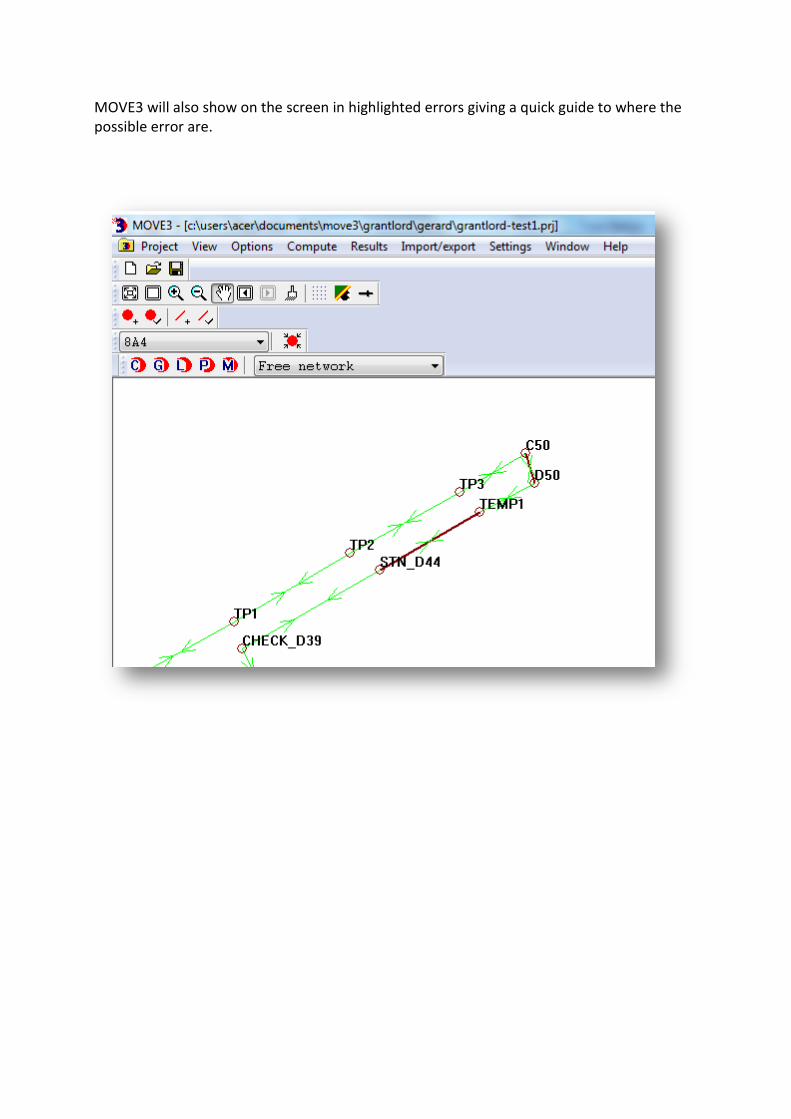
MOVE3 will also show on the screen in highlighted errors giving a quick guide to where the possible error are.
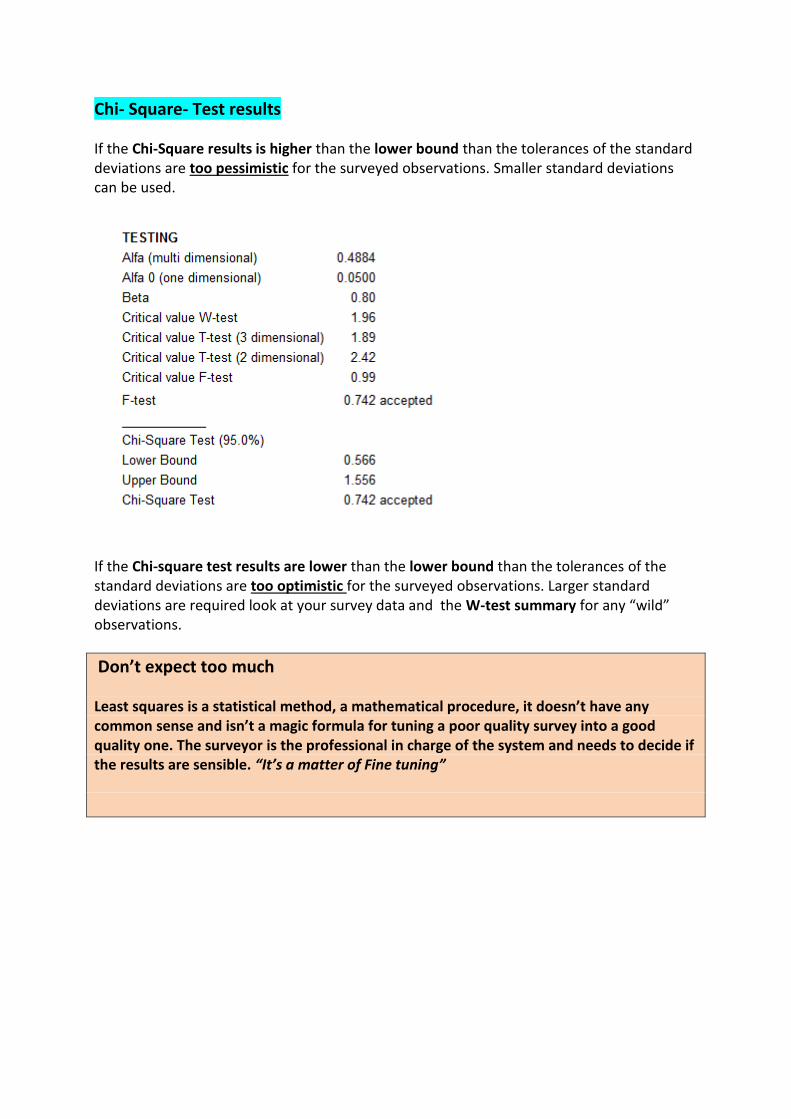
Chi- Square- Test results
If the Chi-Square results is higher than the lower bound than the tolerances of the standard deviations are too pessimistic for the surveyed observations. Smaller standard deviations can be used.
If the Chi-square test results are lower than the lower bound than the tolerances of the standard deviations are too optimistic for the surveyed observations. Larger standard deviations are required look at your survey data and the W-test summary for any “wild” observations.
Don’t expect too much
Least squares is a statistical method, a mathematical procedure, it doesn’t have any common sense and isn’t a magic formula for tuning a poor quality survey into a good quality one. The surveyor is the professional in charge of the system and needs to decide if the results are sensible. “It’s a matter of Fine tuning”
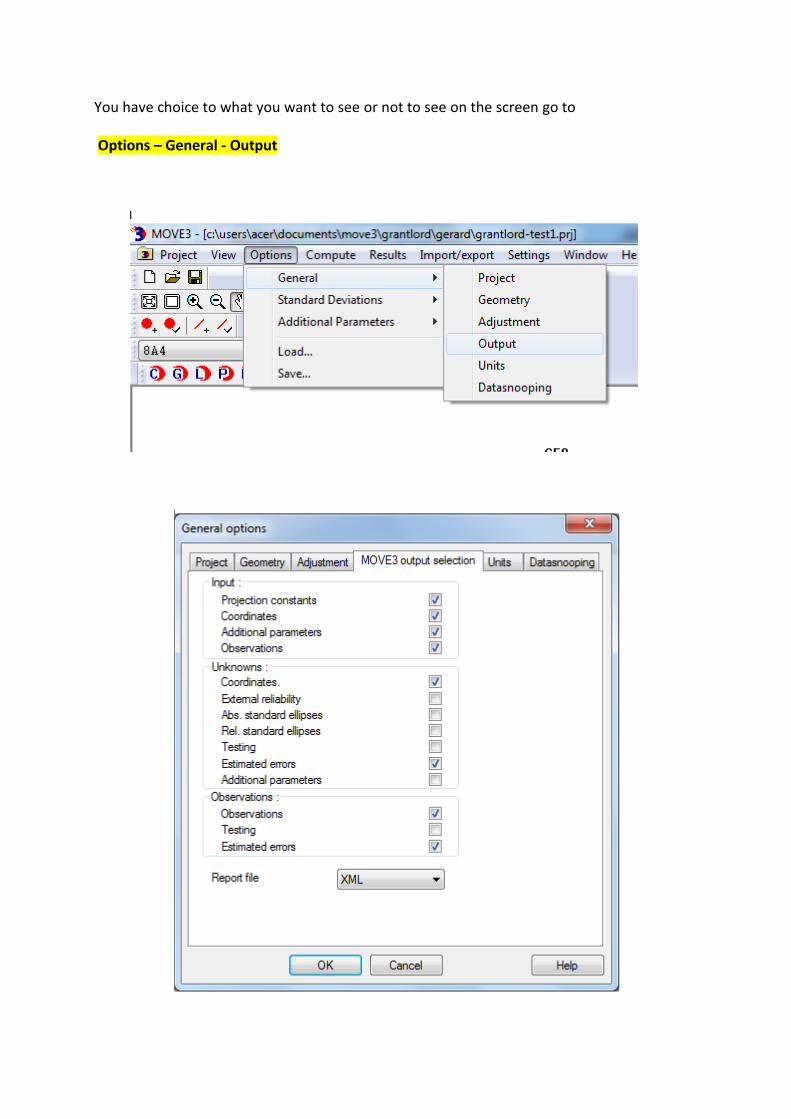
You have choice to what you want to see or not to see on the screen go to
Options – General - Output
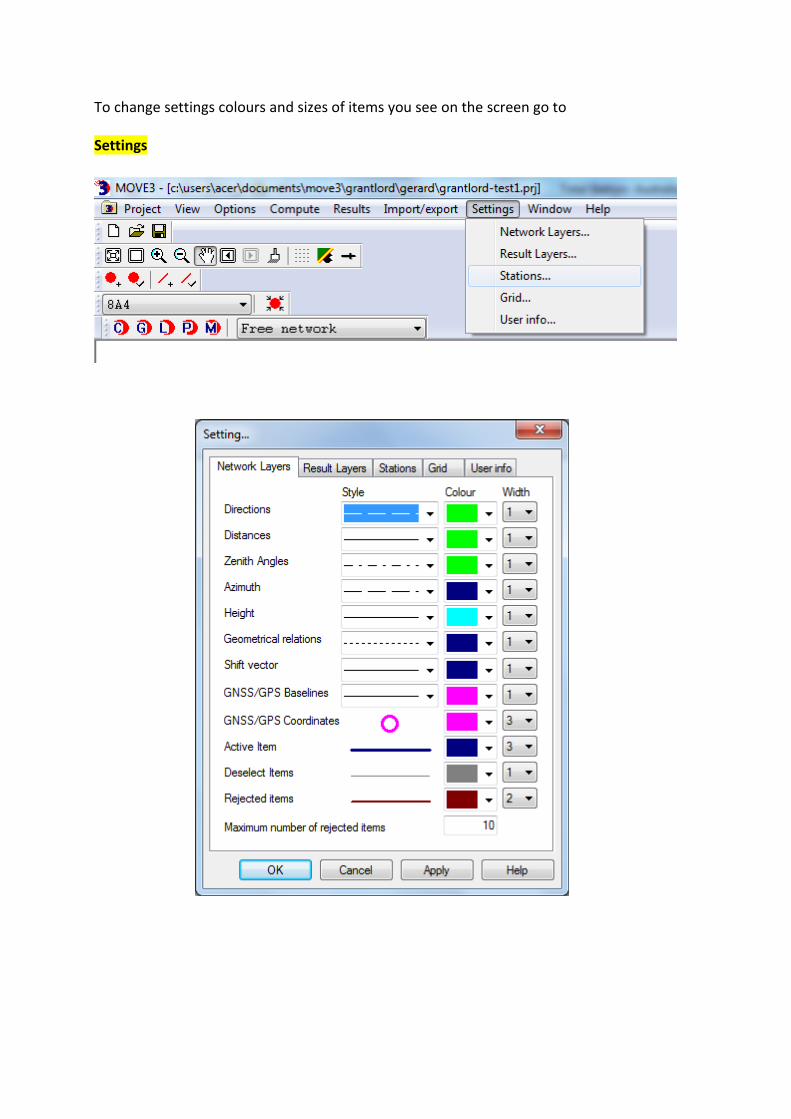
To change settings colours and sizes of items you see on the screen go to
Settings
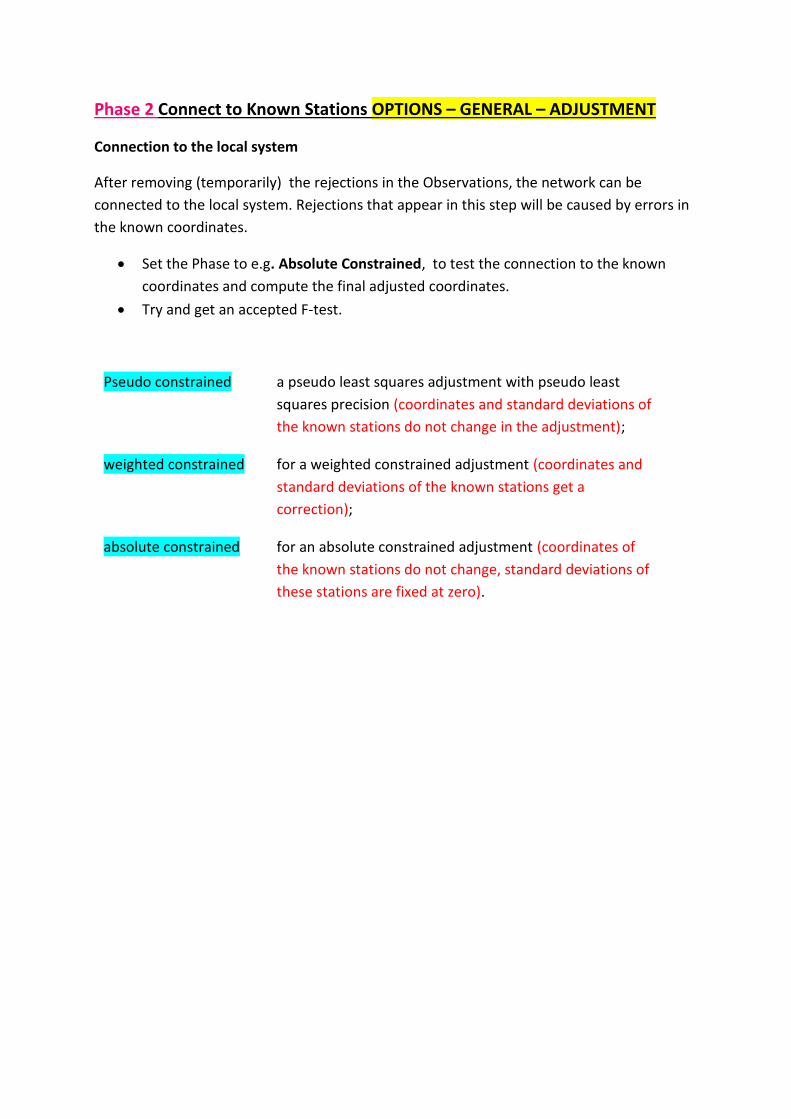
Phase 2 Connect to Known Stations OPTIONS – GENERAL – ADJUSTMENT
Connection to the local system
After removing (temporarily) the rejections in the Observations, the network can be
connected to the local system. Rejections that appear in this step will be caused by errors in
the known coordinates.
Set the Phase to e.g. Absolute Constrained, to test the connection to the known
coordinates and compute the final adjusted coordinates.
Try and get an accepted F-test.
Pseudo constrained a pseudo least squares adjustment with pseudo least
squares precision (coordinates and standard deviations of
the known stations do not change in the adjustment);
weighted constrained for a weighted constrained adjustment (coordinates and
standard deviations of the known stations get a
correction);
absolute constrained for an absolute constrained adjustment (coordinates of
the known stations do not change, standard deviations of
these stations are fixed at zero).
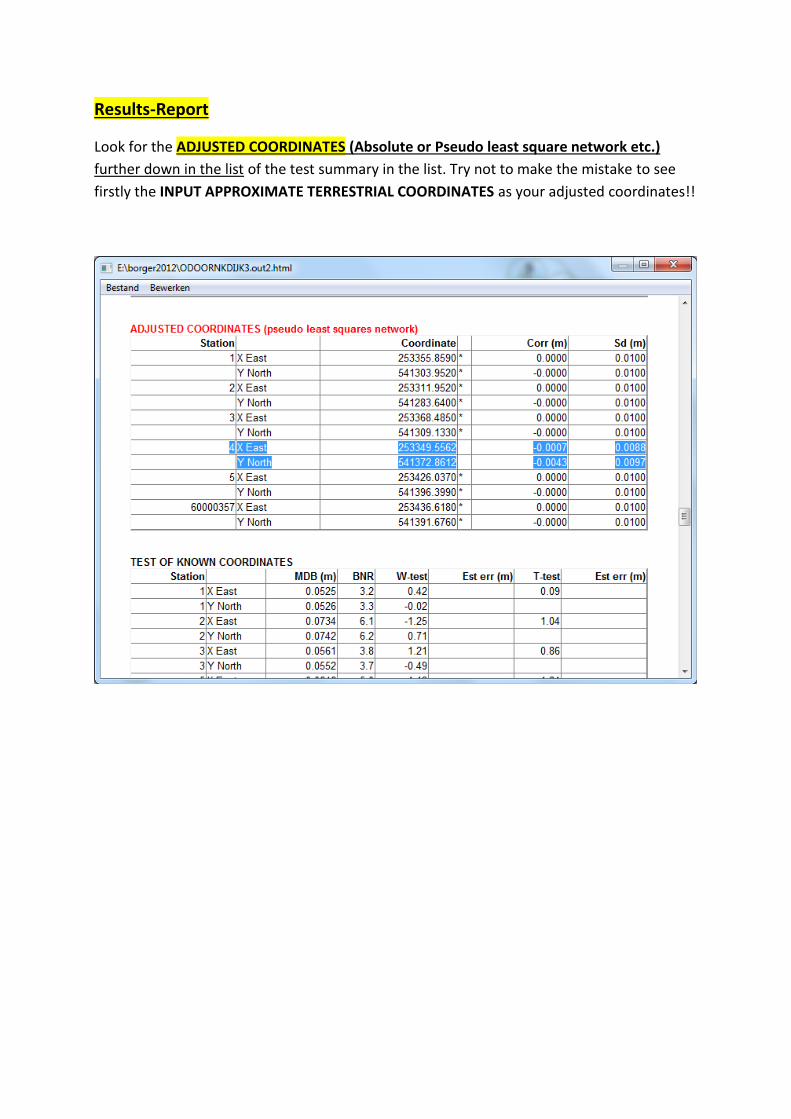
Results-Report
Look for the ADJUSTED COORDINATES (Absolute or Pseudo least square network etc.)
further down in the list of the test summary in the list. Try not to make the mistake to see
firstly the INPUT APPROXIMATE TERRESTRIAL COORDINATES as your adjusted coordinates!!
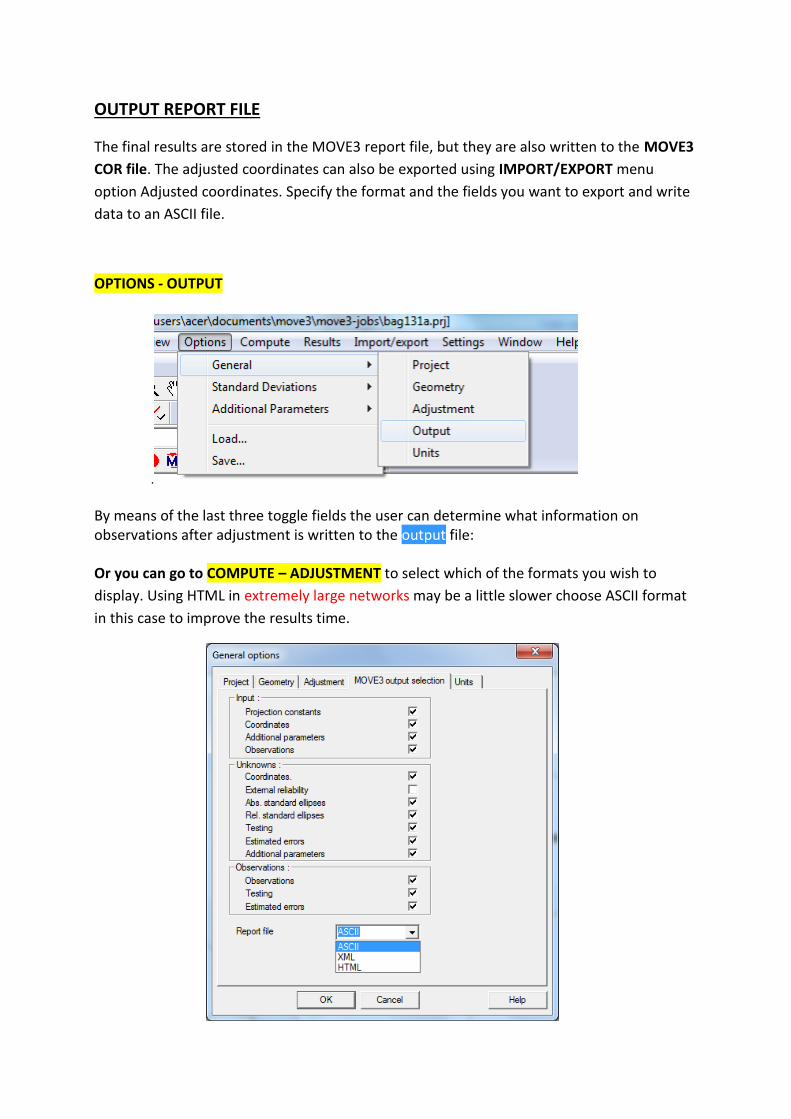
OUTPUT REPORT FILE
The final results are stored in the MOVE3 report file, but they are also written to the MOVE3
COR file. The adjusted coordinates can also be exported using IMPORT/EXPORT menu
option Adjusted coordinates. Specify the format and the fields you want to export and write
data to an ASCII file.
OPTIONS - OUTPUT
.
By means of the last three toggle fields the user can determine what information on observations after adjustment is written to the output file:
Or you can go to COMPUTE – ADJUSTMENT to select which of the formats you wish to
display. Using HTML in extremely large networks may be a little slower choose ASCII format
in this case to improve the results time.
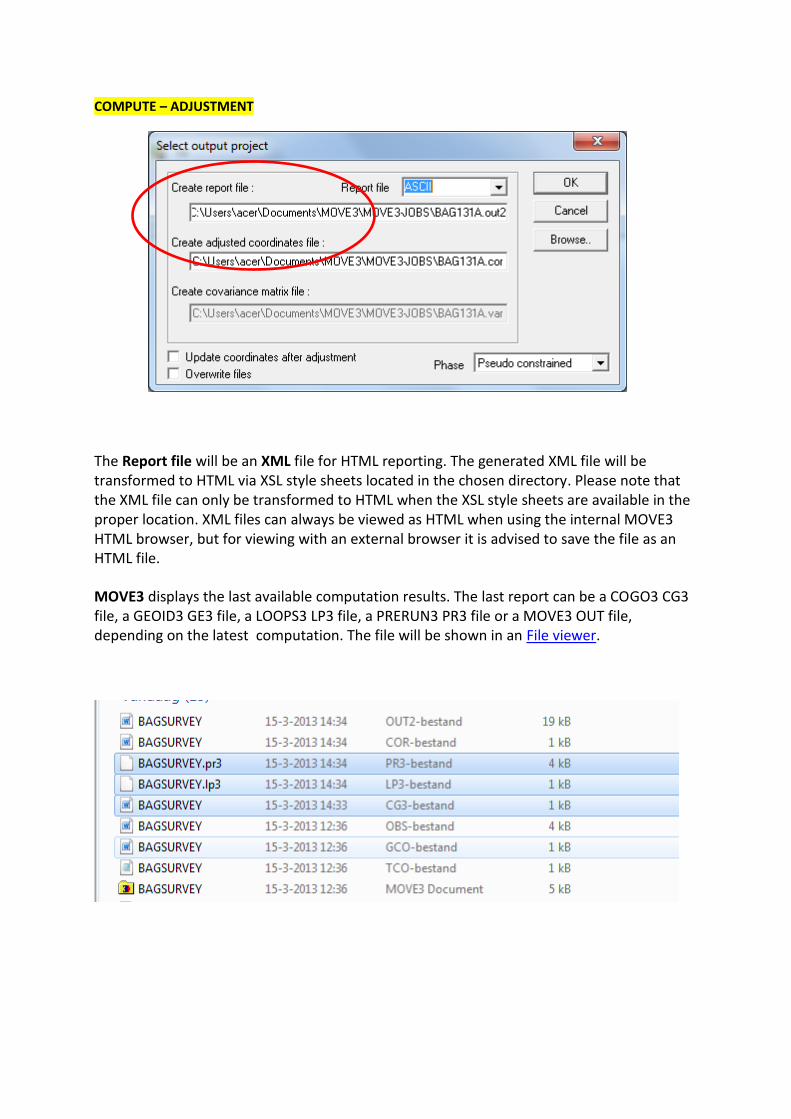
COMPUTE – ADJUSTMENT
The Report file will be an XML file for HTML reporting. The generated XML file will be transformed to HTML via XSL style sheets located in the chosen directory. Please note that the XML file can only be transformed to HTML when the XSL style sheets are available in the proper location. XML files can always be viewed as HTML when using the internal MOVE3 HTML browser, but for viewing with an external browser it is advised to save the file as an HTML file.
MOVE3 displays the last available computation results. The last report can be a COGO3 CG3 file, a GEOID3 GE3 file, a LOOPS3 LP3 file, a PRERUN3 PR3 file or a MOVE3 OUT file, depending on the latest computation. The file will be shown in an File viewer.
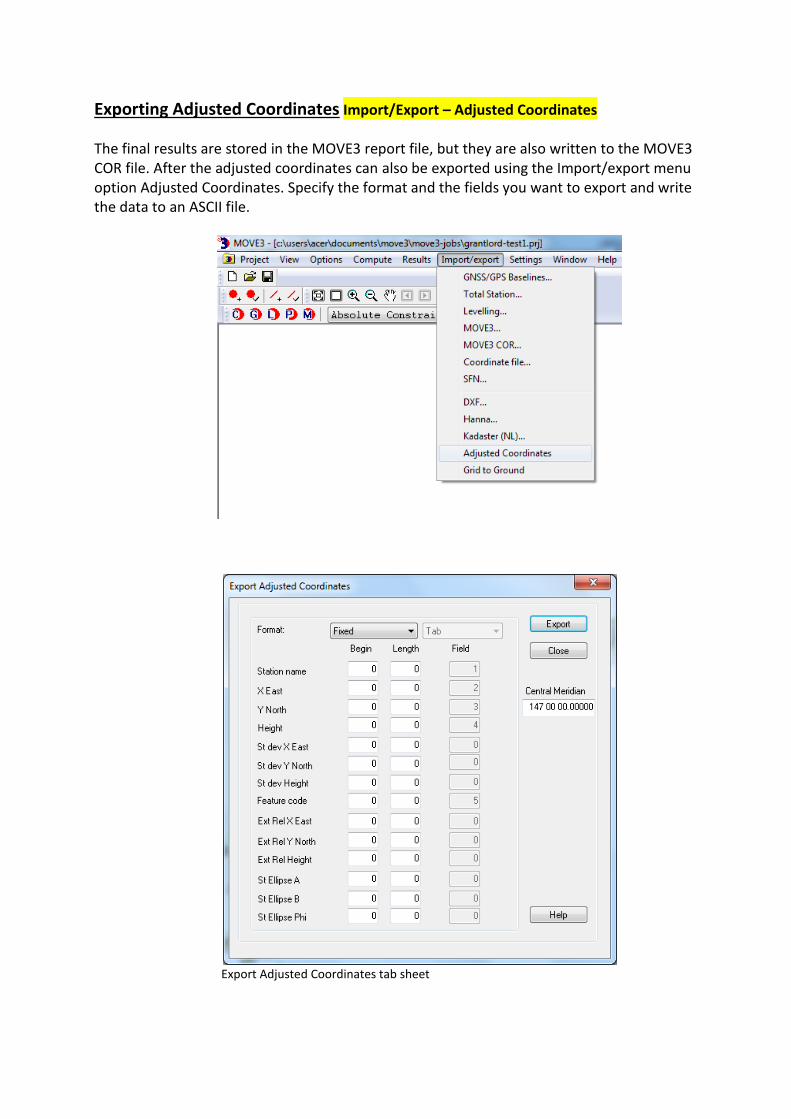
Exporting Adjusted Coordinates Import/Export – Adjusted Coordinates
The final results are stored in the MOVE3 report file, but they are also written to the MOVE3 COR file. After the adjusted coordinates can also be exported using the Import/export menu option Adjusted Coordinates. Specify the format and the fields you want to export and write the data to an ASCII file.
Export Adjusted Coordinates tab sheet
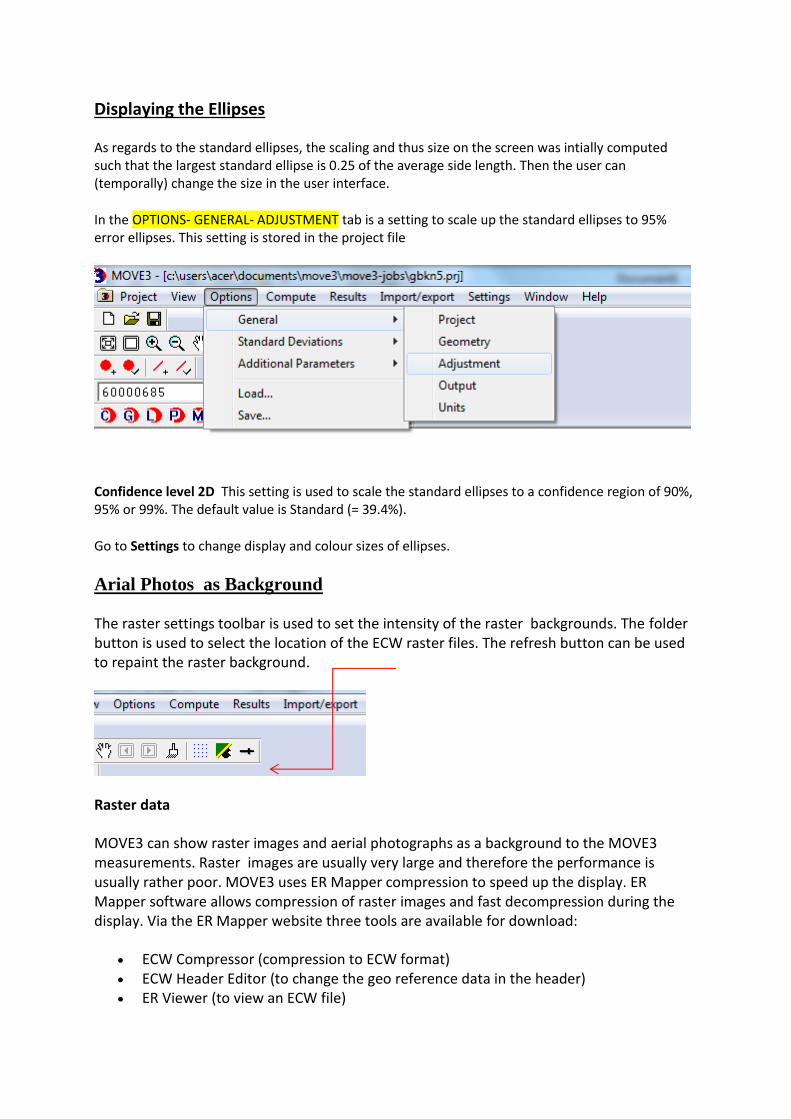
Displaying the Ellipses
As regards to the standard ellipses, the scaling and thus size on the screen was intially computed such that the largest standard ellipse is 0.25 of the average side length. Then the user can (temporally) change the size in the user interface.
In the OPTIONS- GENERAL- ADJUSTMENT tab is a setting to scale up the standard ellipses to 95% error ellipses. This setting is stored in the project file
Confidence level 2D This setting is used to scale the standard ellipses to a confidence region of 90%, 95% or 99%. The default value is Standard (= 39.4%).
Go to Settings to change display and colour sizes of ellipses.
Arial Photos as Background
The raster settings toolbar is used to set the intensity of the raster backgrounds. The folder button is used to select the location of the ECW raster files. The refresh button can be used to repaint the raster background.
Raster data
MOVE3 can show raster images and aerial photographs as a background to the MOVE3 measurements. Raster images are usually very large and therefore the performance is usually rather poor. MOVE3 uses ER Mapper compression to speed up the display. ER Mapper software allows compression of raster images and fast decompression during the display. Via the ER Mapper website three tools are available for download:
ECW Compressor (compression to ECW format) ECW Header Editor (to change the geo reference data in the header) ER Viewer (to view an ECW file)
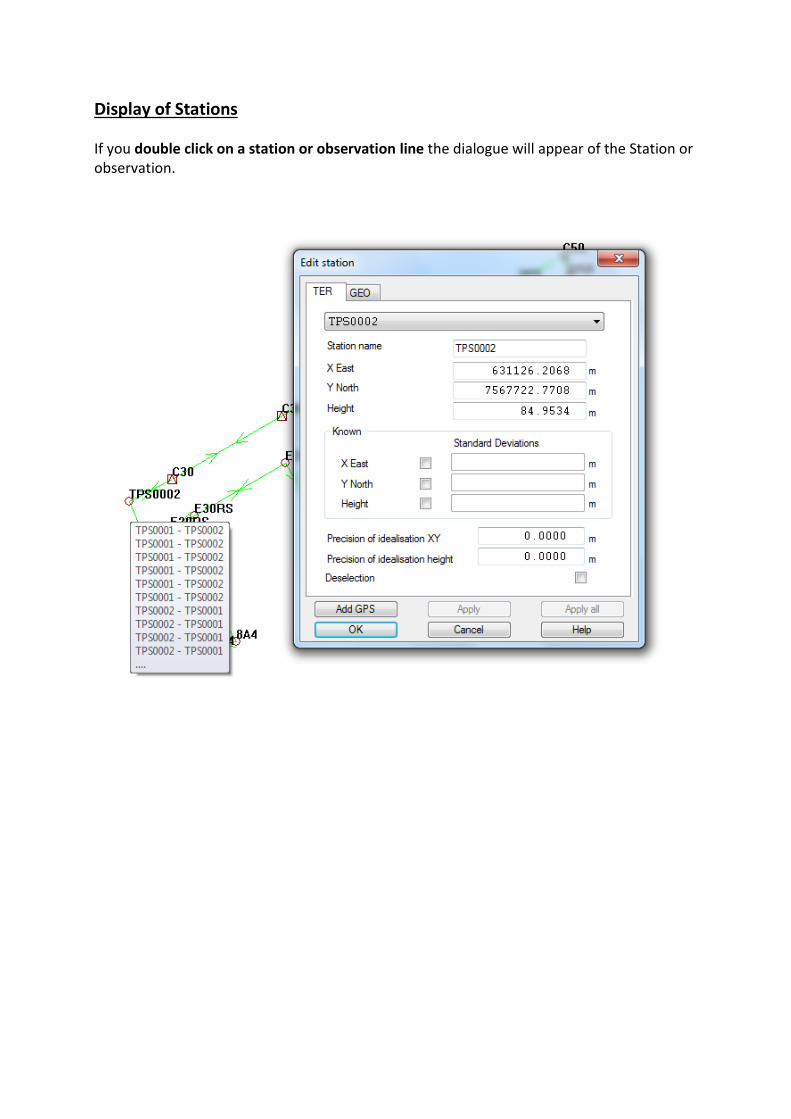
Display of Stations
If you double click on a station or observation line the dialogue will appear of the Station or observation.
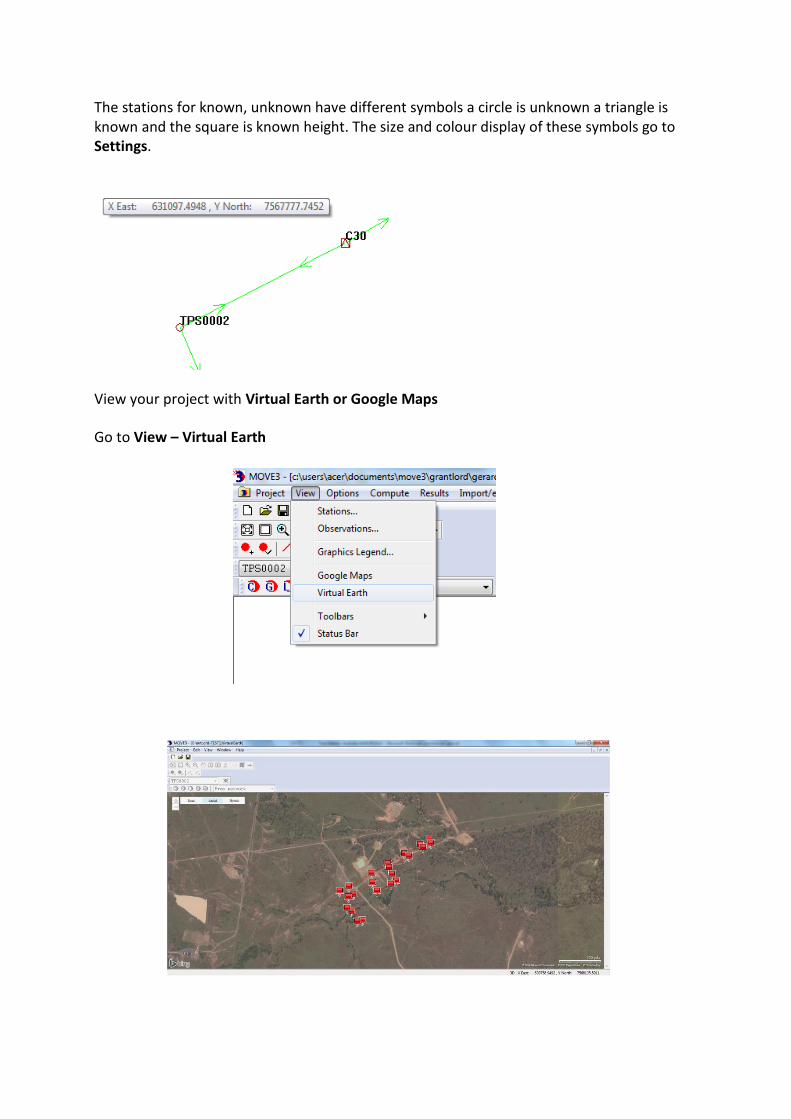
The stations for known, unknown have different symbols a circle is unknown a triangle is known and the square is known height. The size and colour display of these symbols go to Settings.
View your project with Virtual Earth or Google Maps
Go to View – Virtual Earth
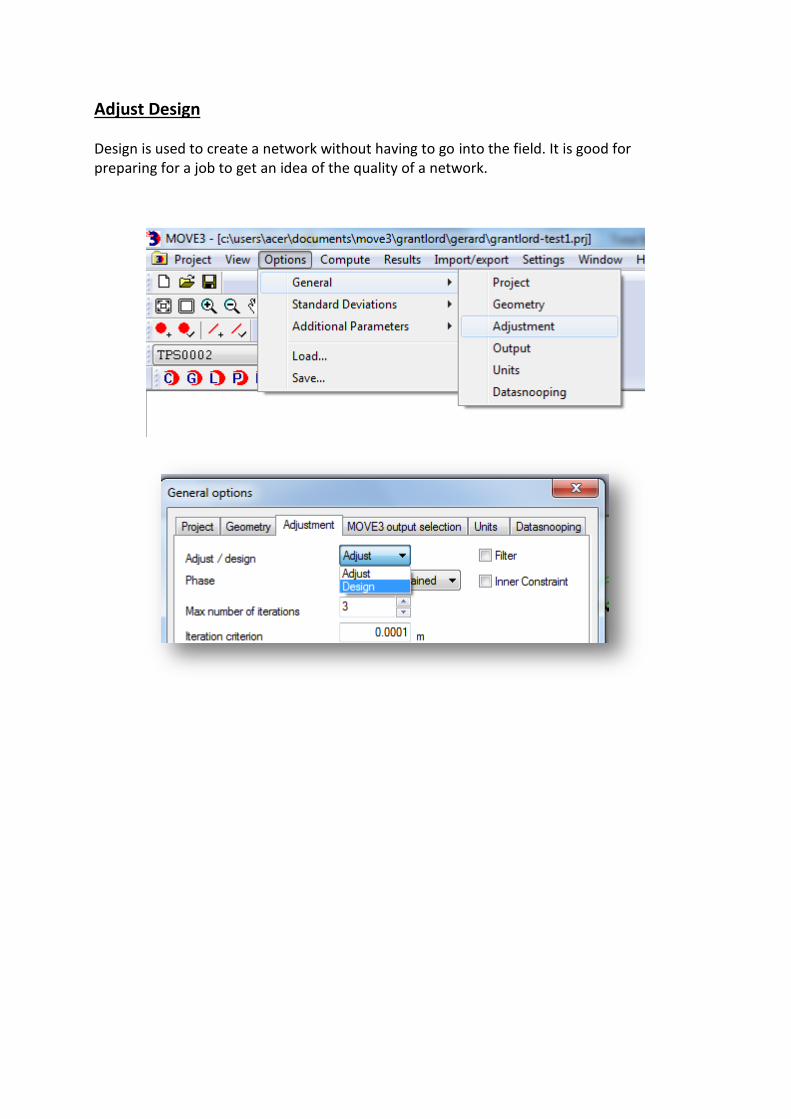
Adjust Design
Design is used to create a network without having to go into the field. It is good for preparing for a job to get an idea of the quality of a network.
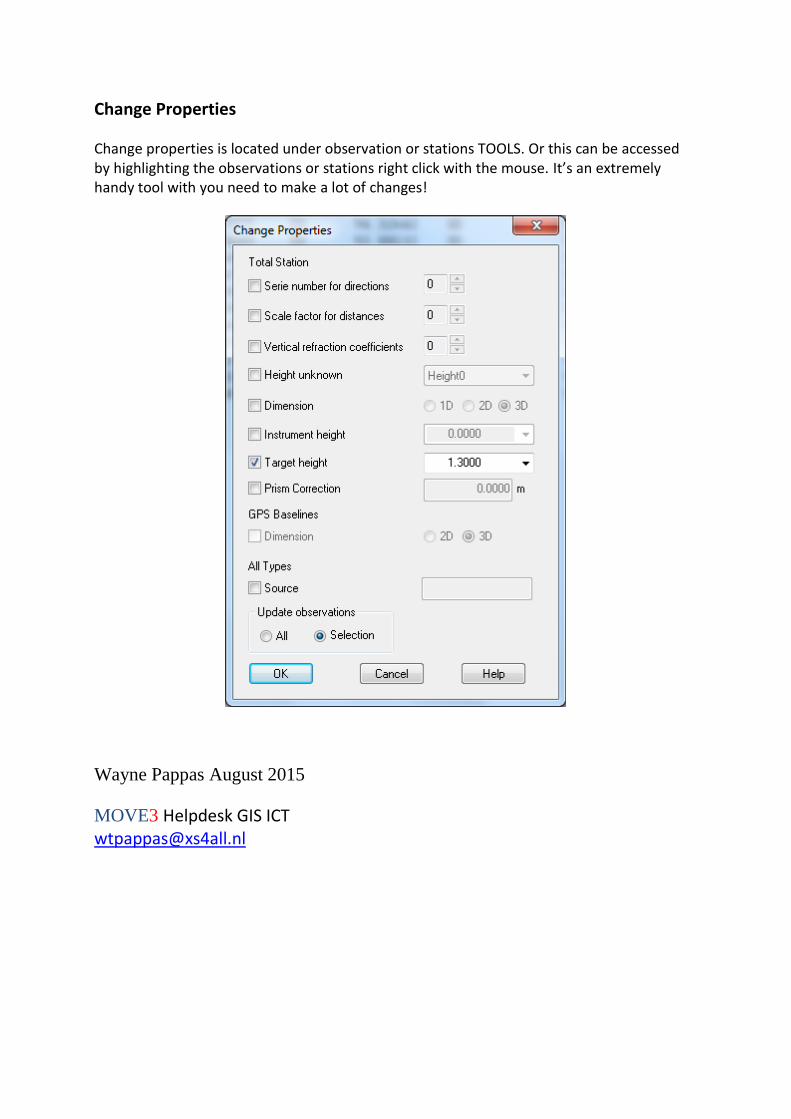
Change Properties
Change properties is located under observation or stations TOOLS. Or this can be accessed by highlighting the observations or stations right click with the mouse. It’s an extremely handy tool with you need to make a lot of changes!
Wayne Pappas August 2015
MOVE3 Helpdesk GIS ICT [email protected]


