31
ROGUE WAVE SOFTWARE / 5500 FLATIRON PARKWAY, SUITE 200 / BOULDER, CO 80301, USA / WWW.ROGUEWAVE.COM TOTALVIEW ® FOR HPC QUICK VIEW
ROGUE WAVE SOFTWARE / 5500 FLATIRON PARKWAY, SUITE 200 / BOULDER, CO 80301, USA / WWW.ROGUEWAVE.COM
TOTALVIEW® FOR HPC QUICK VIEW
Rogue Wave Software, Inc.
Product Information: (303) 473-9118 (800) 487-3217Fax: (303) 473-9137Web: http://www.roguewave.com
Use of the Documentation and implementation of any of its processes or techniques are the sole responsibility of the client, and Rogue Wave Software, Inc., assumes no responsibility and will not be liable for any errors, omissions, damage, or loss that might result from any use or mis-use of the Documentation
ROGUE WAVE SOFTWARE, INC., MAKES NO REPRESENTATION ABOUT THE SUITABILITY OF THE DOCUMENTA-TION. THE DOCUMENTATION IS PROVIDED "AS IS" WITHOUT WARRANTY OF ANY KIND. ROGUE WAVE SOFTWARE, INC., HEREBY DISCLAIMS ALL WARRANTIES AND CONDITIONS WITH REGARD TO THE DOCUMEN-TATION, WHETHER EXPRESS, IMPLIED, STATUTORY, OR OTHERWISE, INCLUDING WITHOUT LIMITATION ANY IMPLIED WARRANTIES OF MERCHANTABILITY, FITNESS FOR A PARTICULAR PURPOSE, OR NONINFRINGE-MENT. IN NO EVENT SHALL ROGUE WAVE SOFTWARE, INC., BE LIABLE, WHETHER IN CONTRACT, TORT, OR OTHERWISE, FOR ANY SPECIAL, CONSEQUENTIAL, INDIRECT, PUNITIVE, OR EXEMPLARY DAMAGES IN CON-NECTION WITH THE USE OF THE DOCUMENTATION.
The Documentation is subject to change at any time without notice.
ACKNOWLEDGMENTS
ROGUEWAVE.COM
Copyright © 2010-2017 by Rogue Wave Software, Inc. All rights reserved.Copyright © 2007-2009 by TotalView Technologies, LLCCopyright © 1998–2007 by Etnus LLC. All rights reserved.Copyright © 1996–1998 by Dolphin Interconnect Solutions, Inc.Copyright © 1993–1996 by BBN Systems and Technologies, a division of BBN Corporation.
No part of this publication may be reproduced, stored in a retrieval system, or transmitted, in any form or by any means, electronic, mechanical, photocopying, recording, or otherwise without the prior written permission of Rogue Wave Software, Inc. (“Rogue Wave”).
Use, duplication, or disclosure by the Government is subject to restrictions as set forth in subparagraph (c)(1)(ii) of the Rights in Technical Data and Computer Software clause at DFARS 252.227-7013.
Rogue Wave has prepared this manual for the exclusive use of its customers, personnel, and licensees. The information in this manual is subject to change without notice, and should not be construed as a commitment by Rogue Wave. Rogue Wave assumes no responsibility for any errors that appear in this document.
TotalView and TotalView Technologies are registered trademarks of Rogue Wave Software, Inc. TVD is a trademark of Rogue Wave.
Rogue Wave uses a modified version of the Microline widget library. Under the terms of its license, you are entitled to use these modifications. The source code is available at:http://www.roguewave.com/support/knowledge-base.aspx.
All other brand names are the trademarks of their respective holders.
TotalView® Quick View 1
TotalView® Quick View
This booklet provides a brief overview of the TotalView for HPC family of products: TotalView source code debugger, MemoryScape memory debugger, and ReplayEngine, TotalView’s add-on reverse debugger.
NOTE >> This document describes the TotalView for HPC traditional interface. For detail on using its NextGen UI first introduced with the 2016.01 release, please see the NextGen TotalView for HPC User Guide.
Downloading TotalView for HPCYou can download a fully-functional, time-limited evaluation copy of TotalView for HPC at:
http://www.roguewave.com/products-services/request-evaluation
Installing TotalView for HPCTotalView and MemoryScape are generally distributed in a tar format with an install script. Full installation documentation is provided online.
Generally speaking, you unpack the tar ball in a temporary directory and run the install script, telling it where to put the program files. The installer installs all the files necessary to run both TotalView and/or Memory-Scape and TotalView’s license server.
TotalView® Quick View / Compiling and Starting TotalView for HPC 2
If you are using a floating license configuration, the license server only needs to be installed on a single machine, which can be different from that on which TotalView will be run. Various mechanisms, including setting environ-ment variables, can be used to tell TotalView where to find the license server. See the installation document for details.
If you use TotalView in a cluster or in a client-server configuration you should install TotalView on a common file system or in a common location on all the file systems. Otherwise, you may need to customize the installation-wide configuration files.
TotalView uses a lightweight debugger server which runs out of the installation with user privileges on the com-pute nodes of a cluster or on the remote end of any remote debugging configuration.
Compiling and Starting TotalView for HPCCompile your program with the -g command-line option to its compile command. After it’s compiled, simply enter totalview alone on the command line: totalview
This launches the Sessions Manager where you can set up your debug session (Figure 1).
Alternatively, you can bypass the Sessions Manager and launch TotalView directly by providing a program name to debug:totalview program_name
Note: If your program uses a starter program, you may need to read the section "Setting Up MPI Debugging Ses-sions" in the TotalView for HPC User Guide.
TotalView® Quick View / Setting up a Debug Session 3
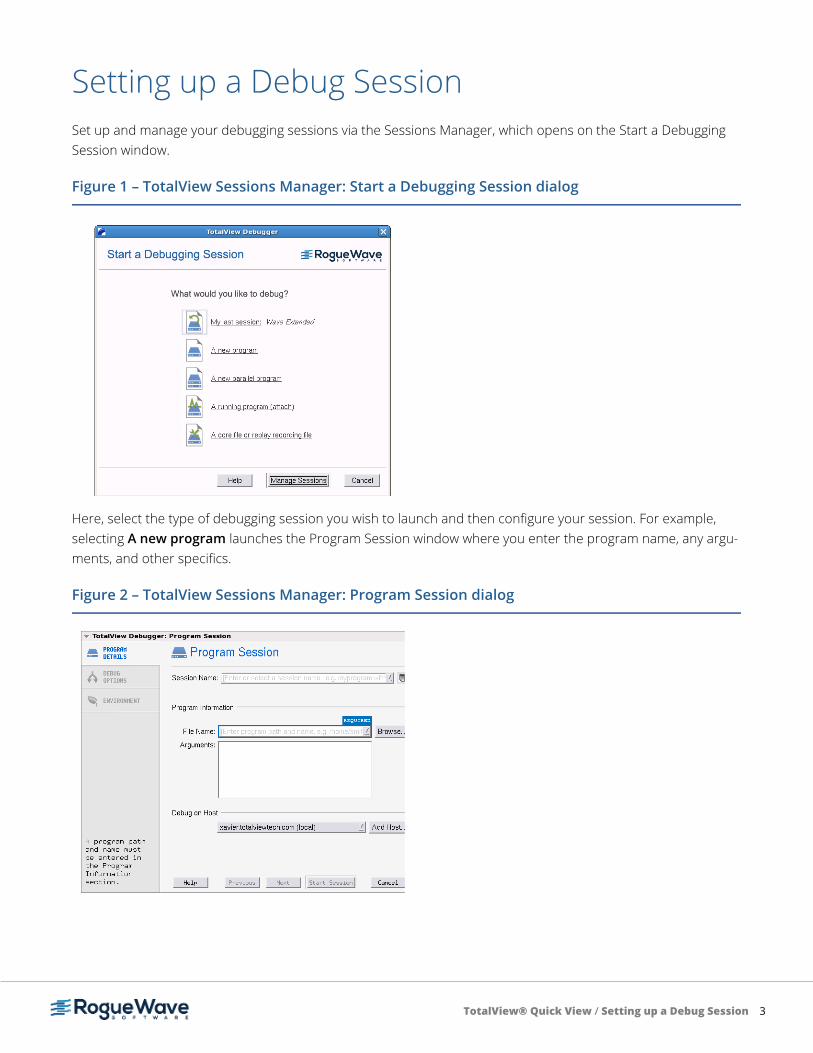
Setting up a Debug SessionSet up and manage your debugging sessions via the Sessions Manager, which opens on the Start a Debugging Session window.
Here, select the type of debugging session you wish to launch and then configure your session. For example, selecting A new program launches the Program Session window where you enter the program name, any argu-ments, and other specifics.
Figure 1 – TotalView Sessions Manager: Start a Debugging Session dialog
Figure 2 – TotalView Sessions Manager: Program Session dialog
TotalView® Quick View / Managing Debug Sessions 4
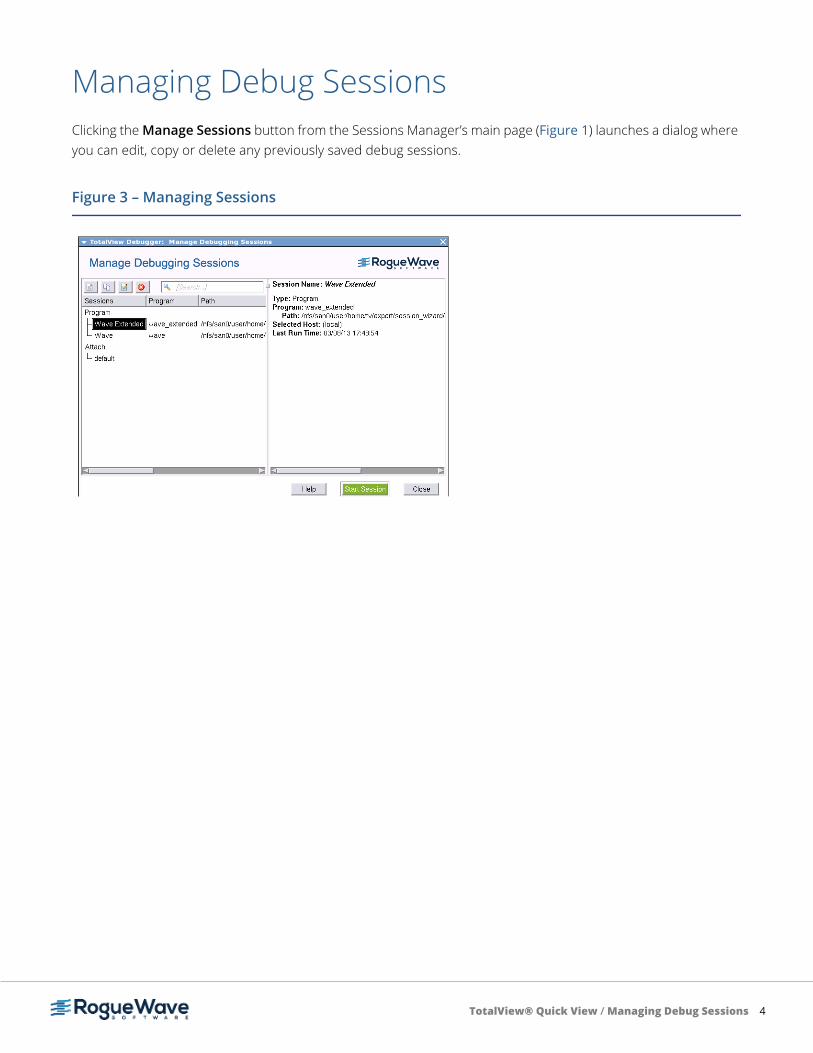
Managing Debug SessionsClicking the Manage Sessions button from the Sessions Manager’s main page (Figure 1) launches a dialog where you can edit, copy or delete any previously saved debug sessions.
Figure 3 – Managing Sessions
TotalView® Quick View / Using TotalView for HPC Windows 5
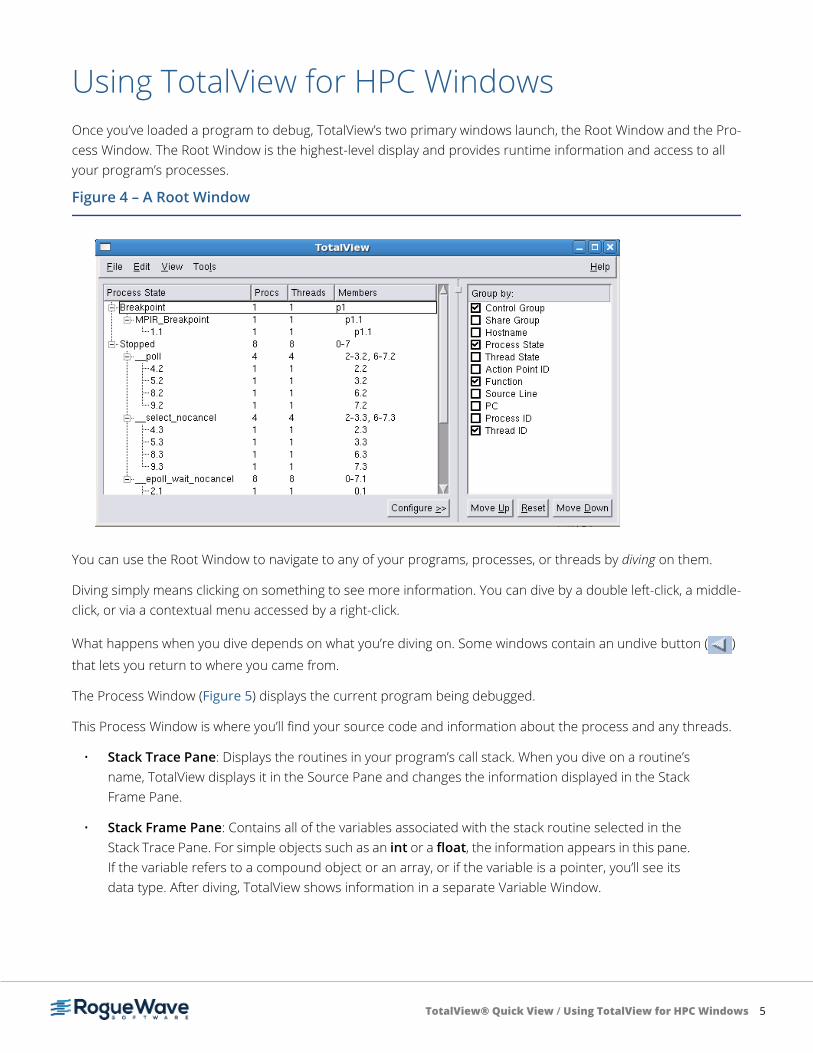
Using TotalView for HPC WindowsOnce you’ve loaded a program to debug, TotalView’s two primary windows launch, the Root Window and the Pro-cess Window. The Root Window is the highest-level display and provides runtime information and access to all your program’s processes.
You can use the Root Window to navigate to any of your programs, processes, or threads by diving on them.
Diving simply means clicking on something to see more information. You can dive by a double left-click, a middle-click, or via a contextual menu accessed by a right-click.
What happens when you dive depends on what you’re diving on. Some windows contain an undive button ( )
that lets you return to where you came from.
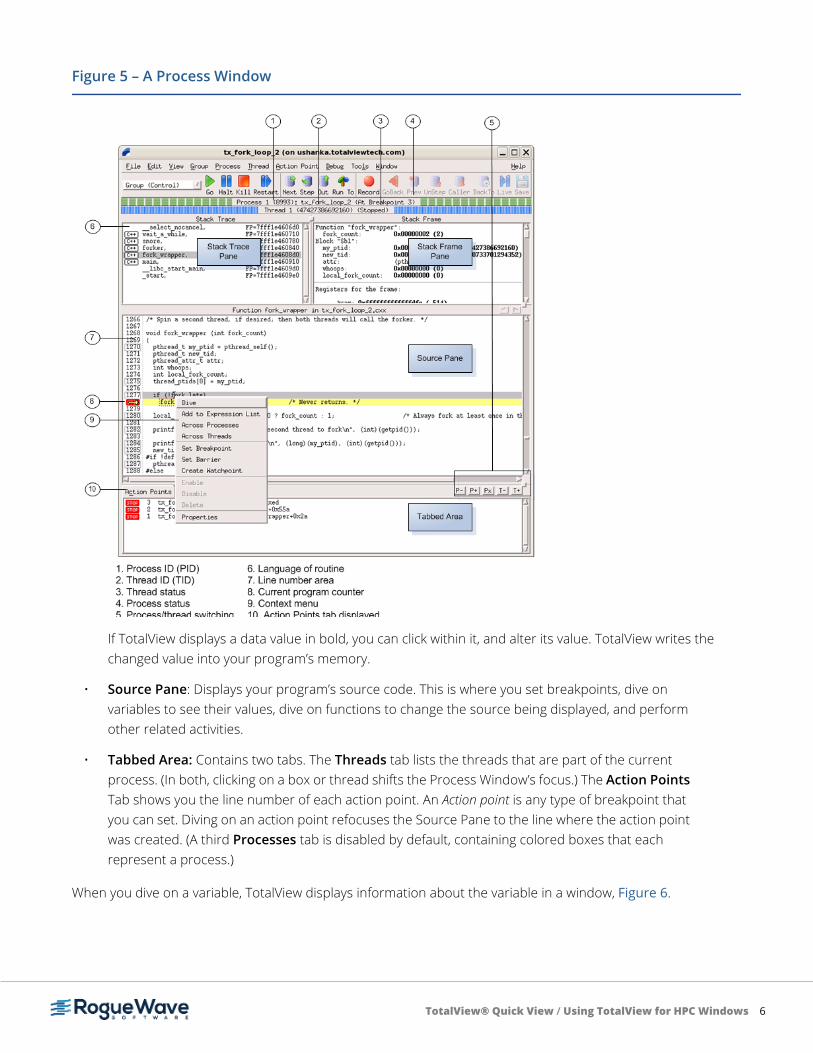
The Process Window (Figure 5) displays the current program being debugged.
This Process Window is where you’ll find your source code and information about the process and any threads.
• Stack Trace Pane: Displays the routines in your program’s call stack. When you dive on a routine’s name, TotalView displays it in the Source Pane and changes the information displayed in the Stack Frame Pane.
• Stack Frame Pane: Contains all of the variables associated with the stack routine selected in the Stack Trace Pane. For simple objects such as an int or a float, the information appears in this pane. If the variable refers to a compound object or an array, or if the variable is a pointer, you’ll see its data type. After diving, TotalView shows information in a separate Variable Window.
Figure 4 – A Root Window
TotalView® Quick View / Using TotalView for HPC Windows 6
If TotalView displays a data value in bold, you can click within it, and alter its value. TotalView writes the changed value into your program’s memory.
• Source Pane: Displays your program’s source code. This is where you set breakpoints, dive on variables to see their values, dive on functions to change the source being displayed, and perform other related activities.
• Tabbed Area: Contains two tabs. The Threads tab lists the threads that are part of the current process. (In both, clicking on a box or thread shifts the Process Window’s focus.) The Action Points Tab shows you the line number of each action point. An Action point is any type of breakpoint that you can set. Diving on an action point refocuses the Source Pane to the line where the action point was created. (A third Processes tab is disabled by default, containing colored boxes that each represent a process.)
When you dive on a variable, TotalView displays information about the variable in a window, Figure 6.
Figure 5 – A Process Window
TotalView® Quick View / Using TotalView for HPC Windows 7
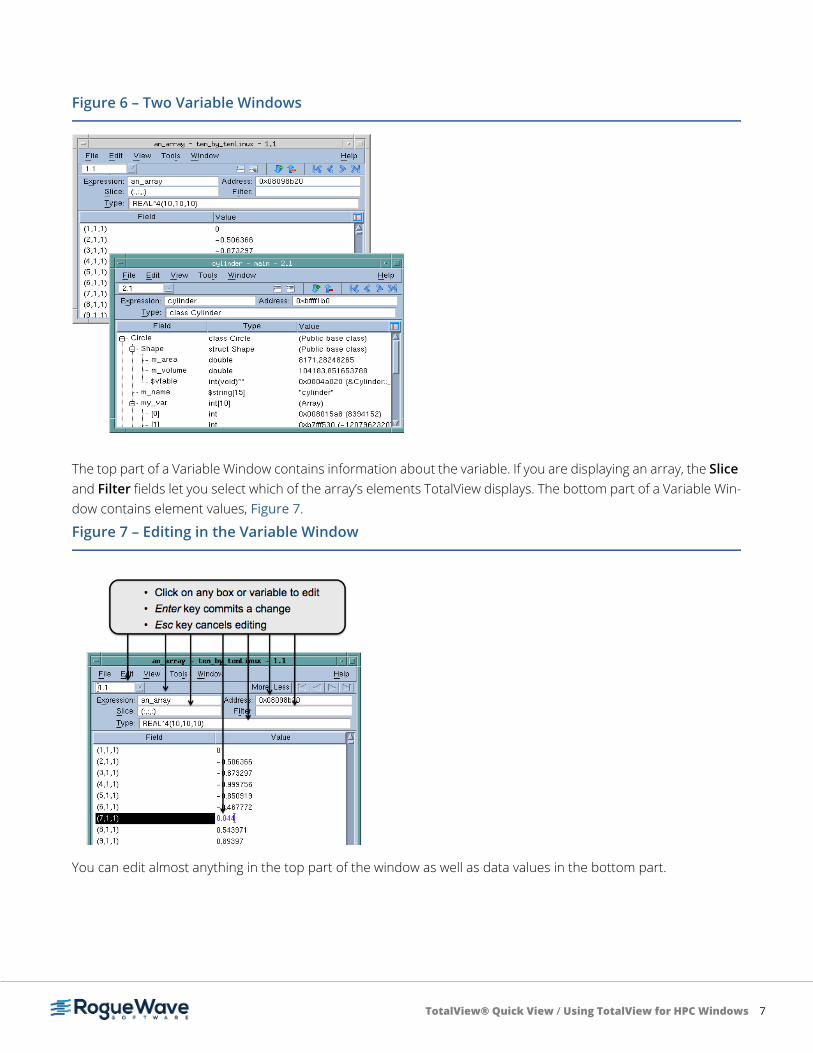
The top part of a Variable Window contains information about the variable. If you are displaying an array, the Slice and Filter fields let you select which of the array’s elements TotalView displays. The bottom part of a Variable Win-dow contains element values, Figure 7.
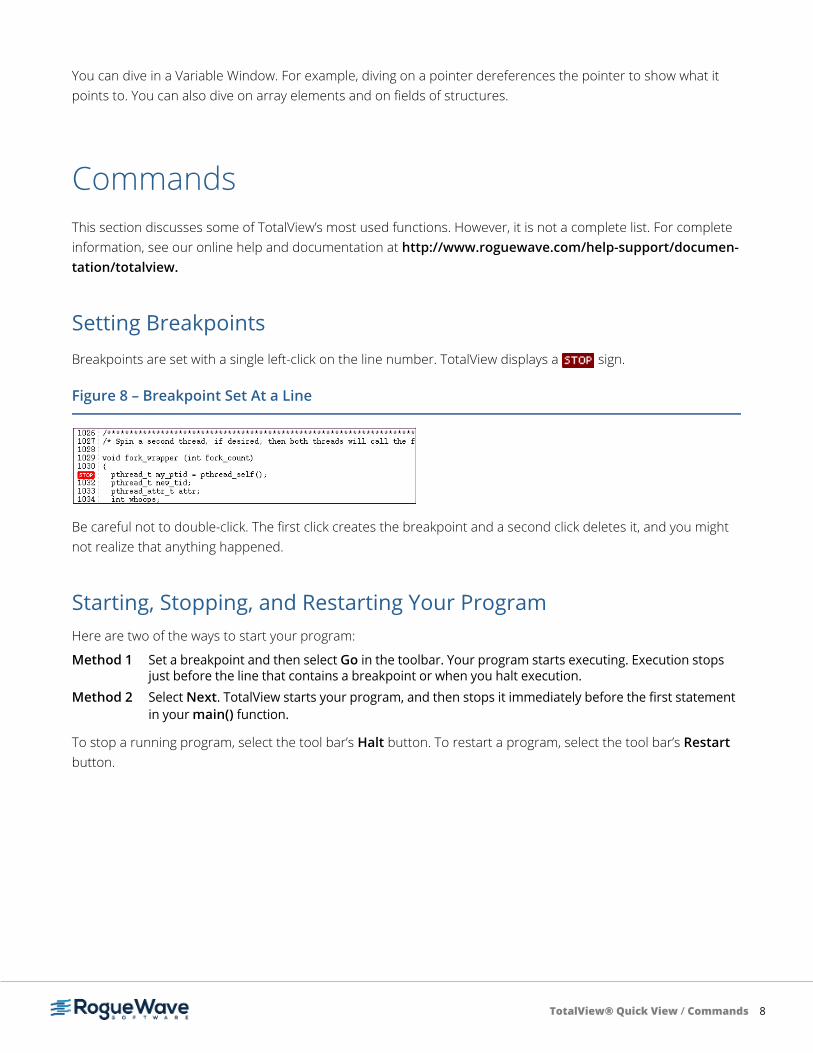
You can edit almost anything in the top part of the window as well as data values in the bottom part.
Figure 6 – Two Variable Windows
Figure 7 – Editing in the Variable Window
TotalView® Quick View / Commands 8
You can dive in a Variable Window. For example, diving on a pointer dereferences the pointer to show what it points to. You can also dive on array elements and on fields of structures.
CommandsThis section discusses some of TotalView’s most used functions. However, it is not a complete list. For complete information, see our online help and documentation at http://www.roguewave.com/help-support/documen-tation/totalview.
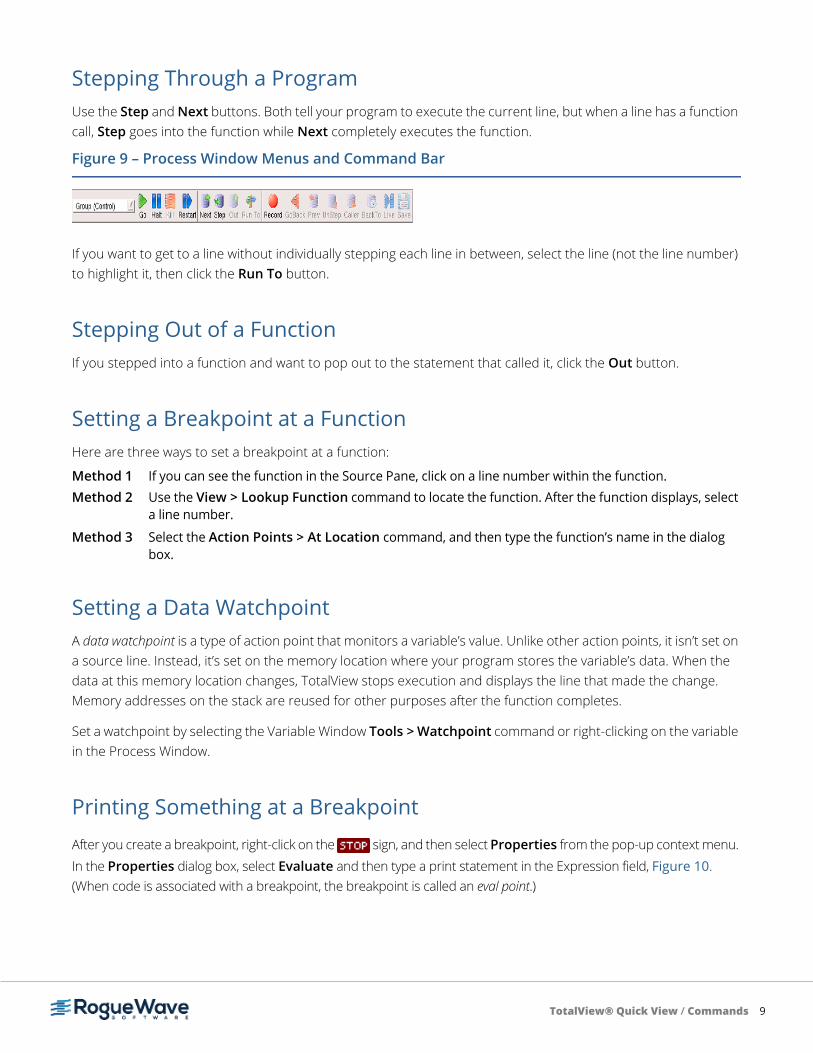
Setting BreakpointsBreakpoints are set with a single left-click on the line number. TotalView displays a sign.
Be careful not to double-click. The first click creates the breakpoint and a second click deletes it, and you might not realize that anything happened.
Starting, Stopping, and Restarting Your ProgramHere are two of the ways to start your program:
Method 1 Set a breakpoint and then select Go in the toolbar. Your program starts executing. Execution stops just before the line that contains a breakpoint or when you halt execution.
Method 2 Select Next. TotalView starts your program, and then stops it immediately before the first statement in your main() function.
To stop a running program, select the tool bar’s Halt button. To restart a program, select the tool bar’s Restart button.
Figure 8 – Breakpoint Set At a Line
TotalView® Quick View / Commands 9
Stepping Through a ProgramUse the Step and Next buttons. Both tell your program to execute the current line, but when a line has a function call, Step goes into the function while Next completely executes the function.
If you want to get to a line without individually stepping each line in between, select the line (not the line number) to highlight it, then click the Run To button.
Stepping Out of a FunctionIf you stepped into a function and want to pop out to the statement that called it, click the Out button.
Setting a Breakpoint at a FunctionHere are three ways to set a breakpoint at a function:
Method 1 If you can see the function in the Source Pane, click on a line number within the function.Method 2 Use the View > Lookup Function command to locate the function. After the function displays, select
a line number.
Method 3 Select the Action Points > At Location command, and then type the function’s name in the dialog box.
Setting a Data Watchpoint A data watchpoint is a type of action point that monitors a variable’s value. Unlike other action points, it isn’t set on a source line. Instead, it’s set on the memory location where your program stores the variable’s data. When the data at this memory location changes, TotalView stops execution and displays the line that made the change. Memory addresses on the stack are reused for other purposes after the function completes.
Set a watchpoint by selecting the Variable Window Tools > Watchpoint command or right-clicking on the variable in the Process Window.
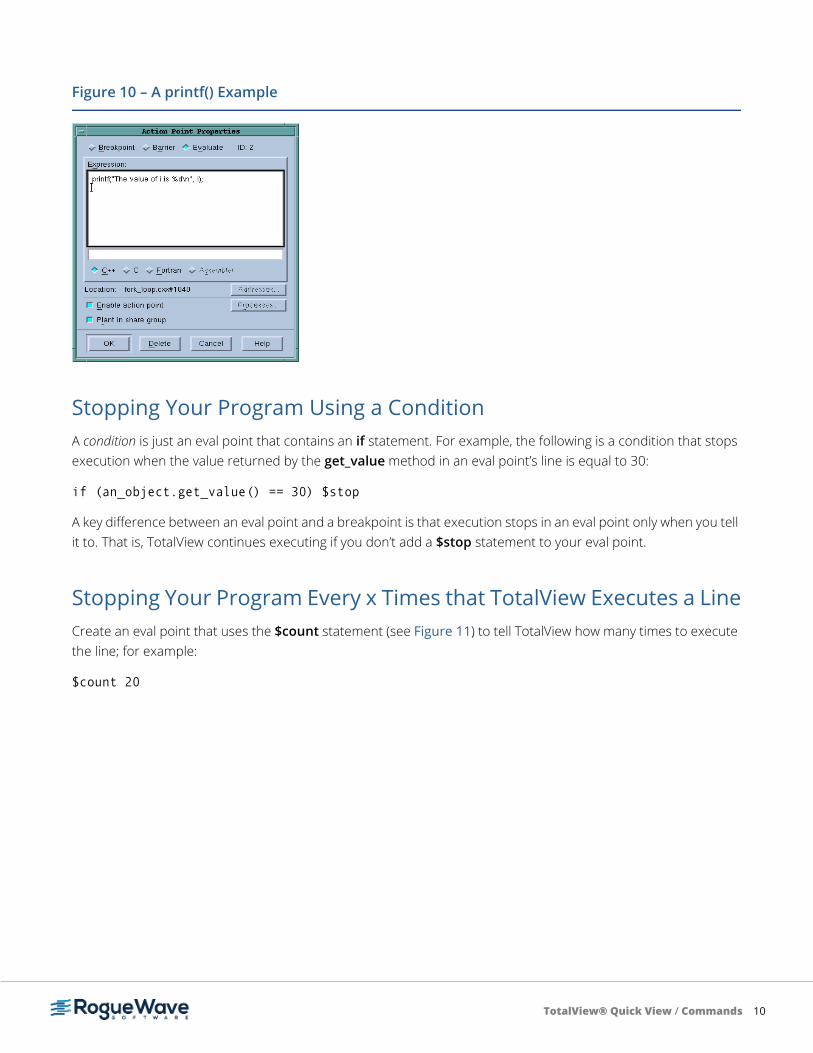
Printing Something at a BreakpointAfter you create a breakpoint, right-click on the sign, and then select Properties from the pop-up context menu. In the Properties dialog box, select Evaluate and then type a print statement in the Expression field, Figure 10. (When code is associated with a breakpoint, the breakpoint is called an eval point.)
Figure 9 – Process Window Menus and Command Bar
TotalView® Quick View / Commands 10
Stopping Your Program Using a ConditionA condition is just an eval point that contains an if statement. For example, the following is a condition that stops execution when the value returned by the get_value method in an eval point’s line is equal to 30:
if (an_object.get_value() == 30) $stop
A key difference between an eval point and a breakpoint is that execution stops in an eval point only when you tell it to. That is, TotalView continues executing if you don’t add a $stop statement to your eval point.
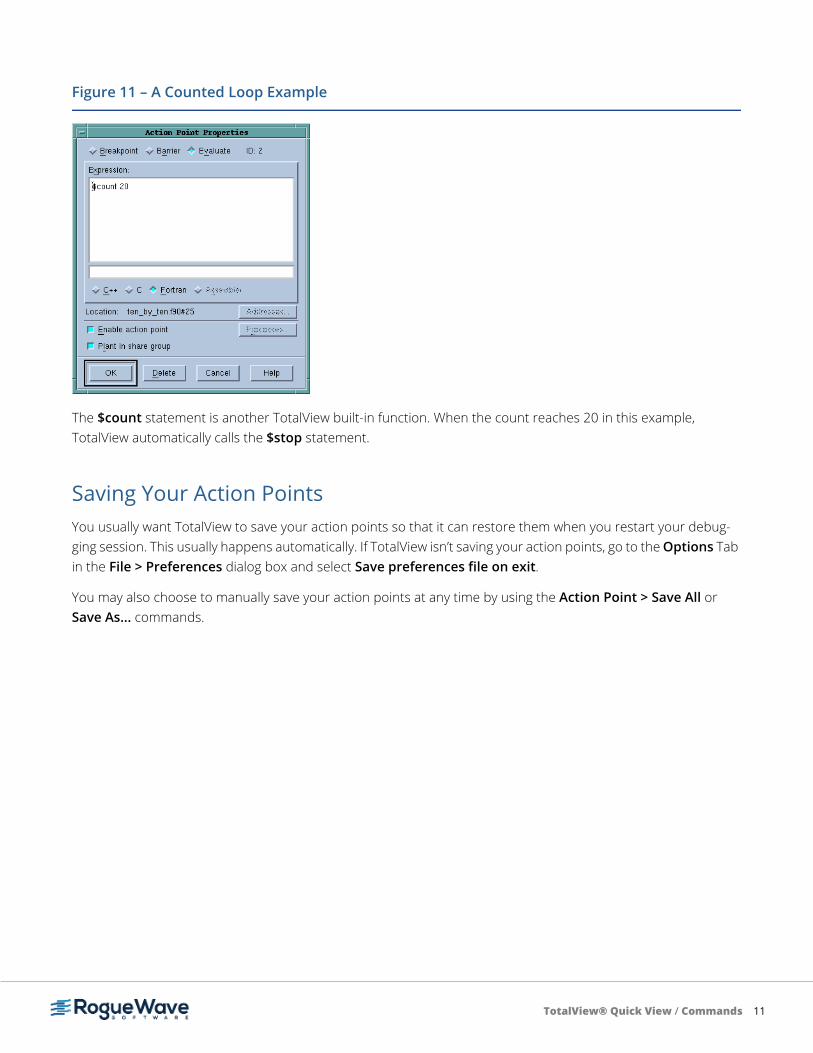
Stopping Your Program Every x Times that TotalView Executes a LineCreate an eval point that uses the $count statement (see Figure 11) to tell TotalView how many times to execute the line; for example:
$count 20
Figure 10 – A printf() Example
TotalView® Quick View / Commands 11
The $count statement is another TotalView built-in function. When the count reaches 20 in this example, TotalView automatically calls the $stop statement.
Saving Your Action Points You usually want TotalView to save your action points so that it can restore them when you restart your debug-ging session. This usually happens automatically. If TotalView isn’t saving your action points, go to the Options Tab in the File > Preferences dialog box and select Save preferences file on exit.
You may also choose to manually save your action points at any time by using the Action Point > Save All or Save As... commands.
Figure 11 – A Counted Loop Example
TotalView® Quick View / Commands 12
Viewing Another Function’s SourceHere are two ways to see a function’s source:
Method 1 Dive on the function’s name in the Source Pane. TotalView shows the function in the Source Pane.Method 2 Use the View > Lookup Function command.
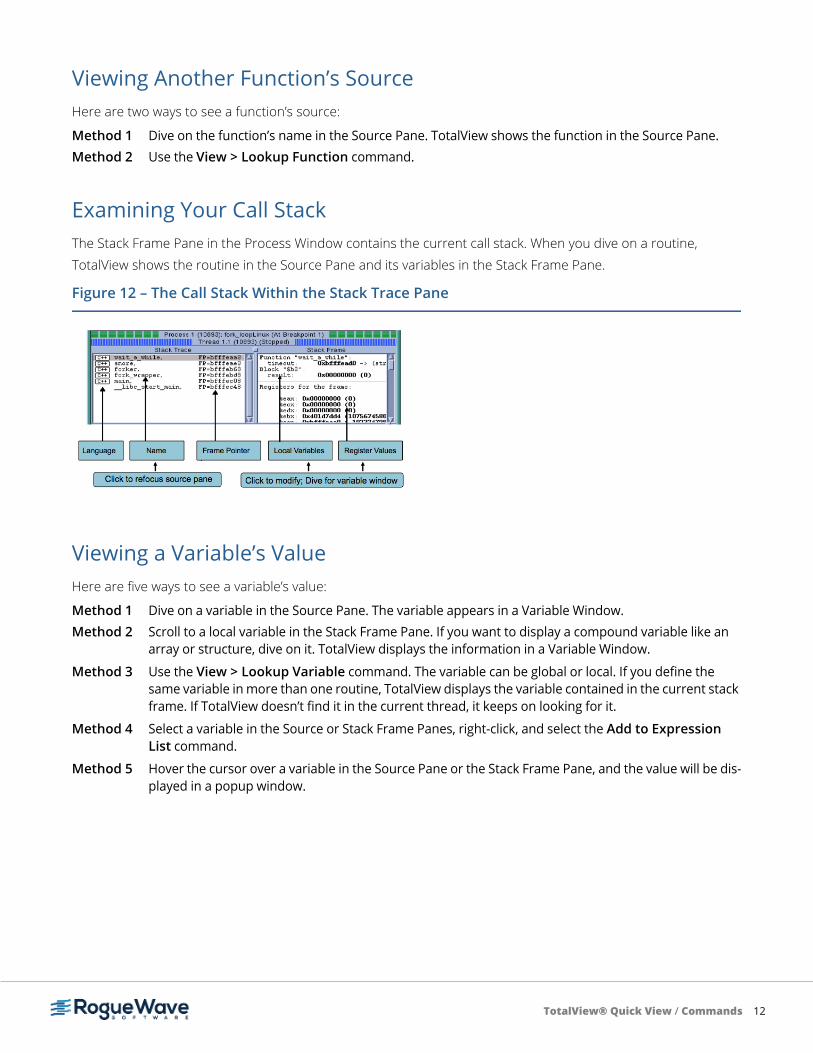
Examining Your Call StackThe Stack Frame Pane in the Process Window contains the current call stack. When you dive on a routine, TotalView shows the routine in the Source Pane and its variables in the Stack Frame Pane.
Viewing a Variable’s ValueHere are five ways to see a variable’s value:
Method 1 Dive on a variable in the Source Pane. The variable appears in a Variable Window.Method 2 Scroll to a local variable in the Stack Frame Pane. If you want to display a compound variable like an
array or structure, dive on it. TotalView displays the information in a Variable Window.
Method 3 Use the View > Lookup Variable command. The variable can be global or local. If you define the same variable in more than one routine, TotalView displays the variable contained in the current stack frame. If TotalView doesn’t find it in the current thread, it keeps on looking for it.
Method 4 Select a variable in the Source or Stack Frame Panes, right-click, and select the Add to Expression List command.
Method 5 Hover the cursor over a variable in the Source Pane or the Stack Frame Pane, and the value will be dis-played in a popup window.
Figure 12 – The Call Stack Within the Stack Trace Pane
TotalView® Quick View / Commands 13
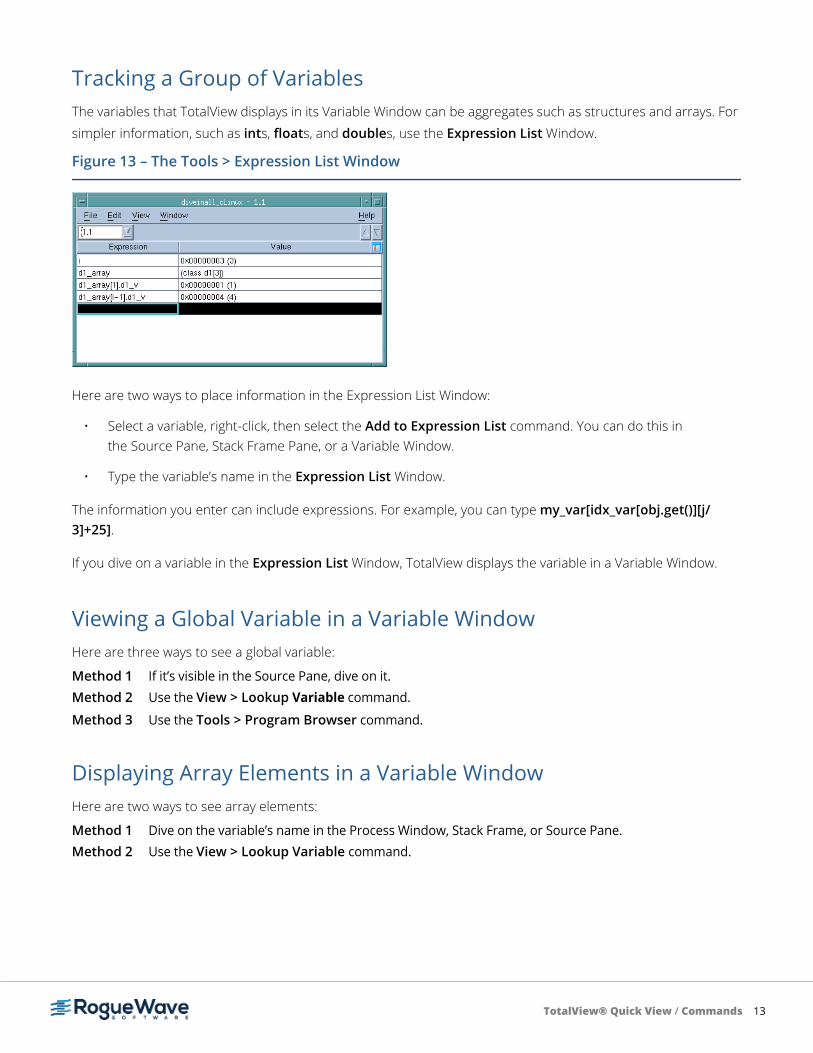
Tracking a Group of VariablesThe variables that TotalView displays in its Variable Window can be aggregates such as structures and arrays. For simpler information, such as ints, floats, and doubles, use the Expression List Window.
Here are two ways to place information in the Expression List Window:
• Select a variable, right-click, then select the Add to Expression List command. You can do this in the Source Pane, Stack Frame Pane, or a Variable Window.
• Type the variable’s name in the Expression List Window.
The information you enter can include expressions. For example, you can type my_var[idx_var[obj.get()][j/3]+25].
If you dive on a variable in the Expression List Window, TotalView displays the variable in a Variable Window.
Viewing a Global Variable in a Variable WindowHere are three ways to see a global variable:
Method 1 If it’s visible in the Source Pane, dive on it.Method 2 Use the View > Lookup Variable command.
Method 3 Use the Tools > Program Browser command.
Displaying Array Elements in a Variable WindowHere are two ways to see array elements:
Method 1 Dive on the variable’s name in the Process Window, Stack Frame, or Source Pane. Method 2 Use the View > Lookup Variable command.
Figure 13 – The Tools > Expression List Window
TotalView® Quick View / Commands 14
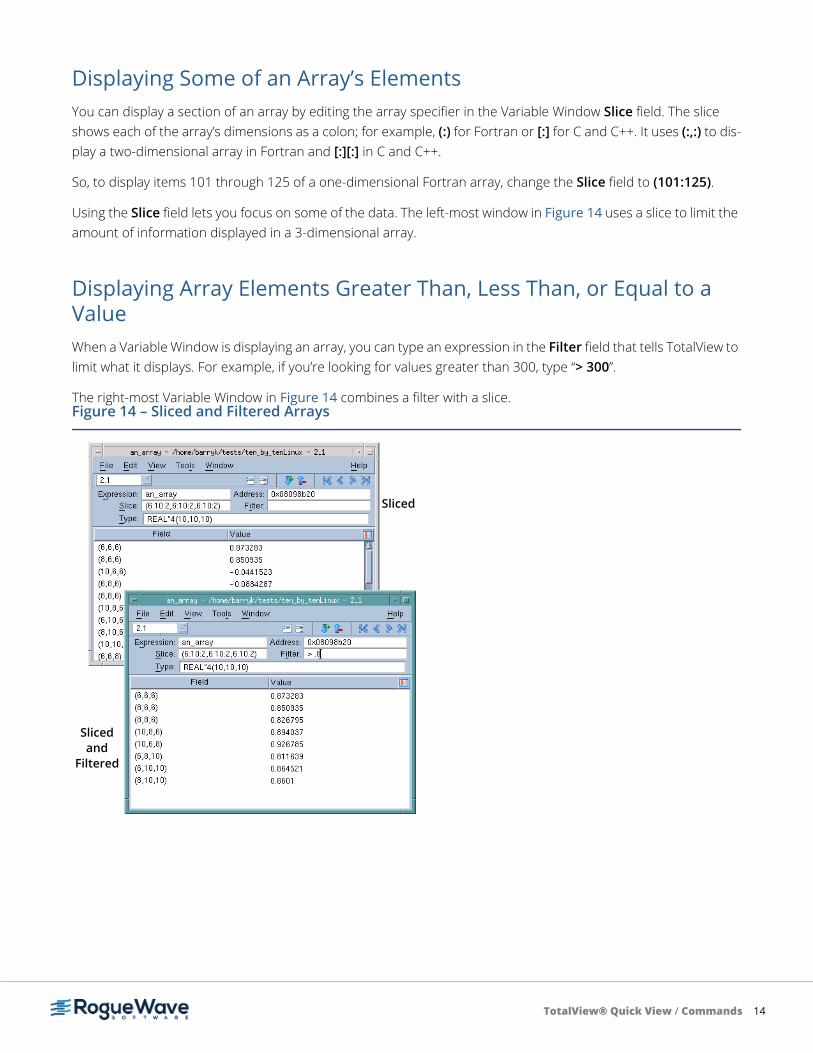
Displaying Some of an Array’s ElementsYou can display a section of an array by editing the array specifier in the Variable Window Slice field. The slice shows each of the array’s dimensions as a colon; for example, (:) for Fortran or [:] for C and C++. It uses (:,:) to dis-play a two-dimensional array in Fortran and [:][:] in C and C++.
So, to display items 101 through 125 of a one-dimensional Fortran array, change the Slice field to (101:125).
Using the Slice field lets you focus on some of the data. The left-most window in Figure 14 uses a slice to limit the amount of information displayed in a 3-dimensional array.
Displaying Array Elements Greater Than, Less Than, or Equal to a ValueWhen a Variable Window is displaying an array, you can type an expression in the Filter field that tells TotalView to limit what it displays. For example, if you’re looking for values greater than 300, type “> 300”.
The right-most Variable Window in Figure 14 combines a filter with a slice. Figure 14 – Sliced and Filtered Arrays
Slicedand
Filtered
Sliced
TotalView® Quick View / Commands 15
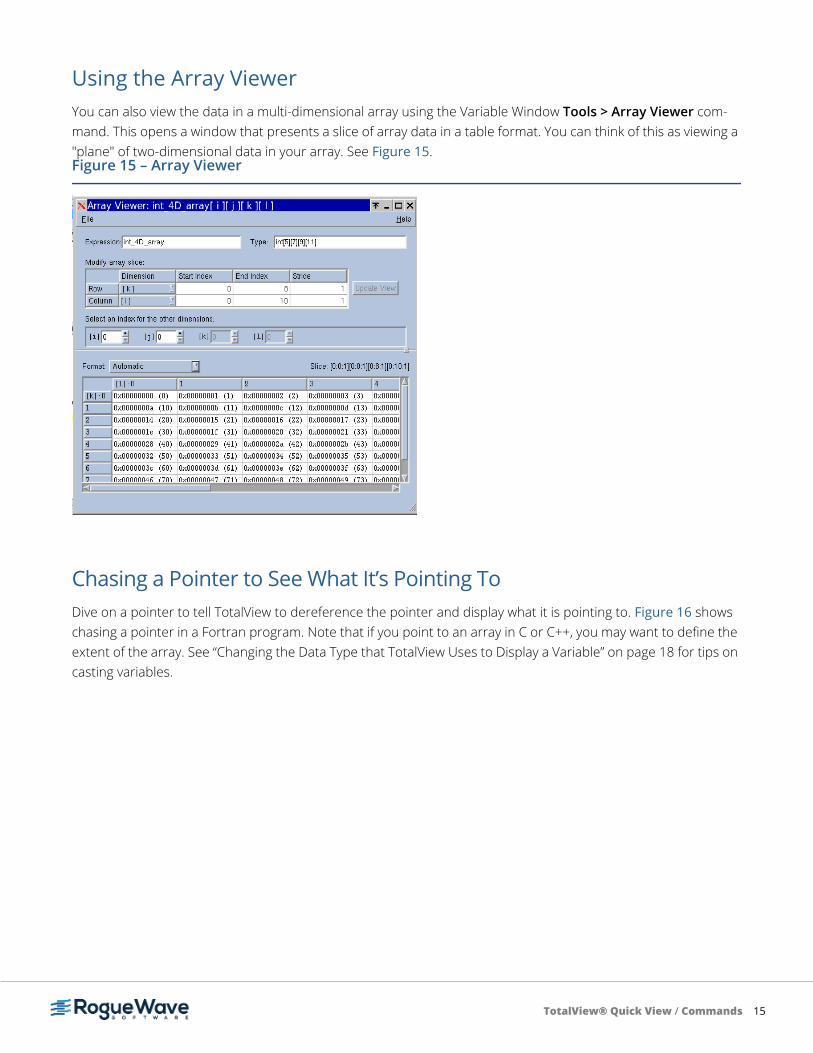
Using the Array ViewerYou can also view the data in a multi-dimensional array using the Variable Window Tools > Array Viewer com-mand. This opens a window that presents a slice of array data in a table format. You can think of this as viewing a "plane" of two-dimensional data in your array. See Figure 15.
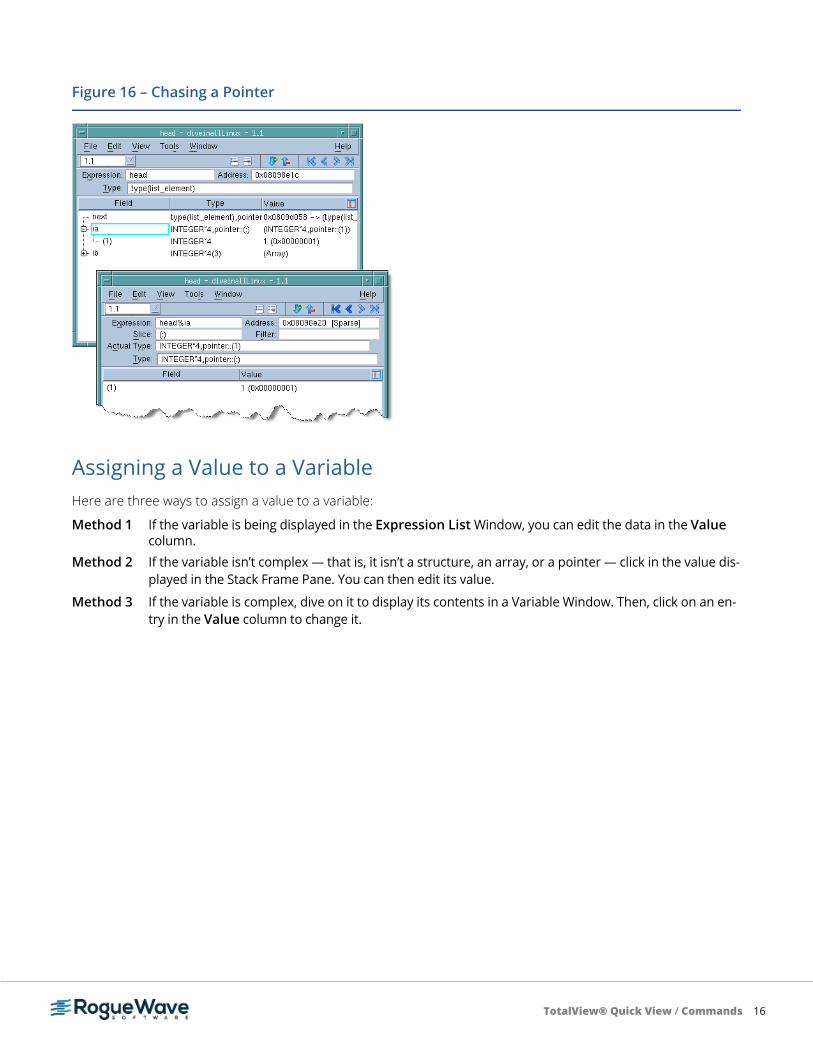
Chasing a Pointer to See What It’s Pointing ToDive on a pointer to tell TotalView to dereference the pointer and display what it is pointing to. Figure 16 shows chasing a pointer in a Fortran program. Note that if you point to an array in C or C++, you may want to define the extent of the array. See “Changing the Data Type that TotalView Uses to Display a Variable” on page 18 for tips on casting variables.
Figure 15 – Array Viewer
TotalView® Quick View / Commands 16
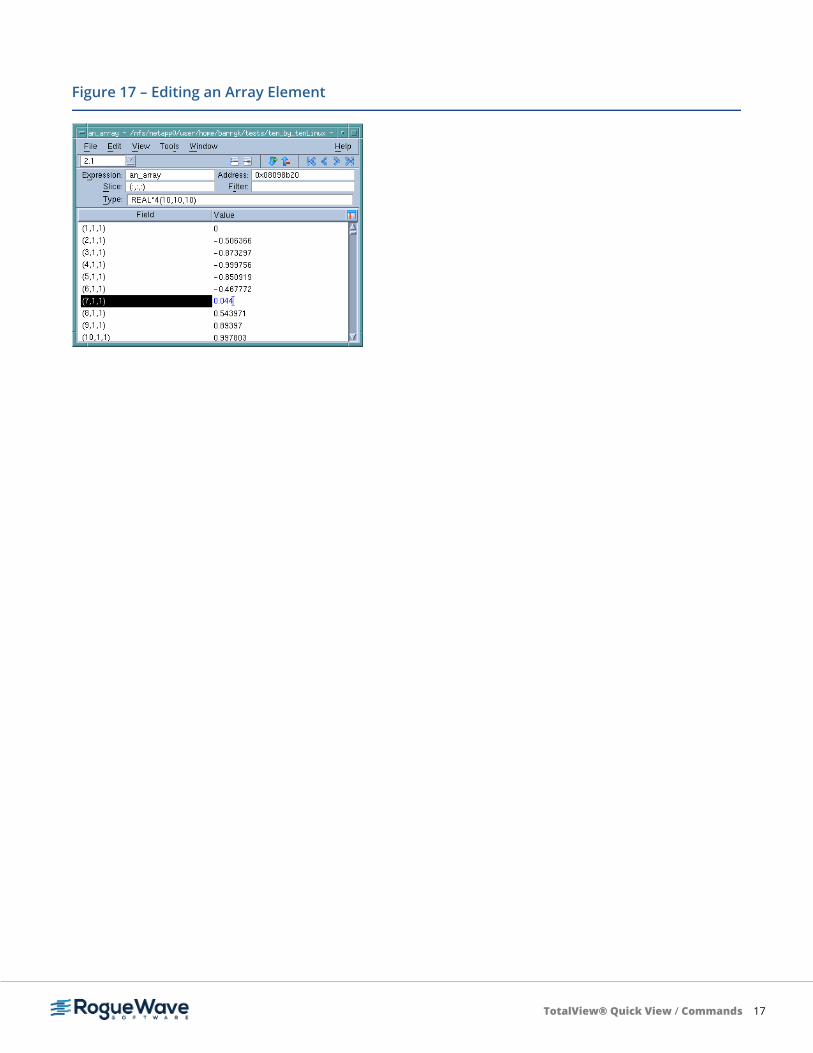
Assigning a Value to a VariableHere are three ways to assign a value to a variable:
Method 1 If the variable is being displayed in the Expression List Window, you can edit the data in the Value column.
Method 2 If the variable isn’t complex — that is, it isn’t a structure, an array, or a pointer — click in the value dis-played in the Stack Frame Pane. You can then edit its value.
Method 3 If the variable is complex, dive on it to display its contents in a Variable Window. Then, click on an en-try in the Value column to change it.
Figure 16 – Chasing a Pointer
TotalView® Quick View / Commands 17
Figure 17 – Editing an Array Element
TotalView® Quick View / Commands 18
Patching a ProgramWhen you add code in the expression window of an evaluation point, you are, in effect, patching your program. When TotalView hits the breakpoint, it runs your code.
The TotalView goto statement lets you branch around code that you do not want executed. The target of the goto statement is a line number that TotalView displays in the Source Pane. For example, goto 78 tells TotalView to branch to line 78. (In Fortran, type goto $78.) This means that when you find your problem, you can create an eval point that contains your patch, and then branch around the original code. This lets you test a fix without having to recompile your program. Of course, this new code only exists within TotalView. You’ll ultimately need to change your source code.
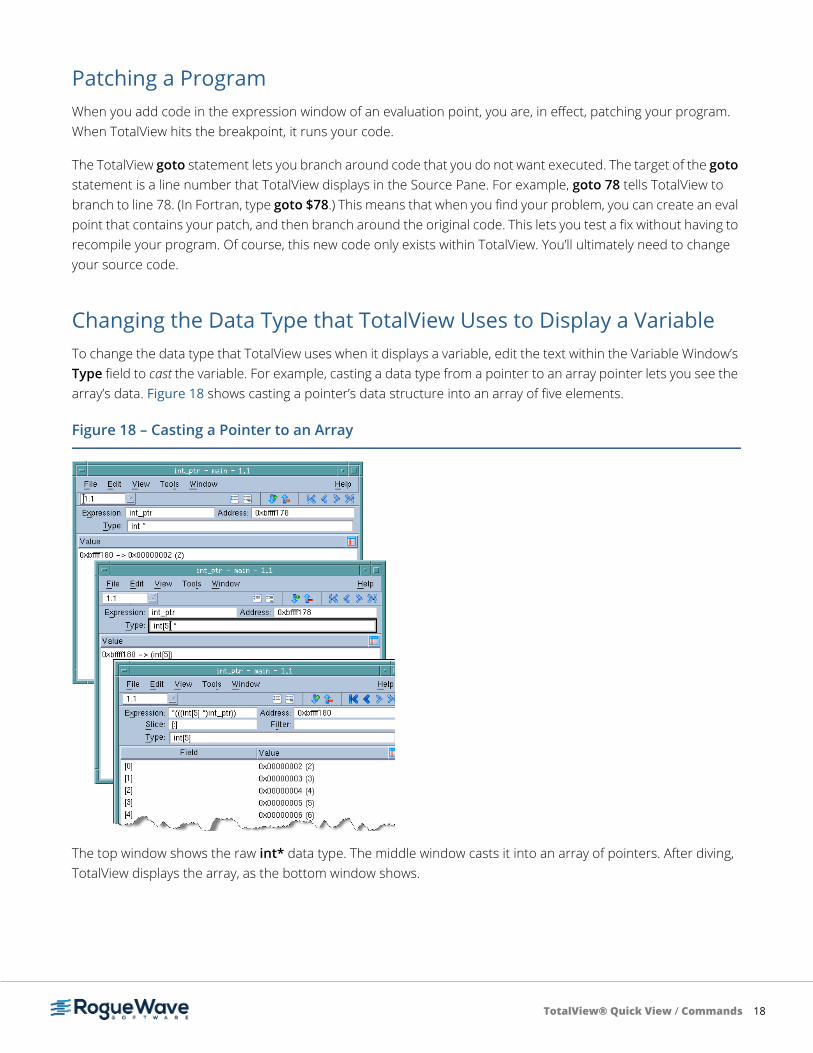
Changing the Data Type that TotalView Uses to Display a VariableTo change the data type that TotalView uses when it displays a variable, edit the text within the Variable Window’s Type field to cast the variable. For example, casting a data type from a pointer to an array pointer lets you see the array’s data. Figure 18 shows casting a pointer’s data structure into an array of five elements.
The top window shows the raw int* data type. The middle window casts it into an array of pointers. After diving, TotalView displays the array, as the bottom window shows.
Figure 18 – Casting a Pointer to an Array
TotalView® Quick View / Commands 19
Changing to a Different Thread or ProcessMethod 1 Dive on a process or thread in the Root Window to display it in a Process Window. Method 2 Change processes by clicking on a process in the Processes Tab. Dive on a thread in the Threads tab to
change to a different thread. For convenient sequential access, use the P+, P-, T+, and T- buttons.
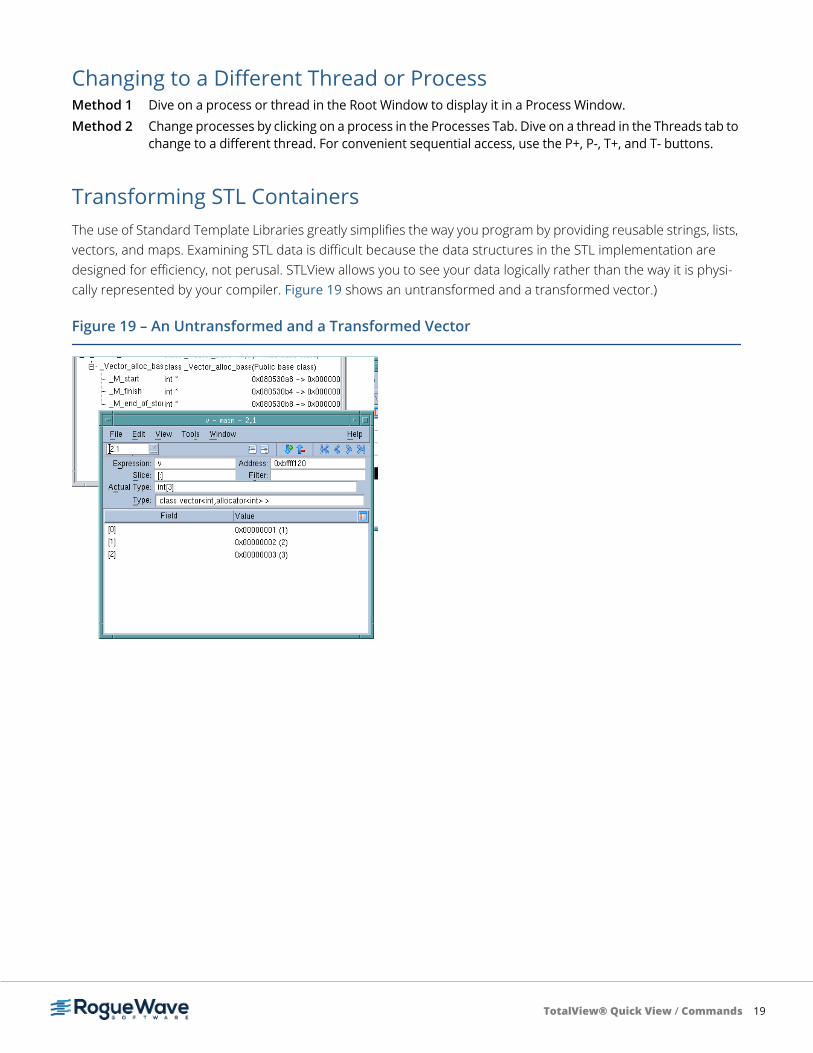
Transforming STL ContainersThe use of Standard Template Libraries greatly simplifies the way you program by providing reusable strings, lists, vectors, and maps. Examining STL data is difficult because the data structures in the STL implementation are designed for efficiency, not perusal. STLView allows you to see your data logically rather than the way it is physi-cally represented by your compiler. Figure 19 shows an untransformed and a transformed vector.)
Figure 19 – An Untransformed and a Transformed Vector
TotalView® Quick View / Starting Memory Debugging with MemoryScape 20
Starting Memory Debugging with MemoryScapeAlthough MemoryScape is integrated with TotalView, it is also available as a stand-alone product.
MemoryScape can monitor how your program uses malloc() and free() and related functions such as calloc() and realloc(). You must enable memory debugging before you start running your program. Here are three ways to enable memory debugging:
Method 1 From the Debug Options dialog in the Sessions Manager, select Enable Memory Debugging.
Method 2 From the Process Window, select Debug > Enable Memory Debugging.
Method 3 On the command line, type memscape.
Select Stop on Memory Errors if it is not already selected.
Because MemoryScape is monitoring calls to the Malloc API, you can even debug programs that use their own memory management libraries. The only requirement is that these libraries eventually use the API. In most cases, you don’t need to recompile or relink your program to use MemoryScape.
Viewing Memory Event InformationAfter you enable memory debugging, MemoryScape stops your program if a memory problem occurs and raises an event flag. If you are using memory debugging from within TotalView, TotalView also displays an event window. (See Figure 20.) You can see the detailed information about the event either in the TotalView event window or by clicking on the MemoryScape event flag.
TotalView® Quick View / Starting Memory Debugging with MemoryScape 21
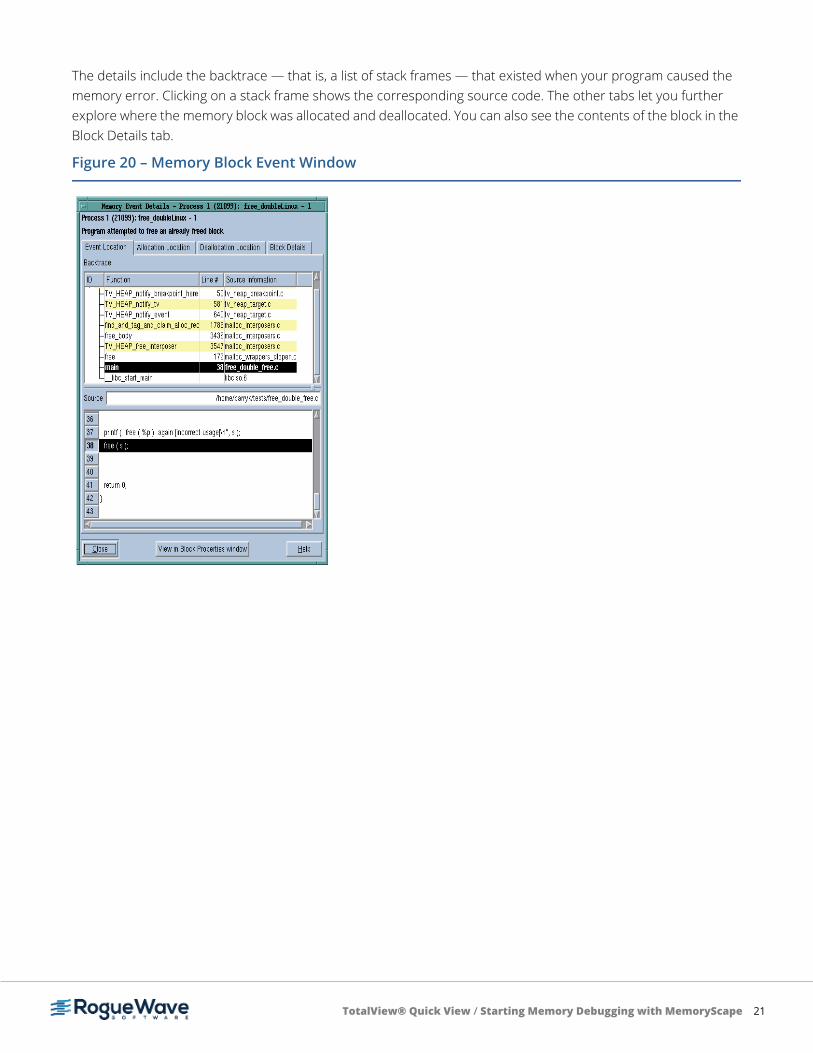
The details include the backtrace — that is, a list of stack frames — that existed when your program caused the memory error. Clicking on a stack frame shows the corresponding source code. The other tabs let you further explore where the memory block was allocated and deallocated. You can also see the contents of the block in the Block Details tab.
Figure 20 – Memory Block Event Window
TotalView® Quick View / Starting Memory Debugging with MemoryScape 22
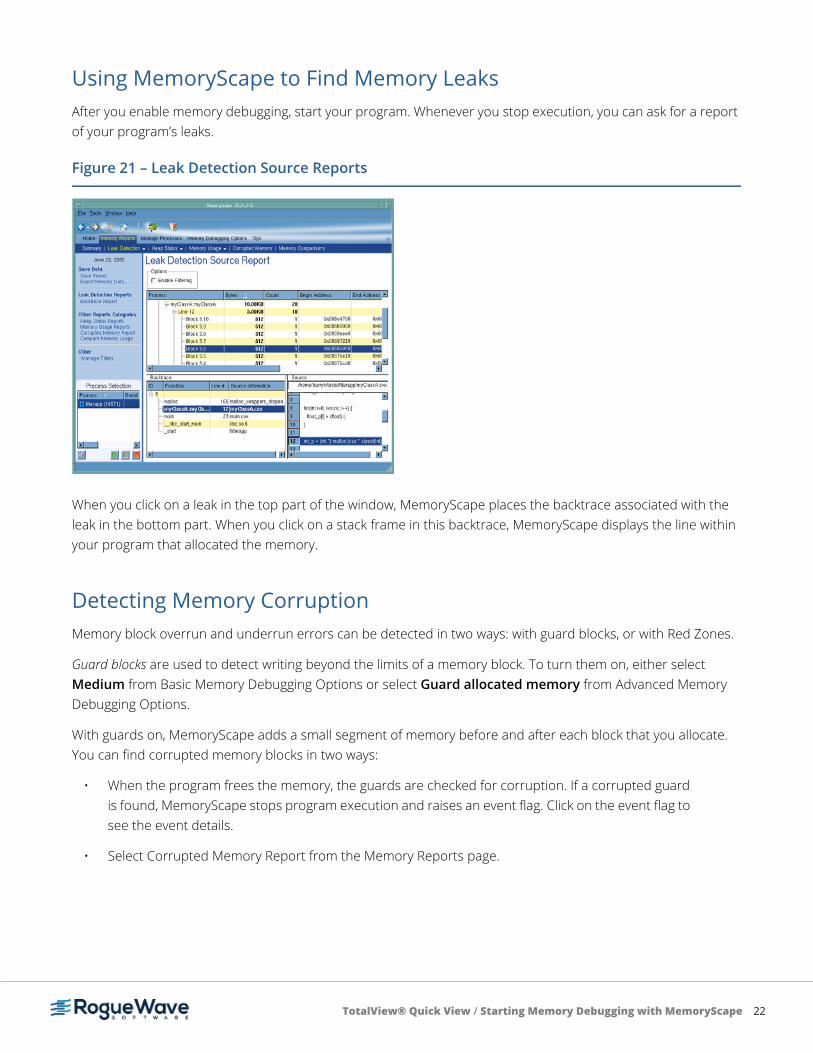
Using MemoryScape to Find Memory LeaksAfter you enable memory debugging, start your program. Whenever you stop execution, you can ask for a report of your program’s leaks.
When you click on a leak in the top part of the window, MemoryScape places the backtrace associated with the leak in the bottom part. When you click on a stack frame in this backtrace, MemoryScape displays the line within your program that allocated the memory.
Detecting Memory CorruptionMemory block overrun and underrun errors can be detected in two ways: with guard blocks, or with Red Zones.
Guard blocks are used to detect writing beyond the limits of a memory block. To turn them on, either select Medium from Basic Memory Debugging Options or select Guard allocated memory from Advanced Memory Debugging Options.
With guards on, MemoryScape adds a small segment of memory before and after each block that you allocate. You can find corrupted memory blocks in two ways:
• When the program frees the memory, the guards are checked for corruption. If a corrupted guard is found, MemoryScape stops program execution and raises an event flag. Click on the event flag to see the event details.
• Select Corrupted Memory Report from the Memory Reports page.
Figure 21 – Leak Detection Source Reports
TotalView® Quick View / Starting Memory Debugging with MemoryScape 23
Red Zones are used to find both read and write memory access violations, notifying you immediately if your pro-gram oversteps the bounds of your allocated block.
Turn them on by selecting High from Basic Memory Debugging Options, or by selecting Use Red Zones to find memory access violations from Advanced Memory Debugging Options.
With Red Zones on, a page of memory is placed either before or after your allocated block, and if your program tries to read or write in this zone, MemoryScape stops program execution and raises an event flag. Click on the event flag to see the event details.
The default is to check for overruns, but you can check for underruns using Advanced Options controls.
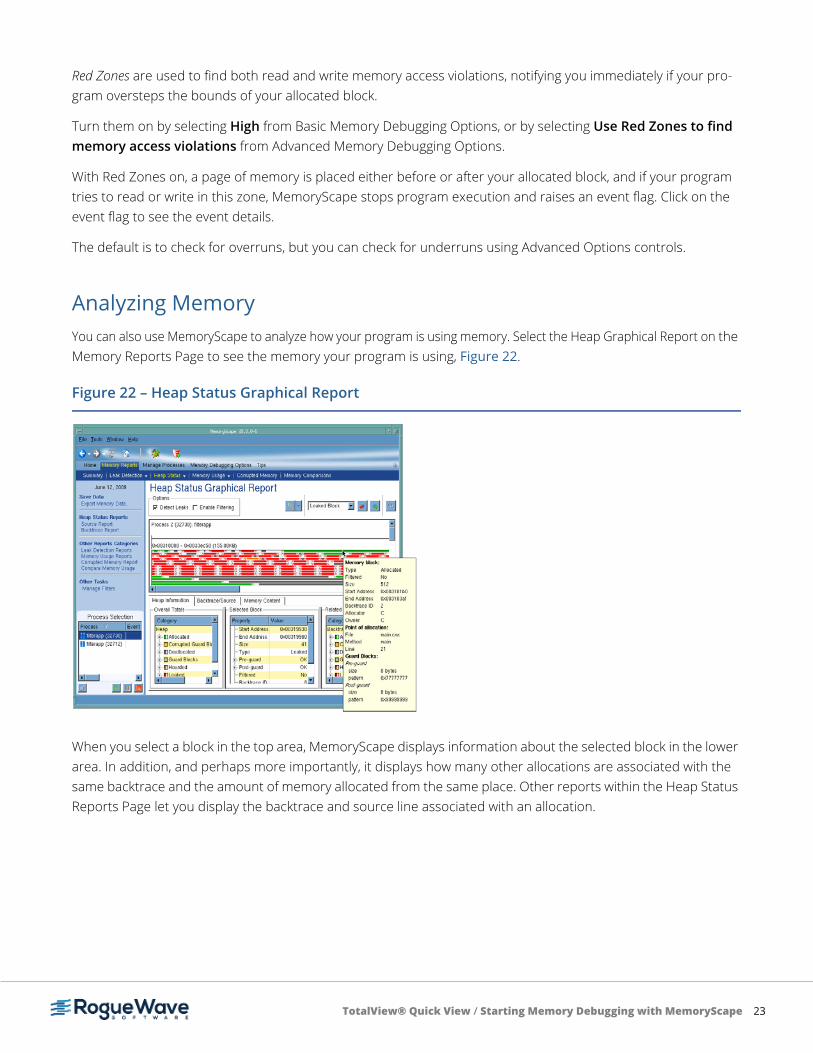
Analyzing MemoryYou can also use MemoryScape to analyze how your program is using memory. Select the Heap Graphical Report on the Memory Reports Page to see the memory your program is using, Figure 22.
When you select a block in the top area, MemoryScape displays information about the selected block in the lower area. In addition, and perhaps more importantly, it displays how many other allocations are associated with the same backtrace and the amount of memory allocated from the same place. Other reports within the Heap Status Reports Page let you display the backtrace and source line associated with an allocation.
Figure 22 – Heap Status Graphical Report
TotalView® Quick View / Starting Memory Debugging with MemoryScape 24
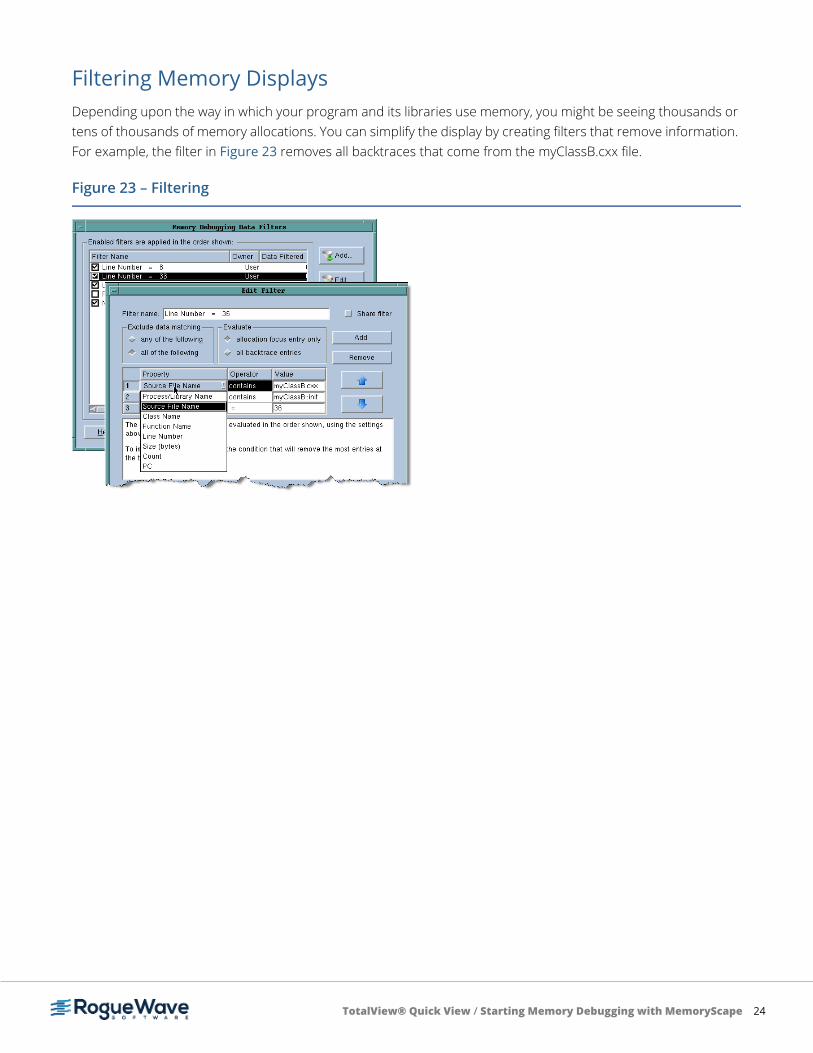
Filtering Memory DisplaysDepending upon the way in which your program and its libraries use memory, you might be seeing thousands or tens of thousands of memory allocations. You can simplify the display by creating filters that remove information. For example, the filter in Figure 23 removes all backtraces that come from the myClassB.cxx file.
Figure 23 – Filtering
TotalView® Quick View / Starting Memory Debugging with MemoryScape 25
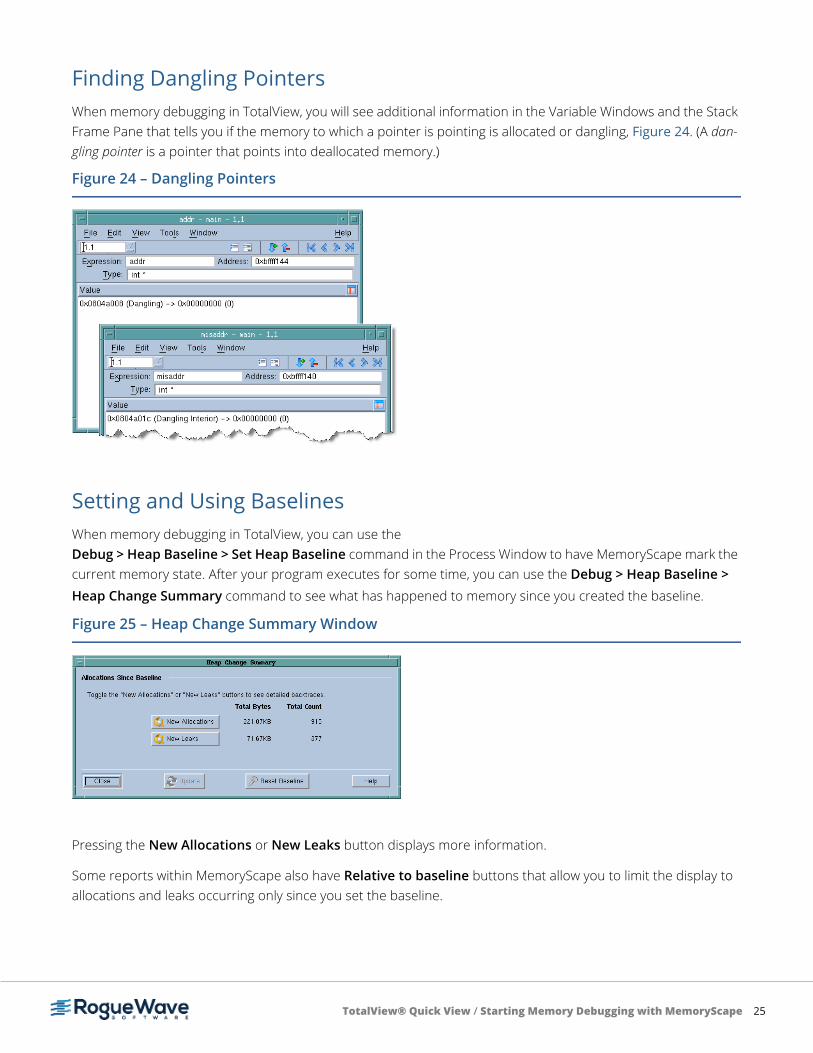
Finding Dangling PointersWhen memory debugging in TotalView, you will see additional information in the Variable Windows and the Stack Frame Pane that tells you if the memory to which a pointer is pointing is allocated or dangling, Figure 24. (A dan-gling pointer is a pointer that points into deallocated memory.)
Setting and Using BaselinesWhen memory debugging in TotalView, you can use the Debug > Heap Baseline > Set Heap Baseline command in the Process Window to have MemoryScape mark the current memory state. After your program executes for some time, you can use the Debug > Heap Baseline > Heap Change Summary command to see what has happened to memory since you created the baseline.
Pressing the New Allocations or New Leaks button displays more information.
Some reports within MemoryScape also have Relative to baseline buttons that allow you to limit the display to allocations and leaks occurring only since you set the baseline.
Figure 24 – Dangling Pointers
Figure 25 – Heap Change Summary Window
TotalView® Quick View / Starting Memory Debugging with MemoryScape 26
Comparing Memory StatesMemoryScape lets you save (export) your program’s memory state and read it back in at a later time. After it is read in, you can examine this information in exactly the same way as information from a live process. In addition, you can select the Memory Compare tab and generate a view. This view shows the differences between how your program is currently using memory and how it previously used memory.
TotalView® Quick View / What Is ReplayEngine? 27
What Is ReplayEngine?ReplayEngine is a separately licensed product for linux-86 and linux-x86-64 that records all of your program’s activities as it executes within TotalView. After recording information, ReplayEngine lets you move forward and backwards within these previously executed instructions.
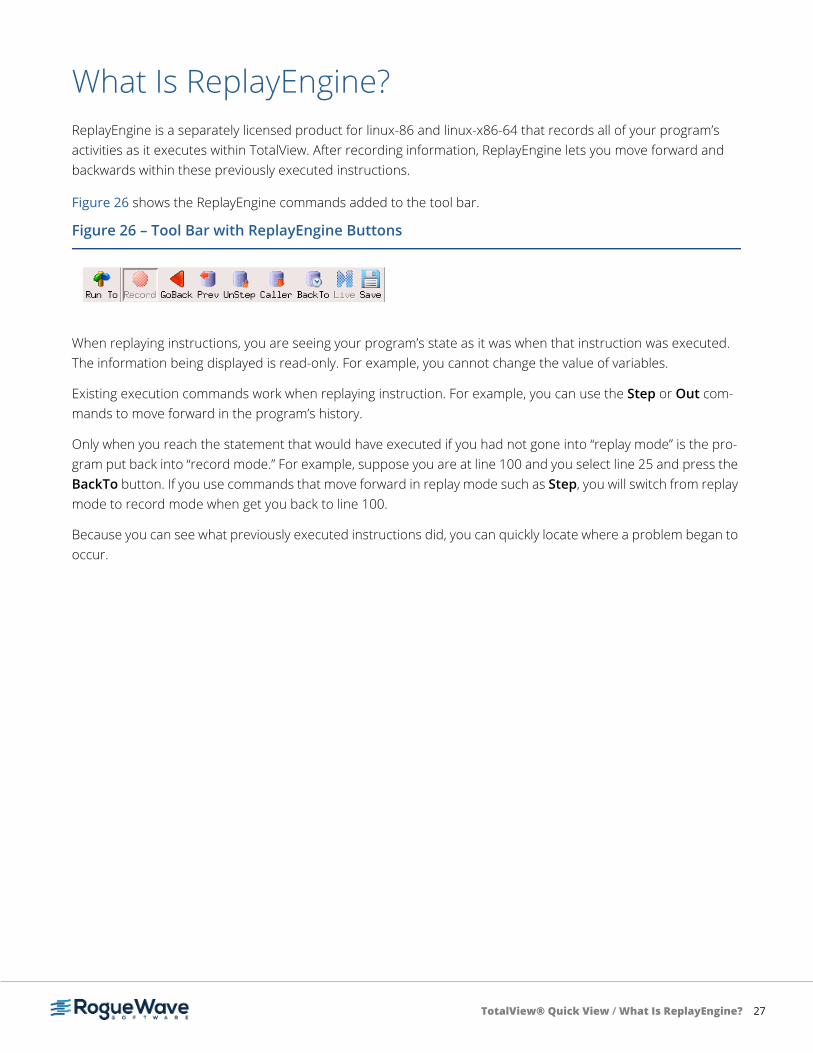
Figure 26 shows the ReplayEngine commands added to the tool bar.
When replaying instructions, you are seeing your program’s state as it was when that instruction was executed. The information being displayed is read-only. For example, you cannot change the value of variables.
Existing execution commands work when replaying instruction. For example, you can use the Step or Out com-mands to move forward in the program’s history.
Only when you reach the statement that would have executed if you had not gone into “replay mode” is the pro-gram put back into “record mode.” For example, suppose you are at line 100 and you select line 25 and press the BackTo button. If you use commands that move forward in replay mode such as Step, you will switch from replay mode to record mode when get you back to line 100.
Because you can see what previously executed instructions did, you can quickly locate where a problem began to occur.
Figure 26 – Tool Bar with ReplayEngine Buttons
TotalView® Quick View / Using Remote Display 28
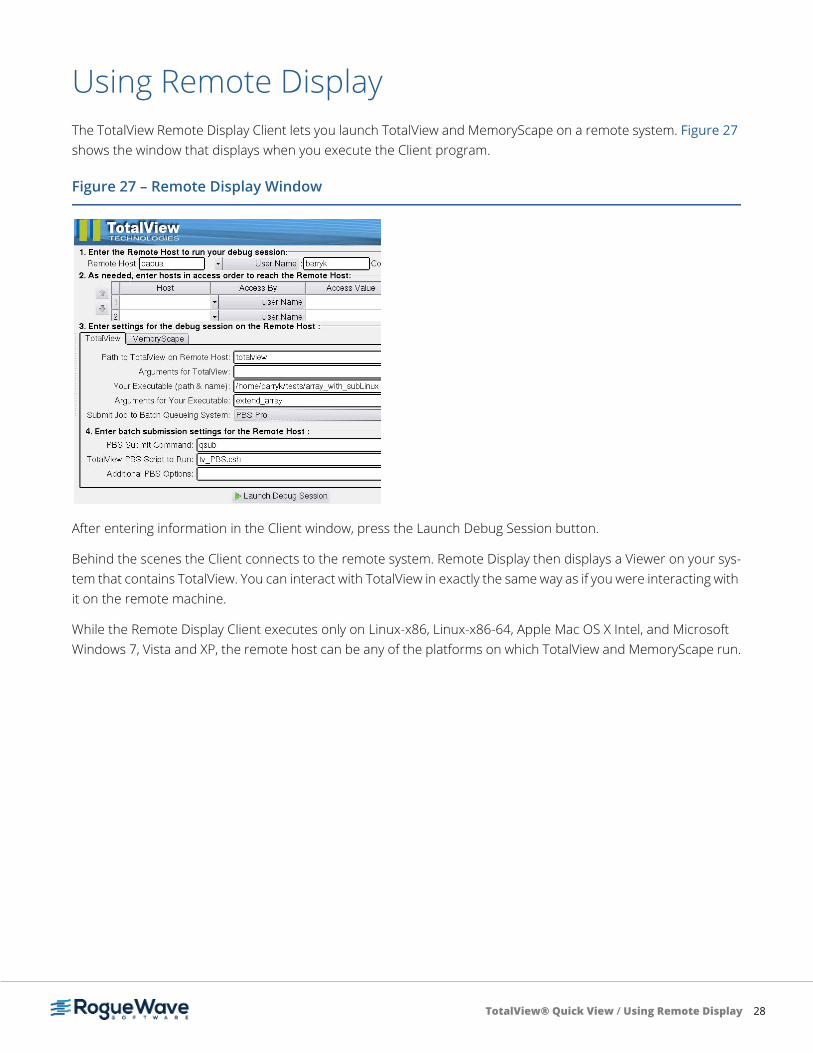
Using Remote DisplayThe TotalView Remote Display Client lets you launch TotalView and MemoryScape on a remote system. Figure 27 shows the window that displays when you execute the Client program.
After entering information in the Client window, press the Launch Debug Session button.
Behind the scenes the Client connects to the remote system. Remote Display then displays a Viewer on your sys-tem that contains TotalView. You can interact with TotalView in exactly the same way as if you were interacting with it on the remote machine.
While the Remote Display Client executes only on Linux-x86, Linux-x86-64, Apple Mac OS X Intel, and Microsoft Windows 7, Vista and XP, the remote host can be any of the platforms on which TotalView and MemoryScape run.
Figure 27 – Remote Display Window
TotalView® Quick View / Using tvscript and memscript 29
Using tvscript and memscriptYou can run TotalView and MemoryScape in batch mode by invoking the tvscript and memscript shell com-mand, respectively. You do this by adding command-line instructions to tvscript or memscript. These arguments can either tell tvscript and memscript what to do or tvscript and memscript can read in a file containing instructions. Placing instructions in a file lets you create callback routines that execute CLI and Tcl commands. For example, you can create a callback routine that performs an action when an action point is encountered or a memory event occurs. Typically, you would add CLI commands that obtain information about your program’s state into a callback. However, you can add any CLI command to the callback.


