7
Q3 2018 Report TOURISM SECTOR PERFORMANCE

Q3 2018 Report
TOURISMSECTORPERFORMANCE

EXECUTIVE SUMMARYIn the first three quarters of 2018, International Visitor Arrivals (IVA) increased 7.5 per cent over the same period last year to reach 14.0 million visitors.
Tourism Receipts (TR) reached $20.6 billion, a 1.1% growth compared to the same period last year. Growths in Sightseeing, Entertainment & Gaming and other TR components offset declines in Shopping, Accommodation and Food & Beverage.
Gazetted hotel room revenue was estimated at $3.0 billion for year-to-date Q3 2018, a year-on-year growth of 7.7 per cent. Average Occupancy Rate (AOR) stood at 87 per cent, an
increase of 1.2 percentage points. Average Room Rate (ARR) grew marginally by 0.8 per cent to S$218, resulting in a 2.2 per cent increase in RevPAR to reach S$190.
In the third quarter of 2018 (Q3), IVA grew 7.1 per cent year-on-year to reach 4.8 million visitors. TR in Q3 2018 grew 3.1 per cent over the same period last year to reach $7.2 billion. Gazetted hotel room revenue for Q3 2018 came in at an estimated S$1.1 billion, a 7.3 per cent year-on-year increase.
Note: International visitor arrivals statistics up to December 2018 is now available here.
NOTE TO EDITORSThis quarterly report provides a summary of key statistics on tourism receipts, international visitor arrivals and gazetted hotels. The analysis in this report is based on data from a variety of sources, including Disembarkation/Embarkation cards, the Overseas Visitors Survey (OVS) and the monthly hotel returns from gazetted hotels. Data derived from the OVS are subject to sampling error. Users are advised to exercise discretion when drawing any conclusions or inferences, or taking any action, based on the data. Data is correct as at the time of publishing.
Download Monthly International Visitor Arrivals and Hotel statistics: https://www.stb.gov.sg/statistics-and-market-insights/Pages/statistics-Visitor-Arrivals.aspx
2
TOURISM SECTORPERFORMANCE2018
Q3
QUARTER THREE 2018 HIGHLIGHTS
TOURISMRECEIPTS
S$7.2 billion
year-on-year to reach
TR in Q3 2018 grew
+3.1%
INTERNATIONALVISITOR ARRIVALS
year-on-year to reach
4.8 million
+7.1%
IVA in Q3 2018 increased by
S$1.1 billion
year-on-year to reach
HOTELINDUSTRY
+7.3%
Gazetted hotel room revenue in Q3 2018 grew
3
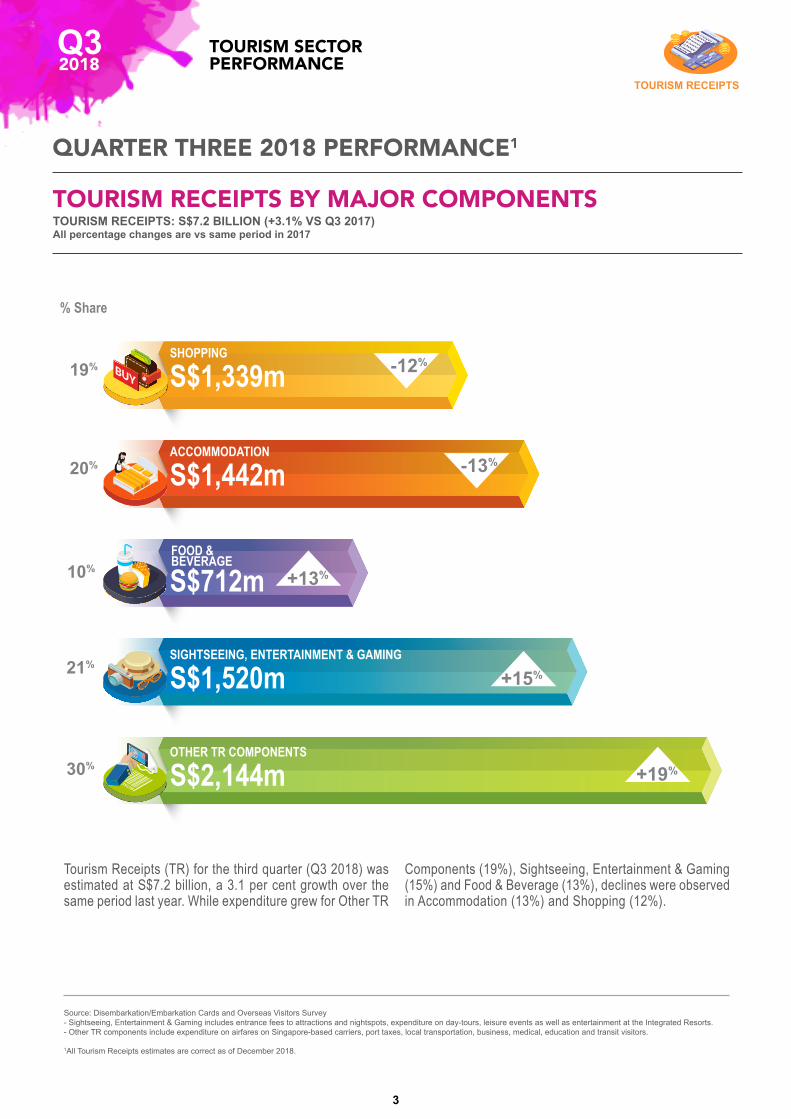
Tourism Receipts (TR) for the third quarter (Q3 2018) was estimated at S$7.2 billion, a 3.1 per cent growth over the same period last year. While expenditure grew for Other TR
Components (19%), Sightseeing, Entertainment & Gaming (15%) and Food & Beverage (13%), declines were observed in Accommodation (13%) and Shopping (12%).
1All Tourism Receipts estimates are correct as of December 2018.
Source: Disembarkation/Embarkation Cards and Overseas Visitors Survey- Sightseeing, Entertainment & Gaming includes entrance fees to attractions and nightspots, expenditure on day-tours, leisure events as well as entertainment at the Integrated Resorts.- Other TR components include expenditure on airfares on Singapore-based carriers, port taxes, local transportation, business, medical, education and transit visitors.
TOURISM RECEIPTS BY MAJOR COMPONENTSTOURISM RECEIPTS: S$7.2 BILLION (+3.1% VS Q3 2017)All percentage changes are vs same period in 2017
QUARTER THREE 2018 PERFORMANCE1
3
TOURISM RECEIPTS
OTHER TR COMPONENTS
S$2,144m
ACCOMMODATION
S$1,442m
S$712m +13%
+19%
+15%
SIGHTSEEING, ENTERTAINMENT & GAMING
S$1,520m
SHOPPING
S$1,339m -12%
-13%
19%
20%
10%
21%
30%
% Share
FOOD & BEVERAGE
TOURISM SECTORPERFORMANCE2018
Q3
Expenditure is estimated from Overseas Visitors Survey.Other TR components include expenditure on airfares on Singapore-based carriers, port taxes, local transportation, business, medical, education and transit visitors.* Sightseeing, Entertainment & Gaming has been excluded in the country analysis due to commercial sensitivity of information.
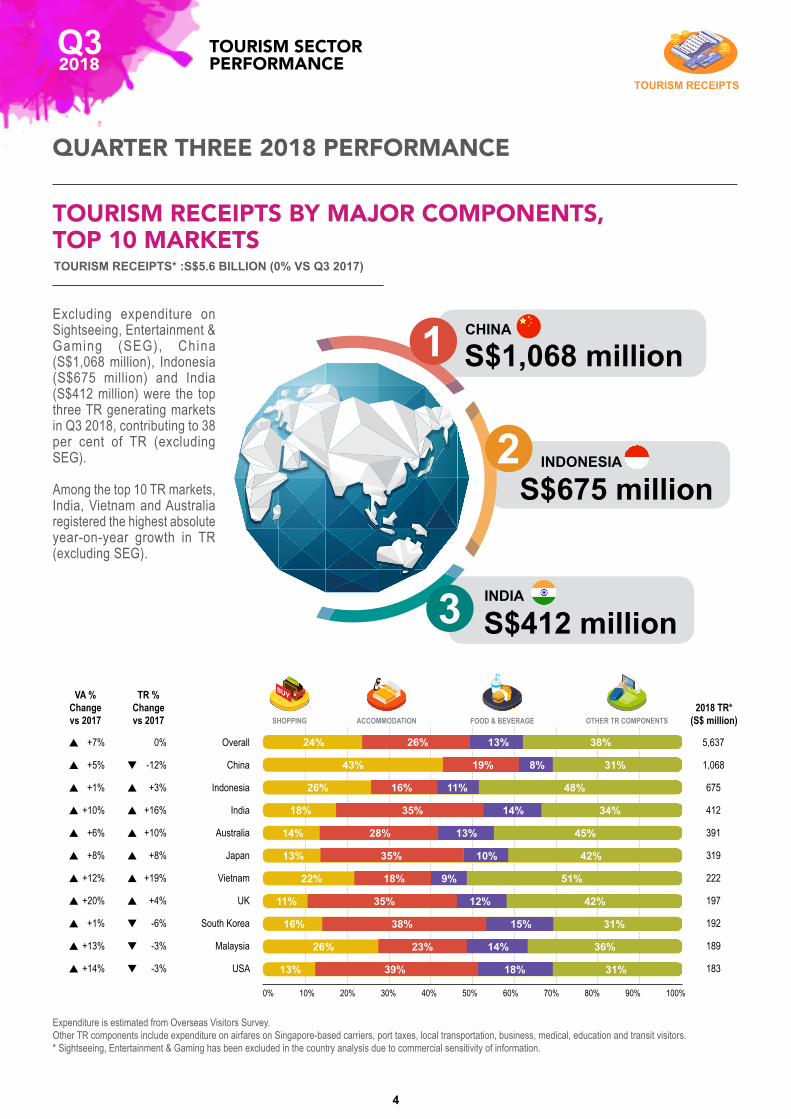
Excluding expenditure on Sightseeing, Entertainment & Gaming (SEG), China (S$1,068 million), Indonesia (S$675 million) and India (S$412 million) were the top three TR generating markets in Q3 2018, contributing to 38 per cent of TR (excluding SEG).
Among the top 10 TR markets, India, Vietnam and Australia registered the highest absolute year-on-year growth in TR (excluding SEG).
TOURISM RECEIPTS BY MAJOR COMPONENTS, TOP 10 MARKETSTOURISM RECEIPTS* :S$5.6 BILLION (0% VS Q3 2017)
VA % Changevs 2017
TR % Changevs 2017
2018 TR*(S$ million)
+7%
+5%
+1%
+10%
+6%
+8%
+12%
+20%
+1%
+13%
+14%
0%
-12%
+3%
+16%
+10%
+8%
+19%
+4%
-6%
-3%
-3%
Overall
China
Indonesia
India
Australia
Japan
Vietnam
UK
South Korea
Malaysia
USA
5,637
1,068
675
412
391
319
222
197
192
189
183
0% 10% 20% 30% 40% 50% 60% 70% 80% 90% 100%
SHOPPING ACCOMMODATION FOOD & BEVERAGE OTHER TR COMPONENTS
p
p
p
p
p
p
p
p
p
p
p
q
p
p
p
p
p
p
q
q
q
24% 26% 13% 38%
43%
26%
18%
14%
13%
22%
11%
16%
26%
13%
16%
35%
28%
35%
18%
35%
38%
23%
39%
11%
14%
13%
10%
9%
12%
15%
14%
18%
48%
34%
45%
42%
51%
42%
31%
36%
31%
19% 8% 31%
4
INDONESIA
S$675 million
1 CHINA
S$1,068 million
2
INDIA
S$412 million3
TOURISM RECEIPTS
TOURISM SECTORPERFORMANCE2018
Q3
QUARTER THREE 2018 PERFORMANCE

Tourism Receipts (TR) for January to September reached S$20.6 billion, a growth of 1.1% compared to the same period last year. While expenditure grew for Other TR Components (21%) and Sightseeing,
Entertainment & Gaming (6%), declines were observed in Shopping (14%), Accommodation (5%) and Food & Beverage (4%).
Excluding expenditure on Sightseeing, Entertainment & Gaming (SEG), China (S$3,155 million), Indonesia (S$2,130 million) and India (S$1,336 million) were the top three TR generating markets for January to
September 2018, contributing 41 per cent of TR (excluding SEG).Among the top 10 TR markets, India, Indonesia and China registered the highest absolute year-on-year growth in TR (excluding SEG).
Expenditure is estimated from Overseas Visitors Survey.– Other TR components include expenditure on airfares on Singapore-based carriers, port taxes, local transportation, business, medical, education and transit visitors.* Sightseeing, Entertainment & Gaming has been excluded in the country analysis due to commercial sensitivity of information.
2 All Tourism Receipts estimates are correct as at December 2018.
TOURISM RECEIPTS BY MAJOR COMPONENTS, TOP 10 MARKETSTOURISM RECEIPTS* :S$16.1 BILLION (0% VS JAN-SEP 2017)
JANUARY TO SEPTEMBER 2018 PERFORMANCE
TOURISM RECEIPTS BY MAJOR COMPONENTS2
TOURISM RECEIPTS: S$20.6 BILLION (+1.1% VS JAN-SEP 2017)
VA % Changevs 2017
TR % Changevs 2017
2018 TR*(S$ million)
+7%
+9%
+4%
+15%
+4%
+5%
+7%
+14%
+5%
0%
+14%
0%
+3%
+8%
+18%
+9%
+9%
0%
-5%
-10%
-13%
+5%
Overall
China
Indonesia
India
Australia
Japan
Malaysia
USA
Philippines
South Korea
Vietnam
16,105
3,155
2,130
1,336
988
819
609
548
511
510
507
0% 10% 20% 30% 40% 50% 60% 70% 80% 90% 100%
SHOPPING ACCOMMODATION FOOD & BEVERAGE OTHER TR COMPONENTS
p
p
p
p
p
p
p
p
p
p
p
p
p
p
p
q
q
q
p
25% 27% 12% 36%
45%
27%
17%
16%
15%
28%
14%
21%
16%
27%
15%
40%
28%
36%
23%
40%
32%
36%
20%
10%
13%
13%
10%
13%
16%
17%
14%
11%
49%
31%
43%
39%
36%
30%
30%
33%
42%
21% 7% 27%
Source: Disembarkation/Embarkation Cards and Overseas Visitors Survey– Sightseeing, Entertainment & Gaming includes entrance fees to attractions and nightspots, expenditure on day-tours, leisure events and entertainment at the Integrated Resorts.– Other TR components include expenditure on airfares on Singapore-based carriers, port taxes, local transportation, business, medical, education and transit visitors.
5
TOURISM RECEIPTS
TOURISM SECTORPERFORMANCE2018
Q3
% Changevs 2017
-14%
-5%
-4%
+6%
+21%
Jan - Sep % Share
q
q
q
p
p
SHOPPING
ACCOMMODATION
FOOD & BEVERAGE
SIGHT SEEING, ENTERTAINMENT & GAMING
OTHER TR COMPONENTS
20%
21%
9%
22%
28%
$4,055
$4,347
$1,946
$4,472
$5,758
S$ Millions 0 2 ,000 4,000 6,000
Q1 1,470 Q2 1,246
Q1 1,419 Q2 1,485
Q1 1,498 Q2 1,454
Q1 1,828 Q2 1,787
Q1 630 Q2 604 Q3 712
Q3 1,339
Q3 1,442
Q3 1,520
Q3 2,144

INTERNATIONALVISITOR ARRIVALS
3 Visitor arrival figures quoted are rounded to the nearest thousands.
China (2.7 million), Indonesia (2.2 million), India (1.1 million), Malaysia (0.9 million) and Australia (0.8 million) were Singapore’s top five international visitor-generating markets in 2018. These markets accounted for 55 per cent of total IVA in January to September 2018.
Largest absolute year-on-year growths were noted in China (9%), India (15%) and Indonesia (4%). There were no absolute decline markets.
% Changevs 2017
+5%
+5%
0
+14%
+14%
+14%
+3%
+2%
+9%
+1%
Japan
Philippines
South Korea
USA
Vietnam
UK
Thailand
Hong Kong SAR
Taiwan
Germany
0 300200100 400 500 600 700‘000s
p
p
p
p
p
p
p
p
p
IVA, TOP 15 MARKETS3
CHINAp+9% 2,712,000INDONESIAp+4% 2,249,000INDIAp+15% 1,089,000MALAYSIAp+7% 890,000AUSTRALIAp+4% 832,000
Source: Disembarkation/Embarkation Cards
1
2
3
4
5
6
7
8
9
10
11
12
13
14
15
618
571
483
477
475
446
404
369
343
259
JAN-SEP 2018: 14.0 MILLION (+7.5% VS JAN-SEP 2017)
6
JANUARY TO SEPTEMBER 2018 PERFORMANCE
INTERNATIONAL VISITOR ARRIVALS (IVA)JAN-SEP 2018: 14.0 MILLION (+7.5% VS JAN-SEP 2017), VISITOR DAYS: 47.3 MILLION DAYS (+5.5%)
Singapore’s international visitor arrivals (IVA) for the first three quarters of 2018 stood at 14.0 million for January to September 2018, a 7.5 per cent year-on-year growth.
% Change VS 2017 IVA 2017 (’000s) IVA 2018 (’000s)
TOURISM SECTORPERFORMANCE2018
Q3
1,480 1,471
1,5841,544
1,361 1,364
1,492
1,480
1,563 1,545
1,388
1,733
1,632
1,683
1,559
1,4711,415
1,320
HOTEL INDUSTRY
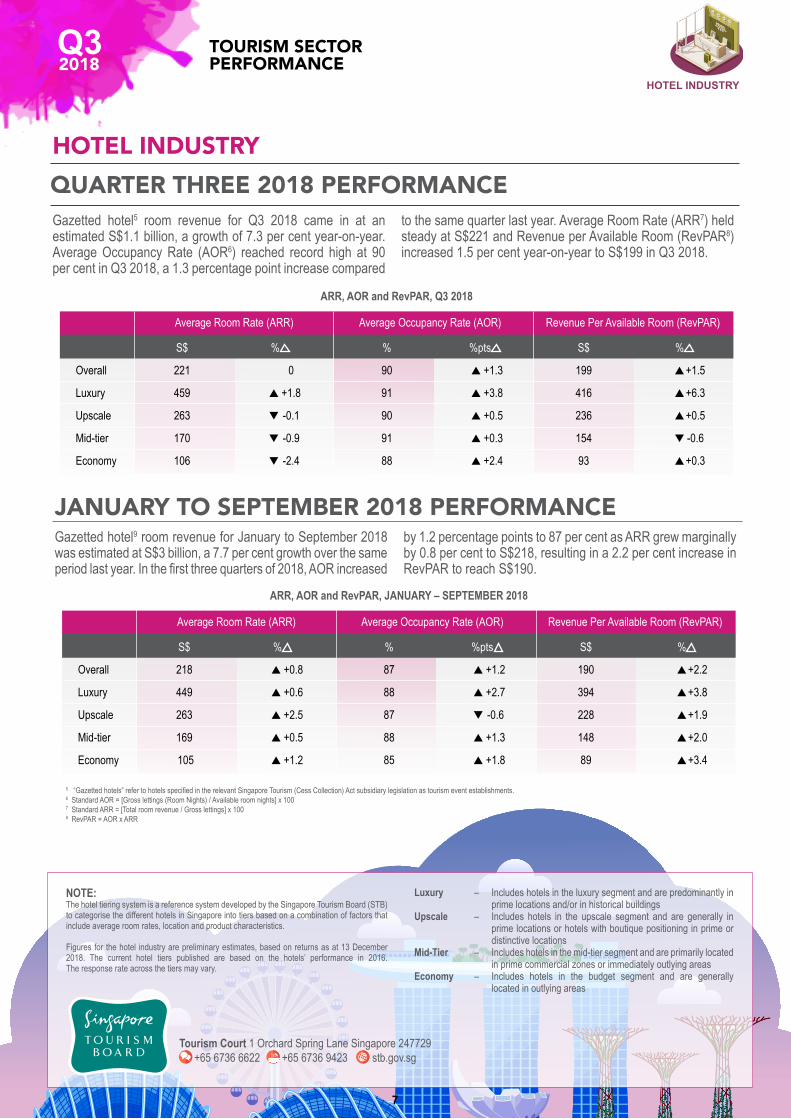
Gazetted hotel5 room revenue for Q3 2018 came in at an estimated S$1.1 billion, a growth of 7.3 per cent year-on-year. Average Occupancy Rate (AOR6) reached record high at 90 per cent in Q3 2018, a 1.3 percentage point increase compared
to the same quarter last year. Average Room Rate (ARR7) held steady at S$221 and Revenue per Available Room (RevPAR8) increased 1.5 per cent year-on-year to S$199 in Q3 2018.
HOTEL INDUSTRY
5 “Gazetted hotels” refer to hotels specified in the relevant Singapore Tourism (Cess Collection) Act subsidiary legislation as tourism event establishments.6 Standard AOR = [Gross lettings (Room Nights) / Available room nights] x 1007 Standard ARR = [Total room revenue / Gross lettings] x 1008 RevPAR = AOR x ARR
S$ % % %pts S$ %
Overall 221 0 90 p +1.3 199 p +1.5
Luxury 459 p +1.8 91 p +3.8 416 p +6.3
Upscale 263 q -0.1 90 p +0.5 236 p +0.5
Mid-tier 170 q -0.9 91 p +0.3 154 q -0.6
Economy 106 q -2.4 88 p +2.4 93 p +0.3
Average Room Rate (ARR)
ARR, AOR and RevPAR, Q3 2018
Average Occupancy Rate (AOR) Revenue Per Available Room (RevPAR)
QUARTER THREE 2018 PERFORMANCE
S$ % % %pts S$ %
Overall 218 p +0.8 87 p +1.2 190 p +2.2
Luxury 449 p +0.6 88 p +2.7 394 p +3.8
Upscale 263 p +2.5 87 q -0.6 228 p +1.9
Mid-tier 169 p +0.5 88 p +1.3 148 p +2.0
Economy 105 p +1.2 85 p +1.8 89 p +3.4
Average Room Rate (ARR)
ARR, AOR and RevPAR, JANUARY – SEPTEMBER 2018
Average Occupancy Rate (AOR) Revenue Per Available Room (RevPAR)
Gazetted hotel9 room revenue for January to September 2018 was estimated at S$3 billion, a 7.7 per cent growth over the same period last year. In the first three quarters of 2018, AOR increased
by 1.2 percentage points to 87 per cent as ARR grew marginally by 0.8 per cent to S$218, resulting in a 2.2 per cent increase in RevPAR to reach S$190.
JANUARY TO SEPTEMBER 2018 PERFORMANCE
7
TOURISM SECTORPERFORMANCE2018
Q3
+65 6736 6622 +65 6736 9423 stb.gov.sgTourism Court 1 Orchard Spring Lane Singapore 247729
NOTE: The hotel tiering system is a reference system developed by the Singapore Tourism Board (STB) to categorise the different hotels in Singapore into tiers based on a combination of factors that include average room rates, location and product characteristics.
Figures for the hotel industry are preliminary estimates, based on returns as at 13 December 2018. The current hotel tiers published are based on the hotels’ performance in 2016. The response rate across the tiers may vary.
Luxury – Includes hotels in the luxury segment and are predominantly in prime locations and/or in historical buildings
Upscale – Includes hotels in the upscale segment and are generally in prime locations or hotels with boutique positioning in prime or distinctive locations
Mid-Tier – Includes hotels in the mid-tier segment and are primarily located in prime commercial zones or immediately outlying areas
Economy – Includes hotels in the budget segment and are generally located in outlying areas


