20
Tourism’s Economics Impact on Sussex County May 2018

Tourism’s Economics Impact
on Sussex County
May 2018

Table of contents
| Tourism Economics 2

1) Tourism Impact Summary and
Trends
Economic impact summary
| Tourism Economics 4
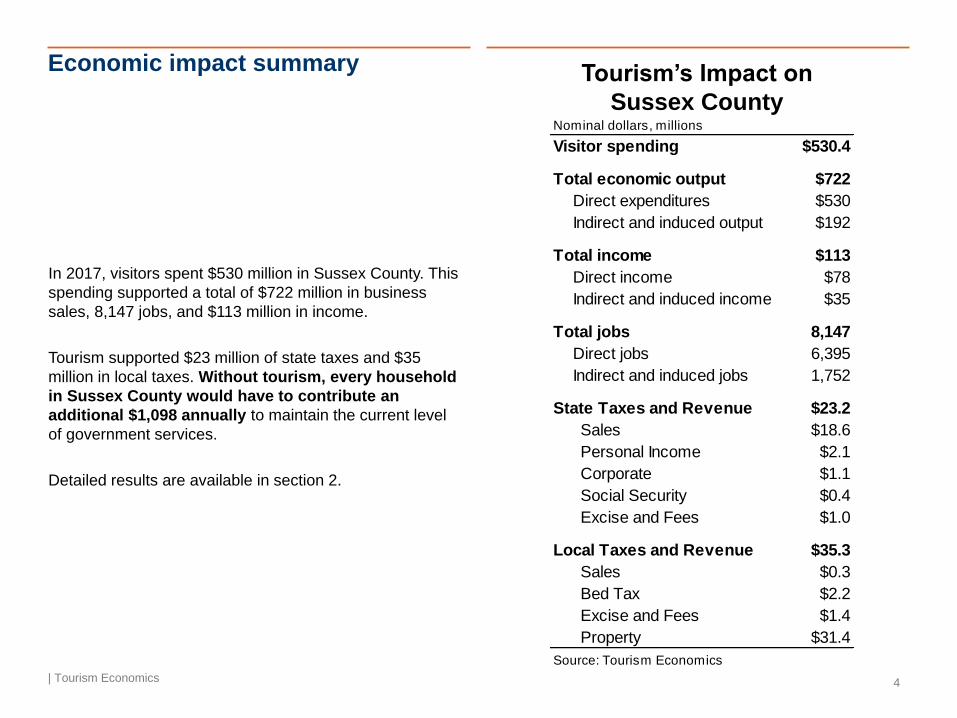
In 2017, visitors spent $530 million in Sussex County. This
spending supported a total of $722 million in business
sales, 8,147 jobs, and $113 million in income.
Tourism supported $23 million of state taxes and $35
million in local taxes. Without tourism, every household
in Sussex County would have to contribute an
additional $1,098 annually to maintain the current level
of government services.
Detailed results are available in section 2.
Nominal dollars, millions
Visitor spending $530.4
Total economic output $722
Direct expenditures $530
Indirect and induced output $192
Total income $113
Direct income $78
Indirect and induced income $35
Total jobs 8,147
Direct jobs 6,395
Indirect and induced jobs 1,752
State Taxes and Revenue $23.2
Sales $18.6
Personal Income $2.1
Corporate $1.1
Social Security $0.4
Excise and Fees $1.0
Local Taxes and Revenue $35.3
Sales $0.3
Bed Tax $2.2
Excise and Fees $1.4
Property $31.4
Source: Tourism Economics
Tourism’s Impact on
Sussex County

7,934
7,896
6,395
4,686
4,569
4,151
2,609
2,572
1,733
1,361
1,221
1,200
912
545
Retail trade
Health care and social assistance
Tourism (direct employment)
Construction
Professional and technical services
Real estate
Finance and insurance
Manufacturing
Wholesale trade
Educational services
Transportation and warehousing
Management
Agriculture
Information
0 2 4 6 8 10
Jobs, 000'sNote that BEA 2016 estimates are used for other industries
Tourism is one of the largest
industries in Sussex County
| Tourism Economics 5
Employment by industry in Sussex County
Sources: BEA; Tourism Economics

3.3%
11.6%
0.9%
1.9%
0.6%
1.3%
Wages
Jobs
0% 5% 10% 15% 20%
Direct Indirect Induced
Share of county total
4.8% of total county wages
14.7% of total county jobs
The tourism sector is a major
contributor to Sussex County’s
economy
| Tourism Economics 6
The tourism sector sustains 14.7% of all
private sector jobs and 4.8% of all private
sector income in Sussex County
Tourism’s share of key local indicators
Sources: BEA; Tourism Economics

Visitor spending in Sussex County
| Tourism Economics 7
Sussex County visitor spending by sector, 2017
Source: Tourism Economics
Visitors to Sussex County spent $530
million in 2017
25%
29%21%
16%
9%
$134m of spending on lodging
$530m in total visitor spending
$153m of spending on food and beverage
$46m of spending on local transportation
$87m of spending on recreation
Dollars, millions and percent of total
$110m of spending on retail

Visitor spending has been steadily
increasing
| Tourism Economics 8
Visitor spending reached $530 million in
2017, up from $461 million in 2012, a 15%
increase in five years
Visitor spending in Sussex County
Source: Tourism Economics
$461$487 $493
$510 $522 $530
2012 2013 2014 2015 2016 2017
$0
$100
$200
$300
$400
$500
$600Dollars, millions

Tourism spending is changing with
prices
| Tourism Economics 9
Low gasoline prices have reduced the
share of spending on transportation over
time
Visitor spending by category in Sussex County
Source: Tourism Economics
10.1% 9.5% 9.3% 8.8% 8.9% 8.6%
16.2% 16.5% 16.6% 16.4% 16.6% 16.5%
21.7% 21.4% 21.2% 21.3% 21.1% 20.7%
28.5% 28.1% 27.9% 28.5% 28.9% 28.9%
23.4% 24.5% 25.1% 25.0% 24.5% 25.2%
2012 2013 2014 2015 2016 2017
0%
20%
40%
60%
80%
100%
Accommodation
F&B
Retail
Recreation
Transportation
Dollars, millions

2) Detailed Results

Tourism’s Impact on business
sales (1 of 2)
| Tourism Economics 11
Tourism generated $530 million in
direct sales and supported $722
million in total business sales
Direct Indirect Induced Total
Agriculture, Fishing, Mining - $0.4 $0.2 $0.6
Construction and Utilities - $17.0 $3.5 $20.5
Manufacturing - $1.1 $0.1 $1.2
Wholesale Trade - $3.4 $2.6 $5.9
Air Transport - $0.0 $0.0 $0.0
Other Transport $7.6 $4.2 $1.4 $13.2
Retail Trade $110.0 $1.7 $6.7 $118.5
Gasoline Stations $35.2 $0.2 $0.5 $35.9
Communications - $6.9 $2.7 $9.6
Finance, Insurance and Real Estate $57.4 $31.8 $29.6 $118.8
Business Services - $33.6 $5.9 $39.5
Education and Health Care - $0.2 $13.1 $13.3
Recreation and Entertainment $87.5 $4.3 $1.6 $93.3
Lodging $79.4 $0.1 $0.0 $79.6
Food & Beverage $153.2 $2.1 $6.1 $161.3
Personal Services - $3.0 $3.6 $6.6
Government - $3.2 $0.7 $4.0
TOTAL $530.4 $113.2 $78.3 $722.0
Source: Tourism Economics
Tourism industry generated business sales, millions

Tourism’s Impact on business
sales (2 of 2)
| Tourism Economics 12
Food & Beverage
FIRE*
Retail Trade
Recreation and Entertainment
Lodging
Business Services
Gasoline Stations
Construction and Utilities
Education and Health Care
Other Transport
Communications
Personal Services
Wholesale Trade
Government
Manufacturing
Agriculture, Fishing, Mining
Air Transport
$0 $50 $100 $150 $200
Direct
Indirect
Induced
Tourism industry generated business sales, 2017
Source: Tourism Economics
Dollars, millions*Finance, insurance and real estate

Tourism’s Impact on income (1
of 2)
| Tourism Economics 13
Tourism generated $78 million in
local income and supported $113
million in total income
Direct Indirect Induced TotalAgriculture, Fishing, Mining - - - -
Construction and Utilities - $2.2 $0.4 $2.6
Manufacturing - $0.2 - $0.2
Wholesale Trade - $0.7 $0.5 $1.2
Air Transport - - - -
Other Transport $2.4 $1.3 $0.4 $4.1
Retail Trade $5.3 $0.4 $1.4 $7.1
Gasoline Stations - $0.1 $0.1 $0.2
Communications - $0.9 $0.2 $1.1
Finance, Insurance and Real Estate - $2.2 $1.0 $3.2
Business Services - $9.4 $1.7 $11.1
Education and Health Care - $0.1 $4.5 $4.6
Recreation and Entertainment $10.7 $0.6 $0.2 $11.5
Lodging $20.4 - - $20.4
Food & Beverage $39.0 $0.7 $1.5 $41.2
Personal Services - $1.1 $1.5 $2.6
Government - $1.3 $0.2 $1.5
TOTAL $77.8 $21.1 $13.8 $112.7
Source: Tourism Economics
Tourism industry generated income, millions

Tourism’s Impact on income (2
of 2)
| Tourism Economics 14
Food & Beverage
Lodging
Recreation and Entertainment
Business Services
Retail Trade
Education and Health Care
Other Transport
FIRE*
Construction and Utilities
Personal Services
Government
Wholesale Trade
Communications
Manufacturing
Gasoline Stations
Agriculture, Fishing, Mining
Air Transport
$0 $20 $40 $60
Direct
Indirect
Induced
Tourism industry generated income, 2017
Source: Tourism Economics
Dollars, millions*Finance, insurance and real estate

Tourism’s Impact on jobs (1 of 2)
| Tourism Economics 15
Tourism generated 6,395 jobs
directly and supported 8,147 total
jobs
Direct Indirect Induced Total
Agriculture, Fishing, Mining - 4 2 6
Construction and Utilities - 62 12 74
Manufacturing - 7 1 8
Wholesale Trade - 18 14 32
Air Transport - - - -
Other Transport 189 36 13 238
Retail Trade 549 26 89 664
Gasoline Stations 58 3 8 69
Communications - 22 7 29
Finance, Insurance and Real Estate 238 275 99 612
Business Services - 355 72 427
Education and Health Care - 9 171 180
Recreation and Entertainment 2,424 124 31 2,579
Lodging 449 1 - 450
Food & Beverage 2,487 50 118 2,655
Personal Services - 25 61 86
Government - 33 4 37
TOTAL 6,395 1,050 702 8,147
Source: Tourism Economics
Tourism industry generated employment

Tourism’s Impact on jobs (2 of 2)
| Tourism Economics 16
Food & Beverage
Recreation and Entertainment
Lodging
Retail Trade
FIRE*
Business Services
Other Transport
Education and Health Care
Personal Services
Gasoline Stations
Construction and Utilities
Government
Wholesale Trade
Communications
Manufacturing
Agriculture, Fishing, Mining
Air Transport
0 500 1,000 1,500 2,000 2,500 3,000
Direct
Indirect
Induced
Tourism industry generated employment, 2017
Source: Tourism Economics
Jobs*Finance, insurance and real estate

Tourism’s Impact on taxes (2 of
2)
| Tourism Economics 17
Tourism supported a total of $35
million in local government
revenue
Direct Indirect/Induced Total Total
Federal $33.5 $15.0 $48.5 State Revenues $23.2
Personal Income $12.1 $5.5 $17.7 Sales $18.6
Corporate $2.9 $1.7 $4.7 Bed Tax -
Indirect business $2.2 $1.1 $3.3 Personal Income $2.1
Social Security $16.2 $6.6 $22.8 Corporate $1.1
Social Security $0.4
State and Local $41.0 $15.7 $58.5 Excise and Fees $1.0
Sales $13.0 $3.2 $18.9 Property -
Bed Tax $2.2 - $2.2
Personal Income $1.5 $1.2 $2.1 Local Govt. Revenues $35.3
Corporate $0.7 $0.4 $1.1 Sales $0.3
Social Insurance $0.3 $0.1 $0.4 Bed Tax $2.2
Excise and Fees $1.6 $0.8 $2.4 Personal Income -
Property $21.7 $9.9 $31.4 Corporate -
Total $74.5 $30.6 $107.0 Social Security -
Source: Tourism Economics Excise and Fees $1.4
Property $31.4
Total $58.5
Source: Tourism Economics
Tourism supported
tax revenues, millions
Tourism supported tax revenue, millions
3) Methodology

How tourism generates impact
| Tourism Economics 19
Tourism spending flows through the
economy and generates economic benefit
through multiple channels
Our analysis of tourism’s impact on Sussex County starts with actual
spending by tourists, but also considers the downstream effects of this
injection of spending into the local economy. To determine the total
economic impact of tourism in Sussex County, we input tourism
spending into a model of Sussex County’s economy created in
IMPLAN. This model calculates three distinct types of impact: direct,
indirect, and induced.
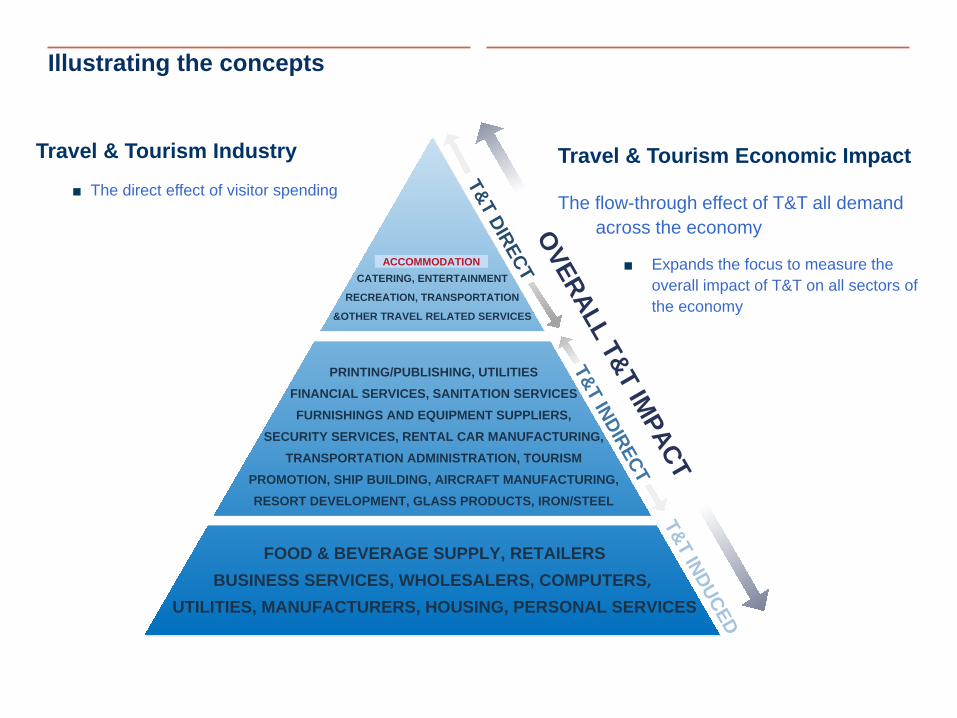
How tourism spending flows through the
economy and generates economic benefits
▪ Travelers create direct economic value within a
discreet group of sectors (e.g. recreation,
transportation). This supports a relative proportion of
jobs, wages, taxes, and GDP within each sector.
▪ Each directly affected sector also purchases goods and
services as inputs (e.g. food wholesalers, utilities) into
production. These impacts are called indirect impacts.
▪ Lastly, the induced impact is generated when
employees whose wages are generated either directly
or indirectly by tourism, spend those wages in the local
economy.
The impacts on business sales, jobs, wages, and taxes are calculated
for all three levels of impact.
ACCOMODATION
CATERING, ENTERTAINMENT
RECREATION, TRANSPORTATION
&OTHER TRAVEL RELATED SERVICES
PRINTING/PUBLISHING, UTILITIES
FINANCIAL SERVICES, SANITATION SERVICES
FURNISHINGS AND EQUIPMENT SUPPLIERS,
SECURITY SERVICES, RENTAL CAR MANUFACTURING,
TRANSPORTATION ADMINISTRATION, TOURISM
PROMOTION, SHIP BUILDING, AIRCRAFT MANUFACTURING,
RESORT DEVELOPMENT, GLASS PRODUCTS, IRON/STEEL
T&
T D
IRE
CT
T&
T IN
DIR
EC
T
T&
T IN
DU
CE
D
OV
ER
ALL T
&T IM
PA
CT
FOOD & BEVERAGE SUPPLY, RETAILERS
BUSINESS SERVICES, WHOLESALERS, COMPUTERS,
UTILITIES, MANUFACTURERS, HOUSING, PERSONAL SERVICES
Illustrating the concepts
Travel & Tourism Industry
■ The direct effect of visitor spending
Travel & Tourism Economic Impact
The flow-through effect of T&T all demand
across the economy
■ Expands the focus to measure the
overall impact of T&T on all sectors of
the economy
ACCOMMODATION


