Toward A Glycerol Based (Bio)refinery: Process Design, Simulation and Assessment of Chemocatalytic Production Paths Master’s thesis in Sustainable Energy Systems YIYU DING Department of Energy and Environment CHALMERS UNIVERSITY OF T ECHNOLOGY Gothenburg, Sweden 2017
Transcript
Toward A Glycerol Based (Bio)refinery:Process Design, Simulation andAssessment of ChemocatalyticProduction PathsMaster’s thesis in Sustainable Energy Systems
YIYU DING
Department of Energy and EnvironmentCHALMERS UNIVERSITY OF TECHNOLOGY
Gothenburg, Sweden 2017
Master’s thesis 2017
Toward A Glycerol Based (Bio)refinery:
Process Design, Simulation andAssessment of Chemocatalytic Production Paths
YIYU DING
Department of Energy and EnvironmentDivision of Energy Technology
Chalmers University of TechnologyGothenburg, Sweden 2017
Toward A Glycerol Based (Bio)refinery: Process Design, Simulationand Assessment of Chemocatalytic Production Paths
YIYU DING
Supervisor: Stavros PapadokonstantakisExaminer: Stavros Papadokonstantakis, Department of Energy and Environment
Master’s Thesis 2017Department of Energy and EnvironmentDivision of Energy TechnologyChalmers University of TechnologySE-412 96 GothenburgTelephone +46 31 772 1000
Cover: Seeing blue sky through a piece of tree leafImage credit: Scott Tew
Chalmers ReproserviceGothenburg, Sweden 2017
iv
Toward A Glycerol Based (Bio)refinery: Process Design, Simulationand Assessment of Chemocatalytic Production Paths
YIYU DING
Department of Energy and EnvironmentChalmers University of Technology
AbstractAcrylic acid is an important organic industrial chemical, widely used as a raw ma-terial in various production. Poly-acrylic acids have shown excellent performancesfor polymeric materials. The global consumption is expected to grow high up toaround 8.2 million tonnes by 2020. The conventional way of producing acrylic acidis performed by the catalytic partial oxygenation process of propylene, which is de-rived from petroleum and natural gas. This process has been highly dependent onfossil fuels for over 40 years.
Under the pressure of 2°C target and volatility of acrylic acid price due to changeablefossil fuels price, alternative methods of producing acrylic acid on industrial scaleare required for breaking the "Carbon lock-in". Renewable resources, such as glucoseand glycerol, seem to have big potential. In this project, crude glycerol is used asthe feeding stock for producing acrylic acid with acrolein as the intermediate prod-uct; the crude glycerol is considered as the byproduct of biodiesel production. Twosteps of chemical reaction are involved, namely dehydration and oxidation. Eachstep is assisted by one kind of highly efficient catalyst, which is selected based onformer literature results. Purification process is necessary for achieving high purityof acrylic acid. The simulation is performed with software Aspen Plus ®. Simulationresults show that 2.48 kg of crude glycerol can be converted to 1 kg of acrylic acidof 99.94% purity. Pinch analysis helps defining the maximum heat recovery targetand helps lower the impact of environment and operating cost by 12-14%.
The glycerol based production of acrylic acid is compared with the fossil based pro-duction of acrylic acid under EU operating conditions and a glucose based modelusing sugarcane or corn as feedstock. The comparison mainly suggests that: glyc-erol based production seems more competitive environmentally and economicallythan the glucose based one; the environmental impact is heavily influenced by thealternative use of glycerol as a waste from the biodiesel production. In places wherecrude glycerol can be used as fuel in incineration plants, it may be less environmen-tal friendly to use it for chemical production with the current status of technology;in areas where glycerol can only be treated in conventional waste treatment plants,to use glycerol for value-added production of chemicals (e.g., acrylic acid) seems avery promising method. To this end, further in-depth research is needed towards anintegrated (multi-product) glycerol biorefinery.
AcknowledgementsAfter having worked in electrical power sector (thermal mechanical part) for severalyears, industrial chemical production was an untouched area for me. The course "In-dustrial energy systems" in my first year of master study at Chalmers has inspiredme to explore some sparkles in this field.
First of all, I sincerely would like to express my gratitude to my supervisor andexaminer, Stavros Papadokonstantakis for providing me this interesting topic andletting me have opportunity of studying in this area. More than that, no matter howbusy he was, he always arranged weekly meeting with me for checking my progressand giving me valuable advice and encouraging feedbacks; and he always kept hisdoor open and offered me help. Every time after I discussed with him, I felt havingtaken a wonderful lecture. I am very grateful for his help guiding me along thisproject. Ευχαριστώ πολύ!
Furthermore, although I am the sole author in this project, I get lots of gener-ous support from my friends, especially Dixin, Chang, Oscar Gründer. Wish themall the best for their future study and work! Besides, I appreciate the nice envi-ronment in the division of Energy Technology in the Department of Energy andEnvironment. Last but not least, many thanks to my beloved mother who alwayssupports me with her endless love. 感谢您,我的母亲.
Yiyu Ding,Gothenburg, June 2017
vi
Abbreviation and Symbols
Abbreviation
AA Acrylic acidCED Cumulative energy demandEI99 Eco-indicator 99EU European UnionFePO4 Iron phosphateGCC Grand composite curveGly GlycerolGWP Global warming potentialHEN Heat exchanger networkInc IncinerationLCA Life cycle assessmentLHV Low heating valueNRTL Non-random two-liquid modelOECD Organisation for Economic Co-operation and DevelopmentOp. cost Operating costRSTOIC Stoichiometric reactorVMo-SiC Vanadiummolybdenum mixed oxides supported on silicon carbideWW Waste waterWWTP Waste water treatment plant
2.1 Overall flowchart of glucose based model . . . . . . . . . . . . . . . . 52.2 Overall flowchart of glycerol based model . . . . . . . . . . . . . . . . 62.3 Proposed mechanism of (oxy)dehydration of glycerol. Surrounded
products were detected. Oxygen helps the formation of products inred on detriment of products in green. [3] . . . . . . . . . . . . . . . . 7
3.1 Flowsheet of multi-effect evaporation of glucose based model. Theexplanation of the stream and process unit acronyms can be found inAppendix A.6, A.8, and A.9. . . . . . . . . . . . . . . . . . . . . . . . 13
3.2 Flowsheet of dehydration and purification of glucose based model.The explanation of the stream and process unit acronyms can befound in Appendix A.6, A.9, A.10 and A.11. . . . . . . . . . . . . . . 14
3.3 Flowsheet of the simulation of pre-treatment of crude glycerol frombiorefinery. The explanation of the stream and process unit acronymscan be found in Appendix A.7 and A.12. . . . . . . . . . . . . . . . . 15
3.4 Flowsheet of the simulation of dehydration of pure glycerol solution.The explanation of the stream and process unit acronyms can befound in Appendix A.7, A.13 and A.14. . . . . . . . . . . . . . . . . . 17
3.5 Flowsheet of the simulation of purification of dehydration productflow. The explanation of the stream and process unit acronyms canbe found in Appendix A.7, A.13 and A.14. . . . . . . . . . . . . . . . 18
3.6 Flowsheet of oxidation simulation. The explanation of the streamand process unit acronyms can be found in Appendix A.7, A.15 andA.16. . . . . . . . . . . . . . . . . . . . . . . . . . . . . . . . . . . . . 20
3.7 Flowsheet of the simulation of purification of oxidation product flow.The explanation of the stream and process unit acronyms can befound in Appendix A.7, A.15 and A.16. . . . . . . . . . . . . . . . . . 21
A.1 Product yield from glycerol during dehydration . . . . . . . . . . . . IA.2 Conversion of each component during oxidation . . . . . . . . . . . . IA.3 Background data for the environmental and economic assessment
with respect to resources consumption . . . . . . . . . . . . . . . . . IIA.4 Background data for the environmental and economic assessment
with respect to waste treatment . . . . . . . . . . . . . . . . . . . . . IIIA.5 Results of the environmental and economic assessment with respect
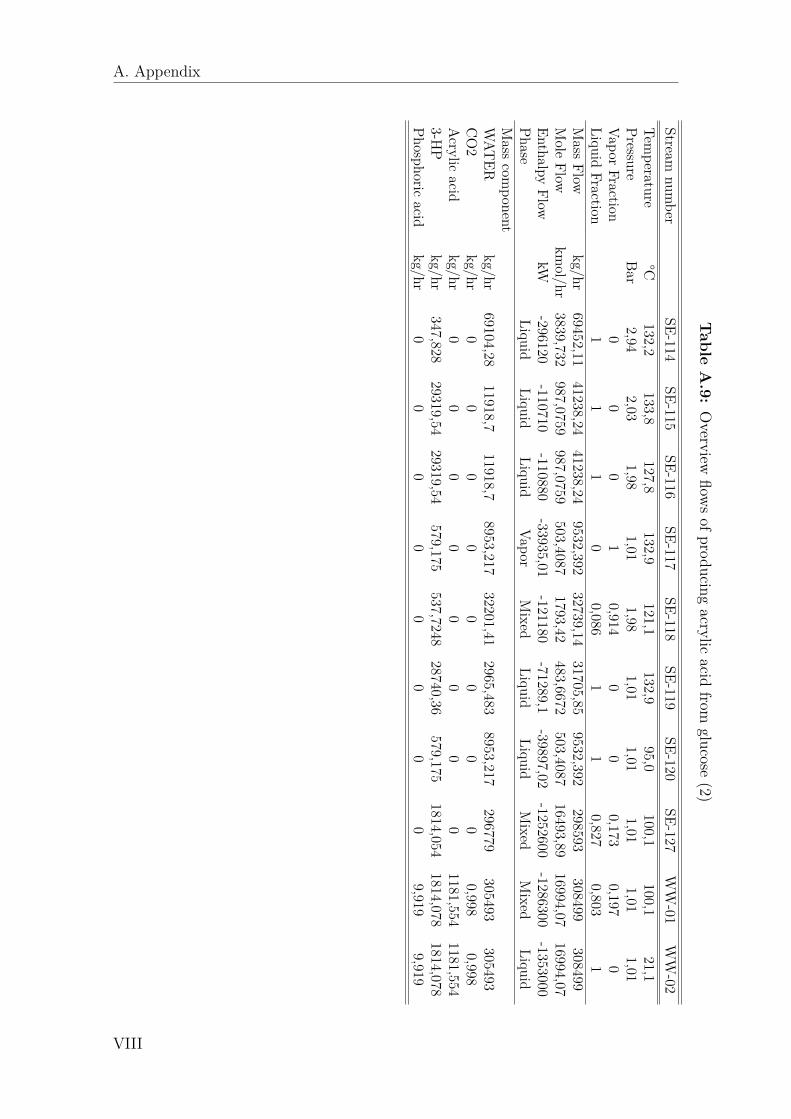
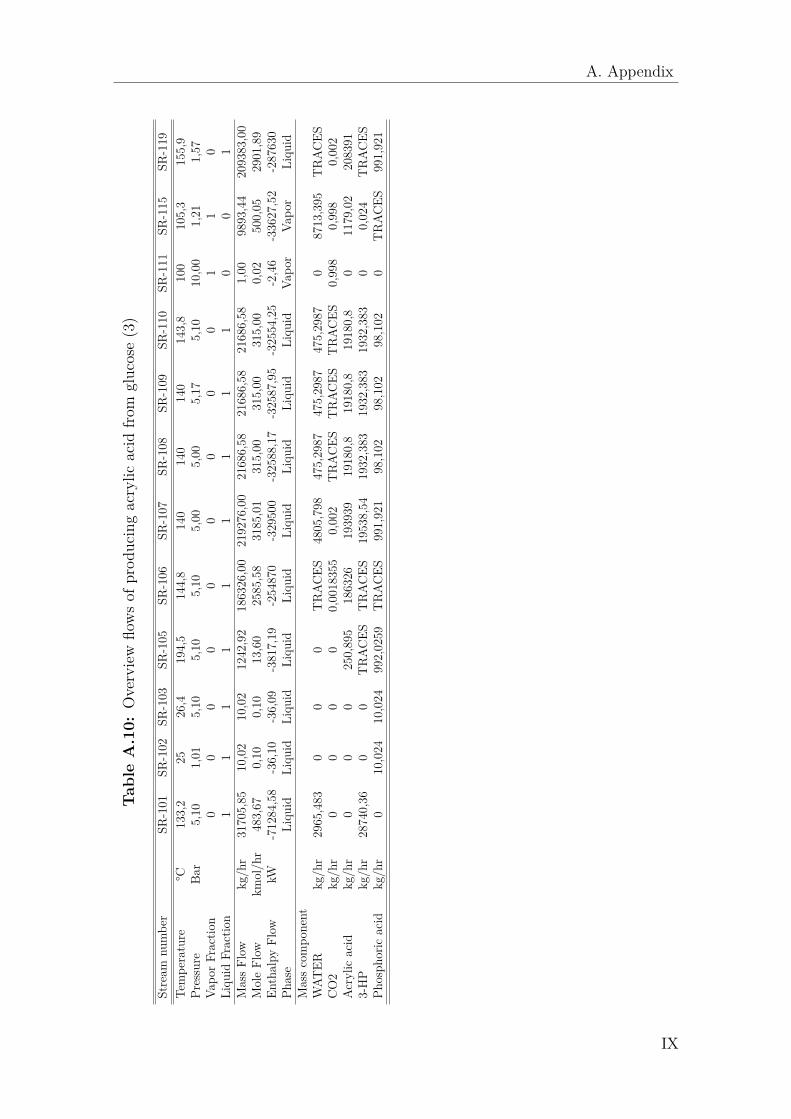
to waste treatment . . . . . . . . . . . . . . . . . . . . . . . . . . . . IIIA.6 Overview units of producing acrylic acid from glucose . . . . . . . . . IVA.7 Overview units of producing acrylic acid from glycerol . . . . . . . . . VA.8 Overview flows of producing acrylic acid from glucose (1) . . . . . . . VIIA.9 Overview flows of producing acrylic acid from glucose (2) . . . . . . . VIIIA.10 Overview flows of producing acrylic acid from glucose (3) . . . . . . . IXA.11 Overview flows of producing acrylic acid from glucose (4) . . . . . . . XA.12 Overview flows of producing acrylic acid from glycerol (1) . . . . . . . XIA.13 Overview flows of producing acrylic acid from glycerol (2) . . . . . . . XIIA.14 Overview flows of producing acrylic acid from glycerol (3) . . . . . . . XIIIA.15 Overview flows of producing acrylic acid from glycerol (4) . . . . . . . XIVA.16 Overview flows of producing acrylic acid from glycerol (5) . . . . . . . XV
xiii
List of Tables
xiv
1Introduction
1.1 BackgroundAcrylic acid, C3H4O2, is an important organic industrial chemical, that has widelybeen used as a raw material in diverse production of coatings, plastics, adhesives,paints. The total global market of acrylic acid is around 5-6 million tonnes between2013 and 2015. By the end of 2020, it is estimated that the growing consumption willbe high up to 8.2 million tonnes with revenue as $18.8 billion [5]. Polyacrylic acidshave shown excellent performances for polymeric materials, such as colour stability,resistance of heat, aging and acid, endurability at low temperature. The use fordiapers in the form of superabsorbent polymers accounts for more than one-fourthof the total consumption. This segment is the biggest driver in the market of acrylicacid, followed by coatings, sealants, water treatment and other applications [5, 6].Meanwhile, Asia-Pacific is leading the increasing demand and forecasted to be themost important area of the market by the end of 2020 [5].
Acrylic acid is dominantly produced by the catalytic partial oxygenation processof propylene, which is a by-product of the ethylene attained from petroleum andnatural gas cracking, as shown in the following equation [6]:
The process has been highly reliant on fossil fuels for over four decades and leads tothe so-called "Carbon lock-in". Under the high demand of acrylic acid as depictedabove and volatility of acrylic acid price due to changeable prices of natural gas andcrude oil, alternative synthesis methods have been studied and examined. Addi-tionally, to find a production method based on renewable feedstock to replace theconventional production process can have significant environmental benefits, e.g.,for limiting the global warming under 2 °C target [7].
1
1. Introduction
1.2 Purpose
Renewable sources, such as corn, sugar and glycerol, have gained attention on theresearch of alternative ways for producing acrylic acid.
Sugarcane and corn have been regarded as the two most favorable renewable raw ma-terials in the biofuel market for synthesizing ethanol fuel, thanks to their high energycontent and large amount of plantation, especially in the United States and Brazil[8]. Meanwhile, glucose being extracted from the two resources can be fermentedinto 3-hydroxypropionic acid (3-HP), which can be further dehydrated into acrylicacid [9]. Whereas plantation of corn and sugar has been restricted geographicallyand seasonally, price of the raw material can be unpredictable. An environmentalconcern is that it can lead to (indirect) land use change and competition for food,and have severe effect on biodiversity [8].
As for glycerol, it is typically acquired from plant and animal sources, also as aby-product from synthesis of biodiesel. Figure 1.1 illustrates that the biodiesel pro-duction is growing steadily and forecasts show that it may reach to approximately37 million metric tons in 2020 from the report of OECD [1]. Meanwhile, there is avariety of research and application of converting waste biomass, waste cooking oilsand grease into biodiesel, which makes biodiesel and glycerol greener [10, 11, 12, 13].Therefore, availability of glycerol also benefits from the widely expanding industryof biodiesel; price of crude glycerol can be as low as 100-150 USD/ ton [14]. Plenty ofresearch has been performed in order to consume the oversupply of glycerol to formcommodity chemicals [15, 16, 17], one of which is to utilize glycerol as an alterna-tive method to produce acrylic acid, especially on the fruitful findings on improvingperformance of catalysts.
Figure 1.1: Annual production of biodiesel [1]
2
1. Introduction
Figure 1.2 presents the overview of glycerol valorization processes, diverse value-added commodities can be acquired from glycerol via different chemical reactionroutes. For example, environmental and economic assessment of generation of dihy-droxyacetone and lactic acid from glycerol have been analyzed in [18, 19].
Figure 1.2: Overview of glycerol valorization processes [2]
Herein, examining the process of glycerol based biorefinery for producing acrylic acid(via acrolein as the intermediate) on an industrial scale, from aspect of technologyfeasibility to life cycle and operating cost, is the main target of this thesis.
3
1. Introduction
4
2Theory
In order to better compare and find out if the glycerol or glucose platform might bemore attractive for acrylic acid production under EU operating condition and mar-kets, the project of "Renewable Acrylic Acid" performed by a research group fromUniversity of Pennsylvania [9] is utilized as the benchmark model in this project.This benchmark model was reassessed for EU operating conditions, energy util-ity, markets, etc. The techno-economic and environmental assessment of these twosystems supported by two different types of biomass feedstock are compared anddiscussed. This chapter mainly describes the main chemical reactions of the twosystems.
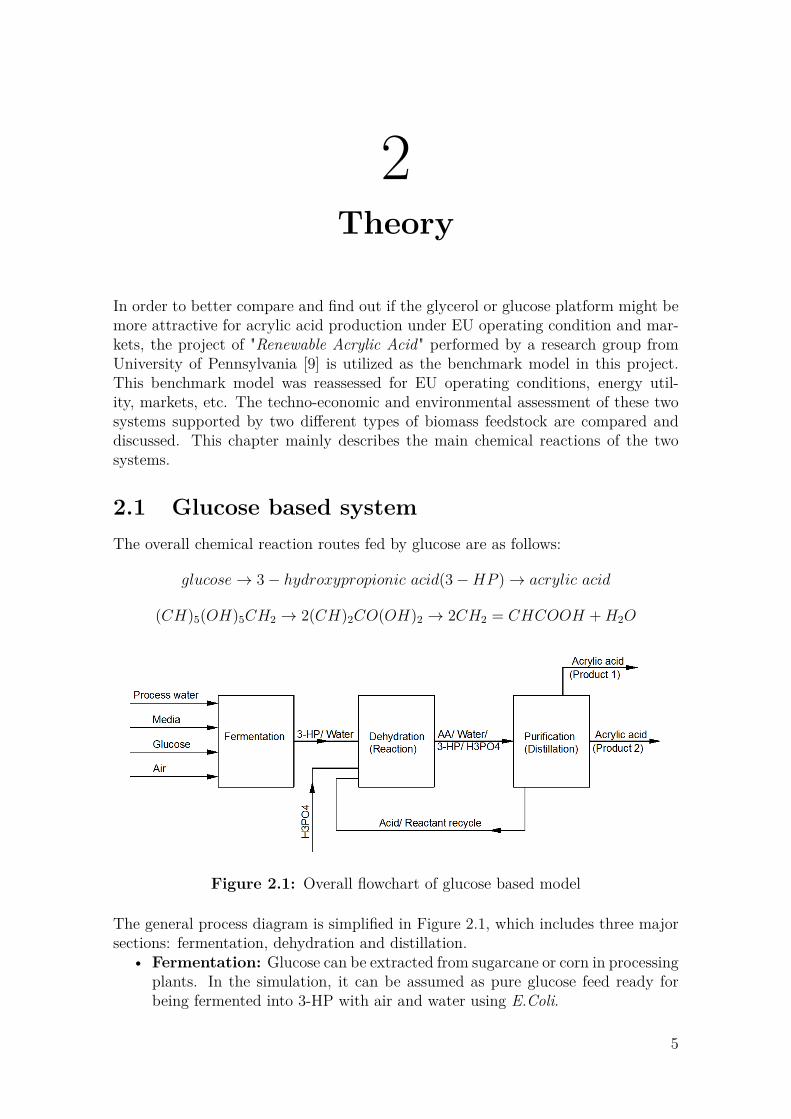
2.1 Glucose based systemThe overall chemical reaction routes fed by glucose are as follows:
Figure 2.1: Overall flowchart of glucose based model
The general process diagram is simplified in Figure 2.1, which includes three majorsections: fermentation, dehydration and distillation.
• Fermentation: Glucose can be extracted from sugarcane or corn in processingplants. In the simulation, it can be assumed as pure glucose feed ready forbeing fermented into 3-HP with air and water using E.Coli.
5
2. Theory
• Dehydration: The 3-HP stream is sent to the reactor, where 3-HP is con-verted into acrylic acid with the assistance of the catalyst phosphoric acid.The subsequent reactive distillation tower promotes further conversion of theunreacted 3-HP by removing excess water in the product flow.
• Distillation: The resulting product flow is further distillated and partiallyrecycled back to the reactor in order to achieve the almost complete yield ofacrylic acid. Most of the catalyst can be recycled back to the reactor withsmall amount being purged and make-up fresh catalyst fed in simultaneously.
2.2 Glycerol based systemFrom Figure 1.2, two main chemical reaction processes are required to produceacrylic acid with acrolein as the intermediate product, namely dehydration and ox-idation. Figure 2.2 simply illustrates the overall conceptual diagram of glycerolbased model. The raw material is crude glycerol, and the purity of final product,acrylic acid, is required to be high above 99.9 % as the benchmark model. Thewhole model is made up by pre-treatment of crude glycerol, dehydration and oxi-dation with purification. After purification, each organic/ anorganic waste streamshall be checked in order to decide the way of waste treatment for lowering theirenvironmental impact.
Figure 2.2: Overall flowchart of glycerol based model
2.2.1 DehydrationWithin the aspect of chemistry and biological research, dehydration refers to a chem-ical reaction leading to loss(es) of water molecule(s) under the aid of catalysts ac-celerating the whole reaction without changing the reaction mechanisms. Brønstedacid catalyst usually assists the reaction by improving the poor leaving group, hy-droxyl group (-OH) into the better leaving group (˘OH+
2 ) via protonation.
There are two-step losses of water during dehydration to form acrolein as the wantedproduct, shown in the following equations:Step 1: glycerol→ 3− hydroxypropanal +H2OStep 2: 3− hydroxypropanal→ acrolein+H2O
6
2. Theory
3-hydroxypropanal, which is produced after the first loss of water, is not easy to bedetected mainly because the following reaction is too fast and 3-hydroxypropanalis quite unstable. Also, retroaldol effect can induce 3-hydroxypropanal to formacetaldehyde and formaldehyde, which may further lead to many other by-productsas well [3, 20].
Figure 2.3: Proposed mechanism of (oxy)dehydration of glycerol. Surroundedproducts were detected. Oxygen helps the formation of products in red on detrimentof products in green. [3]
Figure 2.3 exhibits almost all the possible reaction routes during dehydration ofglycerol. Based on the laboratory result [3], the following reactions happened indehydration when catalyst FePO4 is chosen with nitrogen as carrier gas. The mainproduct is acrolein, there are diverse by-products detected, such as acetaldehyde,propanal, formic acid; formation of COx, solid carbon deposited on the catalyst andunknown products account for missing carbon.
It can be seen that oxygen is needed for synthesis of several by-products, such asformic acid, propanoic acid, acrylic acid and CO2. Although there is no oxygen inthe feeding stream, all the required oxygen is assumed to be released from the cata-lyst, FePO4. Maximum 20 % of the catalyst oxygen can be considered to take placein the reactions; this value was estimated by the catalyst team of ETH. Oxygen flowacquired from the catalyst can be roughly calculated as:
O2 flow = weight of FePO4 × oxygen released from catalyst× 4151g/mol × 2× duration hours .
Duration refers to continuance of the reaction in batch conditions. The limited oxy-gen flow constraints the production yield of these hydro-oxidized by-products. Theassumed conversion of glycerol and yield of each product is listed in Appendix A.1
Meanwhile, hydrogen shall be involved in the generation of propanal, acetone, 2-propen-1-ol and propanoic acid. Hydrogen can be produced through intermediates,formic acid and propane-1,2-diol 1 ; the reactions are simplified as Equation 2.8 andEquation 2.9. The actual mechanism routes are as follows:via formic acid:
1At present fossil fuels is still contributing most of hydrogen production by means of steamreforming of methane extracted from natural gas and gasification of coal. This conventional gen-eration of hydrogen at industrial scale is much like that of acrylic acid, which is desperately neces-sary to be broke. Although fraction contributed by biomass and water electrolysis is small, to usebiomass (such as glycerol) and formic acid is regarded as renewable chemical synthesis approachfor producing hydrogen [21, 22, 23].
9
2. Theory
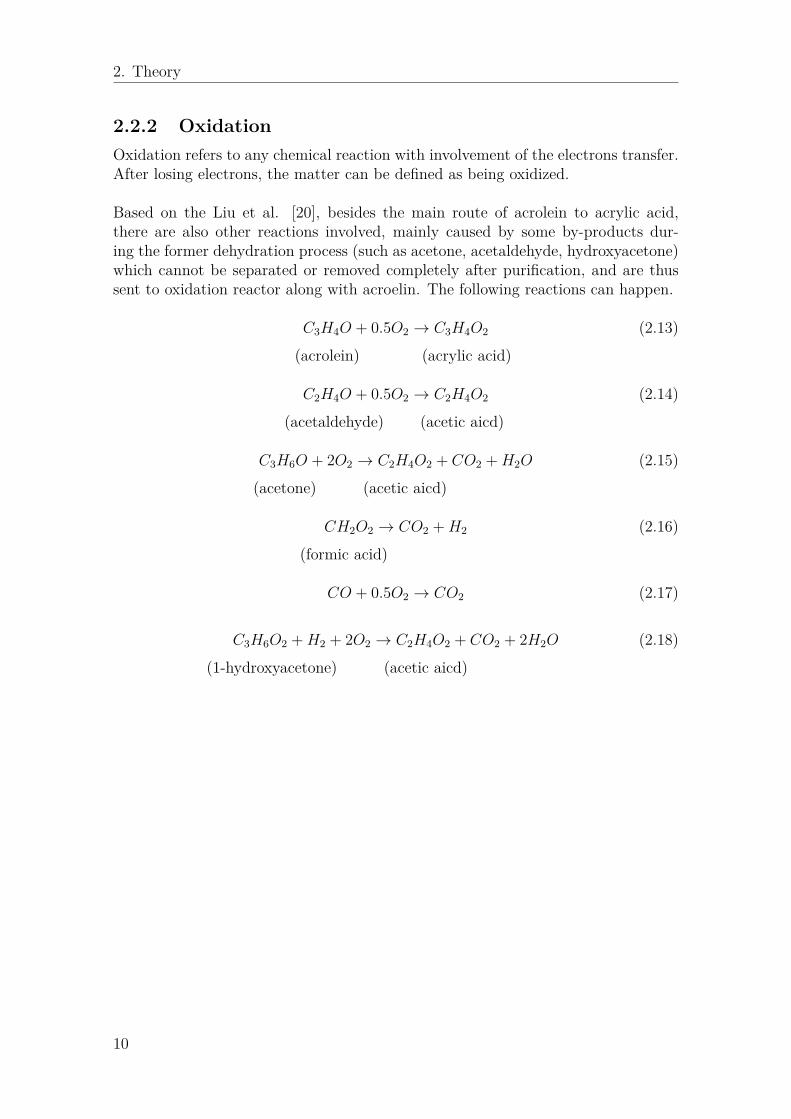
2.2.2 OxidationOxidation refers to any chemical reaction with involvement of the electrons transfer.After losing electrons, the matter can be defined as being oxidized.
Based on the Liu et al. [20], besides the main route of acrolein to acrylic acid,there are also other reactions involved, mainly caused by some by-products dur-ing the former dehydration process (such as acetone, acetaldehyde, hydroxyacetone)which cannot be separated or removed completely after purification, and are thussent to oxidation reactor along with acroelin. The following reactions can happen.
C3H4O + 0.5O2 → C3H4O2 (2.13)
(acrolein) (acrylic acid)
C2H4O + 0.5O2 → C2H4O2 (2.14)
(acetaldehyde) (acetic aicd)
C3H6O + 2O2 → C2H4O2 + CO2 +H2O (2.15)
(acetone) (acetic aicd)
CH2O2 → CO2 +H2 (2.16)
(formic acid)
CO + 0.5O2 → CO2 (2.17)
C3H6O2 +H2 + 2O2 → C2H4O2 + CO2 + 2H2O (2.18)
(1-hydroxyacetone) (acetic aicd)
10
3Methods
This chapter describes the methodology about the simulation and calculation of theprocess models for producing acrylic acid from glucose and glycerol, respectively.The simulation models are built up in software Aspen Plus ® V8.8. The mainprinciples and assumptions of pinch analysis for heat integration are also explainedat the end of this chapter.
3.1 General method settings in Aspen Plus®
Thermophysical properties in the simulation are calculated using the NRTL method(non-random two-liquid model). It is a state-of-art activity coefficient model andapplicable to handle polar and non-polar compounds by providing a broad elec-trolyte thermodynamic configuration. The NRTL method is suitable to manage thechemical system of the acidic reaction involving ideal gases, organics mix with thepresence of water within this project [24, 25].
For the removal of unwanted substances from flow streams, distillation is an im-portant method of purification to achieve required high purities of final products.Distillation columns of RadFrac equilibrium stage model equipped with condenserand reboilers are chosen for the purification [26]. The actual absorption and distil-lation are affected by process kinetics. However, the process kinetics are neglectedat this stage, since no capital cost assessment is performed. Thus, this shortcutand rigorous methods is sufficient to design the near steady-state operation process[27, 25, 26]. Both dehydration and oxidation reaction taking place in reactors aremodeled by stoichiometric reactor (RSTOIC) in Aspen Plus®.
11
3. Methods
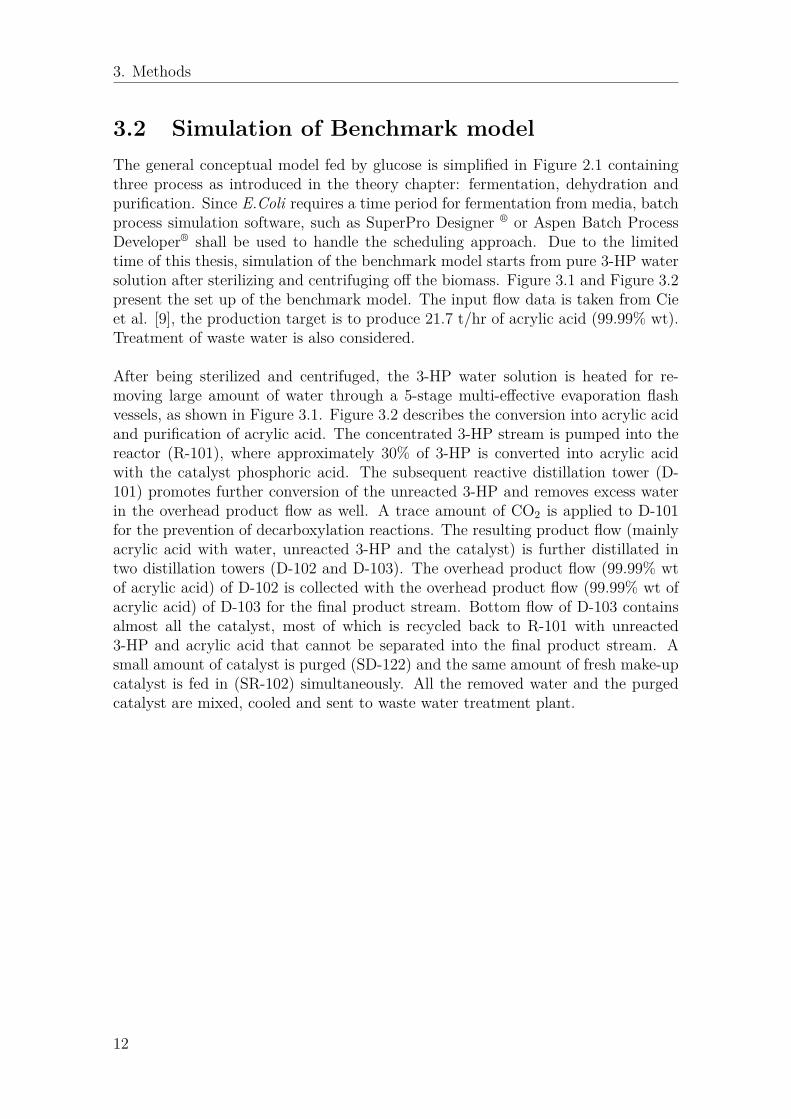
3.2 Simulation of Benchmark modelThe general conceptual model fed by glucose is simplified in Figure 2.1 containingthree process as introduced in the theory chapter: fermentation, dehydration andpurification. Since E.Coli requires a time period for fermentation from media, batchprocess simulation software, such as SuperPro Designer ® or Aspen Batch ProcessDeveloper® shall be used to handle the scheduling approach. Due to the limitedtime of this thesis, simulation of the benchmark model starts from pure 3-HP watersolution after sterilizing and centrifuging off the biomass. Figure 3.1 and Figure 3.2present the set up of the benchmark model. The input flow data is taken from Cieet al. [9], the production target is to produce 21.7 t/hr of acrylic acid (99.99% wt).Treatment of waste water is also considered.
After being sterilized and centrifuged, the 3-HP water solution is heated for re-moving large amount of water through a 5-stage multi-effective evaporation flashvessels, as shown in Figure 3.1. Figure 3.2 describes the conversion into acrylic acidand purification of acrylic acid. The concentrated 3-HP stream is pumped into thereactor (R-101), where approximately 30% of 3-HP is converted into acrylic acidwith the catalyst phosphoric acid. The subsequent reactive distillation tower (D-101) promotes further conversion of the unreacted 3-HP and removes excess waterin the overhead product flow as well. A trace amount of CO2 is applied to D-101for the prevention of decarboxylation reactions. The resulting product flow (mainlyacrylic acid with water, unreacted 3-HP and the catalyst) is further distillated intwo distillation towers (D-102 and D-103). The overhead product flow (99.99% wtof acrylic acid) of D-102 is collected with the overhead product flow (99.99% wt ofacrylic acid) of D-103 for the final product stream. Bottom flow of D-103 containsalmost all the catalyst, most of which is recycled back to R-101 with unreacted3-HP and acrylic acid that cannot be separated into the final product stream. Asmall amount of catalyst is purged (SD-122) and the same amount of fresh make-upcatalyst is fed in (SR-102) simultaneously. All the removed water and the purgedcatalyst are mixed, cooled and sent to waste water treatment plant.
12
3. Methods
Figure 3.1: Flowsheet of multi-effect evaporation of glucose based model. Theexplanation of the stream and process unit acronyms can be found in AppendixA.6, A.8, and A.9.
13
3. Methods
Figure 3.2: Flowsheet of dehydration and purification of glucose based model. Theexplanation of the stream and process unit acronyms can be found in Appendix A.6,A.9, A.10 and A.11.
14
3. Methods
3.3 Simulation of Glycerol based modelThe overall conceptual diagram of glycerol based model is simply shown in Figure2.2 including pre-treatment, dehydration (purification) and oxidation (purification).Additionally, pumps and fans are considered for compensation of potential pipingpressure losses. The simulation flowsheets are shown below.
3.3.1 Simulation of Pre-treatment of crude glycerolCrude glycerol is commonly composed by around 80 % of glycerol with small amountof water, fatty acid, ash and methanol. The impurities are expected to be removedthrough heating, evaporation and separator as much as possible in order to reachhigher conversion of glycerol in next phase. The acquired pure glycerol is dilutedwith process water up to 40 wt% of glycerol. The process layout of the crude glycerolpretreatment is presented in Figure 3.3.
Figure 3.3: Flowsheet of the simulation of pre-treatment of crude glycerol frombiorefinery. The explanation of the stream and process unit acronyms can be foundin Appendix A.7 and A.12.
3.3.2 Simulation of Dehydration processNext step is to dehydrate the glycerol. After taking data from J.Deleplanque etal.[3], the glycerol solution is set to be heated up to 280 °C and introduced to Re-actor 1 by pure nitrogen as carrier gas. The reason of adopting two heaters is thatheaters can be fueled by different heating utilities separated by temperature levels.More specifically, it seems more economical to import low pressure and mediumpressure steam to heat up to 200 °C at first; this can be followed by a furnace fueledby natural gas to heat up to 280 °C. In other words, it is assumed that if highpressure steam is generated in the plant, this is first expanded in steam turbines
15
3. Methods
to produce electricity and medium to low pressure steam, which is then used forheating purposes.
Since 3-hydroxypropanal is hardly being traced, the main dehydration process hasbeen compacted as glycerol → acrolein + 2H2O. It has been tested that acroleinyield by using FePO4 as catalyst drops from above 90% at first time of test sharplydown to 66% after using it 4 times under batch operation conditions [28]. There arenot many studies focusing on the regeneration ability of this catalyst yet [28, 29, 20],and FePO4 can be easily purchased on the market [30]. Additionally, results of somelaboratory experiment for testing catalyst performance of converting glycerol intoacrolein are gathered after 70 hours [19, 20]. Hence, the catalyst FePO4 is assumedto get changed completely every 70 hours without regeneration in this simulation.
Acidity of catalyst helps the dehydration process by improving selectivity of glycerolto acrolein, it also causes coke formation and deposit on the catalyst, which deacti-vates the catalyst at some extent and explains the decrease of catalyst performanceas well. Meanwhile, hydrogen can come out with coke formation from glycerol,as shown in Equation 2.11. For simplicity, solid carbon is assumed to be removedthrough the block "Separator", without rigorous modelling of this separation process.
In order to acquire pure acrolein, which is the most volatile component in thissystem, both flash and distillation units are combined for purification, as presentedin Figure 3.5. The products flow with unreacted glycerol and gases (i.e., N2, H2) arecooled down to 15°C in cooler HX-PR-11 for condensing part of vapor. Pressurizedflash is needed to remove gases and trap acrolein in liquid phase for further separa-tion. Since the cooled stream is mixed gas/liquid (mainly due to large amount ofinert gas being involved), the temperature increase of the two-phase flow is largelydifferent after being pressurized. As for liquid, the increase can be neglected, whilefor vapor, the increase can be calculated as: T02 − T01 = T01
η
[(p02p01
)γ−1
γ − 1][31]. In
Aspen Plus this can be modelled as follows. The flash vessel F-01 is used to splitthe stream into vapor and liquid at 1 bar and 15 °C. Afterwards, the vapor andthe liquid is pressurized to 9 bar through a compressor and a pump, respectively,and then mixed again in flash vessel F-02 for removing gases. The left acrolein andother by-products (all in liquid phase) is sent to distillation column D-01 for furtherseparation. The separated acrolein (in vapor phase at this point) flows into theoxidation section.
For increasing total efficiency and lowering the cost of raw material and environ-mental impact as well, recycle of unreacted glycerol back to Reactor 1 is considered.Figure 3.4 and 3.5 describe explicitly the flowsheet in dehydration.
16
3. Methods
Figure 3.4: Flowsheet of the simulation of dehydration of pure glycerol solution.The explanation of the stream and process unit acronyms can be found in AppendixA.7, A.13 and A.14.
17
3. Methods
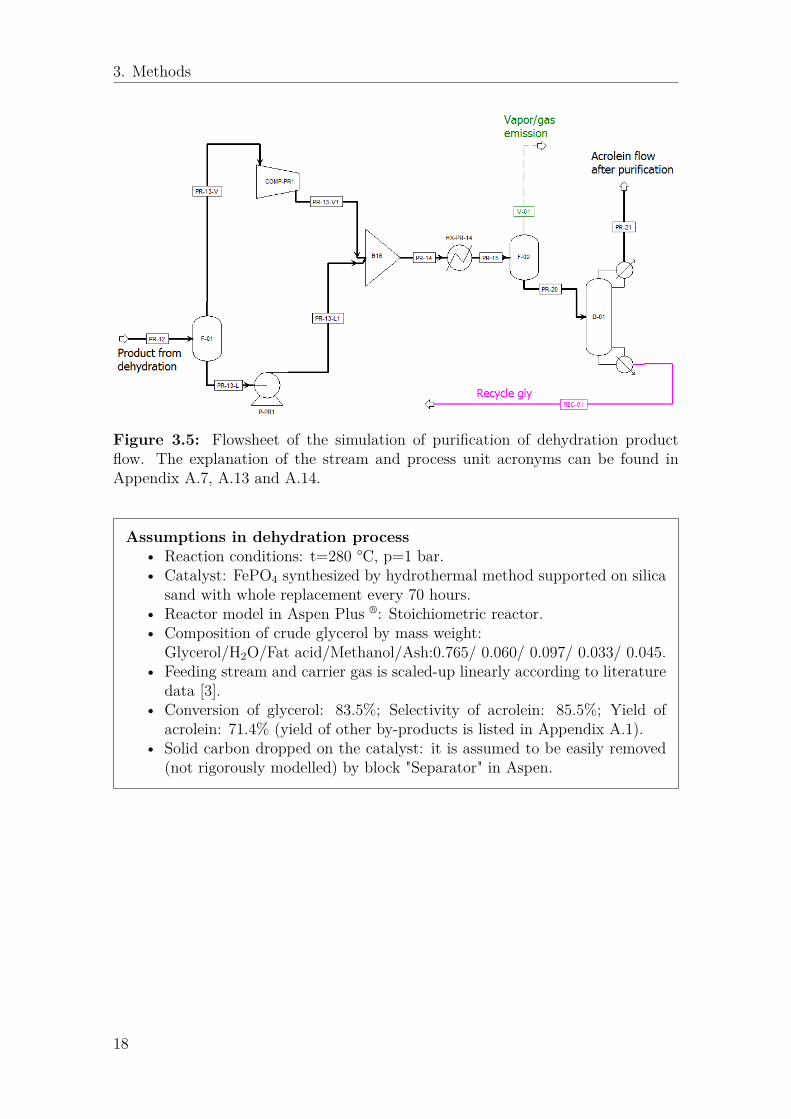
Figure 3.5: Flowsheet of the simulation of purification of dehydration productflow. The explanation of the stream and process unit acronyms can be found inAppendix A.7, A.13 and A.14.
Assumptions in dehydration process• Reaction conditions: t=280 °C, p=1 bar.• Catalyst: FePO4 synthesized by hydrothermal method supported on silica
sand with whole replacement every 70 hours.• Reactor model in Aspen Plus ®: Stoichiometric reactor.• Composition of crude glycerol by mass weight:
Glycerol/H2O/Fat acid/Methanol/Ash:0.765/ 0.060/ 0.097/ 0.033/ 0.045.• Feeding stream and carrier gas is scaled-up linearly according to literature
data [3].• Conversion of glycerol: 83.5%; Selectivity of acrolein: 85.5%; Yield of
acrolein: 71.4% (yield of other by-products is listed in Appendix A.1).• Solid carbon dropped on the catalyst: it is assumed to be easily removed
(not rigorously modelled) by block "Separator" in Aspen.
18
3. Methods
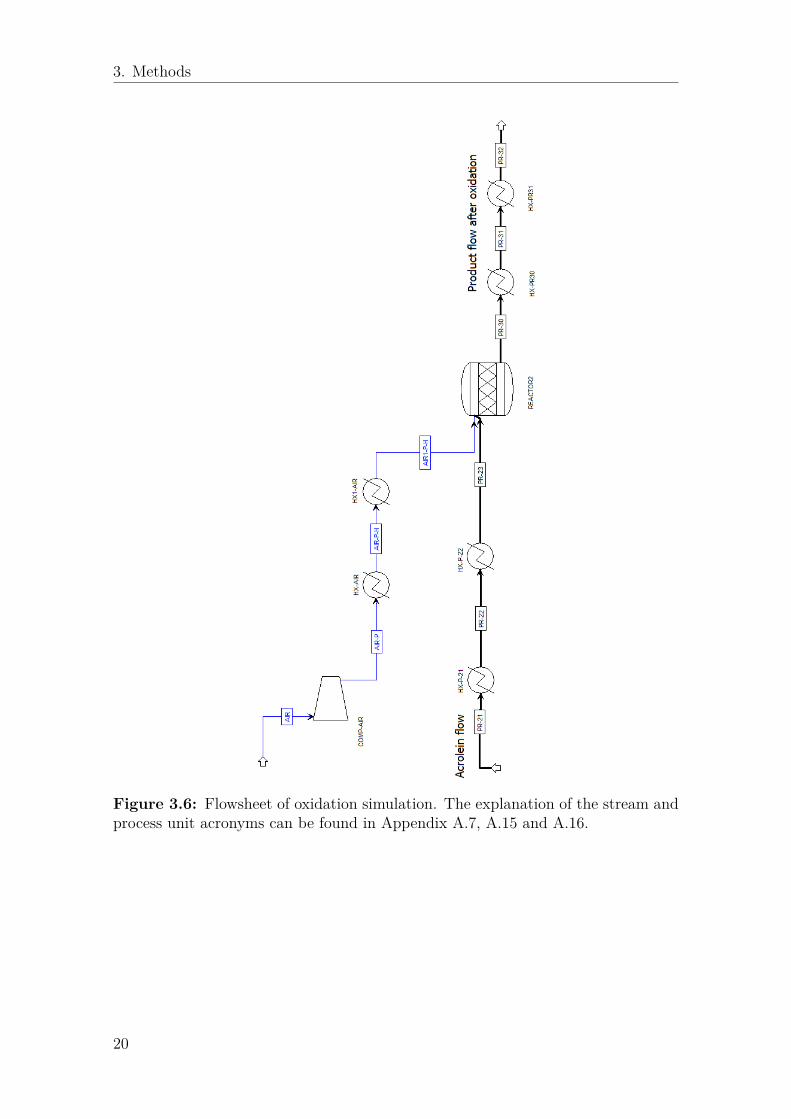
3.3.3 Simulation of Oxidation processThe last process step is to oxidize acrolein for producing high purity acrylic acid.Based on the result from Liu et al. [20], acrolein streams and carrier gas, air, haveto be heated up to 300 °C at atmospheric pressure before entering Reactor 2. Vana-diummolybdenum mixed oxides supported on silicon carbide (VMo-SiC) has beenchosen as catalyst for the reaction. This catalyst has high performance during 70-hour experiment and remain stable at 500°C during coke burning for regeneration[20]. Both nearly complete conversion of acrolein and highest selectivity to acrylicacid can be reached when molar ratio of oxygen/ acrolein is set at 12.5 under thereaction conditions above [20].
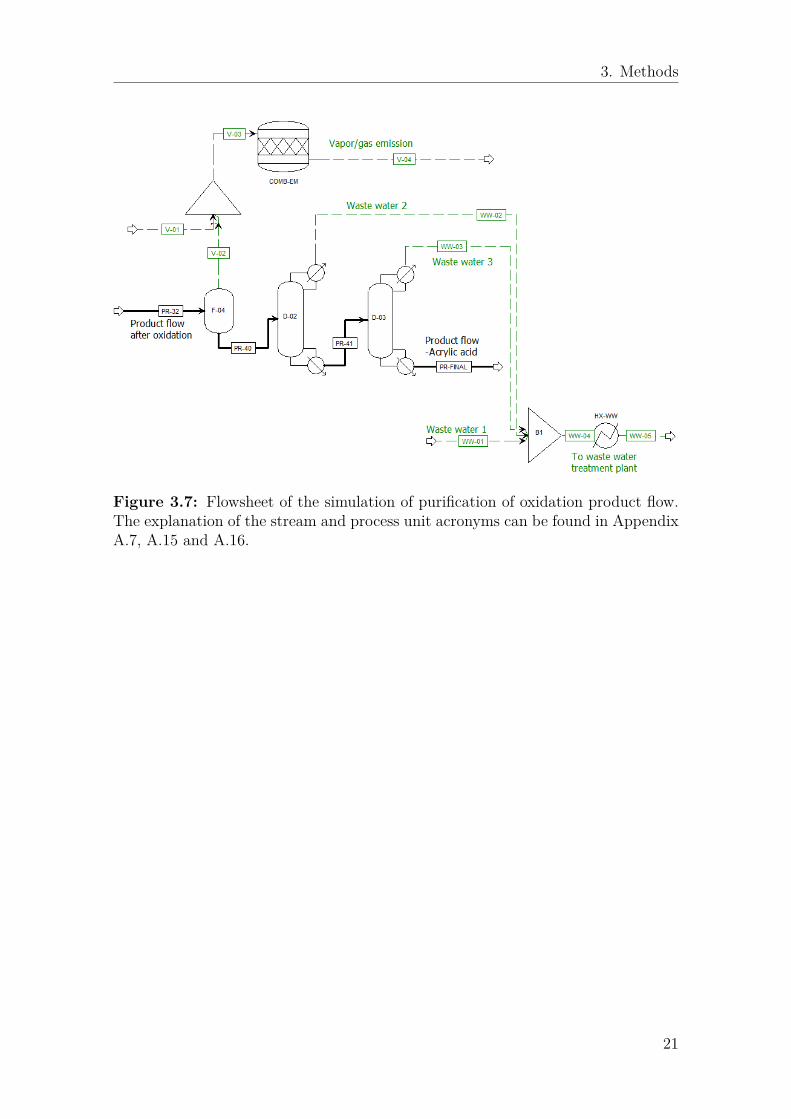
The reactor outlet stream is cooled down in two steps, first using cooling wateruntil 15 °C and then a brine solution until 0 °C. After removing the gases such asO2, N2, H2 and CO2 in the flash vessel F-04, the liquid part is concentrated in twodistillation columns D-02 and D-03 to produce pure acrylic acid (> 99.9%). Thewater streams are sent to conventional waste water treatment plants.
Figure 3.6 and Figure 3.7 present the flowsheets during oxidation and the successivepurification in detail.
Assumptions in oxidation process• Reaction conditions: t=300 °C, p=1 bar.• Catalyst: V-Mo supported on silica sand with regeneration every 70 hours
and whole replacement every 700 hours. Energy for regeneration processis considered.
• Reactor model in Aspen Plus ®: Stoichiometric reactor.• Air/Acrolein: 62.5/ 1 (mol/mol) (Oxygen/Acrolein: 12.5:1 (mol/mol))• The conversion of acrolein and acetaldehyde, and yield of each product is
calculated on the basis of literature data.• Yield of acrylic acid from acrolein: 95%. Conversion of other by-products
from the dehydration section is listed in Appendix A.2.
19
3. Methods
Figure 3.6: Flowsheet of oxidation simulation. The explanation of the stream andprocess unit acronyms can be found in Appendix A.7, A.15 and A.16.
20
3. Methods
Figure 3.7: Flowsheet of the simulation of purification of oxidation product flow.The explanation of the stream and process unit acronyms can be found in AppendixA.7, A.15 and A.16.
21
3. Methods
3.4 Pinch analysisFrom the flowcharts above, several hot and cold streams with large amount of heatand cold demand are involved in the flow system. Pinch analysis is a well-developedmethodology for realizing minimum energy requirement by defining the thermody-namically maximum energy recovery target. This methodology has been widelyadopted in industrial chemical plants for optimizing heat recovery, operating condi-tions and enhancing the whole thermal energy efficiency both for grass-root designand retrofit of heat exchanger network (HEN) [4]. In this project, pinch analysisand simple HEN design is performed by software Pro_pi2, which is developed byDepartment of Energy and Environment at Chalmers University of Technology.
Figure 3.8: Annual cost v.s. ∆Tmin [4]
Increasing ∆Tmin pushes up energy costs by increasing driving forces, while lowerscapital costs simultaneously [4]. Typically, ∆Tmin is best chosen in the wide and flatregion as pointed by the arrow in Figure 3.8. However, calculation of capital costsis not within the scope of this project. Also, for simplicity, only global temperaturedifference is used to estimate the energy target, and three levels are selected forsensitivity analysis: ∆Tmin=10K, ∆Tmin=20K and ∆Tmin=40K.
After cascading all the thermal streams (without distillation columns), the grandcomposite curve (GCC) defines the process pinch point, from which heat sink (abovepinch point, absorbing heat) and heat source (below pinch point, releasing heat) canalso be defined [4]. Endothermal and exothermal reactors can be also considered inthe heat integration, although in some cases for safety and operability reasons thisintegration potential may be restricted.
Maximum energy recovery target is the difference value between heat demand andminimum heat demand defined by pinch analysis. In practice, 40-70% of this targetis expected to be realised (i.e., approximate position of the minimum in Figure 3.8)by adding heat exchangers for optimizing overall thermal efficiency.
22
3. Methods
3.5 Assessment of techno-economic cost and en-vironmental impacts
Both economic and environmental performance of the two models (benchmark modeland glycerol based model) is performed. From economic aspect, only operating cost(Op. cost) is considered in this project expressed per kg of product. Three indica-tors regarding life-cycle assessment (LCA) are used for assessing environmental andecological impact from the chemical production, namely cumulative energy demand,eco-indicator 99 and global warming potential.
Cumulative energy demand (CED) is an indicator for assessing the energy inten-sity during the production life cycle, measured as equivalent mega-joule of energydemand needed to produce 1 kg of product [32, 33]. Global warming potential(GWP) measures the greenhouse gas emission associated with the production of 1kg of product measured in equivalent CO2 emission. Several time intervals, such as20, 100 and 500 years, are usually used for estimation of GWP [34]. Eco-indicator99 (EI99) expresses the environmental relevance of a product or system in the formof an aggregated figure for producing 1 kg of product. Three kinds of damages areconsidered in EI99: human health, ecosysem quality and resource depletion [33, 35].
Generally speaking, the higher scores of each indicator means more money is re-quired for running the industrial process and /or less friendly that the process is tothe environment.
The substances needed to be summarized in the assessment of benchmark modelcontain three groups: raw material, utility and waste treatment. Process water,glucose, nutrient feed, CO2 and phosphoric acid belong to the category of raw ma-terial; heat, electricity and cooling water are considered in the category of utility;waste treatment group refers only to waste water treatment. Input data of processwater, glucose, nutrient feed, phosphoric acid, heat (for fermentation), and electric-ity are taken from Cie et al. [9]; result of 3-HP to acrylic acid part is used forinput data of heating duties of reboilers, cooling water and waste water treatment.The substances needed to be outlined in the assessment of glycerol based model arealso grouped in the three categories. Raw material category includes crude glycerol,catalysts and process water; utilities include heating utility (heat and natural gas),cooling utility (cooling water and cooling medium for cooling down to 0 °C), nitro-gen and electricity; lastly, CO2 emission, catalyst disposal, ash disposal, waste watertreatment and incineration of waste vapor/ gases are considered in waste category.
There are two thinking ways of dealing with crude glycerol, one is to use crudeglycerol as fuel for incineration and acquire thermal energy, and the other one is toregard glycerol as waste to be treated in conventional waste treatment plants 1. Theformer one is commonly seen in developed countries where advanced technologies are
1There are also other alternative ways of treating crude glycerol, e.g., to give it as feed toanimals or for landfilling, but these have not been considered in this study.
23
3. Methods
used for removing the toxic substances from burning waste, such as Sweden, whicheven imports waste from other countries for running the domestic waste-to-energypower plants [36, 37, 38]; the latter one is mostly adopted in less developed countrieswith lack of expertise in operating waste incineration plants and other regulationconstraints. In this project the crude glycerol is expected to be used for chemicalproduction as the alternative method of the two kinds of treatment above. Herein,two scenarios regarding crude glycerol both for incineration and for being disposedin waste treatment plant are presented and discussed in next chapter. Backgrounddata of glycerol for incineration is used in gly-Scenario 1 and that of glycerol forwaste water treatment in gly-Scenario 2.
Most of the reference background data of each substance is acquired from ecoinvent[30,39]; waste water treatment and incineration is calculated with Rerat et al.[40]. Un-fortunately, there are still some missing information for the assessment. Backgrounddata of catalyst FePO4-H with its supporter and disposal of catalyst V-Mo with itssupporter is hardly found. Thus, background data of zeolites including its disposalis used for the estimation.
The detailed background description of each substance is listed in Appendix A.3.
Assumptions in economic cost and environmental impacts assessment• CED, EI99, GWP and operating cost of crude glycerol used both for in-
cineration and for waste treatment are chosen for the assessment.• Due to missing information, CED, EI99 and GWP of FePO4 and its dis-
posal is assumed as those of zeolites and its disposal; purchase cost ofFePO4 is assumed at its market price $4.5/kg [30].
• CED, EI99, GWP and purchase cost of V-Mo disposal is assumed as thoseof zeolites disposal.
• There is no money needed to be paid for disposal of catalyst and ash (fromcrude glyerol), which only has the environmental concerns.
24
4Results
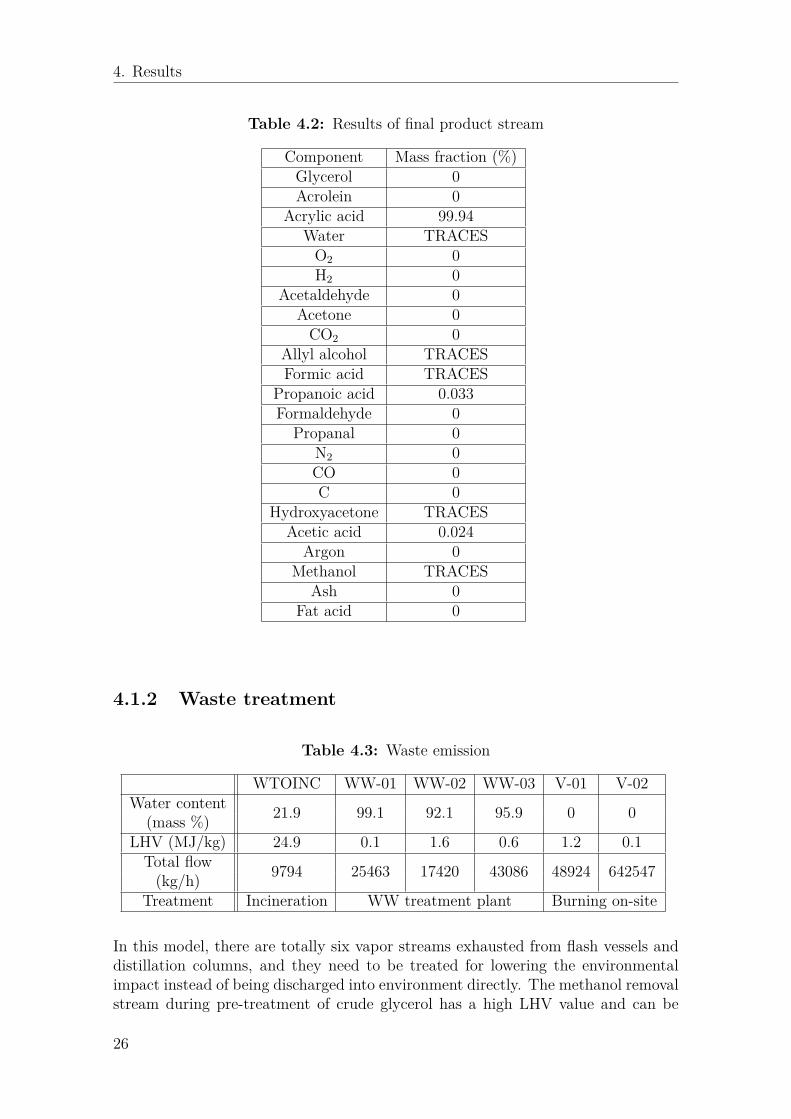
4.1 Simulation results of glycerol based model4.1.1 Results of key streams2.48 kg of crude glycerol has been successfully converted into 1 kg of acrylic acidof high purity (99.94%wt). Mole flow of glycerol, acrolein and acrylic acid in theprocess key streams are listed in Table 4.1. Nearly 2% of glycerol has been lost afterpreliminary treatment of crude glycerol. Owing to its high boiling temperature(300 °C at 1 bar), almost all the unreacted glycerol has been easily recycled back toReactor 1. Although acrolein is very volatile and mixed with diverse by-products andinert gases, 92.4% of this main dehydration product has been successfully kept in theflow to Reactor 2. On the other hand, although the highly efficient catalyst has beenselected for oxdiation by turning 95% of acrolein into acrylic acid, 12% of acrylicacid is lost to waste streams after two-column purification. This is mainly becauseof involvement of large amount of water, inert gases and various by-products makingthis purification step challenging. The composition of the final product stream canbe seen in Table 4.2.
Table 4.1: Results of key streams
Step Component Name of steam Flow (kmol/hr)
Pre-treatmentTot. crude glycerol CRUDGLY 732.3Glycerol in crude gly CRUDGLY 467
Glycerol after treatment GLY GAS0 457
Dehydration Acrolein PR− 10 390.3Acrolein after purification PR− 21 360.7
In this model, there are totally six vapor streams exhausted from flash vessels anddistillation columns, and they need to be treated for lowering the environmentalimpact instead of being discharged into environment directly. The methanol removalstream during pre-treatment of crude glycerol has a high LHV value and can be
26
4. Results
incinerated for acquiring thermal energy. Water content in stream WW-01, WW-02and WW-03 is higher than 90 %, hence, these three streams shall be mixed andcooled down to 15 °C before being sent to waste water treatment plant; the LHVand water content of both stream V-01 and stream V-02 are rather low and areburnt on-site to avoid direct release of organic substances. The results are listed inTable 4.3.
4.1.3 Column designTable 4.4 presents the main column design parameters. Although no capital cost as-sessment was performed, the column design follows industrial guidelines with respectto the height/diameter ratio [41]. It can also be easily observed that the reboilerduty accounts for a significant amount of energy consumption. Considering that21.7 t/hr acrylic aicd is produced, the three reboiler duties sum up to approximate25 MJ-heat/kg of acrylic acid. This is mainly caused by the tough purification taskeven reflux ratio is set quite low.
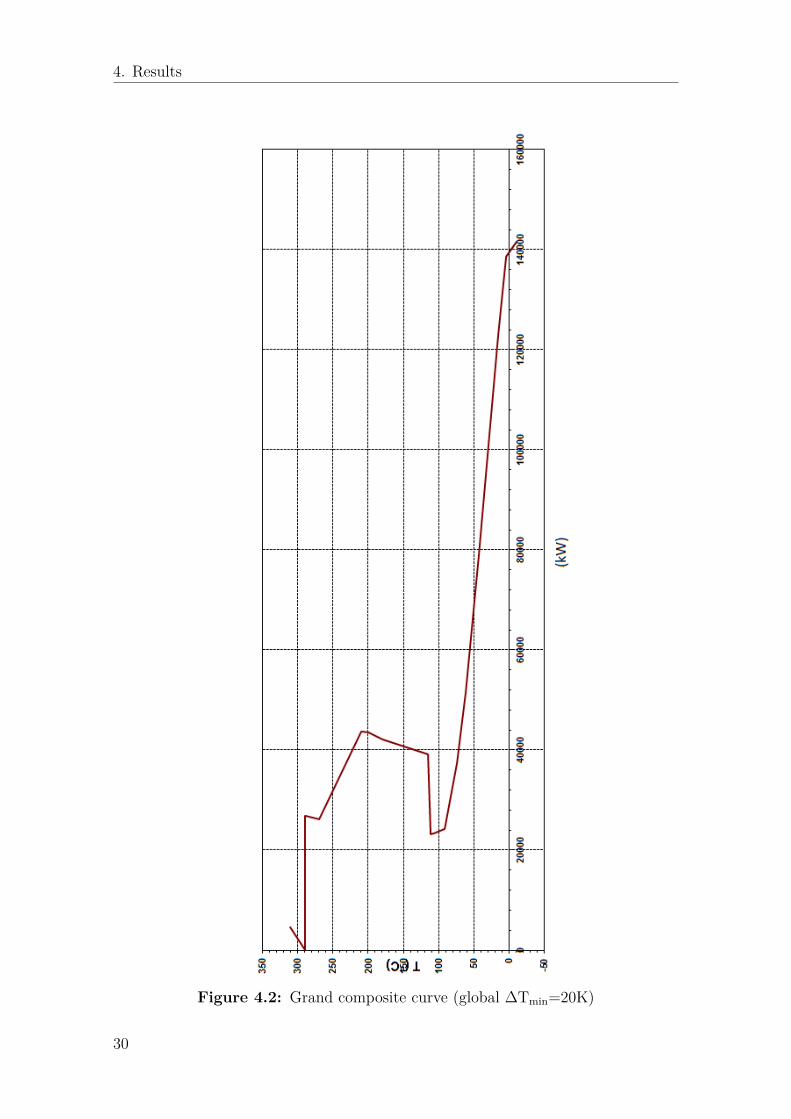
4.2 Pinch analysis4.2.1 Grand composite curvePinch analysis was performed for three different ∆Tmin values as presented in Table4.5. Minimum hot utility increases with increasing driving force as expected, hence,theoretical maximum energy recovery target is set as 154.83 MW at ∆Tmin=10K,152.55 MW at ∆Tmin=20K and 143.64 MW at ∆Tmin=40K.
Table 4.5: Pinch analysis-Maximum energy target
Scenario ∆Tmin=10K ∆Tmin=20K ∆Tmin=40KPinch temperature (°C) 295 290 280
Hot demand (kW) 157115 157115 157115(without distillation columns)Maximum energy recovery target (kW) 154830 152545 143639
Figure 4.1, Figure 4.2 and Figure 4.3 illustrate grand composite curves (GCC) re-garding three levels of global temperature difference, only including the processstreams without distillation columns, more strictly, these curves will be called as"background grand composite curve" instead. From the three GCCs, there is morethan 20MW of available heat at nearly 280 °C (shifted temperature). Interestingly,the temperature of column D-01 and D-02 is 100 °C and that of D-03 is 141 °C, aslisted in Table 4.4, which allows the columns to be partially heat integrated to thebackground process. However, since there is no excess heat at around of the col-umn temperature plus the temperature difference (i.e., 100 °C plus ∆Tmin=20K), itseems preferable to use the excess high level heat (280 °C) to other process or to theutility system (i.e., in a total site analysis concept) and use low or medium level heatfor reboilers of columns. Much of this high level heat comes from exothermal en-ergy released from oxidation reaction; hence, utilizing the exothermal energy in heatintegration in a practical way is of high importance for higher thermal efficiency.
28
4. Results
Figure 4.1: Grand composite curve (global ∆Tmin=10K)
29
4. Results
Figure 4.2: Grand composite curve (global ∆Tmin=20K)
30
4. Results
Figure 4.3: Grand composite curve (global ∆Tmin=40K)
31
4. Results
4.2.2 Design of heat exchanger networksAfter adopting seven heat exchangers, almost 70% of maximum energy recoverytarget is reached in all three cases of ∆Tmin; detailed results are listed in Table 4.6.The HEN is shown in Figure 4.4, Figure 4.5 and Figure 4.6. Among the seven heatexchangers, it can be noticed that there are two heat exchangers are siginificantlylarger than others, the exchanger (Q≈55MW) between stream 3 and stream 8 andthe exchanger (Q≈20MW) between stream 17 and stream 20. There is also a smallheat exchanger, which is between stream 6 and stream 16 with only 0.8MW of heatbeing transferred.
Table 4.6: Pinch analysis-Energy recovery
Scenario ∆Tmin=10K ∆Tmin=20K ∆Tmin=40KPinch temperature (°C) 295 290 280
Hot demand (kW) 157115 157115 157115Maximum energy recovery target (kW) 154830 152545 143639
Number of HEX 7 7 7Total heat has been recovered (kW) 108869 105702 97603Heat recovered above 200 °C (kW) 33538 30371 22272Heat recovered below 200 °C (kW) 75331 75331 75331
New total heat demand above 200 °C (kW) 4344 7511 15610(including regeneration of catalyst)New total heat demand below 200 °C (kW)
199386 199386 199386(including distillation columns,regeneration of catalyst)
4.3 Techno-economic and Environment AnalysisAs introduced in Section 3.5, the simulation results are discussed for gly-Scenario 1(glycerol for incineration) and gly-Scenario 2 (glycerol for waste treatment) basedon the two different alternative methods of utilizing glycerol. The assessment ofthese two glycerol based scenarios are presented explicitly and also compared withbenchmark model (based on glucose) and reference level (conventional productionbased on fossil fuels) in this section.
The contribution from the two steps (dehydration and oxidation including purifi-cation) in the non-integrated case (base case) for each performance indicator ispresented in Figure 4.7. It can be concluded that most of the environmental impactand operating costs is allocated to the glycerol to acrolein step. This is more evidentwhen the alternative scenario for the fate of glycerol is in waste-to-energy incinera-tion plants. It is important to note that the conventional fossil-based process doesnot involve the formation of acrolein as an intermediate in the production of acrylicacid.
Figure 4.7: Comparison of techno-economic and environmental impact:from glycerol to acrolein v.s. from acrolein to acrylic acid
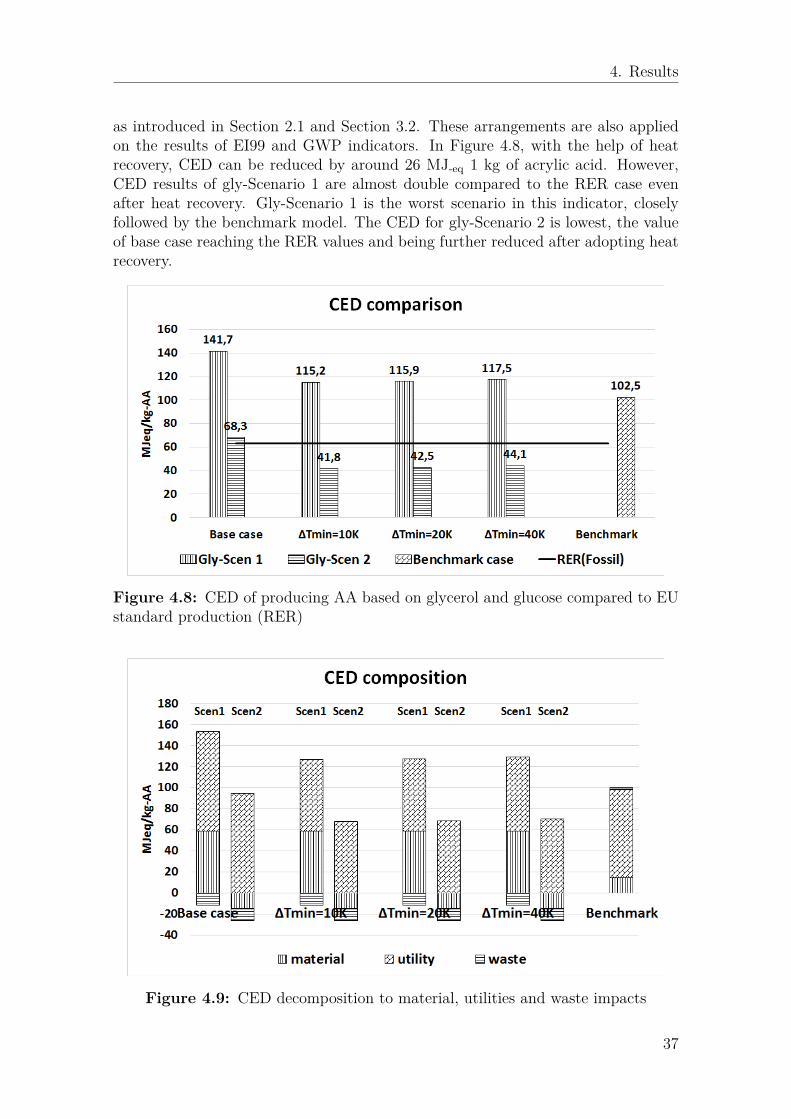
4.3.1 Results of CED assessmentCED of producing acrylic acid based on glycerol, glucose and fossil fuel are comparedin Figure 4.8. Base case refers to the flowsheet without heat integration; while∆Tmin=10K, ∆Tmin=20K and ∆Tmin=40K are the cases with heat recovery fordifferent ∆Tmin values, respectively. The two glycerol scenarios are included ineach case. RER refers to the conventional production based on fossil fuels underEuropean conditions, and benchmark model refers to the glucose based production
36
4. Results
as introduced in Section 2.1 and Section 3.2. These arrangements are also appliedon the results of EI99 and GWP indicators. In Figure 4.8, with the help of heatrecovery, CED can be reduced by around 26 MJ-eq 1 kg of acrylic acid. However,CED results of gly-Scenario 1 are almost double compared to the RER case evenafter heat recovery. Gly-Scenario 1 is the worst scenario in this indicator, closelyfollowed by the benchmark model. The CED for gly-Scenario 2 is lowest, the valueof base case reaching the RER values and being further reduced after adopting heatrecovery.
Figure 4.8: CED of producing AA based on glycerol and glucose compared to EUstandard production (RER)
Figure 4.9: CED decomposition to material, utilities and waste impacts
37
4. Results
Since conventional production way is not modeled in this project, Figure 4.9 only il-lustrates the CED composition stacked by three groups (material, utility and waste)for the glucose based model and glycerol based model for the two scenarios. Materialand utility are the main contributors. Detailed decomposition of the environmentalimpacts for utilities,materials and waste impact can be seen in Figure 4.10, Figure4.11 and Figure 4.12.
Figure 4.10 shows that glycerol and catalysts play the major role in material impact,the only difference being that CED values are positive in gly-Scenario 1 and negativein gly-Scenario 2. As for utility decomposition (Figure 4.11), the difference amongall the glycerol based models only relates with the adoption of heat integration.From Figure 4.11, it can be seen that heat and nitrogen account for most of utilityCED values. Heat demand can be lowered by one third with heat recovery and muchless natural gas is needed with smaller temperature difference. Electricity use doesnot account for much energy demand and energy demand of cooling is nearly zero.In the waste decomposition (Figure 4.12), results of all the glycerol based modelsare the same. The thermal energy released from burning methanol removal of crudeglycerol is more than energy demand for handling catalyst disposal, ash disposaland waste water, reducing the total CED number.
Figure 4.10: CED: Material decomposition of two glycerol based scenarios (Unit:MJ-eq/kg-AA)
38
4. Results
Figure 4.11: CED: Utility decomposition from glycerol to produce acrylic acid oftwo glycerol based scenarios (Unit: MJ-eq/kg-AA)
Figure 4.12: CED: Waste decomposition from glycerol to produce acrylic acid oftwo glycerol based scenarios (Unit: MJ-eq/kg-AA)
39
4. Results
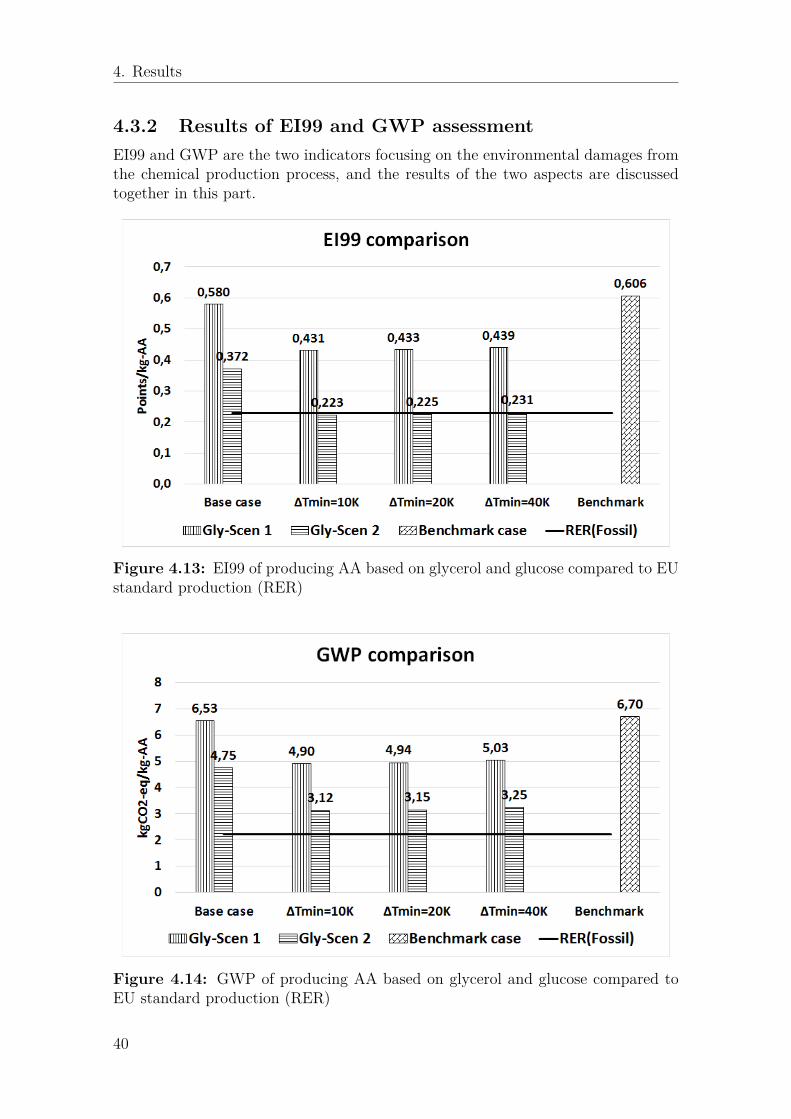
4.3.2 Results of EI99 and GWP assessmentEI99 and GWP are the two indicators focusing on the environmental damages fromthe chemical production process, and the results of the two aspects are discussedtogether in this part.
Figure 4.13: EI99 of producing AA based on glycerol and glucose compared to EUstandard production (RER)
Figure 4.14: GWP of producing AA based on glycerol and glucose compared toEU standard production (RER)
40
4. Results
Figure 4.13 and Figure 4.14 exhibit that benchmark model becomes the worst sce-nario for both indicators, the results of benchmark model being more than double theRER case. Gly-Scenario 2 is much more environmentally friendly than gly-Scenario1. In EI99 indicator, results of gly-Scenario 2 are almost half of gly-Scenario 1 withthe help of heat recovery and are competitive to the RER case, much like the resultof CED indicator. As for GWP indicator, although heat recovery helps lowering theGWP values significantly, the impacts are still worse than the RER case.
Figure 4.15: EI99 decomposition to material, utilities and waste impacts.
Figure 4.16: GWP decomposition to material, utilities and waste impacts.
41
4. Results
Figure 4.15 and Figure 4.16 respectively illustrate stacked composition of EI99 andGWP indicator of benchmark model and glycerol based models with/without heatrecovery.
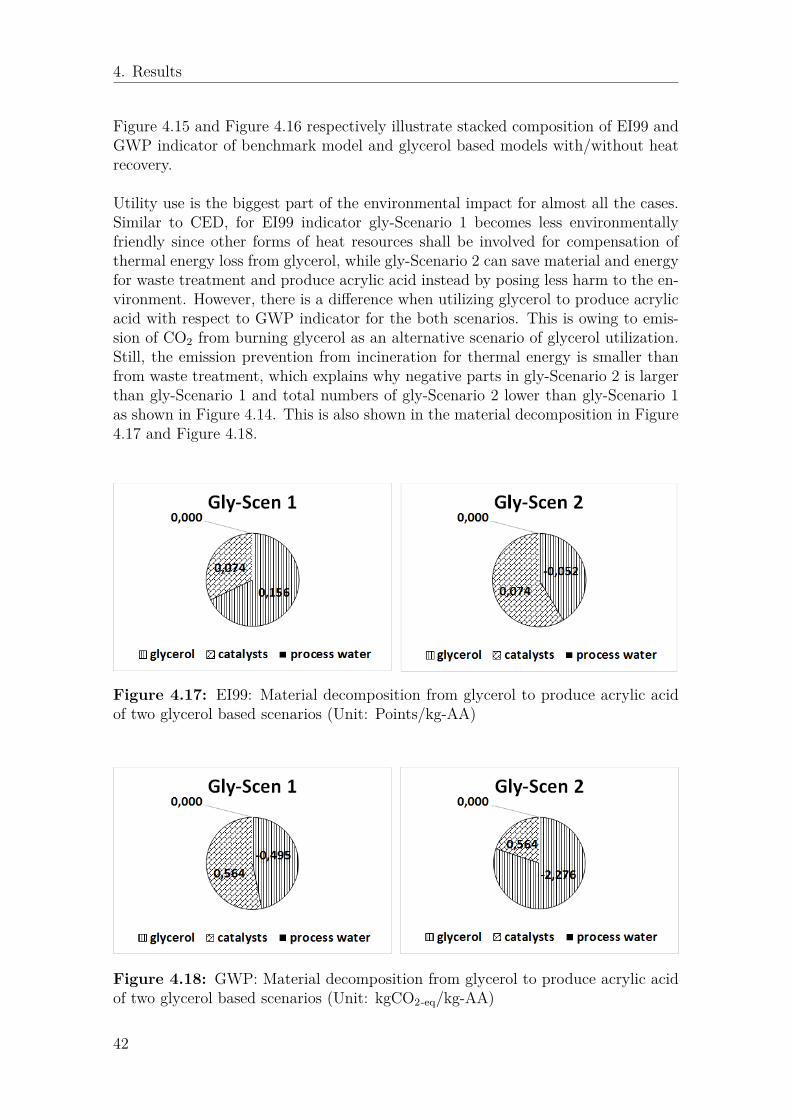
Utility use is the biggest part of the environmental impact for almost all the cases.Similar to CED, for EI99 indicator gly-Scenario 1 becomes less environmentallyfriendly since other forms of heat resources shall be involved for compensation ofthermal energy loss from glycerol, while gly-Scenario 2 can save material and energyfor waste treatment and produce acrylic acid instead by posing less harm to the en-vironment. However, there is a difference when utilizing glycerol to produce acrylicacid with respect to GWP indicator for the both scenarios. This is owing to emis-sion of CO2 from burning glycerol as an alternative scenario of glycerol utilization.Still, the emission prevention from incineration for thermal energy is smaller thanfrom waste treatment, which explains why negative parts in gly-Scenario 2 is largerthan gly-Scenario 1 and total numbers of gly-Scenario 2 lower than gly-Scenario 1as shown in Figure 4.14. This is also shown in the material decomposition in Figure4.17 and Figure 4.18.
Figure 4.17: EI99: Material decomposition from glycerol to produce acrylic acidof two glycerol based scenarios (Unit: Points/kg-AA)
Figure 4.18: GWP: Material decomposition from glycerol to produce acrylic acidof two glycerol based scenarios (Unit: kgCO2-eq/kg-AA)
42
4. Results
Figure 4.19 and Figure 4.20 present the utility decomposition of EI99 indicator andGWP indicator, respectively. Similar to the CED indicator, heat and nitrogen arethe two main drivers, accounting for most of the impact on environment. Heatdemand and natural gas use can be lowered by approximately one third with heatrecovery.
Figure 4.19: EI99: Utility decomposition from glycerol to produce acrylic acid oftwo glycerol based scenarios (Unit: Points/kg-AA)
Figure 4.20: GWP: Utility decomposition from glycerol to produce acrylic acid oftwo glycerol based scenarios (Unit: kgCO2-eq/kg-AA)
43
4. Results
In the waste decomposition, the situation for the two indicators is different. In EI99indicator, the thermal energy released from burning methanol removal of crudeglycerol still overcomes the impact posed by waste water, catalyst disposal, ashdisposal and CO2 emission; however, the contribution from waste gas incinerationis much smaller when coming to GWP indicator. Moreover, the CO2 emission fromburning the waste vapor also contributes to the global warming potential owing toinvolvement of organics in the waste emission.
Figure 4.21: EI99: Waste decomposition from glycerol to produce acrylic acid oftwo glycerol based scenarios (Unit: Points/kg-AA)
Figure 4.22: GWP: Waste decomposition from glycerol to produce acrylic acid oftwo glycerol based scenarios (Unit: kgCO2-eq/kg-AA)
44
4. Results
4.3.3 Results of operating cost assessmentPrice of crude glycerol is same in gly-Scenario 1 and gly-Scenarios 2, hence, results oftotal operating cost are exactly the same in the two scenarios. Figure 4.23 shows thatthe glycerol based production of acrylic acid can be competitive to the conventionalfossil based one and outperforms the glucose based production. The operating costof the base case is at the price level of the RER case, and can be further reduced byaround 13% with heat recovery. On the contrary, benchmark model requires around14% more than the price of the acrylic acid prices in the RER case. Unlike glycerolbased model, material use account for more than half of the total operating costin benchmark case, which is mainly owing to the expensive glucose feedstock andnutrient use for fermentation. Only a tiny piece of cost share needs to be paid forwaste both in glycerol and benchmark models.
Figure 4.23: Operating cost of producing AA based on glycerol and glucose com-pared to EU standard production (RER)
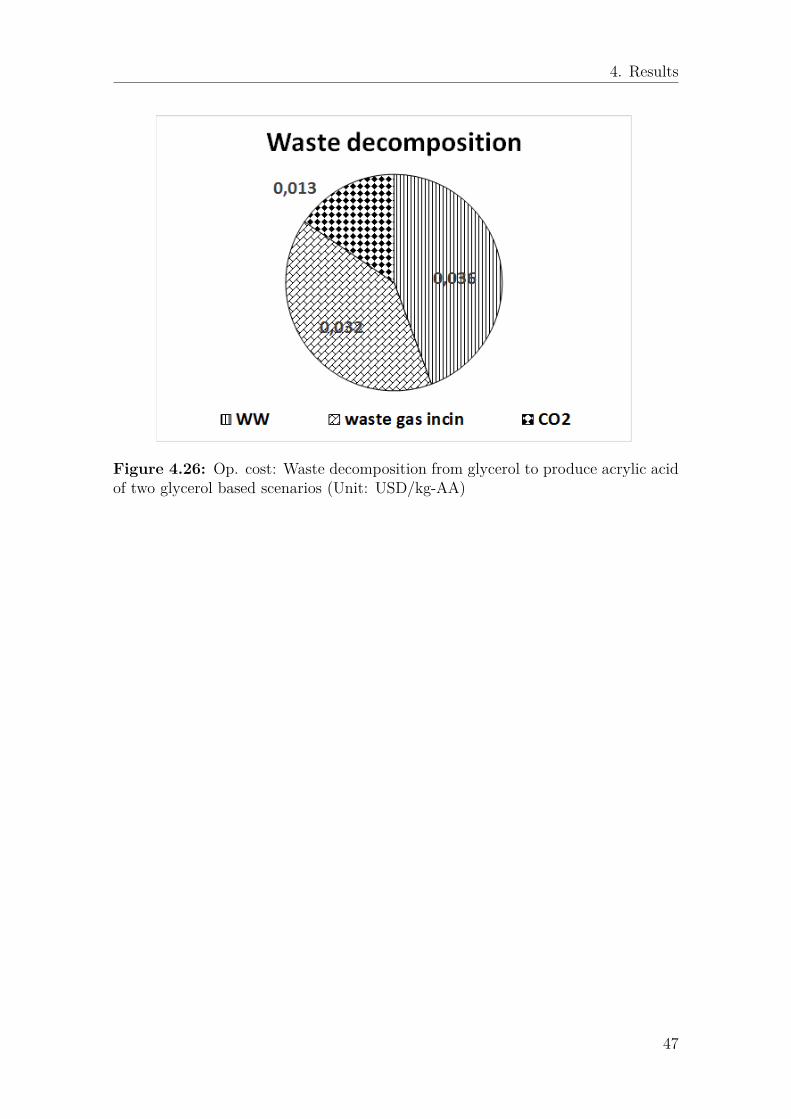
Figure 4.24 presents the material decomposition in operating cost. It can be seenthat catalysts account for 20% of the total operating costs, slightly higher thancrude glycerol. With respect to utilities decomposition in Figure 4.25, heat demandis still the biggest contributor, however, closely followed by the expensive pure ni-trogen. Cost of natural gas has been substantially reduced to nearly zero with heatintegration (∆Tmin=10K). Electricity use and cooling utility account together forless than $0.1 per kg of acrylic acid. As shown in Figure 4.26, the total cost of wastetreatment is less than $0.1 per kg of acrylic acid.
45
4. Results
Figure 4.24: Op. cost: Material decomposition from glycerol to produce acrylicacid of two glycerol based scenarios (Unit: USD/kg-AA)
Figure 4.25: Op. cost: Utility decomposition from glycerol to produce acrylic acidof two glycerol based scenarios (Unit: USD/kg-AA)
46
4. Results
Figure 4.26: Op. cost: Waste decomposition from glycerol to produce acrylic acidof two glycerol based scenarios (Unit: USD/kg-AA)
47
4. Results
4.4 A brief summary of results
This conceptual glycerol based model can be technologically and economically feasi-ble by achieving high purity of acrylic acid (99.94 wt% of AA) through high conver-sion from crude glycerol (2.48 kg crude glycerol converted into 1 kg of AA) withoutrequiring harsh process conditions, such as too high or too low (vacuum) pressure ortemperature. The two-reactor system (each followed by purification) facilitates therecovery of unreacted glycerol, the flow of less by-products to the next steps and thefinal purification of acrylic acid. The whole performance of glycerol based model isbetter than that of the glucose based model and competitive at some points withthe conventional production method measured by life cycle indicators and operatingcost.
Heat recovery does help lowering the running cost and becoming more environ-mentally friendly. Since the total process is not very complicated, 70% of maxi-mum energy recovery target can be reached by simply adding seven heat-exchangeunits. In the base model, oxidation process happens to be an exothermal reaction,therefore, it is wise to recover the high-level heat. The improvement getting from"∆Tmin=10K" model is of course highest together with the most expensive capitalinvestment, whereas, the advantages are not quite outstanding. Nevertheless, distil-lation columns can not be covered by background streams of adjacent temperature,thus 78% of new heat demand (lower than 200 °C) after heat recovery is requiredby columns.
Nitrogen is used as the carrier gas only during dehydration, and it has been provedthat involvement of oxygen has poor performance on the selectivity in acrolein fromglycerol [3]. However, the results of this study have shown that the impact on econ-omy and environment when using pure N2 is quite large. For the required kineticconcern, it is better not to change the flow ratio, neither. Whereas, as for impactsfrom catalysts, due to missing information of reusability and background data ofcatalyst FePO4, the relative high impact posed by this catalyst shall be worried,and more analysis of catalyst shall be performed.
The electricity use, cooling, process water, ash disposal and catalyst disposal donot account for much energy demand, operating costs and environmental impacts.
In the three LCA indicators, the alternative scenario of utilizing crude glycerolplays a crucial role. If the crude glycerol used for producing acrylic acid was sup-posed to be burnt as a fuel, mixture of other thermal energy (natural gas, biomass,etc.) shall be used for compensating the heat loss of glycerol. On the contrary,if the crude glycerol cannot be used as fuel and has to be treated in conventionalwaste treatment plants, to utilize glycerol for chemical product saves the energy andmaterial required in the waste treatment plant.
The assessment scores of the benchmark model fed by glucose exceed the RERfossil based production a lot for all the four indicators, and are also higher than the
48
4. Results
glycerol based model (only lower in CED for the base case of gly-Scenario 1). Thisis mostly because of the feedstock and nutrients for fermentation. No matter fromcorn or sugarcane, glucose is a kind of primary energy with high cost.
49
4. Results
50
5Conclusion
As the by-product of biodiesel production, availability of glycerol has been benefitedfrom the increasing biodiesel generation; at the same time, value added processes ofglycerol have caught lots of attention to consume the glycerol. This thesis projectaims at using crude glycerol as the raw material to produce acrylic acid on industrialscale via acrolein as the intermediate product. Demand of acrylic acid is predictedto grow steady and reach to nearly 8.2 million tonnes by the end of 2020.
It has been confirmed that two chemical reactions are involved in this productionroute, namely dehydration and oxidation. According to the previous literature out-comes, two-bed system are selected for achieving high conversion with two kinds ofcatalysts based on the reported performances, such as selectivity, yield, regenera-tion. Catalyst FePO4 synthesized by hydrothermal method is used in dehydrationreaction, while V-Mo in oxidation reaction. Most of the research work mainly fo-cuses on the synthesis and testing of performances of (new) catalysts, little workconcerns about purification of product flow and process design.
In this project, software Aspen Plus ® helps the flowsheet simulation, from pre-limenary treatment of crude glycerol to purifying the final product flow. Input data(feedstocks and yield of products) is mainly gathered from literature data with lin-ear scale-up, and reaction condition is set at the optimum temperature and pressurefrom the results. Although diverse by-products have been discovered from theirexperiment and large amount of water and inert gases has been introduced into thesystem, the proposed process design has successfully purified the product flow andpurity of acrylic acid reaches nearly 100%. To this end, 2.48 kg of crude glycerol areconverted to 1 kg of acrylic acid of 99.94%wt purity.
Pinch analysis and heat integration lowers the heat demand by 100MW in aver-age, 70% of maximum energy recovery target of background streams can be easilyachieved. Overally, approximate 34 MJ of heat is needed for 1 kg of acrylic acidwith requirement of 25 MJ from the duties of three reboilers.
Alternative process of using crude glycerol plays a significant role in life cycle as-sessment. The results prove that use of crude glycerol to produce acrylic acid viaacrolein route can be regarded as a very promising way in places where glycerol in-cineration is not an option. Valorization of glycerol can prevent the environmentalimpact of waste treatment or landfill (landfill has been restricted within EU [42]).$1.35 is required to pay for 1 kg of acrylic acid with around $1.18 is needed with
51
5. Conclusion
heat integration. Moreover, capital cost is not included within the conceptual designin this project of economic assessment, and it may have impact on decision making.
A glucose based model, as another renewable production way of producing acrylicacid, is introduced for comparison. The assessment results of this benchmark modelexceed the EU standard a lot and are higher than those of glycerol based modelsin almost every indicator. Hence, it seems an unwise choice to adopt glucose toproduce acrylic acid in EU.
Of course, more in-depth research on alternative separation, purification method,catalyst findings and testing, governmental subsidies and other aspects are requiredand expected to help the development of glycerol based biorefinery in the future.
52
Bibliography
[1] OECD. Fao agricultural outlook, 20112020.[2] G.M. Lari, M. Haus, S. Papadokonstantakis, C. Mondelli, and J. Pérez-Ramírez.
Evaluation of chemocatalytic routes for the conversion of glycerol into commodi-ties, 2016.
[3] J. Deleplanque, J.-L. Dubois, J.-F. Devaux, and W. Ueda. Production ofacrolein and acrylic acid through dehydration and oxydehydration of glycerolwith mixed oxide catalysts. Catalysis Today, 157:351–358, 2010.
[4] I.C. Kemp. Pinch Analysis and Process Integration (2nd Edition). Elsevier,2007.
[5] Sarah Clark. Acrylic Acid Market- Global Opportunity Analysis and IndustryForecast, 2013-2020. Allied market research, 2014.
[6] Lu Liu, X. Philip Ye, and Joseph J. Bozell. A comparative review of petroleum-based and bio-based acrolein production. ChemSusChem, 5:1162–1180, 2012.
[7] United Nations. Paris agreement, 2015.[8] Valerie S. Banschbach and Robert Letovsky. The use of corn and sugarcane to
produce biofuel. 32:6–16, 2011.[9] Andrew Cie, Stephen Lantz, Roy Schlarp, and Metaxia Tzakas. Renewable
acrylic acid, 2012.[10] Yong Wang, Shiyi Ou, Pengzhan Liu, and Zhisen Zhang. Preparation of
biodiesel from waste cooking oil via two-step catalyzed process. Energy Con-version and Management, 48:184–188, 2007.
[11] Ashish Birla, Bhaskar Singh, S.N. Upadhyay, and Y.C. Sharma. Kinetics studiesof synthesis of biodiesel from waste frying oil using a heterogeneous catalystderived from snail shell. Bioresource Technology, 106:95–100, 2012.
[12] C. Lin, L. Pfaltzgraff, L. Herrero-Davila, E. Mubofu, S. Abderrahim, andJ. Clark et al. Food waste as a valuable resource for the production of chem-icals, materials and fuels. current situation and global perspective. Energy &Environmental Science, 6:426–464, 2013.
[13] Yie Hua Tan, Mohammad Omar Abdullah, Cirilo Nolasco-Hipolito, andYun Hin Taufiq-Yap. Waste ostrich- and chicken-eggshells as heterogeneousbase catalyst for biodiesel production from used cooking oil: Catalyst charac-terization and biodiesel yield performance. Applied Energy, 160:58–70, 2015.
[14] ICIS. Icis price report,2016.[15] John A. Posada, Luis E. Rincón, and Carlos A. Cardona. Design and anal-
ysis of biorefineries based on raw glycerol: Addressing the glycerol problem.Bioresource Technology, 111:282—-293, 2012.
53
Bibliography
[16] Benjamin Katryniok, Sébastien Paul, and Franck Dumeignil. Recent develop-ments in the field of catalytic dehydration of glycerol to acrolein. ACS Catalysis,3(8):1819–1834, 2013.
[17] B. Katryniok, H. Kimura, E. Skrzynska, J. Girardon, P. Fongarland,M. Capron, R. Ducoulombier, N. Mimura, S. Paul, and F. Dumeignil. Se-lective catalytic oxidation of glycerol: perspectives for high value chemicals.GreenChem, 13:1960–1979, 2011.
[18] M. Morales, P.Y. Dapsens, I Giovinazzo, J Witte, C. Mondelli, and S. Pa-padokonstantakis et al. Environmental and economic assessment of lactic acidproduction from glycerol using cascade bio-and chemocatalysis. Energy & En-vironmental Science, 8(2):558–567, 2015.
[19] G.M. Lari, C. Mondelli, S. Papadokonstantakis, M. Morales, K. Hungerbühler,and J. Pérez-Ramírez. Environmental and economic assessment of glyceroloxidation to dihydroxyacetone over technical iron zeolite catalysts. ReactionChemistry & Engineering, 1:106–118, 2016.
[20] Rong Liu, Tiefeng Wang, Dali Cai, and Yong Jin. Highly efficient productionof acrylic acid by sequential dehydration and oxidation of glycerol. Industrial& Engineering Chemistry Research, 53(21):8667–8674, 2014.
[21] Alicia Carrero, José A. Calles, Lourdes García-Moreno, and Arturo J. Vizcaíno.Production of renewable hydrogen from glycerol steam reforming over bimetallicni-(cu,co,cr) catalysts supported on sba-15 silica. Catalysts, 7, 2017.
[22] Karaked Tedsree, Tong Li, Simon Jones, Chun W.A. Chan, and Kai M.K.Yu. Hydrogen production from formic acid decomposition at room tempera-ture using a ag–pd core–shell nanocatalyst. NATURE NANOTECHNOLOGY,6:302–307, 2011.
[23] Ashish Kumar Singh, Suryabhan Singh, and Abhinav Kumar. Hydrogen en-ergy future with formic acid: a renewable chemical hydrogen storage system.Catalysis Science & Technology, 6:12–40, 2016.
[24] Aspen Tech. Benefits of multi-solvent nrtl models in aspen plus.[25] Aspen Tech. Aspen plus v8.8 help list.[26] Eugeny Kenig and Panos Seferlis. Modeling reactive absorption. CEP, pages
65–73, 2009.[27] Aspen Tech. Aspen plus unit operation models reference manual.[28] Akhmad Zainal Abidin, Rani Guslianti Afandi, and Hafis Pratama Rendra
Graha. Synthesis of acrolein from glycerol using fepo4 catalyst in liquid phasedehydration. Engineering and Technological Sciences, 48(1):12–20, 2016.
[29] Gregory S. Patience, Youssef Farrie, Jean-François Devaux, and Jean-LucDubois. Oxidation kinetics of carbon deposited on cerium-doped fepo4 dur-ing dehydration of glycerol to acrolein. Chemical Engineering Technology,35(9):1699–1706, 2012.
[30] Alibaba. Market price for substance.[31] H.I.H. Saravanamuttoo, G.F.C. Rogers, H. Cohen, and Paul Straznicky. Gas
Turbine Theory (6th Edition). Pearson Education Limited, 2008.[32] Mark AJ Huijbregts, Stefanie Hellweg, Rolf Frischknecht, Harrie WM Hendriks,
Konrad Hungerbuhler, and A Jan Hendriks. Cumulative energy demand as pre-
54
Bibliography
dictor for the environmental burden of commodity production. Environmentalscience & technology, 44(6):2189–2196, 2010.
[33] Dominic A. Notter, Reto Meyer, and Hans-Jorg Althaus. The western lifestyleand its long way to sustainability. Environmental science & technology, 47:4014–4021, 2013.
[34] Annie Levasseur, Pascal Lesage, Manuele Margni, Louise Deschenes, and Ré-jean Samson. Considering time in lca: dynamic lca and its application to globalwarming impact assessments. Environmental science & technology, 44(8):3169–3174, 2010.
[35] Annette Koehler and Caroline Wildbolz. Comparing the environmental foot-prints of home-care and personal-hygiene products: The relevance of differentlife-cycle phases. Environmental science & technology, 43(22):8643–8651, 2009.
[36] Urban Persson and Sven Werner. Heat distribution and the future competi-tiveness of district heating. Applied Energy, 88:568–576, 2011.
[37] Swedish energy agency. Waste-to-energy in sweden – suppliers of sustainablesolutions.
[38] Avfall Sverige. Towards a greener future with swedish waste -to-energy: Theworld’s best example.
[39] Ecoinvent database. Life cycle background data of substances.[40] Claude Rerat, Stavros Papadokonstantakis, M. Hungerbühler, and Konrad
Hungerbühler. Integrated waste management in batch chemical industrybased on multi-objective optimization. Air & Waste Management Association,63(3):349–366, 2013.
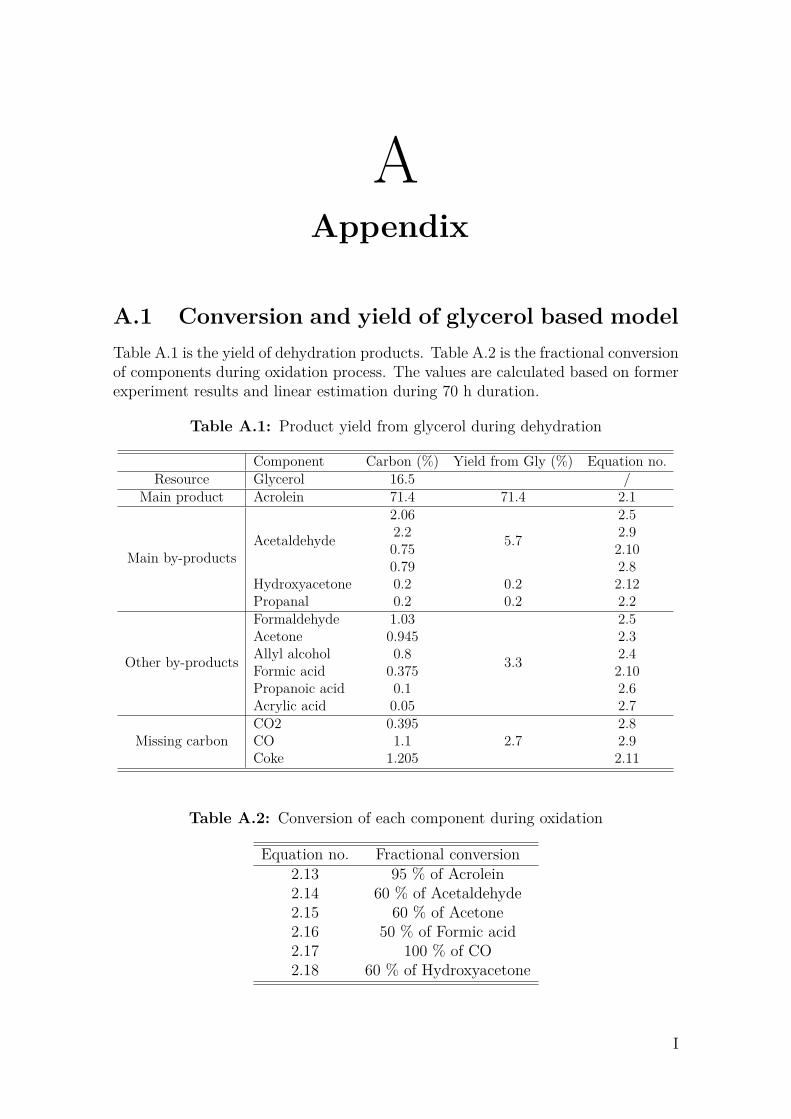
A.1 Conversion and yield of glycerol based modelTable A.1 is the yield of dehydration products. Table A.2 is the fractional conversionof components during oxidation process. The values are calculated based on formerexperiment results and linear estimation during 70 h duration.
Table A.1: Product yield from glycerol during dehydration
Table A.2: Conversion of each component during oxidation
Equation no. Fractional conversion2.13 95 % of Acrolein2.14 60 % of Acetaldehyde2.15 60 % of Acetone2.16 50 % of Formic acid2.17 100 % of CO2.18 60 % of Hydroxyacetone
I
A. Appendix
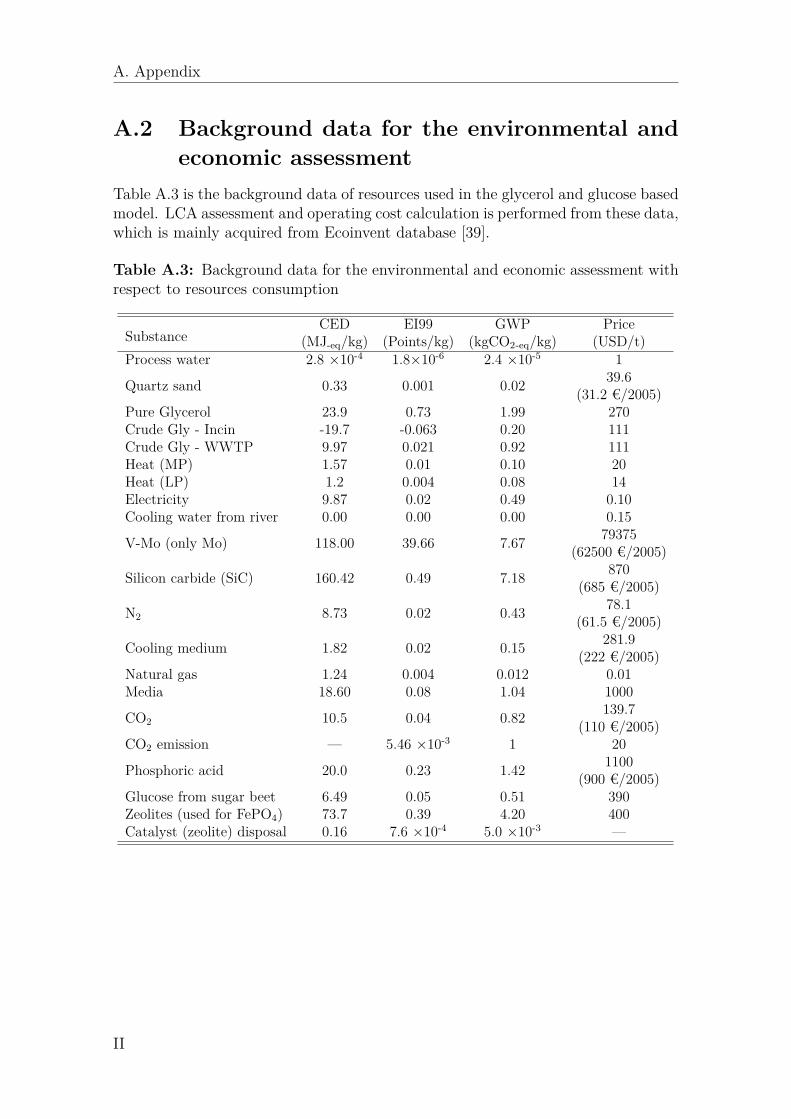
A.2 Background data for the environmental andeconomic assessment
Table A.3 is the background data of resources used in the glycerol and glucose basedmodel. LCA assessment and operating cost calculation is performed from these data,which is mainly acquired from Ecoinvent database [39].
Table A.3: Background data for the environmental and economic assessment withrespect to resources consumption
Table A.4 is the environmental impact and cost of per hour of the total amount ofwaste steams of glycerol and benchmark models. The calculation method followsRerat et al. [40]. These values shall be divided by acrylic acid production of perhour.
Table A.4: Background data for the environmental and economic assessment withrespect to waste treatment
As for the operating cost of waste water treatment and waste incineration, besidesthe values above in Table A.4, it shall also include second cost, which is as follow:For waste water: The amount of waste water × 0.003(USD/kg).For waste incineration: The amount of waste vapor/ gas× 0.2(USD/kg).The detailed results of waste streams are shown in Table A.5.
Table A.5: Results of the environmental and economic assessment with respect towaste treatment