Toward an Understanding of Selective Alkyne Hydrogenation onCeria: On the Impact of O Vacancies on H2 Interaction with CeO2(111)Kristin Werner,*,† Xuefei Weng,† Florencia Calaza,†,‡ Martin Sterrer,§ Thomas Kropp,*,∥
Joachim Paier,∥ Joachim Sauer,∥ Markus Wilde,*,⊥ Katsuyuki Fukutani,⊥ Shamil Shaikhutdinov,†
and Hans-Joachim Freund†
†Fritz-Haber-Institut der MPG, Faradayweg 4-6, 14195 Berlin, Germany‡Instituto de Desarrollo Tecnologico para la Industria Química (INTEC), UNL-CONICET, Guemes 3450, 3000 Santa Fe, Argentina§Institute of Physics, University of Graz, NAWI Graz, Universitatsplatz 5, 8010 Graz, Austria∥Institut fur Chemie, Humboldt-Universitat, Unter den Linden 6, 10099 Berlin, Germany⊥Institute of Industrial Science, The University of Tokyo, 4-6-1 Komaba, Meguro-ku, 153-8505 Tokyo, Japan
*S Supporting Information
ABSTRACT: Ceria (CeO2) has recently been found to be a promising catalyst in theselective hydrogenation of alkynes to alkenes. This reaction occurs primarily on highlydispersed metal catalysts, but rarely on oxide surfaces. The origin of the outstandingactivity and selectivity observed on CeO2 remains unclear. In this work, we show thatone key aspect of the hydrogenation reactionthe interaction of hydrogen with theoxidedepends strongly on the presence of O vacancies within CeO2. Through infraredreflection absorption spectroscopy on well-ordered CeO2(111) thin films and densityfunctional theory (DFT) calculations, we show that the preferred heterolyticdissociation of molecular hydrogen on CeO2(111) requires H2 pressures in the mbarregime. Hydrogen depth profiling with nuclear reaction analysis indicates that H speciesstay on the surface of stoichiometric CeO2(111) films, whereas H incorporates as avolatile species into the volume of partially reduced CeO2−x(111) thin films (x ∼ 1.8−1.9). Complementary DFT calculations demonstrate that oxygen vacancies facilitate Hincorporation below the surface and that they are the key to the stabilization of hydridicH species in the volume of reduced ceria.
■ INTRODUCTIONCeria (CeO2) is one of the most extensively used oxides inheterogeneous catalysis.1 Especially in redox reactions, CeO2 isan efficient catalyst due to its facile oxygen store-and-releasebehavior. Within CeO2, Ce
4+ ions are easily reduced to Ce3+
without major structural transformations. In this way, CeO2 canserve as an oxygen reservoir, which renders it an idealsupporting material in a variety of oxidation reactions. Incontrast, applying CeO2 as a hydrogenation catalyst may appearcounterintuitive. Recently, however, CeO2 has been found toact as a remarkable stand-alone catalyst in the selectivehydrogenation of alkynes to alkenes. Perez-Ramirez and co-workers demonstrated its excellent activity and selectivity forpentyne and acetylene semihydrogenation.2−4 Reportedly,supported CeO2 even outperforms commonly used Pdcatalysts, which may suggest CeO2 as a promising alternativeto expensive precious metal catalysts.3 Besides CeO2, In2O3,and FeOx have recently been reported to selectively catalyze thesemihydrogenation of alkynes.5,6 In the case of indium oxide,oxygen vacancies play a crucial role in the activation of thecatalyst. At the same time, other metal oxides like ZnO or TiO2,primarily catalyze alkyne isomerization or oligomerizationreactions.7−9 To understand the exact relation between the
oxides’ chemical nature and their catalytic performance towardalkyne hydrogenation, further studies are of highest interest.The mechanism of the selective hydrogenation reaction over
CeO2 has been studied theoretically, but still needsexperimental proof.4,10 Theoretical studies on the interactionof H2 and CeO2(111) showed that H2 dissociates heterolyti-cally over the Ce and O sites of the surface, which act as aLewis acid−base pair.11,12 With the aim of identifying theproperties of CeO2 that render it an efficient hydrogenationcatalyst, we study in this work the interaction of molecularhydrogen with ceria surfaces of different O vacancy density, i.e.different degrees of reduction.Previous work on CeO2 catalysts suggested that the nearly
stoichiometric CeO2(111) surface is more active in the selectivehydrogenation reaction than the vacancy-rich CeO2(100).
13,14
This finding points toward a detrimental influence of oxygenvacancies on the hydrogenation reaction.The apparent effect of oxygen vacancies on the hydro-
genation reactivity makes it essential to study the process onatomically well-defined CeO2 surfaces with a controlled amount
Received: September 19, 2017Published: November 13, 2017
of O vacancies. The fabrication of such surfaces demands strictcontrol over the preparation conditions, which is achieved inultrahigh vacuum (UHV) environments, as they are typicallyemployed in surface science. It has been reported that thedissociation of H2 over CeO2(111) does not occur under theusual pressure limitations of UHV setups.15,16 In consequence,previous studies on the interaction of H and well-defined CeO2used atomic H sources or mimicked surface hydrogenation bydissociating H2O over reduced CeO2−x.
15,17,18 Experimentalwork on H2 dissociation on CeO2 was exclusively performed onpowder samples.19−24 By studying UHV-prepared samples in ahigh pressure cell, we are able to study the dissociation ofmolecular H2 on atomically well-defined CeO2 surfaces.Past studies on hydrocarbon hydrogenation over Pd model
catalysts revealed the important role of absorbed H speciesbelow the surface.25−32 In this respect, a central question of thepresent work is whether CeO2 may store hydrogen below thesurface as well. Previous studies addressing this questioninvestigated powder samples and have come to controversialconlusions.19−24 Some authors report the incorporation of Hinto the CeO2 bulk,19−22,24 while others claim that hydro-genation is a pure surface process.23 Very recent work byRamirez-Cuesta and co-workers suggested hydride incorpo-ration into bulk O vacancies after H2 dissociation on reducedCeO2−x.
24 This study, however, was performed on CeO2 rodswith various surface terminations and surface defects, so that itremains unclear whether the hydrogenation-active CeO2(111)surface alone would also incorporate H. Moreover, inelasticneutron spectroscopy, which the study used to probe H in thevolume of CeO2, cannot give information about the depthdistribution of H species, which would be desirable to estimatethe influence of these H species on surface reactions.In this work, to exclusively study the interaction of H2 with
CeO2(111), we make use of well-ordered CeO2(111) thin filmsgrown on Ru(0001) as model systems. The oxygen vacancyconcentration of these films can be varied in a controlledmanner.33−36 This allows us to study the role of oxygenvacancies on the interaction with H2. We carried out hydrogenadsorption experiments using infrared reflection absorptionspectroscopy (IRAS) in combination with density functionaltheory (DFT) calculations and examined the depth distributionof H species in the near-surface region of H2-exposed ceriafilms by nuclear reaction analysis (NRA). The latter provides uswith a direct probe of the spatial distribution of H specieswithin the ceria films. We show that H2 dissociates both onstoichiometric CeO2(111) and on reduced CeO2−x(111) thinfilms. On CeO2(111), the H species formed by dissociationpredominantly stay on the surface, whereas they incorporateinto the oxide film volume of reduced CeO2−x(111).Complementary DFT calculations suggest that the incorpo-ration of H into the bulk of reduced ceria is closely related tothe existence of O vacancies that can stabilize H as a hydridicspecies.
■ EXPERIMENTAL METHODSExperiments were carried out in two UHV chambers (base pressure ∼1 × 10⁻¹⁰ mbar). The first chamber in Berlin is equipped with an IRspectrometer (Bruker i66v), a LEED instrument (Specs ErLEED1000-A), and XPS (Specs XR 50, PHOIBOS 150 MCD). Weperformed the in situ IRAS experiments in up to 10 mbar of D2(Linde, 5.0) in a built-in high pressure cell sealed by spring-loadedTeflon rings. IRA spectra were recorded with 500 scans and a spectralresolution of 4 cm−1. XP spectra were recorded with Al Kα radiation innormal emission (sample normal to analyzer) and in grazing emission
modes (sample 60° off-normal). Nuclear reaction analysis (NRA)measurements were performed in the second UHV chamber at the 1Ebeamline of the MALT accelerator at the University of Tokyo. Thesetup is equipped with a γ-ray scintillation detector (BGO, Oken) forNRA along with all necessary equipment for in situ sample preparationand a Pd-membrane diffusion purifier (P+E 2001) for the productionof ultrapure (9N) H2.
37
The CeO2(111) and CeO2−x(111) thin films have been prepared byvapor deposition onto a Ru(0001) substrate. It has been shownpreviously that CeO2(111) films may be prepared on various metalsubstrates and that these films show essentially the same physical andchemical surface properties as bulk CeO2.
38 Through CO dosagefollowed by TDS measurements (where no adsorbed CO wasdetectable) we carefully verified that the CeO2(111) films were fullyclosed, i.e., that our samples did not contain any open patches of Ruthat would have been accessible from the gas phase. We may thussecurely rule out H2 dissociation and supply of atomic H to theCeO2(111) films from the substrate.
In both chambers, a Ru(0001) single crystal (MaTeck GmbH) wasspot-welded to a sample holder with Ta wires. The sample was heatedby resistive heating or e-beam heating and cooled with liquid N2. Thesample temperature was controlled using a type K thermocouple spot-welded to the backside or edge of the crystal. The clean Ru(0001)surface was prepared by repeated cycles of Ar+ sputtering and UHVannealing up to 1250 K.
To grow CeO2 films, the clean Ru(0001) surface was first exposedto 1 × 10⁻⁶ mbar of O2 at 980 K and cooled down to 300 K to form a3O(2 × 2)-Ru(0001) structure. Then Ce (99.9%, Sigma-Aldrich) wasvapor deposited onto the 3O(2 × 2)-Ru(0001) surface in an O2atmosphere (1 × 10⁻⁶ mbar). Ce was evaporated from Mo crucibles inan e-beam evaporator (Focus EFM3). We ensured proper wetting ofthe substrate by depositing the first layers at a sample temperature of∼100 K. Then the temperature was raised to 673 K at a rate of 1 K/s(while keeping the Ce flux) and kept constant during deposition of thenext layers. Deposition at 673 K was performed in cycles that included30 to 60 min of Ce evaporation and subsequent annealing in 10−6
mbar O2 at 980 K for several minutes to ensure good film ordering.LEED from the resulting films showed a hexagonal (1.4 × 1.4) patternwith respect to Ru(0001), which is characteristic for CeO2(111) dueto its 40% larger lattice parameter. We estimate the thickness of thefilms from the attenuated Ru 3d signal in XPS to be 4−6 nm. For moredetails on the growth procedure, please refer to refs 39−41.
Reduced CeO2−x(111) thin films were prepared by UHV-annealingthe CeO2(111) thin film at 1000−1200 K for 10−40 min. These filmsshow a complex LEED pattern with a (√7 × √7)-R19.1°superstructure of oxygen vacancies.33,42
As judged by LEED and XPS, the reduced film can be reoxidized tothe stoichiometric CeO2(111) film in 10−6 mbar of O2 at 980 K,suggesting that oxidation and reduction are fully reversible. Thus,experiments on the oxidized and reduced films can be performed withthe same sample.
NRA via the resonant 1H(15N,αγ)12C nuclear reaction (15N + 1H →12C + α + γ) was used to analyze the H depth distribution in the H2-exposed thin ceria films, using monochromatized 15N2+ ion beams of20−40 nA near the narrow (1.8 keV) reaction resonance energy, ER =6.385 MeV. The method is described in detail elsewhere.37,43−46
Briefly, the γ-ray yield emitted in the nuclear reaction normalized tothe number of incident 15N ions quantitatively determines the densityof 1H nuclei in the sample. The 15N ion current is measured with aFaraday cup on the beamline and the γ-detection efficiency wascalibrated with Kapton ((C22H10O5N2)n) foil as a H concentrationstandard. 15N ions incident at ER detect H on the sample surface,whereas those incident at higher energy (ER + ΔE) probe Hunderneath the surface at a depth d = ΔE cos(αi)/S. Here, S is thestopping power of the sample material for the 6.4 MeV 15N ions (S =2.6713 keV/nm for CeO2), and αi is the incidence angle of the
15N ionbeam relative to the surface normal. All measurements were performedat αi = 60°. Scanning the 15N energy through and beyond ER revealsthe depth profile of H in the sample. Due to the finite depthresolution, H within a narrow region beneath the surface cannot be
distinguished from H on the surface when the incident 15N energy isfixed at ER. The thickness of this simultaneously probed region is givenby the width (fwhm) of the Doppler-broadened37 surface resonancepeak, which amounts to a few O−Ce−O trilayers of CeO2.
38
■ COMPUTATIONAL METHODSCalculations were performed using the projector augmented wavemethod (PAW)47,48 as implemented in the Vienna ab initio simulationpackage (VASP).49,50 The onsite Coulomb interaction of occupied forbitals is corrected via the DFT+U approach51,52 employing thefunctional of Perdew, Burke, and Enzerhof (PBE),53 and an effectiveHubbard-type U parameter of 4.5 eV for the Ce 4f electrons (see ref54). While the choice of the U parameter affects reaction energies,55
we are confident that our approach yields reliable results, which wastested by comparing with results obtained using more reliable hybridfunctionals (e.g., ref 56). The specific implementation of DFT+Ufollows Dudarev et al.57,58 A plane wave kinetic energy cutoff of 600 eVwas used and structure optimizations were performed until forcesacting on the relaxed atoms were below 0.02 eV/Å.The p(4 × 4) surface unit cell was generated by cutting bulk CeO2
in (111) orientation with a cell vector of 1552 pm. Our slab modelconsists of nine atomic layers (Ce48O96), where the lowest trilayer isfrozen to simulate the bulk. The vacuum layer was set to 10 Å. Becauseof the large cell, sampling the Brillouin zone was restricted to the Γpoint.Optimized structures were proven to be minima by the absence of
imaginary vibrational frequencies; for each transition structure, onlyone imaginary frequency was obtained. These calculations include alladatoms and the topmost three atomic layers. Harmonic forceconstants are calculated as numerical derivatives with atomicdisplacements of ±1.5 pm. Entropies and zero-point vibrationalenergies (ZPVE) are calculated from these frequencies. All energiesreported herein were obtained using PBE+U and include ZPVE.For OH (OD) stretching modes, a scaling factor of f = 0.9773 ( f =
0.9934) is employed, which was derived in ref 59 as the ratio ofobserved fundamentals and the average of the calculated harmonicwavenumbers of the symmetric and asymmetric stretching modes ofwater.Transition structures are obtained by NEB calculations60,61 in
combination with the climbing image method62 as implemented inVASP. Four images were used for each NEB calculation with a springforce of 5 eV/Å. The improved dimer method was used to refine thesestructures.63,64
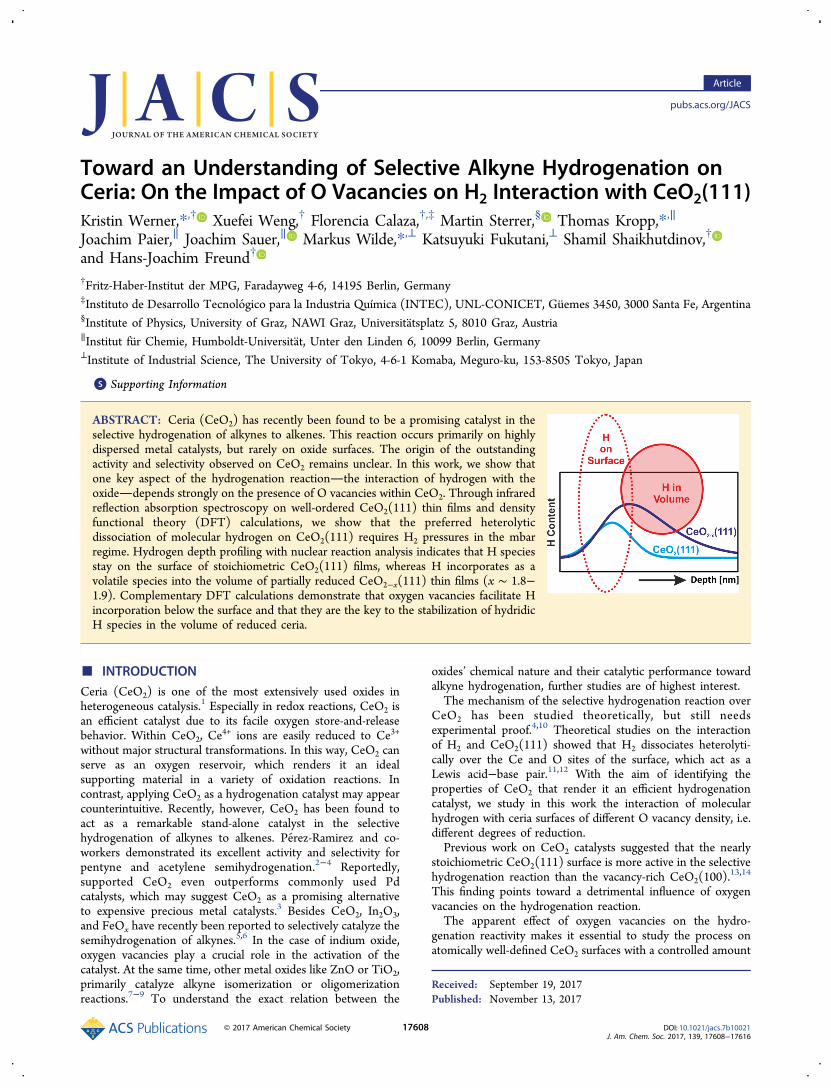
■ RESULTSIn the present work, we study well-ordered CeO2(111) andCeO2−x(111) thin films. Figure 1 shows typical Ce 3d XPspectra and LEED patterns of the CeO2(111) film as grown(top) and after reduction by UHV annealing (bottom). In thefollowing, we will refer to these films as “stoichiometric” orCeO2(111) and “reduced” or CeO2−x(111) films, respectively.We have shown previously40,65 that the stoichiometric films arecharacterized by a low density of point defects, at least on theterraces. The same holds true for the reduced films as shown inan STM study by Matolın and co-workers.33
The Ce 3d XP spectrum of CeO2(111) shows characteristicpeaks for Ce4+38,66−70 which are commonly described in termsof three doublets. The spectra were recorded both in normaland grazing emission geometry (60° off-normal), in order toextract information on the Ce oxidation states in the bulk andat the surface of the ceria films. For CeO2 films, the informationdepth in normal mode is about 3 nm, while it is about 1.5 nm ingrazing mode (60°).33
For the CeO2(111) film, the relative intensity of the Ce 3dfeatures is the same in grazing and normal emission geometry,indicating that the Ce ions are fully oxidized to Ce4+
throughout the CeO2(111) film.
The reduced CeO2−x(111) thin films show a complex LEEDpattern with the characteristic (√7 × √7)-R19.1° super-structure formed by O vacancies.33 The sharpness of the LEEDspots varies with the preparation conditions. Compared tostoichiometric CeO2(111), additional features appear in the XPspectra which are characteristic for the Ce3+ state.33,38,66 Strongenhancement of the Ce3+-related signals in the spectra recordedunder grazing emission indicates that the Ce3+ ions are mostlylocated in the first few atomic layers. This finding is in fullagreement with the XPS study by Matolın and co-workers,which described the film as being reduced mainly at and nearthe surface with a reduction gradient toward the oxidized bulkphase.33
From the total peak areas of the deconvoluted Ce3+ and Ce4+
signals in the Ce 3d spectrum, A(Ce3+) and A(Ce4+), wecalculate the ratio of Ce3+ ions among all Ce ions as A(Ce3+)/[A(Ce3+)+ A(Ce4+)]. Taking into account the complexity ofthe Ce 3d spectrum and the uncertainty of the subtractedShirley background, we estimate a maximum error of±5%.33,71,72 We obtain a reduction of 34% (14%) Ce3+ ingrazing (normal) emission mode corresponding to thestoichiometry CeO1.83 (CeO1.93). As a single O vacancy reducestwo Ce4+ ions to Ce3+, this translates to 17% (7%) of the Osites being vacant. To estimate the depth distribution of thevacancies inside the CeO2−x(111) film, we followed refs 33 and73, and assumed a simplified model of the surface, where apartially reduced (√7 × √7)-R19.1°-CeO2−x layer is stackedon top of a stoichiometric CeO2 film without intermixing. Withthis model, we estimate that vacancies are present up to a depthof ∼0.9 nm (∼3 O−Ce−O trilayers). Given that the actualsystem will have a reduction gradient,33 we expect vacanciesalso in greater depths. For more details on the XPS analysis,please refer to the Supporting Information (section S1).The ceria films were exposed to D2, while IRA spectra were
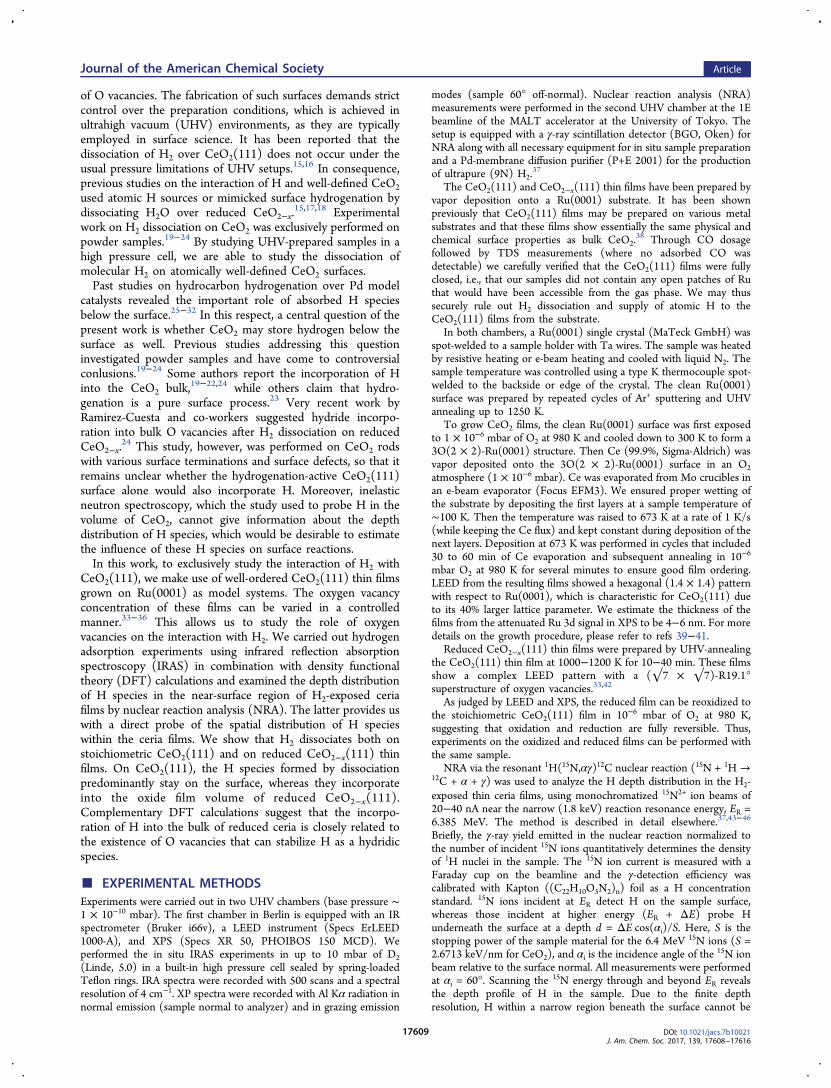
recorded to monitor stretching vibrations of hydroxyls, ν(OD),which we expect to appear in the case of D2 dissociation.
11,12,74
During these experiments we took thorough precautions toavoid OD formation through D2 dissociation at the hot filamentof a nearby ion gauge, which could be observed to occur even atpressures as low as 10−6 mbar (Figure 2b). It is known that hot
Figure 1. Ce 3d XP spectra and LEED patterns (at 102 eV) of thefully oxidized CeO2(111) (top) and reduced CeO2−x(111) (bottom)thin films, respectively. The spectra are recorded in normal (0°) andgrazing emission (60°) geometry. The dotted lines indicate theposition of the most prominent Ce3+ features.
filaments may be a source of atomic D that easily hydroxylatesthe CeO2(111) surface.
15,17 Consequently, in order to study theinteraction of molecular hydrogen with our ceria films, weperformed the D2/H2 exposure experiments with all hotfilaments in the vacuum system turned off.Exposure to 1 mbar D2 at temperatures up to 473 K did not
produce any OD signals (Figure 2a). In contrast, OD speciesdeveloped even at 300 K, when the D2 pressure was increasedto 10 mbar (Figure 2c). Different from the single sharp ODsignal observed for atomic D on CeO2(111) (2683 cm−1,Figure 2b) produced by a hot ion gauge filament forcomparison, we here observe vibrations in a broad frequencyrange between 2800 and 2600 cm−1. The signal is notsymmetric, as would be expected from natural broadening of asingle line. The irregular peak shape and the broadness of thefeature point toward the presence of multiple OD species on orwithin the CeO2(111) thin film. In repeated experiments, theshape of the broad feature varied, which we interpret as achange of the intensity ratios of the different OD signals. Weobserve similar OD signals on the reduced CeO2−x(111) thinfilm after D2 exposure under the same conditions (Figure 2d).To shed light on the nature of the OD species observed by
IRAS, we calculated their vibrational frequencies on astoichiometric CeO2(111) surface by DFT. We consideredthree possible surface OD species that differ by the oxidationstate of the coordinating Ce ions. The calculated (scaled)frequencies are summarized in Figure 3. The calculationssuggest frequencies for surface OD groups between 2745 and2708 cm−1, which depend on the number of neighboring Ce3+
ions such that the frequency increases with the local degree ofreduction. All calculated frequencies fall in the range observedexperimentally. The calculations predict that OD groupsformed in the CeO2 bulk (i.e., coordinated by four Ce ions),are considerably red-shifted, i.e., to ∼2510 cm−1. Since we donot observe any significant intensity in this frequency range, we
may safely assign the observed IRAS bands to surface ODspecies. The IRAS data in Figure 2 thus demonstrates that theD2 dissociation takes place on both the stoichiometricCeO2(111) and on the reduced CeO2−x(111) thin films.We next applied NRA to assess whether hydrogen species
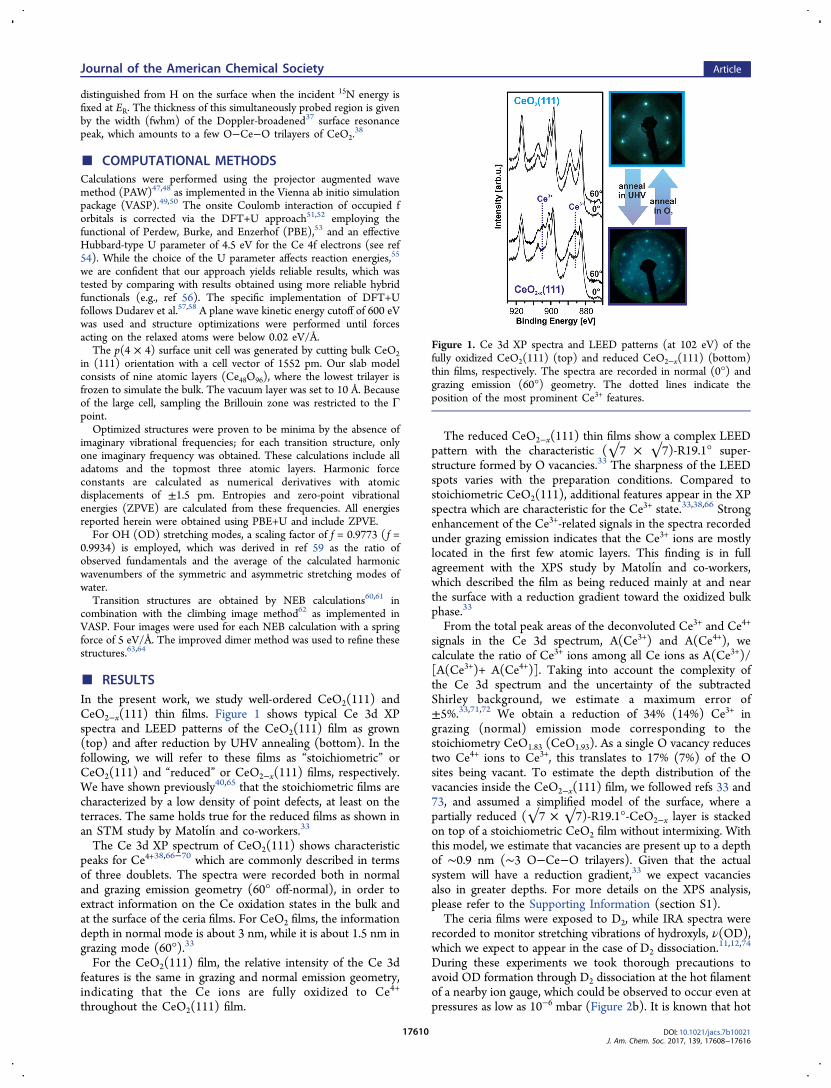
may incorporate into the ceria films upon H2 exposure. TheNRA measurements were performed after exposing theCeO2(111) and CeO2−x(111) films to 10 mbar of H2 for 15min at 300 K. We then evacuated the H2 and obtained the NRAdata at the same temperature. The results are summarized inFigure 4.On the stoichiometric CeO2(111) film (Figure 4a), we
observe a symmetric γ-yield profile of 13.6 ± 3.2 keV width(fwhm) that peaks near but not right at the surface. The slightlyshifted peak position in about 0.6 ± 0.4 nm depth indicates thatH species are mostly located on the surface and potentially alsowithin a shallow region below the surface that, however, doesnot reach deeper than ∼1.5 nm, i.e., comprises only a few oxidelayers. From the integrated γ-ray intensity and our calibratedsensitivity, the total amount of H in the surface layer of theCeO2(111) thin film is evaluated to 0.5 ± 0.1 ML (one MLrefers to the number of O sites on the surface of stoichiometricCeO2(111), i.e., 1 ML = 4.5 × 1014 cm−2). We subsequentlyrecorded a second H depth profile on the same sample toevaluate the possible influence of the NRA ion beam on the Hdistribution, as a certain degree of beam-induced H desorptionmay occur during the NRA analysis.37 The second profile inFigure 4a, however, is identical to the first one within theexperimental accuracy, showing that the H species in theshallow near-surface layer of oxidized CeO2(111) are ratherstable. Measurements of the initial surface H signal (beamenergy fixed at 6.385 MeV) as a function of the accumulated15N ion dose on freshly H2-exposed CeO2(111) films confirmthis observation (see section S2).In contrast, for the reduced CeO2−x(111) film, NRA detects
H species mainly near the surface but also in the film volume(see Figure 4b). Here, the first and the second NRA H profilesdiffer considerably. The first H profile in Figure 4b shows abroad distribution with a maximum near the surface and a largetail into the depth. The total depth-integrated γ-yieldcorresponds to 0.8 ± 0.1 ML of H, i.e., a substantially largeramount than that found in the surface layer of the fullyoxidized, stoichiometric CeO2 film. The depth extension, peak
Figure 2. IRA spectra of CeO2(111) and CeO2−x(111) thin filmsexposed to D2: (a) 1 mbar D2 on CeO2(111) at 473 K, (b) “atomic” Don CeO2(111) at 473 K, (c) 10 mbar D2 on CeO2(111) at 300 K, and(d) 10 mbar D2 on CeO2−x(111) at 300 K.
Figure 3. Scaled vibrational frequencies of surface and bulk OD (OH)groups on CeO2(111), obtained using PBE+U for structures shownschematically.
position, and asymmetric shape of the first profile from reducedCeO2−x(111) indicate that, in addition to surface H, the thinfilm contains considerable hydrogen quantities in the entire filmvolume, the highest H density residing closely (up to ∼1 nmdepth) underneath the surface with a clear concentrationgradient toward the bulk. The second scan, however, showsonly a narrow (fwhm = 8.3 keV ± 1.8 keV) symmetric peakcentered right at the surface with an integral γ-yield equivalentto ∼0.4 ± 0.1 ML H, i.e., less than half the amount of Hdetected during the first scan. These data suggest that the Hspecies absorbed in the reduced ceria film volume areapparently much less stable against desorption by the NRAion beam, so that they were already diminished uponacquisition of the second H profile, which only shows theremaining H on the surface. As shown in Figure S3, the factthat the H2-exposure at 300 K builds up significant quantities ofabsorbed H inside the reduced CeO2−x film in contrast tostoichiometric CeO2 is confirmed with increased clarity throughNRA H profiling at 200 K, where the volatile bulk-absorbed Hin CeO2−x is thermally slightly stabilized. Although theapparently volatile nature of H in the volume of reducedCeO2−x precludes the quantitative determination of the originalH content from the NRA depth profiles, the qualitative depthdistribution of the absorbed H in CeO2−x that peaks near thesurface and shows a gradient toward the deeper film volume isclearly reproduced in the profiles of Figures 4b and S3.
■ DISCUSSIONThe observation of surface OD species by IRAS (Figure 2)provides solid evidence for D2 dissociation on both thestoichiometric CeO2(111) and the reduced CeO2−x(111)surfaces under the applied conditions (10 mbar, 300 K). TheNRA profiles support these results, showing the presence of Hspecies on both film surfaces.To rationalize the experimental results, we performed a DFT
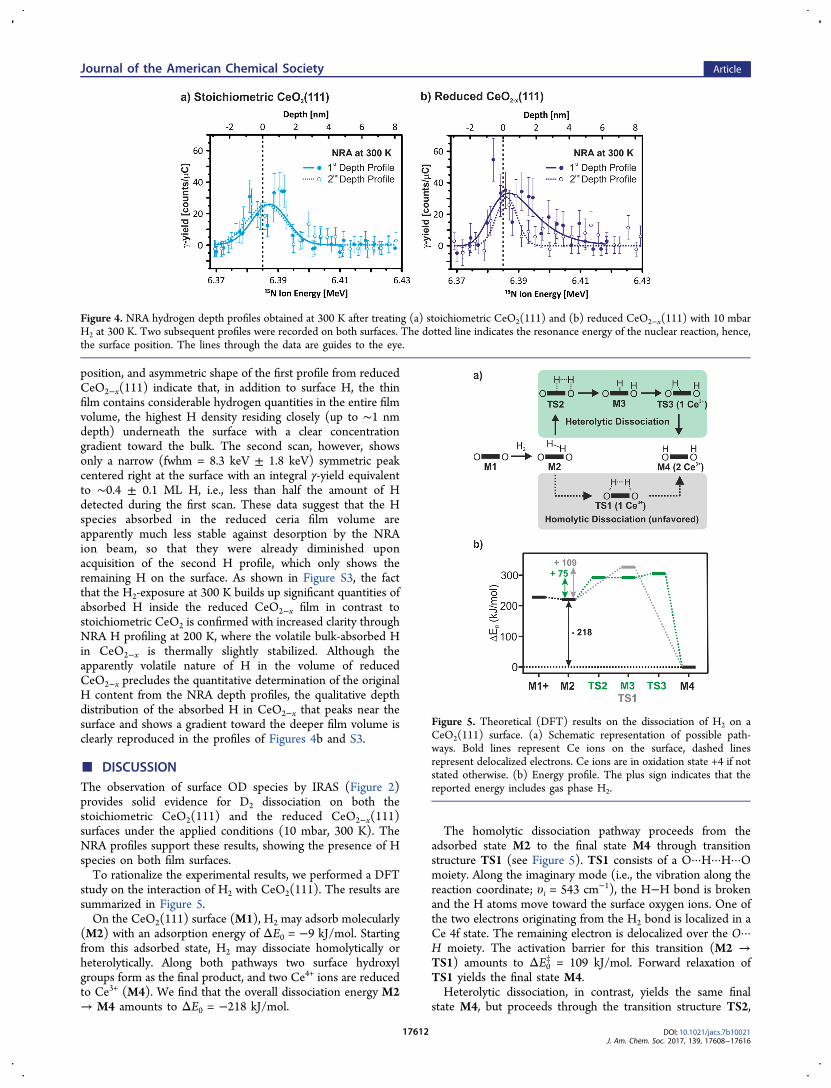
study on the interaction of H2 with CeO2(111). The results aresummarized in Figure 5.On the CeO2(111) surface (M1), H2 may adsorb molecularly
(M2) with an adsorption energy of ΔE0 = −9 kJ/mol. Startingfrom this adsorbed state, H2 may dissociate homolytically orheterolytically. Along both pathways two surface hydroxylgroups form as the final product, and two Ce4+ ions are reducedto Ce3+ (M4). We find that the overall dissociation energy M2→ M4 amounts to ΔE0 = −218 kJ/mol.
The homolytic dissociation pathway proceeds from theadsorbed state M2 to the final state M4 through transitionstructure TS1 (see Figure 5). TS1 consists of a O···H···H···Omoiety. Along the imaginary mode (i.e., the vibration along thereaction coordinate; υi = 543 cm−1), the H−H bond is brokenand the H atoms move toward the surface oxygen ions. One ofthe two electrons originating from the H2 bond is localized in aCe 4f state. The remaining electron is delocalized over the O···H moiety. The activation barrier for this transition (M2 →TS1) amounts to ΔE0
‡ = 109 kJ/mol. Forward relaxation ofTS1 yields the final state M4.Heterolytic dissociation, in contrast, yields the same final
state M4, but proceeds through the transition structure TS2,
Figure 4. NRA hydrogen depth profiles obtained at 300 K after treating (a) stoichiometric CeO2(111) and (b) reduced CeO2−x(111) with 10 mbarH2 at 300 K. Two subsequent profiles were recorded on both surfaces. The dotted line indicates the resonance energy of the nuclear reaction, hence,the surface position. The lines through the data are guides to the eye.
Figure 5. Theoretical (DFT) results on the dissociation of H2 on aCeO2(111) surface. (a) Schematic representation of possible path-ways. Bold lines represent Ce ions on the surface, dashed linesrepresent delocalized electrons. Ce ions are in oxidation state +4 if notstated otherwise. (b) Energy profile. The plus sign indicates that thereported energy includes gas phase H2.
the intermediate M3 and the transition structure TS3.Transition structure TS2 (υi = 507 cm−1) consists of an O···H+···H−···Ce moiety. The barrier for the transition M2 → TS2amounts to ΔE0
‡ = 75 kJ/mol, which is considerably lower thanthe activation barrier for homolytic dissociation (i.e., 109 kJ/mol). Forward relaxation of TS2 leads to the intermediatestructureM3, which consists of a protonated surface oxygen ionand a hydride coordinated to Ce4+ ions. The reaction energy(M2 → M3) amounts to ΔE0 = 74 kJ/mol. The energy barrierfor the reverse reaction from M3 to TS2 is less than 1 kJ/mol,which makes the hydridic M3 a metastable intermediate onstoichiometric CeO2(111). In a next step toward M4, anelectron is transferred from the H− ion to a Ce 4f state, leadingto transition structure TS3. Along the imaginary mode of TS3(υi = 331 cm−1), the H atom migrates from the Ce3+ ion to alattice oxygen ion with an intrinsic barrier of ΔE0
‡ = 14 kJ/mol(M3 → TS3). Forward relaxation from TS3 yields M4. Thesecalculated energy barriers are in good agreement with previouscalculations.11,12,75
Overall, the energetic barriers in the heterolytic dissociationpathway are considerably smaller than the barrier in homolyticdissociation. In agreement with previous studies,4,11,12 wetherefore expect H2 to dissociate on the CeO2(111) surfacethrough a heterolytic pathway.To include temperature and pressure effects, Gibbs free
energies were calculated in addition (not shown in Figure 5b).The results are visualized in Figure 6, which shows a phase
diagram for the states M1−M4. The creation of O vacanciesthrough O release at high temperatures is not included in thediagram. Molecular adsorption (M2) is endergonic above 100K due to entropic effects. Therefore, at T > 100 K, the overallbarrier for the surface hydrogenation (M1 → TS3) significantlyexceeds the dissociation barrier (M2 → TS3). We predict fastsurface hydrogenation (k > 1 s−1, i.e., a typical rate constant intemperature-programmed reduction experiments) to occur attemperatures above 600 K and at H2 partial pressures above 0.1mbar. The limiting pressure of 0.1 mbar to achieve H2dissociation exceeds by far the pressures typically used insurface science studies and thereby explains why H2dissociation could not be observed previously on stoichiometricCeO2(111) at lower H2 partial pressures.
15,16
Moreover, we investigated the effect of O vacancies on thestability of surface OH groups. Therefore, we introduced asingle O vacancy in the second layer (0.3 nm in depth) of the(4 × 4) CeO2 unit cell, resulting in a vacancy density of 1/16−
6% with respect to the number of O ions in pristine CeO2.With this small density of O vacancies, the hydrogenationenergy (M1 → M4) changes from ΔE0 = −227 kJ/mol onpristine CeO2(111) to ΔE0 = −147 kJ/mol. Thus, O vacanciesin the second O layer destabilize surface OH.We further investigated whether surface OH might be
transferred to the CeO2 bulk. In principle, H species might betransferred from the surface into the bulk, where they wouldoccupy an empty octahedral site and form an OH− species bycoordinating to one of the surrounding O ions. We found,however, that such a H transfer from the surface to the secondO layer is strongly endothermic, with ΔE = +154 kJ/mol per Hatom. H transfer to a bulk site is even more endothermic, withΔE = +179 kJ/mol. The overall hydrogenation energies relativeto 1/2 H2 are ΔE(1/2 H2) = +28 kJ/mol for hydrogenation ofthe second O layer and ΔE(1/2 H2) = +53 kJ/mol for bulkhydrogenation. These values are in good agreement withpreviously calculated hydrogenation energies.76 We could notreproduce the exothermic bulk hydrogenation reported in anearly theoretical study on H2 dissociation over stoichiometricCeO2.
77 In the presence of bulk O vacancies, bulk hydro-genation is slightly less endothermic, i.e., ΔE(1/2 H2) = +39kJ/mol. The DFT-predicted endothermic nature of bulkhydroxylation for stoichiometric CeO2 is fully consistent withour NRA H profiles that never show appreciable H quantities inthe volume of the CeO2(111) films. We disregard thepossibility that the H apparently located in the shallow near-surface layer (implied by the small peak shift of ∼0.5 nm in theH profiles) of the CeO2(111) films resulted from subsurfacehydroxylation by H2 dissociation on a perfectly ordered andstoichiometric CeO2(111) surface. It was noted that the size ofthis peak shift varied between several depth profiles taken fromthe same sample and sometimes (but not always) increasedwith the applied 15N ion dose (see section S4). It is reasonablethat H interacts with ion beam-induced defects in the near-surface layer. Hence, we conclude that the H2 interaction withideal stoichiometric CeO2(111) only produces surface hydrox-yls (provided the temperature remains below the onset ofassociative desorption of OH as H2O, which will in turn createO vacancies in the surface).17
The chemical nature of the H species found inside thereduced CeO2−x(111) films still needs to be clarified. Since Hincorporation into the bulk of reduced CeO2−x seems todepend on the presence of O vacancies that carry excessnegative charge near a reduced Ce3+ ion, it may well be that Hexists near O vacancies as a hydride species or as H2. Toinvestigate this possibility, we performed DFT calculations andfound that H− may occupy vacant O lattice positions. While theformation of H− inside an isolated O vacancy on the surface (θ= 1/16) is endothermic with ΔE(1/2 H2) = +76 kJ/mol, theformation of H− within an isolated bulk O vacancy is basicallyenergy neutral (+4 kJ/mol). Thus, in the presence of Ovacancies bulk H− is clearly preferred energetically over bulkOH− (ΔE(1/2 H2) = +39 kJ/mol). Interestingly, the energiesrequired to substitute bulk and subsurface O ions with ahydride species are similar (246 and 268 kJ/mol, respectively).Since the substitution energy is the sum of O defect formationenergy and hydrogenation energy, the differences in thehydrogenation energies are a result of the different O defectformation energies for subsurface (170 kJ/mol in refs 78 and79) and bulk (266 kJ/mol in ref 80) O ions. Thus, hydrogendestabilizes subsurface O vacancies more than bulk vacancies.
Figure 6. Phase diagram for states M1−M4 in H2 dissociation. p is thepartial pressure of H2, p0 is the standard pressure. The area in whichM4 is formed fast (k > 1 s−1) is marked in green. Efficient dissociationof molecular hydrogen only takes place at high temperatures and highpressures.
The weak stabilization of H− by O vacancies in the bulk ofreduced CeO2−x(111) naturally explains the volatile nature ofthe H species in the volume of our reduced CeO2−x(111) filmsthat are much more susceptible to ion beam-induceddesorption than surface OH on CeO2(111). The Hconcentration gradient from the surface toward the bulkobserved in the H profiles of reduced CeO2−x also suggests H-interaction with O vacancies, which are known to have a similardepth distribution.33 Our proposed explanation is also fullyconsistent with a very recent inelastic neutron scattering studythat reported the formation of Ce hydride species in H2-exposed ceria nanorods.24 Moreover, the significantly smallerfwhm of the NRA surface resonance peak in the H profiles ofCeO2−x(111) (∼9 keV) compared to CeO2(111) (13−15 keV)(see section S5) may be an indication for a different chemicalnature of the probed H species in the two cases−mostlyhydroxyls on CeO2(111) and mostly hydride on CeO2−x(111).Further experiments to clarify the chemical identity of thesurface H species on CeO2(111) and CeO2−x(111) films areunderway and will be reported elsewhere. Furthermore, studieson the interaction of H2 with CeO2−x(111) films of variableoxygen vacancy concentration would be highly desirable to gaina comprehensive understanding of the underlying chemistry, asit has been demonstrated for comparable oxide systems.81,82
In summary, both our experimental and theoretical resultsshow that O vacancies on CeO2(111) are crucial for itsinteraction with H2. This finding might explain why previousstudies came to contradicting conclusions on whether H speciesmay dissolve into CeO2.
19−24 These studies investigatedpowder samples, which typically exhibit a high concentrationof defects, such as O vacancies. The nature and theconcentration of these vacancies will vary considerably withthe sample preparation, thus affecting the interaction with H2.Moreover, our study hints at the possibility that chemicallydifferent hydrogen species exist on and within stoichiometricCeO2(111) as opposed to reduced CeO2−x(111) films. Assurface OH has been predicted to be part of the rate-determining transition state for alkyne hydrogenation on CeO2at large H coverage,10 this might give an important clue tounderstand the negative influence of oxygen vacancies on thecatalytic activity of partially reduced ceria in the selectivesemihydrogenation of alkynes.
■ CONCLUSIONS
We investigated the interaction of H2 with well-definedstoichiometric CeO2(111) and reduced CeO2−x(111) thinfilms through IR spectroscopy and NRA and found that H2only dissociates at elevated pressures in the mbar regime. Onthe fully oxidized CeO2(111) surface, H species formed by H2dissociation are primarily located on the oxide surface ashydroxyls. For the reduced CeO2−x(111) thin films, H is alsofound in appreciable quantities in the entire ceria volume. Onthe basis of DFT calculations and the shape of the H depthprofile that mimics the O vacancy distribution, we propose thatO vacancies stabilizing H in the form of hydride species in theoxide bulk are crucial for the incorporation of H in the interiorof reduced CeO2−x films.We believe that our findings provide an important impetus to
understand the reactivity of CeO2 in selective alkyne hydro-genation reactions. Reactivity studies on CeO2(111) thin filmmodel catalysts with controlled O vacancy densities are underway.
■ ASSOCIATED CONTENT*S Supporting InformationThe Supporting Information is available free of charge on theACS Publications website at DOI: 10.1021/jacs.7b10021.
Details on XPS evaluation, NRA decay curves, additionalNRA H profiles, beam-induced shifts in NRA profiles,NRA resonance peak widths, and theoretical simulations(PDF)
■ ACKNOWLEDGMENTSThis work has been supported by the German ResearchFoundation (CRC 1109), COST action CM1104. H.-J.F.thanks “Fonds der Chemischen Industrie” for support. Theauthors are grateful for computing time at the high-perform-ance computer centers HLRN (North-German Supercomput-ing Alliance). F.C. and T.K. are grateful for financial supportfrom the Alexander von Humboldt Foundation. K.W. is amember of the IMPRS Functional Interfaces in Physics andChemistry and is supported through a grant by the DFG-NSFC(No. FR554/18-1).
■ REFERENCES(1) Sun, C. W.; Li, H.; Chen, L. Q. Energy Environ. Sci. 2012, 5, 8475.(2) Vile, G.; Bridier, B.; Wichert, J.; Perez-Ramírez, J. Angew. Chem.,Int. Ed. 2012, 51, 8620.(3) Vile, G.; Wrabetz, S.; Floryan, L.; Schuster, M. E.; Girgsdies, F.;Teschner, D.; Perez-Ramírez, J. ChemCatChem 2014, 6, 1928.(4) Carrasco, J.; Vile, G.; Fernandez-Torre, D.; Perez, R.; Perez-Ramírez, J.; Ganduglia-Pirovano, M. V. J. Phys. Chem. C 2014, 118,5352.(5) Albani, D.; Capdevila-Cortada, M.; Vile, G.; Mitchell, S.; Martin,O.; Lopez, N.; Perez-Ramírez, J. Angew. Chem., Int. Ed. 2017, 56,10755.(6) Tejeda-Serrano, M.; Cabrero-Antonino, J. R.; Mainar-Ruiz, V.;Lopez-Haro, M.; Hernandez-Garrido, J. C.; Calvino, J. J.; Leyva-Perez,A.; Corma, A. ACS Catal. 2017, 7, 3721.(7) Pierce, K. G.; Barteau, M. A. J. Phys. Chem. 1994, 98, 3882.(8) Nakajima, T.; Sonoda, T.; Miyata, H.; Kubokawa, Y. J. Chem. Soc.,Faraday Trans. 1 1982, 78, 555.(9) Halliday, M. M.; Kemball, C.; Leach, H. F. J. Chem. Soc., FaradayTrans. 1 1974, 70, 1743.(10) García-Melchor, M.; Bellarosa, L.; Lopez, N. ACS Catal. 2014, 4,4015.(11) García-Melchor, M.; Lopez, N. J. Phys. Chem. C 2014, 118,10921.(12) Negreiros, F. R.; Camellone, M. F.; Fabris, S. J. Phys. Chem. C2015, 119, 21567.(13) Vile, G.; Colussi, S.; Krumeich, F.; Trovarelli, A.; Perez-Ramírez,J. Angew. Chem., Int. Ed. 2014, 53, 12069.