1 Towards a Flood Resilient Pavement System in Canada - A Rigid Pavement Design Approach Oluremi Oyediji, MASc Candidate, Centre for Pavement and Transportation Technology (CPATT), University of Waterloo Jessica Achebe, Ph.D Candidate, Centre for Pavement and Transportation Technology (CPATT), University of Waterloo Susan L. Tighe Ph.D., P. Eng., Deputy Provost and Associate Vice- President Integrated Planning and Budgeting, Norman W. McLeod Professor in Sustainable Pavement Engineering, University of Waterloo Paper prepared for presentation at the INNOVATION IN GEOTECHNICAL AND MATERIALS ENGINEERING Session of the 2019 TAC-ITS Canada Joint Conference, Halifax, NS Acknowledgement Centre for Pavement and Transportation Technology (CPATT)
Transcript
1
Towards a Flood Resilient Pavement System in Canada - A Rigid Pavement Design Approach
Oluremi Oyediji, MASc Candidate, Centre for Pavement and Transportation Technology (CPATT), University of Waterloo
Jessica Achebe, Ph.D Candidate, Centre for Pavement and Transportation Technology (CPATT), University of Waterloo
Susan L. Tighe Ph.D., P. Eng., Deputy Provost and Associate Vice-President Integrated Planning and Budgeting, Norman W. McLeod
Professor in Sustainable Pavement Engineering, University of Waterloo
Paper prepared for presentation
at the INNOVATION IN GEOTECHNICAL AND MATERIALS ENGINEERING Session
of the 2019 TAC-ITS Canada Joint Conference, Halifax, NS
Acknowledgement
Centre for Pavement and Transportation Technology (CPATT)
2
Abstract
As climate change continues to threaten pavement infrastructural performance across the World, the need for sustainable solutions for pavement adaptation cannot be overstated. In Canada, flooding is a prominent climate hazard common to most Canadian provinces and adaptation of pavements to this hazard is desired. Based on previous investigations, concrete pavements are recorded as sustainable, resilient to flood hazards, and proposed to be a good pre-flood strategy. However, design properties need to be given utmost consideration to provide required resilience. This paper takes a design approach to examine the resilience of Jointed Plain Concrete Pavement (JPCP) to flood by modelling the performance of matrices of typical PCC pavement designs in Canada under a Representative Concentration Pathway RCP of 4.5 W/m 2 future precipitation scenario. The AASHTO Pavement ME Design program is used to simulate and predict performance changes under flood scenarios taking the Provinces of Ontario and Manitoba as case studies. In the Ontario study, mean flood damage peaked at 5.99% and 2.39% for collector and arterial JPCP pavement. In the Manitoba study, a total of 27 pavement classes was developed based on typical traffic, slab thickness and subgrade parameters common to the province. From the analysis of all pavement design classes, minimum and maximum damage observed was 0.31% and 3.03% respectively. The performance of the pavement designs classes in terms of flood resilience, service life and cost feasibility were analyzed with respect to traffic and subgrade conditions. Generally, results provided insight into the resilience and adaptive capacity of rigid pavements to climate flood hazards under Canadian climate condition.
Introduction
Climate change is increasing the occurrence of climate hazards across Canada. Flooding is the most common climate hazard of high recurrence in all Canadian province. Based on a report published by Public Safety Canada, flooding occurred 241 times more than other climate hazards between1900 to 2005 (Sandink et al. 2010) and its frequency has been on the rise. Some instances include notable flood events that occurred between 2005 and 2018 in Ontario, Manitoba, New Brunswick, Quebec and Alberta. The likelihood of the occurrence of flood events such as storm surge, flash floods, extreme precipitation in almost all of Canada’s provinces during the spring season have remained high over the past two decades and future projections under climate change indicates increases in event frequency in major parts of the country (Gaus et al 2018).
In the wake of extreme events, two major infrastructure systems, water and transportation are reported vulnerable to flood impact. Transportation is of particular interest as it is pivotal to the sustenance of socioeconomic activities such as agriculture, natural resources, fisheries, tourism, insurance and health; which all depend on a safe and reliable transportation network (Warren and Lemmen 2014). In 2011, Transport Canada reported transport services contributed up to 4.2% of Canada’s gross domestic product (GDP) totaling over 100 billion dollars in that year. Therefore it is of national interest to ensure transport assets are preserved and continue to provide service even in the wake of unforgivable climate events. Transport services in Canada can be grouped into air, marine, rail and roads systems. Out of this four, road transportation is noted as most important for passenger and freight transportation, local (intra-city) and intercity transportation, intra-provincial transportation activities, and trade between Canada and the United States (in terms of value transported)(Transport Canada 2011). Road pavement, an operational and functional component of any road infrastructure, is not inexorable to climate hazards (Schweikert et al. 2014). The underlying reason for this vulnerability can be traced to the design and engineering behind pavement assets as considerations were only given to climate conditions
3
at the time of construction. As a consequence, changes in climate conditions coupled with the frequent occurrence of climate hazards, predominantly flooding as respective to Canada, limits capacity to withstand extreme conditions beyond acceptable thresholds, relatively reducing pavement’s service life. Potentially resulting in increased maintenance and rehabilitation costs (Prowse et al., 2009). Therefore, given its importance, potential climate change impacts on pavement need to be addressed (Tighe 2015).
To properly address the influence of climate-induced flood hazards on the pavement, a number of studies have been conducted by various researchers in the pavement community to understand the interaction between flood hazards and pavement infrastructure from a performance perspective. A common theme that resonates from the conclusion of studies is the better performance recorded under rigid pavements compared to flexible pavement types. The premise is that flooding threatens short and long term performance of asphalt pavements more than rigid pavements, mostly recommending rigid pavements as a flood adaptation measure for pavement sustainability. Chen and Zhang 2014 investigated the functional performance of pavements submerged in the 200 - 250mm flood induced by the 2005 Hurricane Katrina event. The researchers observed considerable increase in the International Roughness Index (IRI) of flexible pavements to rigid pavements after debris carrying trucks plied the inundated pavements. Unfortunately, debris carrying trucks are unavoidable after a flood events as flood debris detrimental to human and environmental wellbeing need to be removed. In the same vein, Gaspard et al 2006 evaluated structural performance of submerged pavements affected by hurricane Katrina employing pavement parameters such as pavement Deflection at the plate (D1), Effective Structural Number (SNeff) and subgrade Resilient Modulus (Mr) of inundated pavements. Their study observed diminutive loss of SNeff and subgrade resilient modulus of the concrete pavement when compared to asphalt concrete pavement. Likewise in Australia, a study analyzed functional performance data before and after the 209.45mm 2011 Queensland flood event. Authors concluded that high strength rigid pavements provided the highest resilience to flood damage, thus proposed usage of rigid pavements as a pre-flood adaptation strategy. (Khan et al. 2017). Based on these studies, rigid pavement can be proposed as a better alternative for roads in flood plain areas based on its flood resilience properties. However, it is important to state that damage may be respective to rigid pavement type.
The performance of Continuously Reinforced Concrete Pavement (CRCP) and Jointed Plain Concrete Pavement (JPCP) rigid pavement performance under flood conditions may be different. This is evident based on a study conducted on CRCP following the 1270mm flood in the 2017 hurricane Harvey in Texas. The CRCP sections required no major as they were resilience to both traffic and inundation conditions without premature deterioration. The CRCP structure though consist of a heavily stabilized base which may have provided waterproof properties for the underlying layers, allowing adequate drainage and enhancing soil stiffness (Powell 2018, Lukefahr 2018). In Canada, JPCP is the dominant rigid pavement type and there has been no intrinsic investigation to evaluate its structural and functional performance when inundated due to flood events. To gain insight, modelling techniques can be employed. A modelling approach is the Mechanistic Empirical Pavement Design Guide (MEPDG) as it properly incorporates important climate parameters in its pavement performance simulation (Tighe et al. 2008, Mills et al. 2007; Meagher et al. 2012 Lu et al. 2018). By modelling the performance of matrices of typical PCC pavement designs in Canada under extreme climate scenarios, JPCP flood impact was investigated.
4
Methodology
To model the effect of flooding on concrete pavements under Canadian climate condition, pavement design practice in two Canadian provinces, Ontario and Manitoba, was studied. Available data and pavement structural information published by provincial road agencies served as representative design inputs. The Mechanistic Empirical Pavement Design Guide (MEPDG) (ARA 2004, 2011) is employed as a design tool to simulate the performance of typical pavement structures identical to the provinces considering no-flood and flood scenario. A no-flood scenario or base case scenario is the performance prediction using historical precipitation data while flood scenario is the performance prediction under climate-induced extreme precipitation values. These extreme values were obtained in form of Intensity Duration Frequency data considering a future climate period of (2018 -2100) from the Intensity Duration Frequency Climate Change Tool (IDF_CC Tool 3.0). The IDF_CC tool is an open source information which estimates precipitation accumulation depths for a variety of return periods (2, 5, 10, 25, 50 and 100 years) and durations (5, 10, 15 and 30 minutes and 1, 2, 6, 12 and 24 hours) for the Canadian environment. The tool engages 24 Global Circulation Models (GCMs) and 9 downscaled GCMs using rigorous downscaling method such as spatial and temporal downscaling, statistical analysis and optimization to update pre-estimated IDF from historical precipitation data to IDF under Representative Concentration Pathway (RCP 2.6, 4.5 and 8.5W/m2) climate change scenarios (Simonovic et al. 2016).
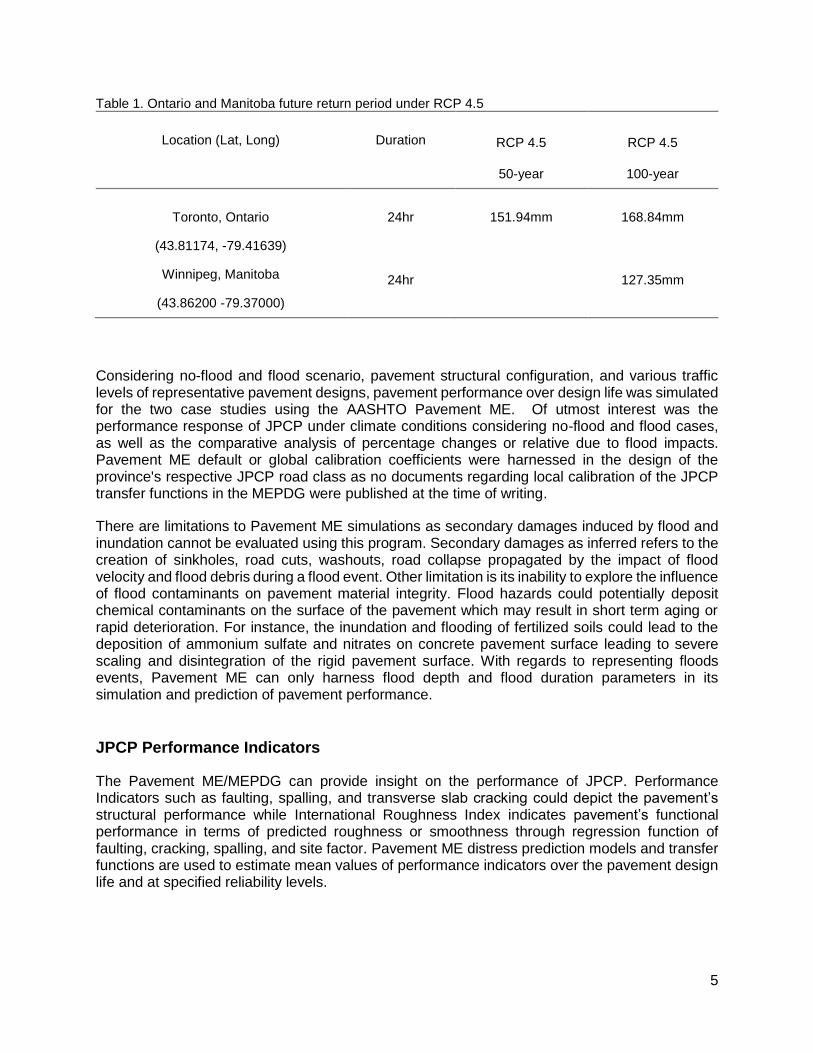
Out of the RCP scenarios, RCP 4.5, an intermediate emission scenario was chosen based on extensive analysis of RCP scenarios future flood uncertainties across Canada. RCP 4.5 is reported to have the least uncertainty in projected increase or decrease in flood frequencies across Canada compared to other RCP scenarios. Northwest Territories, Yukon Territory, and Nunavut, and southwestern Ontario are projected to experience higher flood frequencies in the future as a 100-year historical flood could reduce to 10–60 years by the end of the 21st century. In contrast, return flood in northern prairies and north-central Ontario could experience lower flood frequencies, with a return period of 100-year historical floods becoming 160–200 years return period in the future (Gaur et al 2018). As a consequence, extreme precipitation values for 50 and 100 years return period with repeated cycles of flood events under RCP 4.5 were generated for modelling the Ontario case study, and a RCP 4.5 100 year flood event in the Manitoba case study using an ensemble of climate prediction models. To establish a baseline scenario, historical climate data available through the National Centers for Environmental Prediction (NCEP) North American Regional Reanalysis (NARR) program is obtained via the AASTHO M-E design open source database. Table 1 below shows the mean values of extreme precipitation under RCP 4.5 scenario at case study locations.
5
Table 1. Ontario and Manitoba future return period under RCP 4.5
Location (Lat, Long) Duration RCP 4.5
50-year
RCP 4.5
100-year
Toronto, Ontario
(43.81174, -79.41639)
Winnipeg, Manitoba
(43.86200 -79.37000)
24hr
24hr
151.94mm 168.84mm
127.35mm
Considering no-flood and flood scenario, pavement structural configuration, and various traffic levels of representative pavement designs, pavement performance over design life was simulated for the two case studies using the AASHTO Pavement ME. Of utmost interest was the performance response of JPCP under climate conditions considering no-flood and flood cases, as well as the comparative analysis of percentage changes or relative due to flood impacts. Pavement ME default or global calibration coefficients were harnessed in the design of the province's respective JPCP road class as no documents regarding local calibration of the JPCP transfer functions in the MEPDG were published at the time of writing.
There are limitations to Pavement ME simulations as secondary damages induced by flood and inundation cannot be evaluated using this program. Secondary damages as inferred refers to the creation of sinkholes, road cuts, washouts, road collapse propagated by the impact of flood velocity and flood debris during a flood event. Other limitation is its inability to explore the influence of flood contaminants on pavement material integrity. Flood hazards could potentially deposit chemical contaminants on the surface of the pavement which may result in short term aging or rapid deterioration. For instance, the inundation and flooding of fertilized soils could lead to the deposition of ammonium sulfate and nitrates on concrete pavement surface leading to severe scaling and disintegration of the rigid pavement surface. With regards to representing floods events, Pavement ME can only harness flood depth and flood duration parameters in its simulation and prediction of pavement performance.
JPCP Performance Indicators
The Pavement ME/MEPDG can provide insight on the performance of JPCP. Performance Indicators such as faulting, spalling, and transverse slab cracking could depict the pavement’s structural performance while International Roughness Index indicates pavement’s functional performance in terms of predicted roughness or smoothness through regression function of faulting, cracking, spalling, and site factor. Pavement ME distress prediction models and transfer functions are used to estimate mean values of performance indicators over the pavement design life and at specified reliability levels.
6
JPCP Performance Results
Since the influence of design inputs on performance trends over design life can be easily visualized. Plausible extreme precipitation events under climate change scenario were modelled and relative impact on performance trends assessed. Relative change in performance between no-flood and flood scenario under RCP 4.5 is then calculated as percentage flood damage. As IRI is a function of joint faulting and slab cracking along with climate and subgrade factors, (AASHTO 2008) it gives a holistic representation of overall pavement performance. Therefore, IRI was the main performance parameter used to estimate flood damage. However, consideration was given to faulting performance in the Ontario study. This is because JPCP faulting performance had a proportional relationship to IRI in the study. Whereas, in the Manitoba case study, damage was only noted under the IRI performance of all pavement classes considered.
Case Study of JPCP Design in Ontario
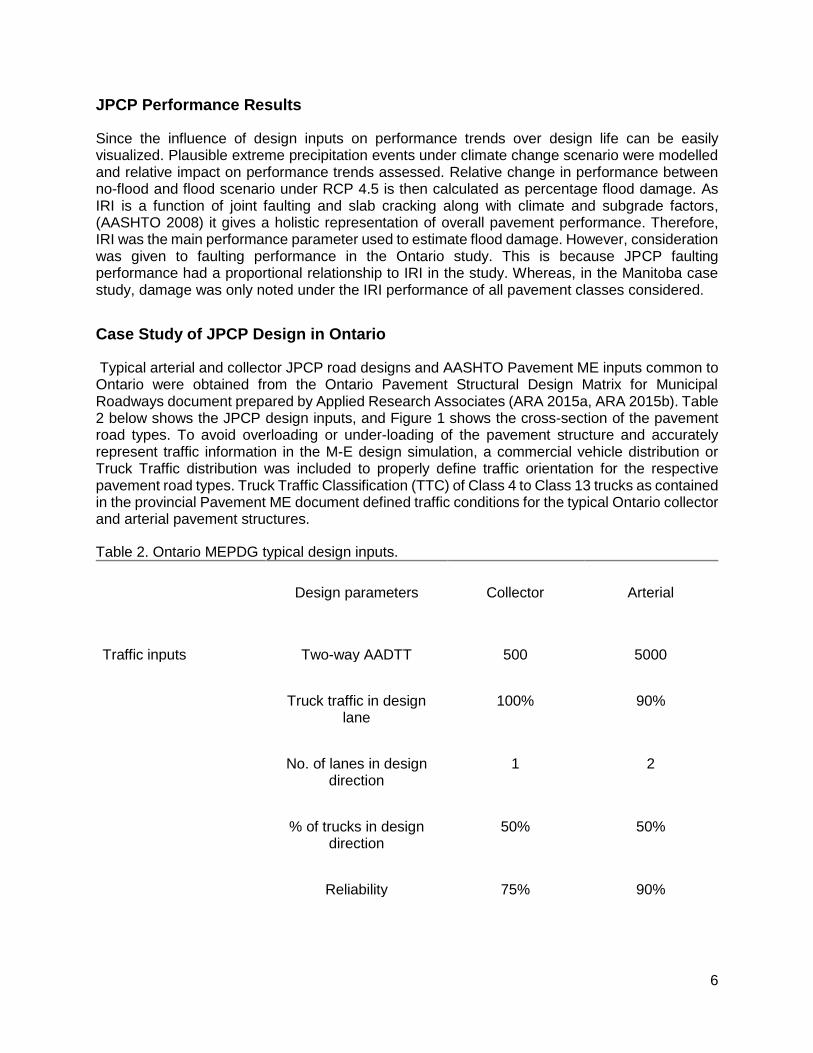
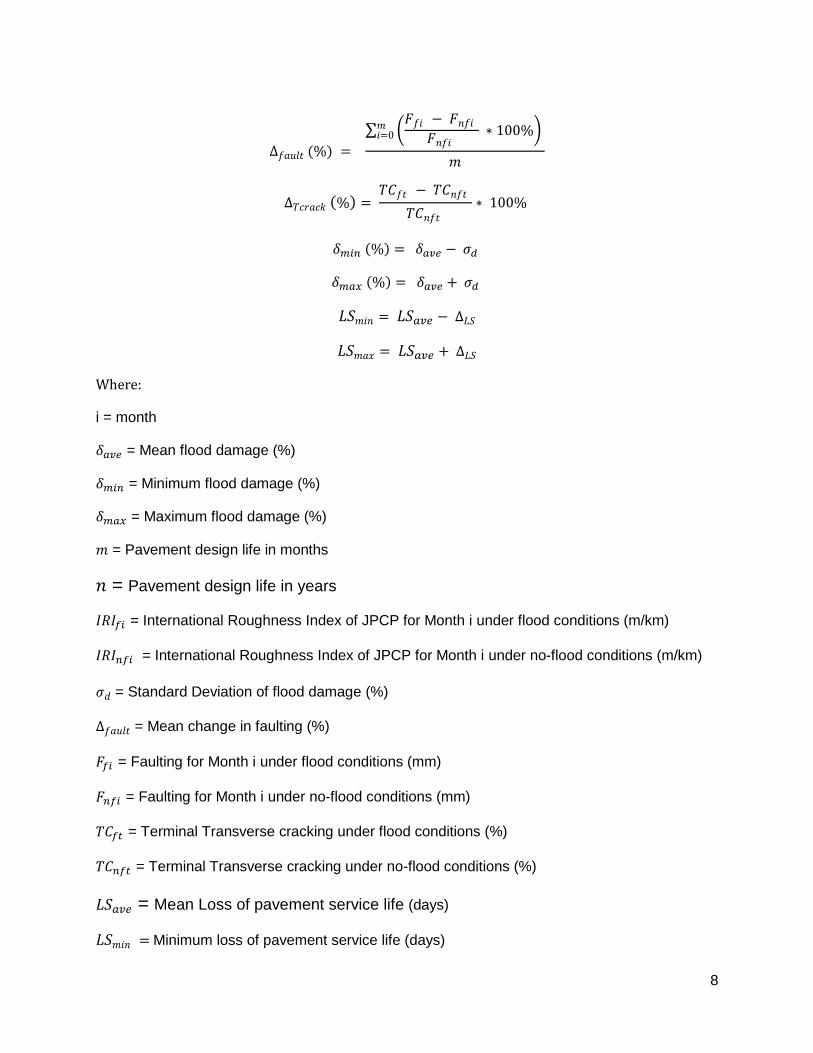
Typical arterial and collector JPCP road designs and AASHTO Pavement ME inputs common to Ontario were obtained from the Ontario Pavement Structural Design Matrix for Municipal Roadways document prepared by Applied Research Associates (ARA 2015a, ARA 2015b). Table 2 below shows the JPCP design inputs, and Figure 1 shows the cross-section of the pavement road types. To avoid overloading or under-loading of the pavement structure and accurately represent traffic information in the M-E design simulation, a commercial vehicle distribution or Truck Traffic distribution was included to properly define traffic orientation for the respective pavement road types. Truck Traffic Classification (TTC) of Class 4 to Class 13 trucks as contained in the provincial Pavement ME document defined traffic conditions for the typical Ontario collector and arterial pavement structures.
Table 2. Ontario MEPDG typical design inputs.
Design parameters Collector Arterial
Traffic inputs Two-way AADTT 500 5000
Truck traffic in design lane
100% 90%
No. of lanes in design direction
1 2
% of trucks in design direction
50% 50%
Reliability 75% 90%
7
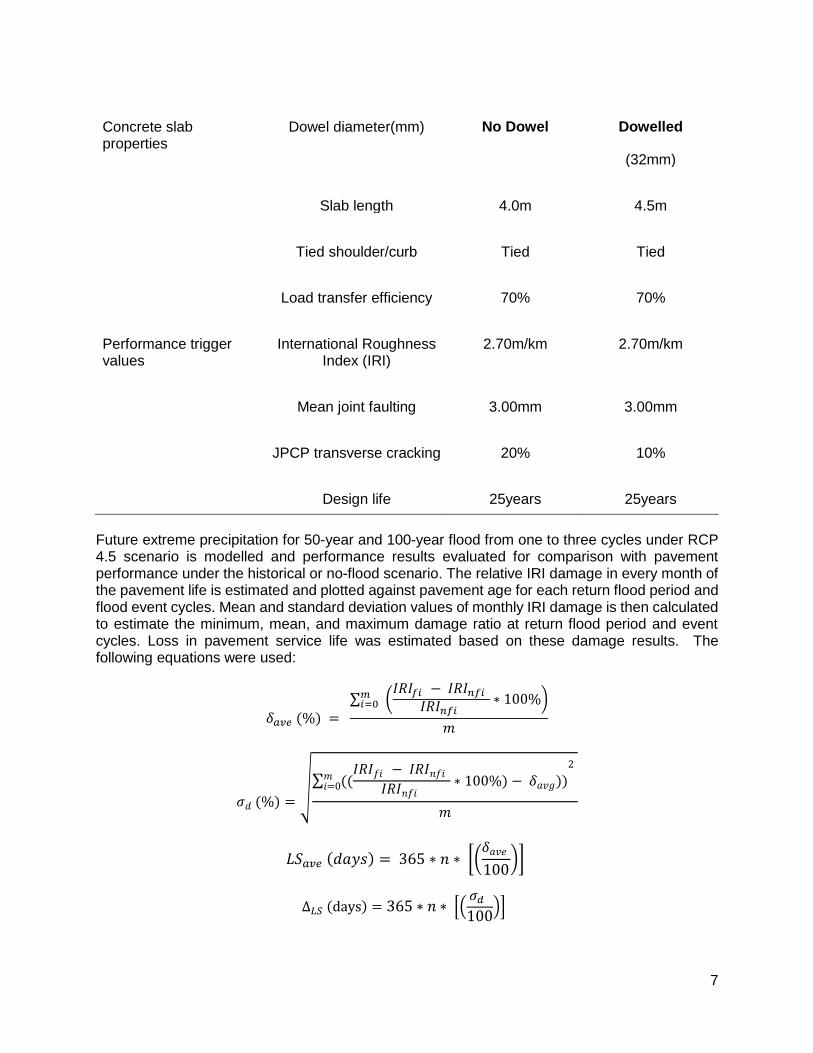
Concrete slab properties
Dowel diameter(mm) No Dowel
Dowelled
(32mm)
Slab length 4.0m 4.5m
Tied shoulder/curb Tied Tied
Load transfer efficiency 70% 70%
Performance trigger values
International Roughness Index (IRI)
2.70m/km 2.70m/km
Mean joint faulting 3.00mm 3.00mm
JPCP transverse cracking 20% 10%
Design life 25years 25years
Future extreme precipitation for 50-year and 100-year flood from one to three cycles under RCP 4.5 scenario is modelled and performance results evaluated for comparison with pavement performance under the historical or no-flood scenario. The relative IRI damage in every month of the pavement life is estimated and plotted against pavement age for each return flood period and flood event cycles. Mean and standard deviation values of monthly IRI damage is then calculated to estimate the minimum, mean, and maximum damage ratio at return flood period and event cycles. Loss in pavement service life was estimated based on these damage results. The following equations were used:
𝛿𝑎𝑣𝑒 (%) =
∑ (𝐼𝑅𝐼𝑓𝑖 − 𝐼𝑅𝐼𝑛𝑓𝑖
𝐼𝑅𝐼𝑛𝑓𝑖 ∗ 100%)𝑚
𝑖=0
𝑚
𝜎𝑑 (%) =√
∑ ((𝐼𝑅𝐼𝑓𝑖 − 𝐼𝑅𝐼𝑛𝑓𝑖
𝐼𝑅𝐼𝑛𝑓𝑖 ∗ 100%) − 𝛿𝑎𝑣𝑔))
2
𝑚𝑖=0
𝑚
𝐿𝑆𝑎𝑣𝑒 (𝑑𝑎𝑦𝑠) = 365 ∗ 𝑛 ∗ [(𝛿𝑎𝑣𝑒
100)]
∆𝐿𝑆 (days) = 365 ∗ 𝑛 ∗ [(𝜎𝑑
100)]
8
∆𝑓𝑎𝑢𝑙𝑡 (%) =
∑ (𝐹𝑓𝑖 − 𝐹𝑛𝑓𝑖
𝐹𝑛𝑓𝑖 ∗ 100%) 𝑚
𝑖=0
𝑚
∆𝑇𝑐𝑟𝑎𝑐𝑘 (%) = 𝑇𝐶𝑓𝑡 − 𝑇𝐶𝑛𝑓𝑡
𝑇𝐶𝑛𝑓𝑡
∗ 100%
𝛿𝑚𝑖𝑛 (%) = 𝛿𝑎𝑣𝑒 − 𝜎𝑑
𝛿𝑚𝑎𝑥 (%) = 𝛿𝑎𝑣𝑒 + 𝜎𝑑
𝐿𝑆𝑚𝑖𝑛 = 𝐿𝑆𝑎𝑣𝑒 − ∆𝐿𝑆
𝐿𝑆𝑚𝑎𝑥 = 𝐿𝑆𝑎𝑣𝑒 + ∆𝐿𝑆
Where:
i = month
𝛿𝑎𝑣𝑒 = Mean flood damage (%)
𝛿𝑚𝑖𝑛 = Minimum flood damage (%)
𝛿𝑚𝑎𝑥 = Maximum flood damage (%)
𝑚 = Pavement design life in months
𝑛 = Pavement design life in years
𝐼𝑅𝐼𝑓𝑖 = International Roughness Index of JPCP for Month i under flood conditions (m/km)
𝐼𝑅𝐼𝑛𝑓𝑖 = International Roughness Index of JPCP for Month i under no-flood conditions (m/km)
𝜎𝑑 = Standard Deviation of flood damage (%)
∆𝑓𝑎𝑢𝑙𝑡 = Mean change in faulting (%)
𝐹𝑓𝑖 = Faulting for Month i under flood conditions (mm)
𝐹𝑛𝑓𝑖 = Faulting for Month i under no-flood conditions (mm)
𝑇𝐶𝑓𝑡 = Terminal Transverse cracking under flood conditions (%)
𝑇𝐶𝑛𝑓𝑡 = Terminal Transverse cracking under no-flood conditions (%)
𝐿𝑆𝑎𝑣𝑒 = Mean Loss of pavement service life (days)
𝐿𝑆𝑚𝑖𝑛 = Minimum loss of pavement service life (days)
9
𝐿𝑆𝑚𝑎𝑥 = Maximum loss of pavement service life (days)
a. Collector pavement b) Arterial pavement
Figure 1. Pavement structure for a Collector and Arterial Typical Ontario Pavement
Case Study of JPCP Design in Manitoba
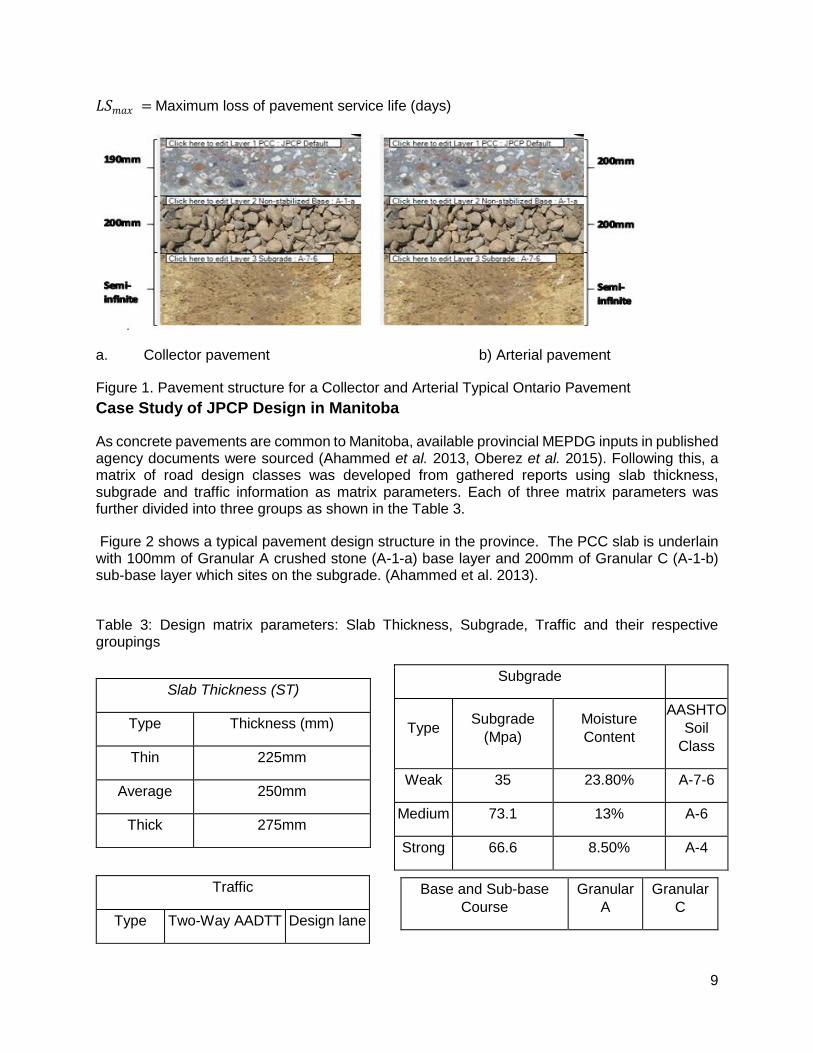
As concrete pavements are common to Manitoba, available provincial MEPDG inputs in published agency documents were sourced (Ahammed et al. 2013, Oberez et al. 2015). Following this, a matrix of road design classes was developed from gathered reports using slab thickness, subgrade and traffic information as matrix parameters. Each of three matrix parameters was further divided into three groups as shown in the Table 3.
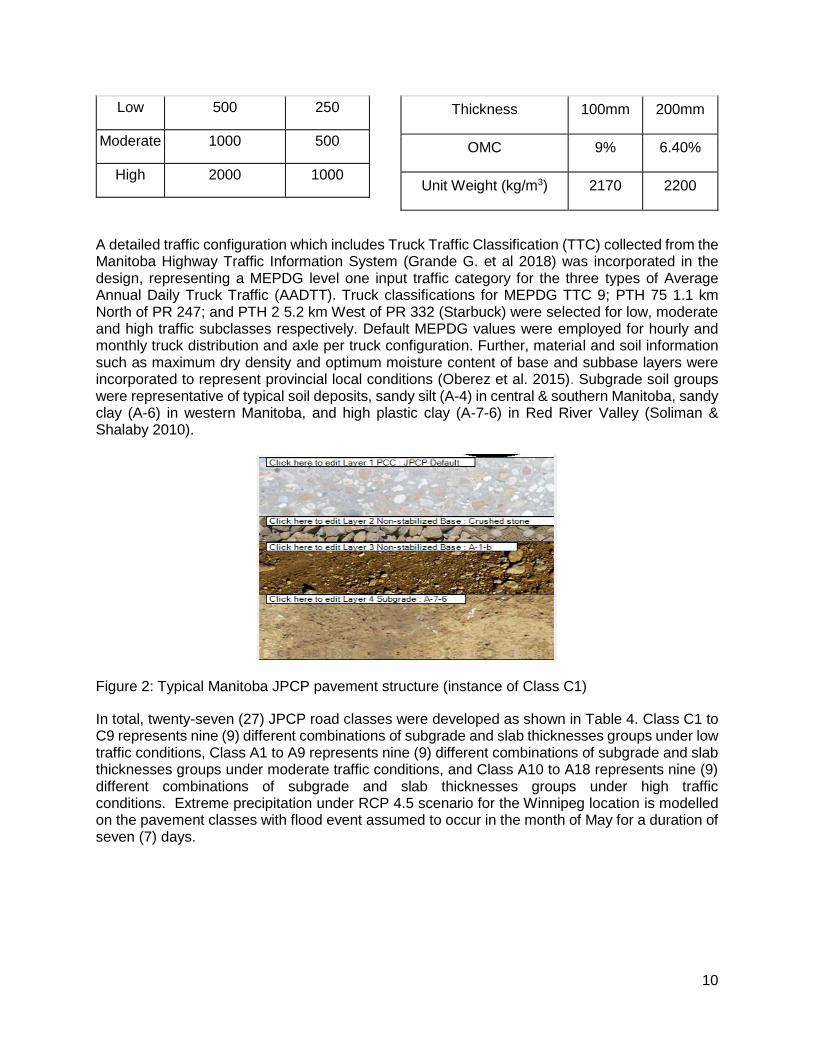
Figure 2 shows a typical pavement design structure in the province. The PCC slab is underlain with 100mm of Granular A crushed stone (A-1-a) base layer and 200mm of Granular C (A-1-b) sub-base layer which sites on the subgrade. (Ahammed et al. 2013).
Table 3: Design matrix parameters: Slab Thickness, Subgrade, Traffic and their respective groupings
Slab Thickness (ST)
Type Thickness (mm)
Thin 225mm
Average 250mm
Thick 275mm
Subgrade
Type Subgrade
(Mpa)
Moisture
Content
AASHTO
Soil
Class
Weak 35 23.80% A-7-6
Medium 73.1 13% A-6
Strong 66.6 8.50% A-4
Base and Sub-base
Course
Granular
A
Granular
C
Traffic
Type Two-Way AADTT Design lane
10
A detailed traffic configuration which includes Truck Traffic Classification (TTC) collected from the Manitoba Highway Traffic Information System (Grande G. et al 2018) was incorporated in the design, representing a MEPDG level one input traffic category for the three types of Average Annual Daily Truck Traffic (AADTT). Truck classifications for MEPDG TTC 9; PTH 75 1.1 km North of PR 247; and PTH 2 5.2 km West of PR 332 (Starbuck) were selected for low, moderate and high traffic subclasses respectively. Default MEPDG values were employed for hourly and monthly truck distribution and axle per truck configuration. Further, material and soil information such as maximum dry density and optimum moisture content of base and subbase layers were incorporated to represent provincial local conditions (Oberez et al. 2015). Subgrade soil groups were representative of typical soil deposits, sandy silt (A-4) in central & southern Manitoba, sandy clay (A-6) in western Manitoba, and high plastic clay (A-7-6) in Red River Valley (Soliman & Shalaby 2010).
Figure 2: Typical Manitoba JPCP pavement structure (instance of Class C1)
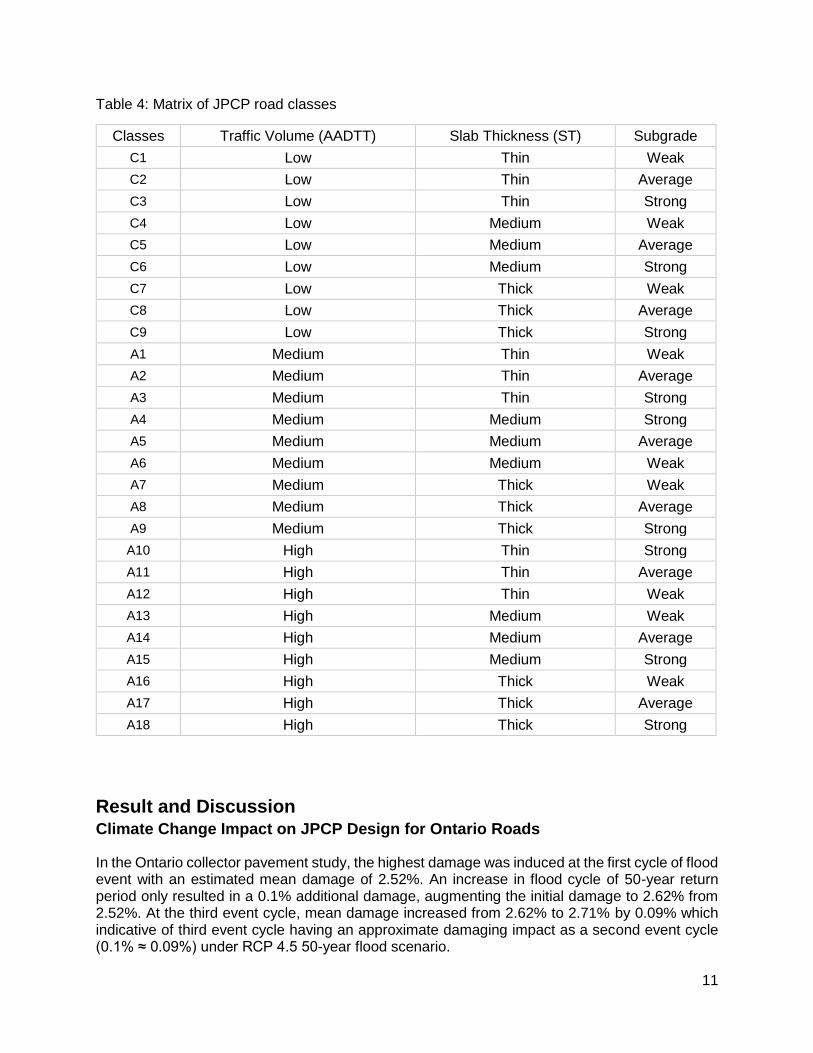
In total, twenty-seven (27) JPCP road classes were developed as shown in Table 4. Class C1 to C9 represents nine (9) different combinations of subgrade and slab thicknesses groups under low traffic conditions, Class A1 to A9 represents nine (9) different combinations of subgrade and slab thicknesses groups under moderate traffic conditions, and Class A10 to A18 represents nine (9) different combinations of subgrade and slab thicknesses groups under high traffic conditions. Extreme precipitation under RCP 4.5 scenario for the Winnipeg location is modelled on the pavement classes with flood event assumed to occur in the month of May for a duration of seven (7) days.
Result and Discussion Climate Change Impact on JPCP Design for Ontario Roads
In the Ontario collector pavement study, the highest damage was induced at the first cycle of flood event with an estimated mean damage of 2.52%. An increase in flood cycle of 50-year return period only resulted in a 0.1% additional damage, augmenting the initial damage to 2.62% from 2.52%. At the third event cycle, mean damage increased from 2.62% to 2.71% by 0.09% which indicative of third event cycle having an approximate damaging impact as a second event cycle (0.1% ≈ 0.09%) under RCP 4.5 50-year flood scenario.
12
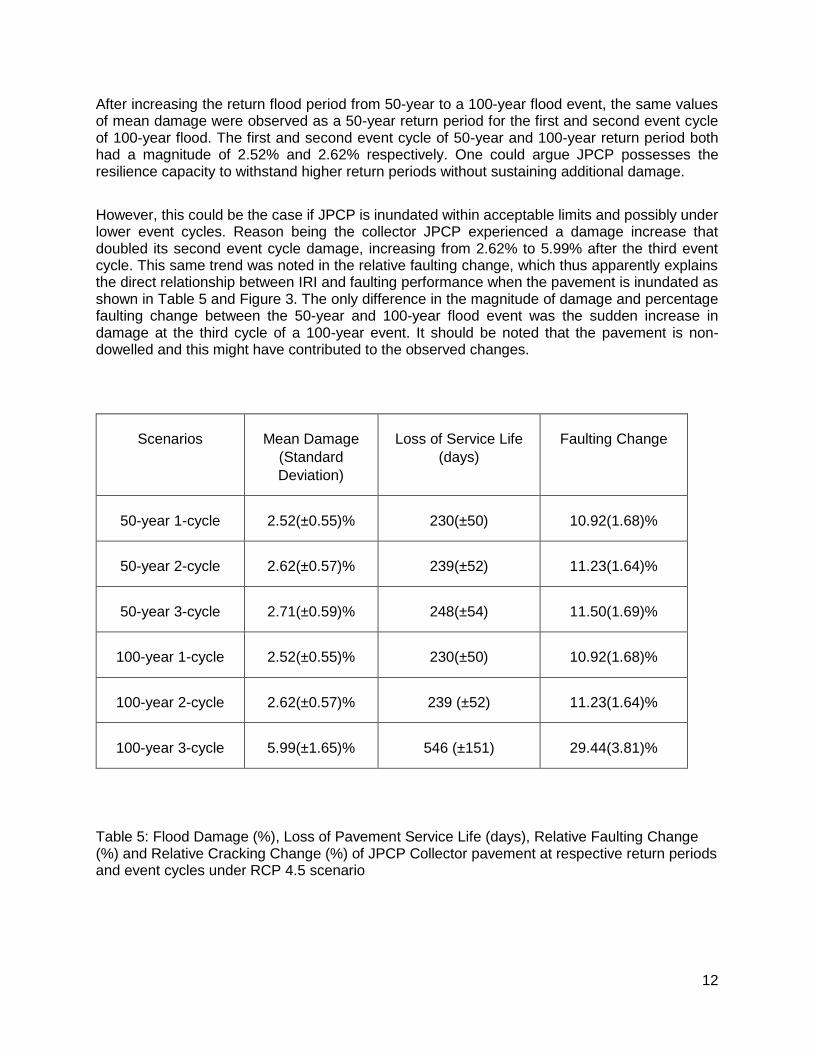
After increasing the return flood period from 50-year to a 100-year flood event, the same values of mean damage were observed as a 50-year return period for the first and second event cycle of 100-year flood. The first and second event cycle of 50-year and 100-year return period both had a magnitude of 2.52% and 2.62% respectively. One could argue JPCP possesses the resilience capacity to withstand higher return periods without sustaining additional damage.
However, this could be the case if JPCP is inundated within acceptable limits and possibly under lower event cycles. Reason being the collector JPCP experienced a damage increase that doubled its second event cycle damage, increasing from 2.62% to 5.99% after the third event cycle. This same trend was noted in the relative faulting change, which thus apparently explains the direct relationship between IRI and faulting performance when the pavement is inundated as shown in Table 5 and Figure 3. The only difference in the magnitude of damage and percentage faulting change between the 50-year and 100-year flood event was the sudden increase in damage at the third cycle of a 100-year event. It should be noted that the pavement is non-dowelled and this might have contributed to the observed changes.
Table 5: Flood Damage (%), Loss of Pavement Service Life (days), Relative Faulting Change (%) and Relative Cracking Change (%) of JPCP Collector pavement at respective return periods and event cycles under RCP 4.5 scenario
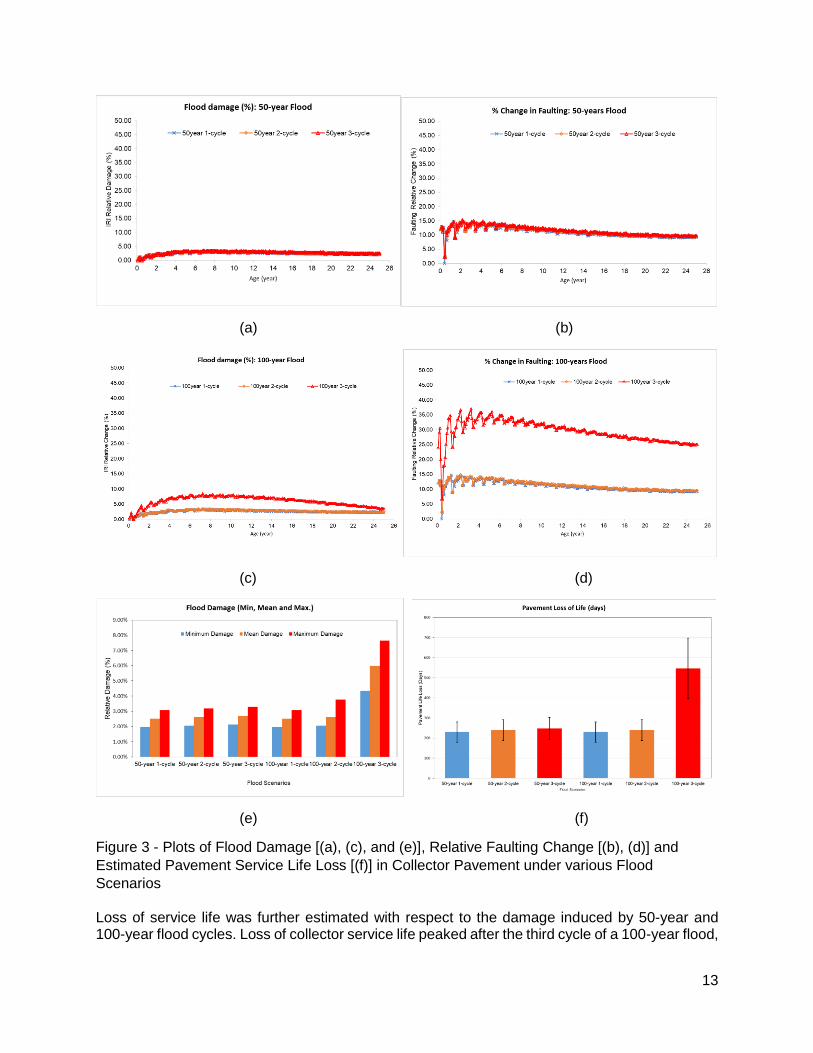
Figure 3 - Plots of Flood Damage [(a), (c), and (e)], Relative Faulting Change [(b), (d)] and
Estimated Pavement Service Life Loss [(f)] in Collector Pavement under various Flood
Scenarios
Loss of service life was further estimated with respect to the damage induced by 50-year and 100-year flood cycles. Loss of collector service life peaked after the third cycle of a 100-year flood,
14
reducing pavement life by 546 days. A minimum loss of 230 days was recorded on average after one cycle of 50-year and 100-year event. As shown in Figure 3, the same service life loss was observed after the first and second cycle of 50-year and 100-year flood events.
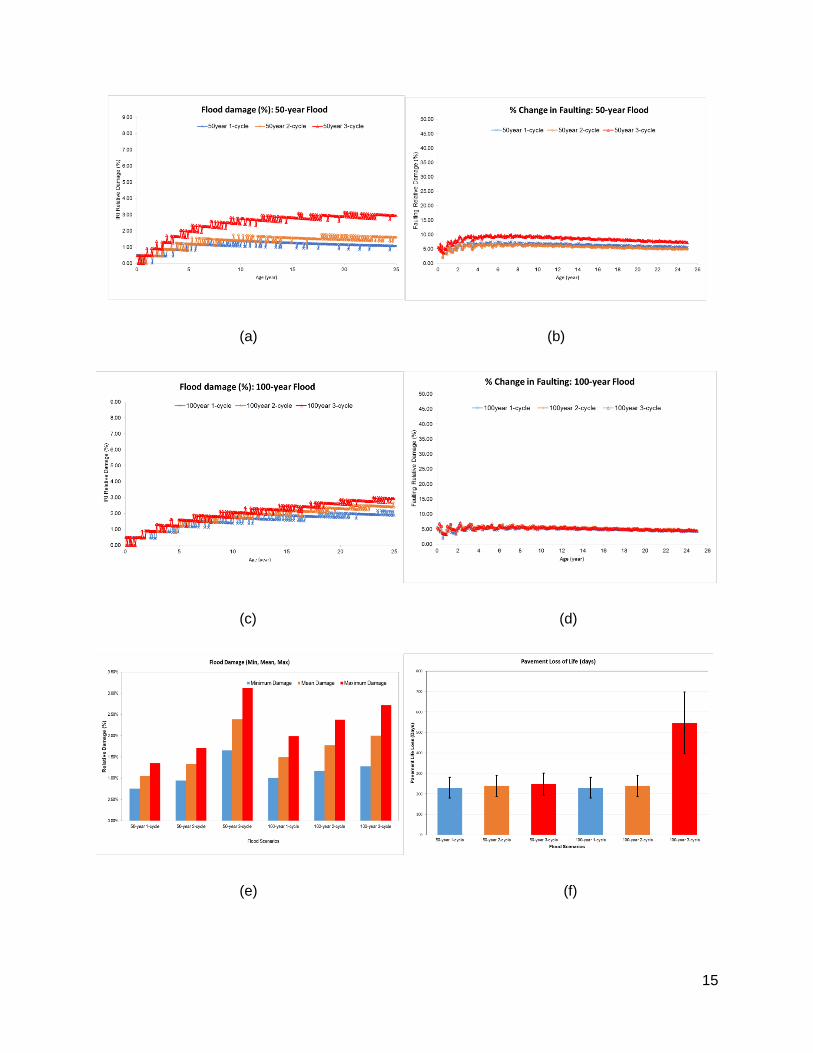
In arterial pavements, estimated damage increased from one to three event cycles but was of lesser magnitude compared to collector pavement flood damage. IRI damage or relative IRI change was noted to have increased from a 50-year to 100-year return period for the first and second flood event cycles shown in Table 6. However, after three cycles of flood event, comparative damage induced by a 50-year flood was a little higher than that induced by a 100-year flood and the same trend was observed in the faulting change. This happened as a result of a positive change in the transverse cracking pavement performance after a third event cycle under heavy traffic arterial road. See Table 6 below
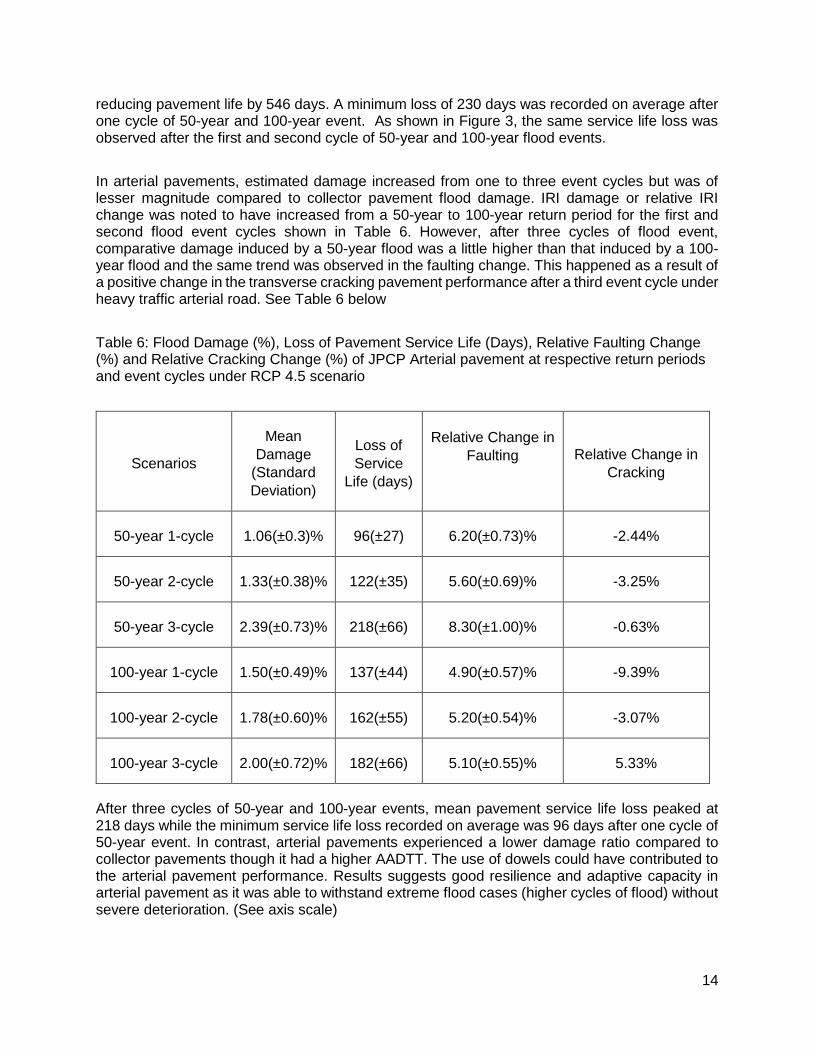
Table 6: Flood Damage (%), Loss of Pavement Service Life (Days), Relative Faulting Change (%) and Relative Cracking Change (%) of JPCP Arterial pavement at respective return periods and event cycles under RCP 4.5 scenario
After three cycles of 50-year and 100-year events, mean pavement service life loss peaked at 218 days while the minimum service life loss recorded on average was 96 days after one cycle of 50-year event. In contrast, arterial pavements experienced a lower damage ratio compared to collector pavements though it had a higher AADTT. The use of dowels could have contributed to the arterial pavement performance. Results suggests good resilience and adaptive capacity in arterial pavement as it was able to withstand extreme flood cases (higher cycles of flood) without severe deterioration. (See axis scale)
15
(a) (b)
(c) (d)
(e) (f)
16
Figure 4 - Plots of Flood Damage [(a), (c), and (e)], Relative Faulting Change [(b), (d)] and Estimated Pavement Service Life Loss [(f)] in Arterial Pavement under various Flood Scenarios
Climate Change Impact on JPCP Design for Manitoba Roads
1. Flood Impact on Pavement Classes under Low Traffic Conditions
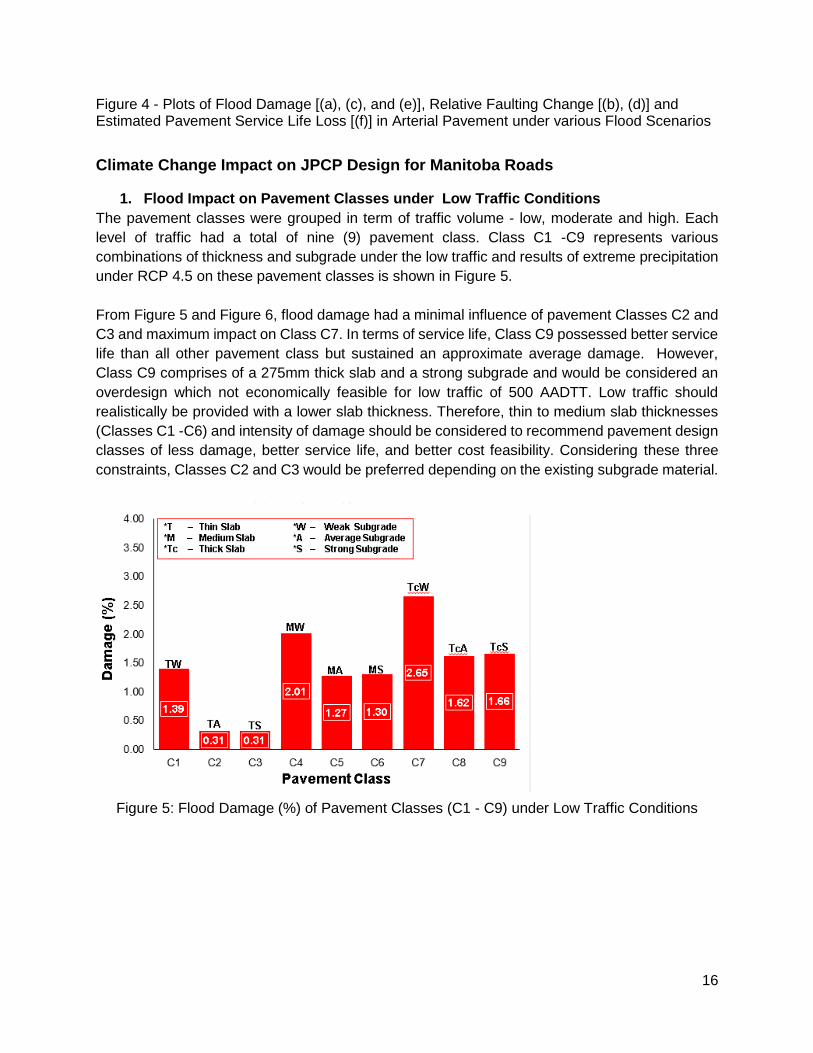
The pavement classes were grouped in term of traffic volume - low, moderate and high. Each
level of traffic had a total of nine (9) pavement class. Class C1 -C9 represents various
combinations of thickness and subgrade under the low traffic and results of extreme precipitation
under RCP 4.5 on these pavement classes is shown in Figure 5.
From Figure 5 and Figure 6, flood damage had a minimal influence of pavement Classes C2 and
C3 and maximum impact on Class C7. In terms of service life, Class C9 possessed better service
life than all other pavement class but sustained an approximate average damage. However,
Class C9 comprises of a 275mm thick slab and a strong subgrade and would be considered an
overdesign which not economically feasible for low traffic of 500 AADTT. Low traffic should
realistically be provided with a lower slab thickness. Therefore, thin to medium slab thicknesses
(Classes C1 -C6) and intensity of damage should be considered to recommend pavement design
classes of less damage, better service life, and better cost feasibility. Considering these three
constraints, Classes C2 and C3 would be preferred depending on the existing subgrade material.
Figure 5: Flood Damage (%) of Pavement Classes (C1 - C9) under Low Traffic Conditions
17
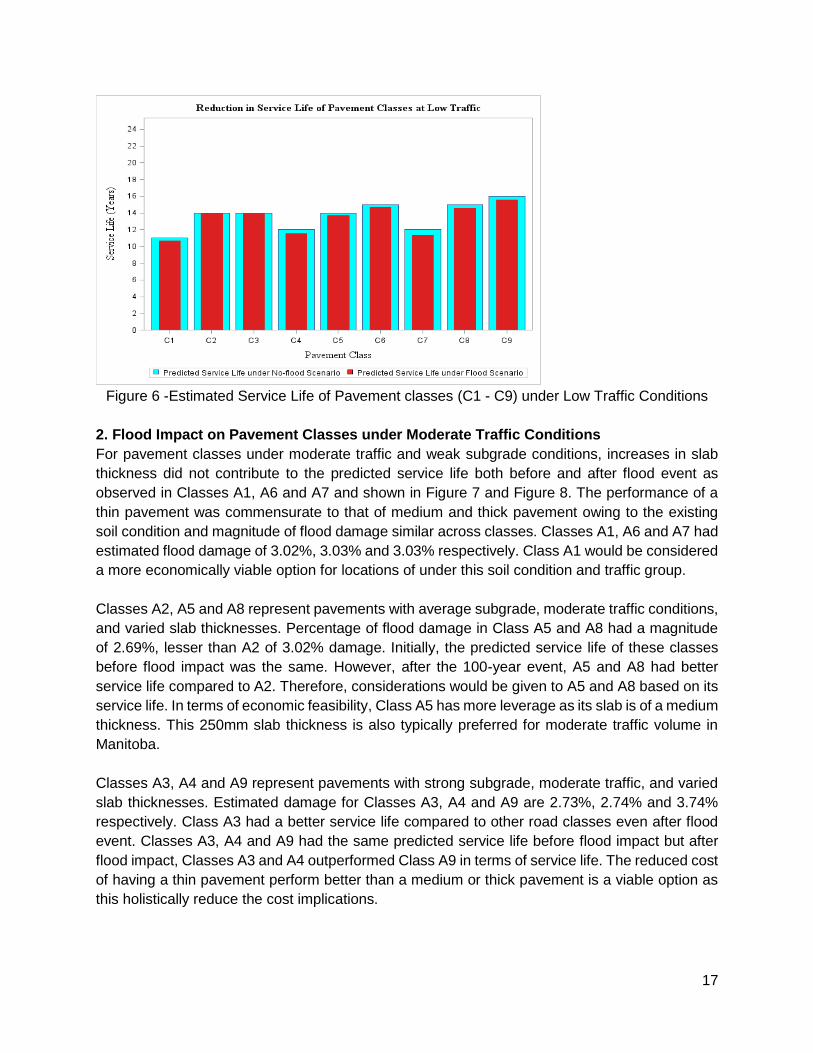
Figure 6 -Estimated Service Life of Pavement classes (C1 - C9) under Low Traffic Conditions
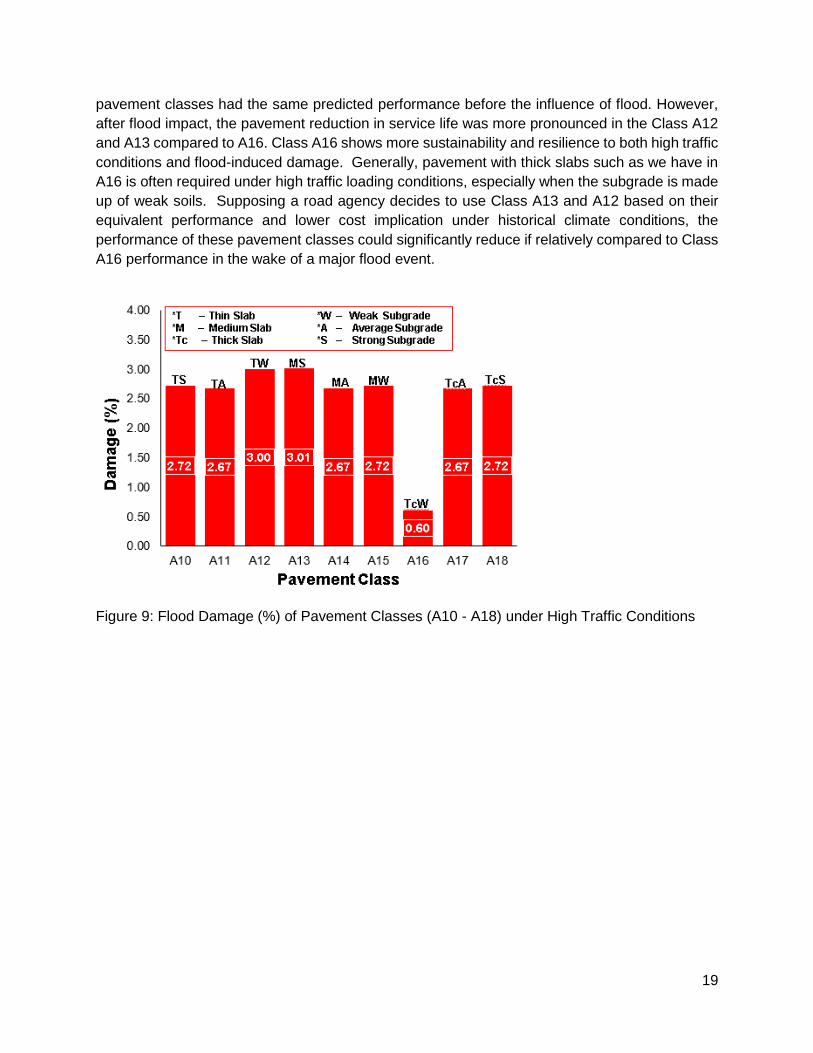
2. Flood Impact on Pavement Classes under Moderate Traffic Conditions
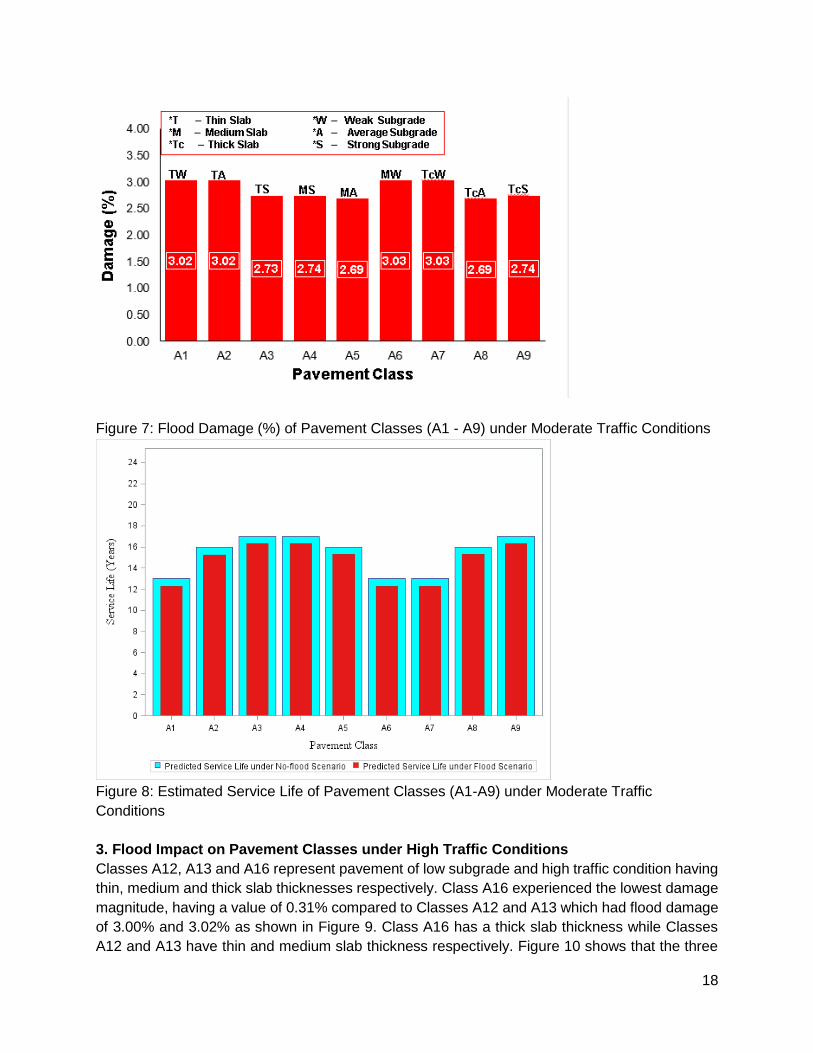
For pavement classes under moderate traffic and weak subgrade conditions, increases in slab
thickness did not contribute to the predicted service life both before and after flood event as
observed in Classes A1, A6 and A7 and shown in Figure 7 and Figure 8. The performance of a
thin pavement was commensurate to that of medium and thick pavement owing to the existing
soil condition and magnitude of flood damage similar across classes. Classes A1, A6 and A7 had
estimated flood damage of 3.02%, 3.03% and 3.03% respectively. Class A1 would be considered
a more economically viable option for locations of under this soil condition and traffic group.
Classes A2, A5 and A8 represent pavements with average subgrade, moderate traffic conditions,
and varied slab thicknesses. Percentage of flood damage in Class A5 and A8 had a magnitude
of 2.69%, lesser than A2 of 3.02% damage. Initially, the predicted service life of these classes
before flood impact was the same. However, after the 100-year event, A5 and A8 had better
service life compared to A2. Therefore, considerations would be given to A5 and A8 based on its
service life. In terms of economic feasibility, Class A5 has more leverage as its slab is of a medium
thickness. This 250mm slab thickness is also typically preferred for moderate traffic volume in
Manitoba.
Classes A3, A4 and A9 represent pavements with strong subgrade, moderate traffic, and varied
slab thicknesses. Estimated damage for Classes A3, A4 and A9 are 2.73%, 2.74% and 3.74%
respectively. Class A3 had a better service life compared to other road classes even after flood
event. Classes A3, A4 and A9 had the same predicted service life before flood impact but after
flood impact, Classes A3 and A4 outperformed Class A9 in terms of service life. The reduced cost
of having a thin pavement perform better than a medium or thick pavement is a viable option as
this holistically reduce the cost implications.
18
Figure 7: Flood Damage (%) of Pavement Classes (A1 - A9) under Moderate Traffic Conditions
Figure 8: Estimated Service Life of Pavement Classes (A1-A9) under Moderate Traffic
Conditions
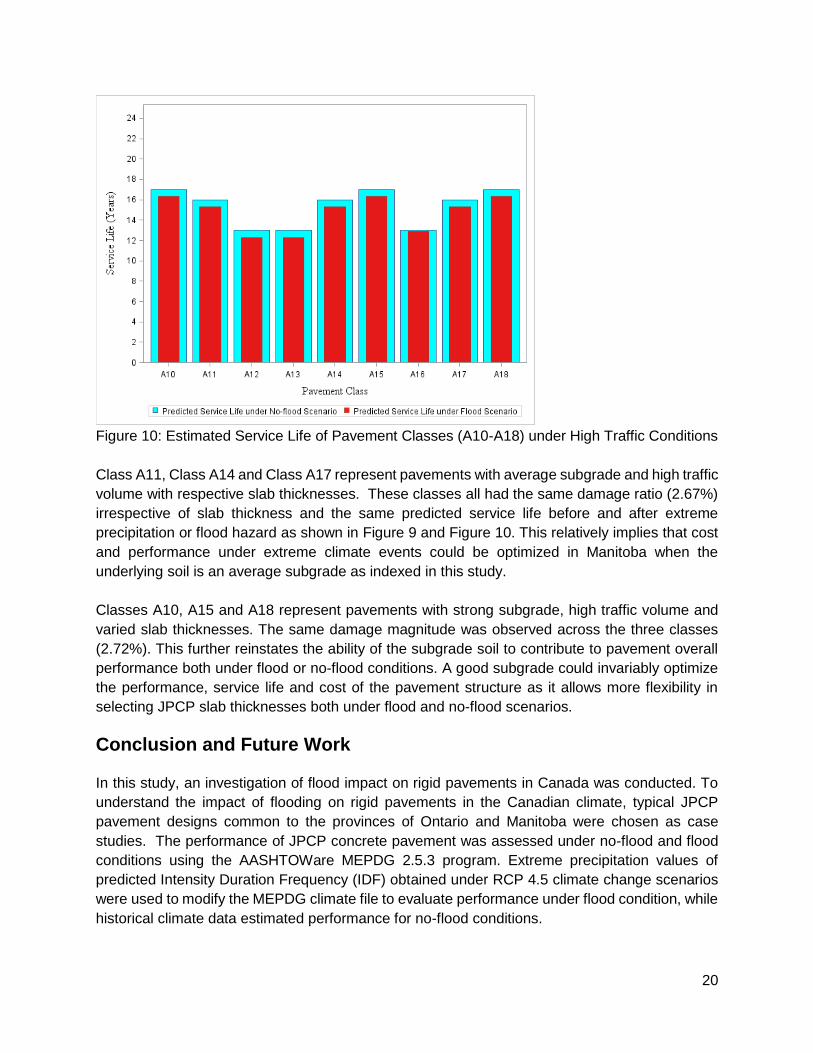
3. Flood Impact on Pavement Classes under High Traffic Conditions
Classes A12, A13 and A16 represent pavement of low subgrade and high traffic condition having
thin, medium and thick slab thicknesses respectively. Class A16 experienced the lowest damage
magnitude, having a value of 0.31% compared to Classes A12 and A13 which had flood damage
of 3.00% and 3.02% as shown in Figure 9. Class A16 has a thick slab thickness while Classes
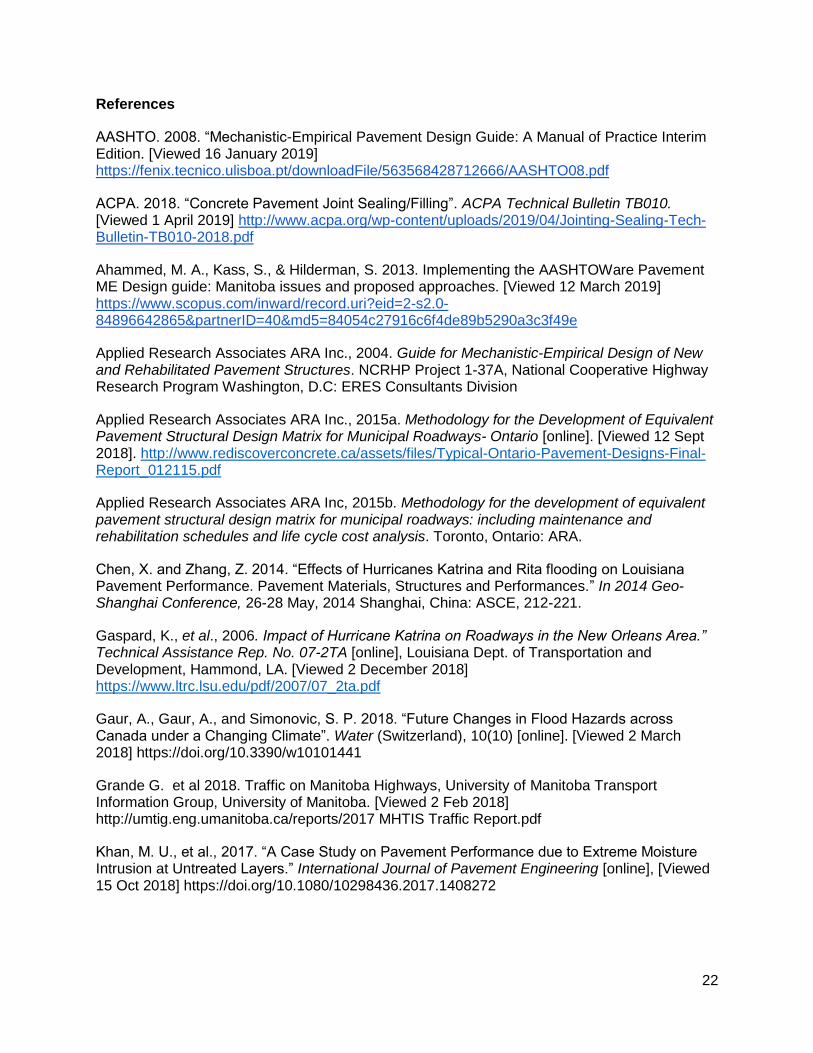
A12 and A13 have thin and medium slab thickness respectively. Figure 10 shows that the three
19
pavement classes had the same predicted performance before the influence of flood. However,
after flood impact, the pavement reduction in service life was more pronounced in the Class A12
and A13 compared to A16. Class A16 shows more sustainability and resilience to both high traffic
conditions and flood-induced damage. Generally, pavement with thick slabs such as we have in
A16 is often required under high traffic loading conditions, especially when the subgrade is made
up of weak soils. Supposing a road agency decides to use Class A13 and A12 based on their
equivalent performance and lower cost implication under historical climate conditions, the
performance of these pavement classes could significantly reduce if relatively compared to Class
A16 performance in the wake of a major flood event.
Figure 9: Flood Damage (%) of Pavement Classes (A10 - A18) under High Traffic Conditions
20
Figure 10: Estimated Service Life of Pavement Classes (A10-A18) under High Traffic Conditions
Class A11, Class A14 and Class A17 represent pavements with average subgrade and high traffic
volume with respective slab thicknesses. These classes all had the same damage ratio (2.67%)
irrespective of slab thickness and the same predicted service life before and after extreme
precipitation or flood hazard as shown in Figure 9 and Figure 10. This relatively implies that cost
and performance under extreme climate events could be optimized in Manitoba when the
underlying soil is an average subgrade as indexed in this study.
Classes A10, A15 and A18 represent pavements with strong subgrade, high traffic volume and
varied slab thicknesses. The same damage magnitude was observed across the three classes
(2.72%). This further reinstates the ability of the subgrade soil to contribute to pavement overall
performance both under flood or no-flood conditions. A good subgrade could invariably optimize
the performance, service life and cost of the pavement structure as it allows more flexibility in
selecting JPCP slab thicknesses both under flood and no-flood scenarios.
Conclusion and Future Work
In this study, an investigation of flood impact on rigid pavements in Canada was conducted. To
understand the impact of flooding on rigid pavements in the Canadian climate, typical JPCP
pavement designs common to the provinces of Ontario and Manitoba were chosen as case
studies. The performance of JPCP concrete pavement was assessed under no-flood and flood
conditions using the AASHTOWare MEPDG 2.5.3 program. Extreme precipitation values of
predicted Intensity Duration Frequency (IDF) obtained under RCP 4.5 climate change scenarios
were used to modify the MEPDG climate file to evaluate performance under flood condition, while
historical climate data estimated performance for no-flood conditions.
21
In the Ontario study, damage induced by locally predicted 50-years and 100-years flood under
climate change is evaluated on typical arterial and collector pavement types common to the
province. Results indicate a slight reduction in pavement performance across pavement types
and percentage damage was estimated using the International Roughness Index (IRI) prediction
values. There was also an increase in flood damage as flood event cycles increased. The damage
was however more pronounced in collector pavements as they were non-dowelled compared to
arterial pavements which are dowelled. The major distress indicator which contributed to damage
was faulting being that it increased across event cycles irrespective of return periods. In this study,
mean damage peaked at 5.99% and 2.39% for the typical collector and arterial pavement
respectively.
In the Manitoba study, a matrix of 27 pavement classes was developed based on traffic, subgrade
and slab thickness to adequately represent possible pavement classes as the province owns a
lot of rigid pavement asset. A 100-year flood or extreme precipitation event is then modelled on
each pavement class and damage estimated. Analysis of the response of various pavement
classes was conducted to determine the pavement classes which performed well in terms of flood
resilience, service life and cost feasibility. The maximum and minimum flood damage observed
across the 27 pavement classes is 3.03% and 0.31% respectively. These low damage ratio further
reiterates the resilience and adaptive capacity of the JPCP to withstand extreme precipitation. In
all of the pavement classes considered in this study, there was no positive change or damage to
faulting and fatigue cracking after extreme precipitation events. The IRI parameter was influenced
by inundation, therefore indicates that pavement classes may actually be experiencing moisture-
induced warping. In this case, results show IRI increase in the rigid pavement, thus accounted for
in the MEPDG as moisture effects.
Going beyond previous research focus on temperature gradients and slab curling, this study has
shown there is a need to continue to understand the interaction between moisture gradient, drying
and autogenous shrinkage, self-desiccation, shrinkage and concrete water absorption. This would
definitely help to accurate model concrete and water interactions under traffic and extreme climate
conditions. Future work will include comparative analysis of performance, changes to design for
climate adaptation, and the life-cycle cost is further to determine optimal designs that provide both
flood resilience and feasible economic cost.
22
References
AASHTO. 2008. “Mechanistic-Empirical Pavement Design Guide: A Manual of Practice Interim Edition. [Viewed 16 January 2019] https://fenix.tecnico.ulisboa.pt/downloadFile/563568428712666/AASHTO08.pdf
Ahammed, M. A., Kass, S., & Hilderman, S. 2013. Implementing the AASHTOWare Pavement ME Design guide: Manitoba issues and proposed approaches. [Viewed 12 March 2019] https://www.scopus.com/inward/record.uri?eid=2-s2.0-84896642865&partnerID=40&md5=84054c27916c6f4de89b5290a3c3f49e
Applied Research Associates ARA Inc., 2004. Guide for Mechanistic-Empirical Design of New and Rehabilitated Pavement Structures. NCRHP Project 1-37A, National Cooperative Highway Research Program Washington, D.C: ERES Consultants Division
Applied Research Associates ARA Inc., 2015a. Methodology for the Development of Equivalent Pavement Structural Design Matrix for Municipal Roadways- Ontario [online]. [Viewed 12 Sept 2018]. http://www.rediscoverconcrete.ca/assets/files/Typical-Ontario-Pavement-Designs-Final-Report_012115.pdf
Applied Research Associates ARA Inc, 2015b. Methodology for the development of equivalent pavement structural design matrix for municipal roadways: including maintenance and rehabilitation schedules and life cycle cost analysis. Toronto, Ontario: ARA.
Chen, X. and Zhang, Z. 2014. “Effects of Hurricanes Katrina and Rita flooding on Louisiana Pavement Performance. Pavement Materials, Structures and Performances.” In 2014 Geo-Shanghai Conference, 26-28 May, 2014 Shanghai, China: ASCE, 212-221.
Gaspard, K., et al., 2006. Impact of Hurricane Katrina on Roadways in the New Orleans Area.” Technical Assistance Rep. No. 07-2TA [online], Louisiana Dept. of Transportation and Development, Hammond, LA. [Viewed 2 December 2018] https://www.ltrc.lsu.edu/pdf/2007/07_2ta.pdf
Gaur, A., Gaur, A., and Simonovic, S. P. 2018. “Future Changes in Flood Hazards across Canada under a Changing Climate”. Water (Switzerland), 10(10) [online]. [Viewed 2 March 2018] https://doi.org/10.3390/w10101441
Grande G. et al 2018. Traffic on Manitoba Highways, University of Manitoba Transport Information Group, University of Manitoba. [Viewed 2 Feb 2018] http://umtig.eng.umanitoba.ca/reports/2017 MHTIS Traffic Report.pdf
Khan, M. U., et al., 2017. “A Case Study on Pavement Performance due to Extreme Moisture Intrusion at Untreated Layers.” International Journal of Pavement Engineering [online], [Viewed 15 Oct 2018] https://doi.org/10.1080/10298436.2017.1408272
Lu, D., et al., 2018. “Impact of flood hazards on pavement performance.” International Journal of Pavement Engineering [online]. [Viewed 15 Oct 2018] https://doi.org/10.1080/10298436.2018.1508844
Lukefahr E. L. 2018 “Continuously Reinforced Concrete Pavement Resiliency – A Case Study”. In ACPA 55th Annual Meeting 2018. http://www.acpa.org/wp-content/uploads/2018/12/Lukefahr-ACPA-2018-CRCP-Resilience.pdf
Meagher, W., et al., 2012. “Method for Evaluating Implications of Climate Change for Design and Performance of Flexible Pavements.” Journal of the Transportation Research Board [online]. [Viewed 15 November 2018] https://doi.org/10.3141/2305-12
Mills B., et al., 2007. The Road Well-Traveled: Implications of Climate Change for Pavement Infrastructure in Southern Canada: Report Prepared for Government of Canada Climate Change Impacts and Adaptation Program. [Viewed 15 November 2018] http://www.bv.transports.gouv.qc.ca/mono/0970582.pdf
Oberez, M. E., Kass, S., Hilderman, S., & Ahammed, M. A., 2015. “Estimating Base Layers and Subgrade Moduli for ME Pavement Design in Manitoba.” In National Transportation Association of Canada TAC Conference, 27-30 September 2015 Charlottetown. PEI: Transportation Association of Canada.
Powell J., 2018. CRCP Roadways Proved Resilient after Hurricane Harvey [online]. [Viewed 7 Nov 2018] https://goo.gl/hQe1Do
Prowse, T.D., Furgal, C., Chouinard, R., Melling, H., Milburn, D., and Smith, S.L. 2009. “Implications of Climate Change for Economic Development in Northern Canada: Energy, Resource, and Transportation Sectors.” A Journal of the Human Environment, v. 38, no. 5, p. 272-281.
Sandink, D., et al. (2010). Making Flood Insurable for Canadian Homeowners: A Discussion Paper. Toronto: Institute for Catastrophic Loss Reduction & Swiss Reinsurance Company Ltd.
Schweikert, A., et al., 2014. Road Infrastructure and Climate Change: Impacts and Adaptations for South Africa. Journal of Infrastructure Systems [online]. [Viewed 7 Nov 2018] https://doi.org/10.1061/(ASCE)IS.1943-555X.0000235
Simonovic, S.P., et al., 2016. “A Web-Based Tool for the Development Of Intensity Duration Frequency Curves Under Changing Climate.” Journal of Environmental Modelling & Software [online]. [Viewed 10 July 2018] https://doi.org/10.1016/j.envsoft.2016.03.016
Soliman, H., and Shalaby, A. 2010. “Sensitivity of Subgrade Resilient Modulus to Moisture Variation.” In Proceedings from 2010 Annual Conference of the Transportation Association of Canada. Halifax, Nova Scotia, 1–11.
Tighe, S. L., 2015. “Vulnerabilities and design considerations for pavement infrastructure in light of climate change.” In: National Transportation Association of Canada TAC Conference, 27-30 September 2015 Charlottetown. PEI: Transportation Association of Canada.
Tighe, S. L., et al., 2008. “Evaluating Climate Change Impacts on Low Volume Roads in Southern Canada”. In: 7th International Conference on Managing Pavement Assets, June 23-28, 2008 Calgary. Alberta: Transportation Research Board.
Transport Canada 2011. Transportation in Canada 2011: Comprehensive Report; Minister of Public Works and Government Services, Canada. [Viewed 10 March 2019] https://www.tc.gc.ca/eng/policy/report-aca-anre2011-index-3010.htm
Transportation Association of Canada (TAC) 2016. Canadian Guide: Default Parameters for AASHTOWare Pavement ME Design (DRAFT). Pavement ME Design User Group.
Warren, F.J. and Lemmen, D.S., (editors) 2014. “Canada in a Changing Climate: Sector Perspectives on Impacts and Adaptation.” Government of Canada, Ottawa, ON, 286p.