No. 2008.1 APRIL 2008 TOWARDS A KNOWLEDGE-BASED ECONOMY – EUROPE AND CENTRAL ASIA: INTERNET DEVELOPMENT AND GOVERNANCE ■ Larissa M. Kapitsa DISCUSSION PAPER SERIES UNITED NATIONS ECONOMIC COMMISSION FOR EUROPE Geneva, Switzerland UNITED NATIONS
Transcript
No. 2008.1 APRIL 2008
TOWARDS A KNOWLEDGE-BASED ECONOMY – EUROPE AND CENTRAL ASIA: INTERNET DEVELOPMENT AND GOVERNANCE ■ Larissa M. Kapitsa
DISCUSSION PAPER SERIES
UNITED NATIONS ECONOMIC COMMISSION FOR EUROPE Geneva, Switzerland
UNITED NATIONS
ii
NOTE
The designations employed and the presentation of the material in this discussion paper do not imply the expression of any opinion whatsoever on the part of the Secretariat of the United Nations concerning the legal status of any country, territory, city or area, or of its authorities, or concerning the delimitation of its frontiers or boundaries. The views expressed in this publication are those of the authors and do not necessarily reflect the views of the United Nations Economic Commission for Europe. Please note that references made to some countries are taken from original data sources that are identified at the end of the discussion paper under the heading "References". The designations used in this context reflect the situation at the time when data were collected and compiled, and they do not imply the expression of any opinion whatsoever on the part of the Secretariat of the United Nations concerning the legal status of any country, territory, city or area, or of its authorities, or concerning the delimitation of its frontier or boundaries. The country groupings used for presentation of data in the text and in individual tables reflect the groupings used by the original data sources identified at the end of this publication under the heading "References". They follow strictly the original research and/or analytical purposes and do not represent the expression of any opinion whatsoever on the part of the Secretariat of the United Nations concerning the legal and/or political status of countries concerned. This publication may be reproduced in whole or in parts and in any form for education or non-profit purposes, provided acknowledgement of the source is made. UNECE would appreciate receiving a copy of any publication that uses this publication as a source.
The diversity and socio-economic differentiation of the real world prevents the full-scale cultivation of Information and Communication Technologies (ICT) to the benefit of all. Furthermore, the lack of determination and political will in some countries and slowness of responses to new technological opportunities in some others are responsible for the creation of another social divide – a digital one. The above problems were fully acknowledged by the World Summit on the Information Society (WSIS). The Summit called for a joint international effort to overcome the digital divide between and within the United Nations Member States under the Digital Solidarity umbrella. This report was prepared as a follow-up to the Summit and represents a brief review of the status and trends in the area of ICT and Internet development in the UNECE region and provides background information on the state of the art in some relevant ICT subsectors in the Member States. The report focuses on the state of the Internet critical resources and, consequently, on the ICT and Internet penetration across countries and social groups. It also looks into existing Internet governance arrangements and makes some recommendations. The report contains three parts and conclusions. The first part, “Towards a Knowledge-based Economy: Progress Assessment”, highlights the situation in the region with regards to the digital divide, both between and within countries, and national strategies and actions aiming at overcoming barriers to accessing the Internet. The second part, “Internet Development: Current State of Critical Internet Resources in the UNECE Region”, concentrates on reviewing the physical Internet backbone, interconnection and connectivity within the Internet in the UNECE member States. The third part, “Governing the Evolving Internet in the UNECE Region”, focuses on the issues of Internet governance in the countries of the region, challenges faced by the countries and participation of key stakeholders in ICT and Internet policy formulation and implementation. The final part contains conclusions and recommendations.
Towards a Knowledge -based Economy – Europe and Central Asia: Internet Development and Governance
UNECE DISCUSSION PAPERS SERIES No. 2008.1, April 20 08
iv
FOREWORD
The “Information Society” proposes a vision of an inclusive society, where all citizens “without distinction of any kind”, share the right “to seek, receive and impart information and ideas through any media and regardless of frontiers”. Therefore, any strategy, be it national or international, aimed at achieving the peace, security and development goals of the international community for the 21st century must include in a prominent position the full exploitation of the new opportunities as well as a clear response to the threats of new divisions arising out the use of Information and Communication Technologies (ICT). The Information Society inevitably will change the traditional role of government. We can already see the effects of the Internet and other information and communication technologies. These new technologies can be used to improve good governance principles and achieve public policy goals. Public administration can make use of these tools to enhance transparency, to increase efficiency in the use of public funds and to improve the delivery of services to citizens. In this process, reforms must focus on the citizens and technology should be seen as a means to support governance development rather than as a tool in itself. The availability of, and access to, public administration for citizens should be increased, and the interactive services enlarged. Similarly, new economic models based on ICT can contribute to economic growth. This report shows that all countries in the region have benefited from the new technologies of the information society – which is very positive! However, the report also indicates that the “digital divide” has not closed. Thus, there is the obvious danger that less developed countries, which do not have the necessary ICT infrastructure and technical and managerial expertise, will have difficulties in catching up with the major developed countries, which are increasingly moving ahead with sophisticated ICT technologies. This risk conserves a “divide”, with the less technologically developed nations being seriously disadvantaged. We at the United Nations Economic Commission for Europe (UNECE) have been supporting knowledge-based development of our member States, in particular for the countries with economies in transition. It is our wish to contribute narrowing existing digital divide and to support building an inclusive Information Society. I sincerely hope this publication will be useful for the ICT policymakers, bringing better understanding of the current status of the Information Society in the region and providing a sound basis for future policy discussions.
Marek Belka Executive Secretary United Nations Economic Commission for Europe
v
PREFACE
Information and communication technologies (ICT) have been rapidly transforming human activities by allowing natural barriers like time and distance and the limitations of the human mind and body to be overcome. ICT have enabled societies to extend their social and economic ties and networks beyond the borders of sovereign States and create a new space of human interaction – a virtual one. They have provided humanity with a new set of opportunities, including an opportunity to learn through a direct dialogue between individuals and groups of people separated from each other by distance, cultural and political walls. However, the entry to this virtual space requires certain capabilities and capacities to be in place. These include:
• Physical ICT infrastructure
• Internet infrastructure
• ICT equipment
• ICT and Internet services provision
• Affordability of equipment and service
• Accessibility of equipment and service
• E-literacy and e-skills
• Common e-rules and e-regulation
• E-security and e-protection of rights and freedoms
• E-law enforcement
• Common e-standards
• A common e-language
Yet the diversity and socio-economic differentiation of the real world prevents humanity from full-scale cultivation of cyberspace to the benefit of all. Furthermore, the lack of determination and political will in some countries and slowness of responses to new technological opportunities in some others are responsible for the creation of another social divide – a digital one. Humanity as a whole has been lagging behind the technological revolution. Various social divides are evidence of failure to design social mechanisms allowing a rapid spread of new technologies, which could benefit the entire population of the world. The above problems were fully acknowledged by the World Summit on the Information Society (WSIS). The Summit called for a joint international effort to overcome the digital divide between and within the United Nations Member States under the Digital Solidarity umbrella. In response to the recommendations of WSIS, both the representation at and the agenda of Internet global governance have been changed in order to identify bottlenecks and barriers to participation in online socioeconomic and cultural activities, as well as risks and threats facing cyberspace inhabitants, and make recommendations on possible solutions, means and methods of overcoming them. This report was prepared as a follow-up to the Summit and in response to the recommendations of the first Internet Governance Forum held in Athens, Greece, from 30 October to 2 November 2006. It represents a brief review of the status and trends in the area of ICT and Internet development in the UNECE region and provides background information on the state of the art in some relevant ICT subsectors in the member States.
vi
The report focuses on the state of critical Internet resources and, consequently, on ICT and Internet penetration across countries and social groups. It also looks into existing Internet governance arrangements and makes some recommendations. The report contains three parts and conclusions. Chapter 1, “Towards a Knowledge-based Economy: Progress Assessment”, highlights the situation in the region regarding the digital divide, both between and within countries, and national strategies and actions aimed at overcoming barriers to accessing the Internet. Chapter 2, “Internet Development: Current State of Critical Internet Resources in the UNECE Region”, concentrates on reviewing the physical Internet backbone, interconnection and connectivity within the Internet in the UNECE member States. Chapter 3, “Governing the Evolving Internet in the UNECE Region”, focuses on the issues of Internet Governance in the countries of the region, the challenges faced by countries and the participation of key stakeholders in ICT and Internet policy formulation and implementation. Chapter 4 provides conclusions and recommendations.
vii
C O N T E N T S
Page Note .... ......................................................................................................................................... ii Abstract ........................................................................................................................................ iii Foreword...................................................................................................................................... iv Preface ......................................................................................................................................... v Symbols and abbreviations used.................................................................................................. x Executive Summary...................................................................................................................... xiii Chapter 1: Towards a knowledge-based economy: Progress assessment .......................... 1
1.1 Is the digital divide narrowing?. .................................................................. 1 1.1.1 The digital divide between countries .............................................. 1 1.1.2 The digital divide within countries ................................................. 4 1.1.3 Underlying causes of the digital divide .......................................... 11
1.2 Strategies and policies to bridge digital divides .......................................... 12 1.3 The UNECE contribution to the Information Society and to narrowing
the digital divide in the region .................................................................... 17 1.3.1 Environmental democracy .............................................................. 18 1.3.2 Trade facilitation and electronic business....................................... 19 1.3.3 Transport......................................................................................... 20 1.3.4 Statistics.......................................................................................... 20 1.3.5 Energy............................................................................................. 20 1.3.6 Gender and ICT .............................................................................. 21 1.3.7 Digital divide .................................................................................. 22 1.3.8 Facilitating regional cooperation and integration with special
reference to Central Asia ................................................................ 22
Chapter 2: Internet development: Current state of critical Internet resources in the UNECE region........................................................................................... 31 2.1. ICT infrastructure ........................................................................................ 31
2.2 Connectivity................................................................................................. 44 2.3 Interconnection ........................................................................................... 52 2.4 Connectivity within the Internet .................................................................. 59
Chapter 3: Governing the evolving Internet in the UNECE region ................................... 79
3.1 The challenges ............................................................................................. 79 3.2 The stakeholders .......................................................................................... 81
3.2.1 Governments................................................................................... 81 3.2.2 The private sector ........................................................................... 86 3.2.3 Civil society groups ........................................................................ 88
Chapter 4: Conclusions and recommendations.................................................................... 91
4.2.1 At the national level........................................................................ 92
viii
4.2.2 At the regional level........................................................................ 93 4.2.3 At UNECE...................................................................................... 93
LIST OF BOXES 1. E-inclusion policy of the European Union ......................................................................... 13 2. Telecoms throughout the UNECE region are entering a new world – the world of
interactive video and digital TV. ........................................................................................ 33 3. In Moldova, users are turning to WAP and mobile Internet access .................................. 37 4. European digital TV to soar................................................................................................ 38 5. Wireless broadband is the next big thing in the Russian Federation .................................. 39 6. Closing the territorial digital divide: satellite telephony in the Russian Federation .......... 41 7. A major new initiative to bring wireless Internet access to Britain’s city centers.............. 42 8. TransTeleCom fibre-optic network in the Russian Federation........................................... 50
LIST OF TABLES
1. The European Union ICT frontrunners and laggards ......................................................... 14 2. The Networked Readiness Index score in UNECE member States, 2002-2007 ................ 15 3. ICT Opportunity Index, regional rankings in UNECE member States, 2001 and 2005..... 24 4. Composition of the 2005 ICT OI: infodensity (networks and skills) and infouse.............. 25 5. Internet access by households, individuals and enterprises: the digital divide
within the EU Member States, 2006 .................................................................................. 26 6. Internet access by individuals (by age): the digital divide within the EU
Member States, 2006 .......................................................................................................... 27 7. National versus rural coverage and penetration: broadband in the EU
Member States, 2003-2005................................................................................................. 28 8. E-readiness regional index in the Russian Federation, 2005 .............................................. 29 9. Percentage of population who owns one or more mobile contracts ................................... 35 10. Top 10 digital TV European countries, 2006 ..................................................................... 38 11. Wi-Fi hotspot world leaders, the beginning of 2006 .......................................................... 43 12. Percentage of homes connected to Internet, 2000-2006..................................................... 46 13. PC penetration rate: PCs per 100 inhabitants, 1990-2005 .................................................. 47 14. Enterprises with broadband Internet access in the EU 10 .................................................. 48 15. Internet hosting in Europe and Central Asia, 2005-2006 ................................................... 53 16. Obligations under the EC Access and Interconnection Directive....................................... 55 17. Number of IXPs per country in Europe, 2006.................................................................... 60 18. Peak aggregated IXP traffic: ranking per country/city, 2006 ............................................. 61 19. IXP rankings by number of participants, 2006................................................................... 62 20. Geographic distribution of gTLD registrations, August 2007........................................... 65 21. Mobile cellular telephone subscribers per 100 inhabitants, 2000-2005 ............................. 70 22. Mobile cellular coverage of population, 2000-2005........................................................... 71 23. Mobile cellular telephone subscribers, 1990-2005............................................................. 72 24. Cable networks in selected EU Member States, 2002 and 2005 ........................................ 73 25. Access to Internet in selected UNECE member States, 2005............................................. 74 26. Dial-up access to Internet in selected UNECE member States, 2005................................. 75 27. DSL subscribers and DSL penetration rate, 2005............................................................... 76 28. Broadband Internet subscribers (all wired and wireless networks):
total number of subscribers................................................................................................. 77 29. Internet usage in Europe, 2000-2007.................................................................................. 78
ix
30. Public telecommunication investment (excluding spectrum fees) in selected European countries ............................................................................................... 82
31. The emerging regulatory regime in selected CIS countries................................................ 85 32. Major representative business associations, forums and/or business groups
in the ICT sector in selected CIS countries......................................................................... 87 33. Major civil society groups/NGOs active in the area of informatization
and the Internet governance in selected CIS countries....................................................... 89
LIST OF FIGURES
1. The digital gap in the UNECE region: changes in the ICT opportunity index, 2001 and 2005 2 2. The digital gap in the CIS subregion, 2001 and 2005 ........................................................ 2 3. The digital gap in the subregion: Central and Eastern Europe, 2001 and 2005.................. 3 4. Infodensity and infouse ICT opportunity index sub-indexes.............................................. 4 5. Proportion of individuals using Internet at least once a week in the EU 25, 2006............. 5 6. Internet use by individuals in each age group in the EU 25, 2006 ..................................... 6 7. DSL and cable coverage in rural areas at the end of 2005 ................................................. 7 8. The gender digital divide in selected regions of the Russian Federation ........................... 8 9. The age digital divide in selected regions of the Russian Federation................................. 9 10. The digital divide by level of education in selected regions of the Russian Federation..... 9 11. The digital divide by level of income in selected regions of the Russian Federation......... 10 12. Personal computers per 100 inhabitants in CIS, 2005........................................................ 10 13. Internet users per 100 inhabitants in CIS, 2005.................................................................. 11 14. Main telephone lines availability in UNECE economies in transition ............................. 32 15. National DSL coverage in EU Member States at the end of 2005 and National cable modem
coverage in EU Member States at the end of 2005............................................................. 34 16. Broadband (DSL) connection to Internet in selected Central and Eastern
European countries, 2005 ................................................................................................... 45 17. Internet usage in the UNECE region, 2007 ........................................................................ 49 18. Svyazinvest holding structure............................................................................................. 59 19. Annual total investment in telecommunications in selected CIS countries, 1995-2005..... 84 20. Annual total investment in telecommunications in selected Eastern and Central
European countries, 1995-2005.......................................................................................... 84
x
SYMBOLS AND ABBREVIATIONS USED
€ Euros £ United Kingdom pounds $ United States Dollars unless otherwise specified ADSL Asymmetric Digital Subscriber Line AFNIC l'Association Française pour le Nommage Internet en Coopération AS Autonomous System ASCII American Standard Code for Information Interchange ASN Autonomous System Number ATM Asynchronous Transfer Mode BGP Border Gateway Protocol BGPv4 Version 4 of the Border Gateway Protocol CCITT International Telegraph and Telephone Consultative Committee ccTDLs country code Top-level Domain Names CEEC Central and Eastern European Countries CENTR Council of European National Top-Level Domain Registries CERN European Organization for Nuclear Research CIS Commonwealth of Independent States CJSC Closed Joint Stock Company DENIC German registry of Internet domain names DNS Domain name system management DSL Digital Subscriber Line DWDM Dense Wavelength Data Multiplexing EC European Community EEA European Environment Agency EECCA Eastern Europe, Caucasus and Central Asia ESCAP United Nations Economic and Social Commission for Asia and the Pacific EU European Union FMS Fixed to mobile substitution GAC Government Advisory Committee GEANT National Research and Educational Networks of the European Union gTLD generic Top-Level Domain names IANA Internet Assigned Numbers Authority ICANN Internet Corporation for Assigned Names and Numbers ICT Information and communications technologies ICT OI Information and communications technology Opportunity Index IDNs Internationalized Domain Names IDNA Internationalizing Domain Names in Applications IEC International Electro technical Commission IGP Interior Gateway Protocol IP Internet Protocol IPv4, IPv6 Internet Protocol version 4 and Internet Protocol version 6 ISDN Integration Services Digital Network ISP Internet Service Provider ISO International Organization for Standardization ISOC Internet Society of Chapters ITS Intelligent transportation systems ITU International Telecommunication Union IXP Internet Exchange Point Km Kilometers LAN Local Area Network LIR Local Internet Registry
xi
MMS Multimedia messaging services n.a. Not available NAP Network Exchange Point NAT Network Address Translation NGO Non-governmental organization NIR National Internet registry NORID Norwegian registry of Internet domain names OI Opportunity Index OECD Organisation for Economic Co-operation and Development OSCE Organization for Security and Co-operation in Europe PC Personal computer RESTENA Réseau Téléinformatique de l'Education Nationale et de la Recherche RIPE Réseaux IP Européens RIPE NCC RIPE Network coordination center RIR Regional Internet registry SIDN Stichting Internet Domeinregistratie Nederland (the Foundation for Internet Domain Registration in the Netherlands) SDH Synchronous Digital Hierarchy SME Small and medium-sized enterprise SMP Significant market power SMS Short Message Service SPECA United Nations Special Program for the Economies of Central Asia TIR Transport routier international UNECE United Nations Economic Commission for Europe UN/CEFACT United Nations Centre for Trade Facilitation and Electronic Business UNCITRAL United Nations Commission on International Trade Law UNCTAD United Nations Conference on Trade and Development UNDP United Nations Development Programme UNESCO United Nations Educational, Scientific and Cultural Organization WAP Wireless Access Protocol WCO World Customs Organization Wi-Fi Wireless Fidelity Wi-MAX Worldwide Interoperability for Microwave Access WIPO World Intellectual Property Organization WSIS World Summit on the Information Society WTO World Trade Organization
xiii
EXECUTIVE SUMMARY
1.1 The digital divide between countries
Over the period 2000-2005, practically all the member countries of the UNECE made progress in advancing national capacities and capabilities necessary for participation in the emerging global knowledge economy. However, the speed of progress has been uneven across the countries. An ITU/UNCTAD (International Telecommunication Union/United Nations Conference on Trade and Development) survey of the ICT economy implies that the digital gap between the countries of the UNECE region has not yet been eliminated although it has certainly narrowed. In the Commonwealth of Independent States (CIS), the gap between the Russian Federation and the rest of the CIS suggests that the countries of the subregion have been advancing at the same speed. In Eastern and Central Europe, the situation appears similar to that in the CIS, although this subregional grouping is more advanced on the average than the CIS. The digital divide within UNECE member States, including some of the most advanced ones, has also not vanished, although it has been gradually shrinking due to effort undertaken both by Governments and civil society groups. The rural-urban digital divide is considerable in some of the European Union (EU) Member States. As of the 1 January 2005, broadband, for example, was available to more than 90 per cent of EU 15/European Environment Agency (EEA)-urban population but only to 62 per cent of its rural population. Furthermore, only 12 of the 88 regions of the Russian Federation may be considered well equipped to uptake the knowledge economy. Most of the Russian Internet users are located in the European part of the country. The combined share of the eastern regions (beyond the Urals) is only 16 percent, less than that of Moscow. Apart from geographic location and nationality or ethnicity, gender, age and social status also play an important role in shaping the profile of the digital divide in the Russian Federation and other CIS countries. Available data suggest that the gender and age digital divides are much more prominent in the CIS than in the EU Member States. They provide evidence that the most important factors constraining the participation of social groups in the emerging knowledge economy are age and the level of income. Thus, as an example, in 2005, the average price of a basic computer in the Russian Federation was €420 (or 14,420 roubles), or about 17.25 per cent of the average salary. And in Ukraine, the cost of a personal computer was two times the average monthly salary. Only a few countries reached the point of closing the gender digital gap: Iceland – with a proportion of Internet users among males and women, respectively, 86 per cent and 82 per cent, Denmark, correspondingly, – 80 per cent and 76 per cent, Sweden – 84 per cent and 76 per cent, and Norway – 80 per cent and 73 per cent. The diffusion of new technologies and, particularly, of ICT could be impeded by various factors: economic, social, cultural, political, as well as geographic. In this context, the Member States of the UNECE represent a diverse group of countries differing from each other in many respects. From the perspective of the Information Society, the recent historic experience of a large group of the UNECE member countries, particularly the Eastern and Central European countries and the CIS, should not be disregarded. This historic experience left an imprint on the social fabric of these countries, which interplays with other factors and, therefore, impacts the development process. The legacy of absolute State control over knowledge production and dissemination and an ICT infrastructure designed to provide support for the state monopoly in these countries continue to constrain the uptake of ICT, even in the countries which have implemented formal liberalization reforms. In some
xiv Executive Summary
instances, the patterns of relationship, behaviour and attitudes that were shaped in the past continue operating informally, resulting in the monopolization of the access to market opportunities and control over the access to resources by groups with vested interests, thus preventing the emergence of new ICT service providers and new consumer services. However, advanced countries of the UNECE region also are not free of barriers constraining the access to and utilization of ICT and Internet potential benefits. Some of them, for example United Kingdom, Germany, France, Spain and Portugal have social groups significantly lagging behind the mainstream society in terms of ICT usage. These are recent immigrants, racial and ethnic minorities, children from poor families and disadvantaged communities, disabled and long-term unemployed people, the population in remote areas, among others. Hence, it is not surprising that e-Inclusion strategy is viewed as one of the means to achieve a larger objective – a strengthening of the social solidarity and social cohesion in the EU Member States.
1.2 Critical Internet resources
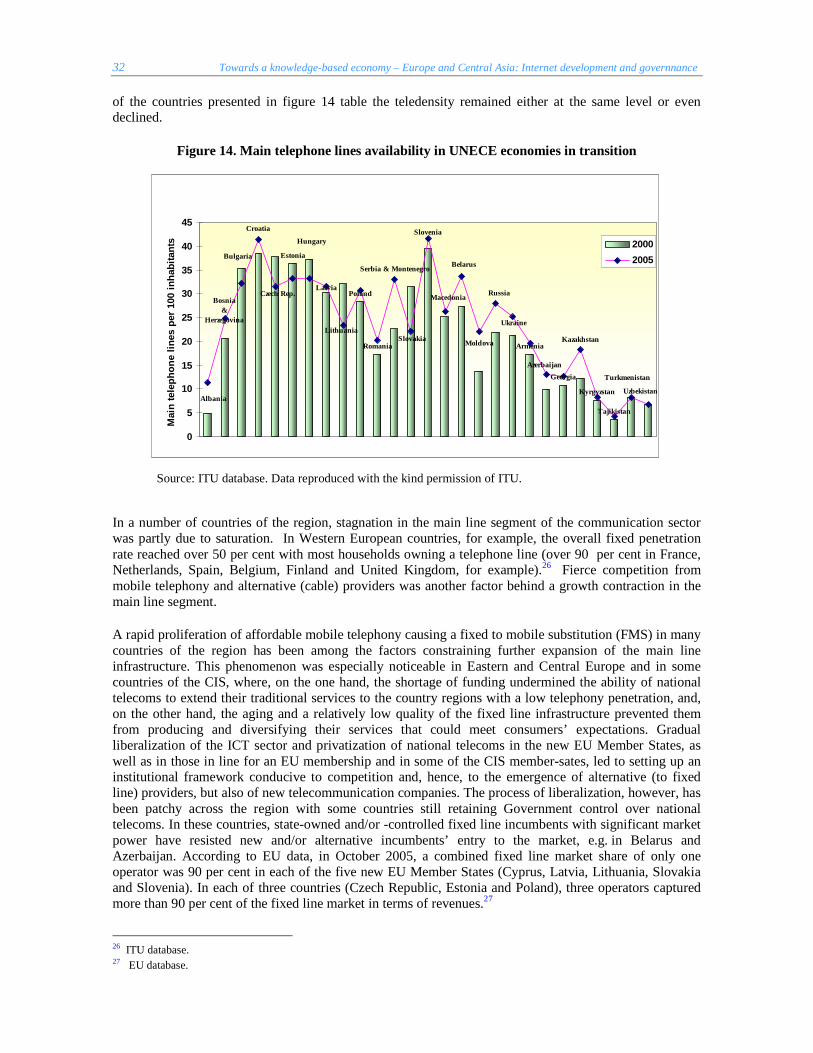
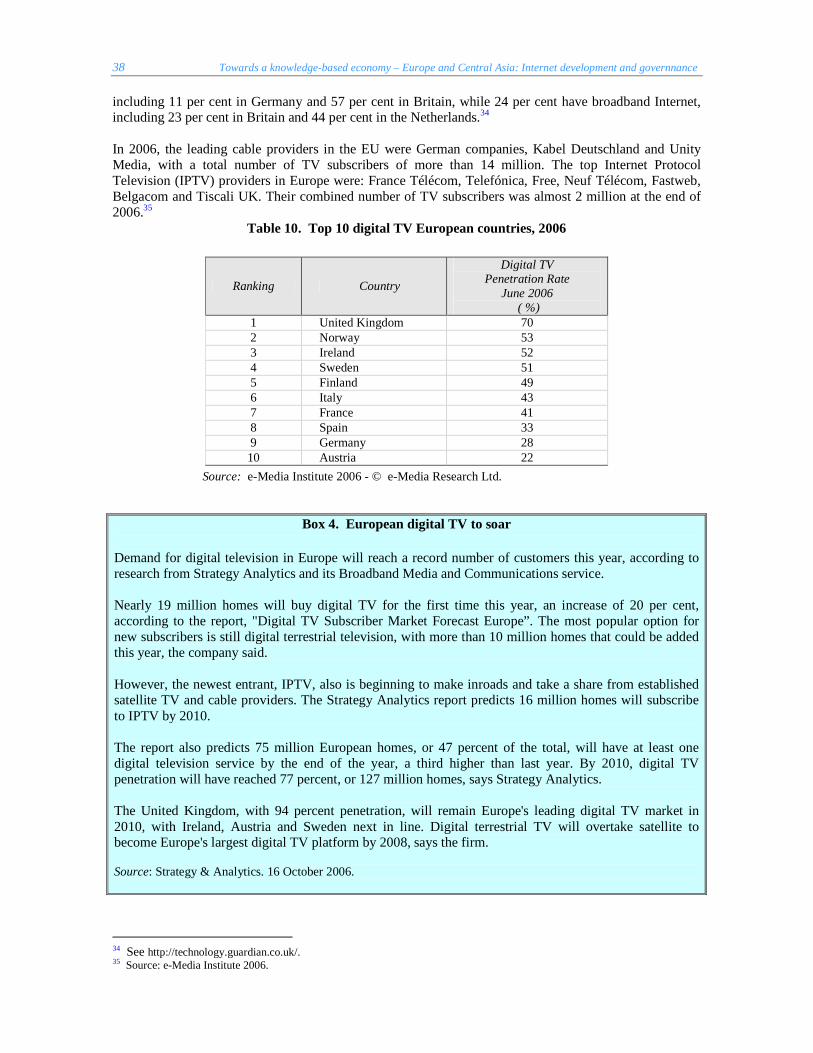
The ICT infrastructure in the Western European subregion is highly developed, with fixed line teledensity above 50 per cent on the average. Mobile penetration rates are also very high with several countries achieving the penetration rate of over 100 per cent. The situation in Eastern and Central Europe is more diverse with some countries rapidly catching up with the leading Western European countries and some others lagging behind. Unevenness of ICT development across the CIS is even greater, mirroring disparities in distribution of ICT infrastructure, capacities and capabilities inherited from the Soviet past. The rapid proliferation of affordable mobile telephony causing the substitution of mobile for fixed-line service in many countries of the region has been among the factors constraining further expansion of the main line infrastructure. This was an especially noticeable phenomenon in Eastern and Central Europe and in some countries of the CIS, where, on the one hand, the shortage of funding undermined the ability of national telecoms to extend their traditional services to the regions with a low telephony penetration. On the other hand, the aging and relatively low quality of the fixed line infrastructure prevented them from producing and diversifying their services that could meet consumers’ expectations. Gradual liberalization of the ICT sector and privatization of national telecoms in the new EU Member States, as well as in those in line for an EU membership and in some of the CIS member-sates, led to the establishment of an institutional framework conducive to competition and, hence, to the emergence of alternative (to fixed line) providers, but also of new telecommunication companies. The process of liberalization, however, has been patchy across the region with some countries still retaining a Government control over national telecoms. In these countries, state-owned and/or -controlled fixed line incumbents with a significant market power have resisted new and/or alternative incumbents’ entry into the market. Telecoms in many EU countries are now moving beyond voice and data and entering the world of interactive video and digital TV. At present, they are investing in Asymmetric Digital Subscriber Lines (ADSL), a technology through which converged services can be or already are being offered. Demand for digital television in Europe will reach a record number of customers this year. Nearly 19 million homes were estimated to have bought digital TV for the first time in 2007, an increase of 20 percent. However, the newest entrant, TV through Internet (IPTV), is also beginning to make inroads and take its share away from established satellite TV and cable providers. It is predicted that 16 million homes will subscribe to IPTV by 2010. Satellite communications have not been widely used in Europe and CIS to provide Internet access services due to a number of economic and technical reasons. Firstly, in most European countries, mainland alternatives are cheaper and more readily available. Secondly, terrestrial alternatives are generally more powerful and reliable. This situation seems to be changing slowly, driven by political commitments to provide high-speed access to Internet for all, and targeting the households and businesses located in remote and/or underdeveloped areas.
Executive Summary xv
Wireless networks Wi-Fi and WiMAX have been playing an increasingly important role in the countries and/or country regions experiencing a deficit of basic terrestrial ICT infrastructure and/or where economic costs of extending fixed lines are too high due to remoteness or sparse settlement. In the CIS, wireless technologies are gaining momentum. A number of large Wi-Fi network projects are currently underway in Russia and other CIS countries. The growth and penetration rate of Internet usage has surpassed that of Internet subscription in all the subregions, suggesting that a significant proportion of the Internet users have been accessing the World Wide Web from other places rather than home. The impressive growth of broadband Internet subscription in the UNECE region hides, however, the sharp unevenness of the broadband Internet penetration throughout the region. The gap remains significant between and within subregions in terms of the household connection to the Internet and PC penetration. In 2005, the average DSL Internet access penetration rate in Central and Eastern European countries was four per cent of the population, while in the Western European countries it was 12 per cent. Some researchers have noted that extremely high costs of the Internet connection and services (in terms of per capita income or average monthly wage) in some CIS and Eastern and Central European countries has been hindering the growth of Internet subscription and usage. For example, in Kazakhstan the unlimited dial-up Internet connection package offered by Kazakhtelecom costs about €86 per month; the unlimited ADSL connection – from €102.45. Taking into consideration that the average monthly salary in Kazakhstan was €292 (January 2007), it is not surprising that most of Internet users have been accessing the Internet at their workplaces. In the EU, liberalization and harmonization policies and policy actions targeting ICT markets have brought about noticeable benefits to all the stakeholders: ICT users, ICT manufacturers, network operators and service providers. These include: reduction of barriers to market entry; harmonization of national regulatory frameworks; public support and encouragement of research and development in the area of ICT; launching and implementation of public projects that had a strong effect on the ICT market as a whole. Further, regulatory changes and policies to promote network interconnection and, hence, application of technologies allowing for interoperability between different devices and equipment, encouraged a convergence of markets and the emergence of new generation telecommunication networks and technologies. Policies and programmes aiming at overcoming digital divides and gaps, such as e-education, e-accessibility, e-health, e-governance, e-justice and e-environment, among others, provided incentives for electronic equipment producers, network operators and service providers to invest in upgrading and/or development of new products and services. The implementation of the EC Interconnection Directive together with a new licensing regime permitted a large-scale market entry of new operators. In 2004, 20 Member States of the EU transposed a new regulatory framework. The market response to the new regulatory regime in the area of interconnection was an increased competition, resulting in a 14 per cent reduction of the fixed-to-mobile termination rate for operators with significant market power. In the CIS, most of the countries have undertaken some reform of their telecommunications markets, albeit with different degrees of consistency, but these are still far from being fully developed. These reforms eased the entry of new telecommunications services providers and encouraged the development of new services, mainly, mobile telephony. Many public telecoms diversified by adding new services, such as Internet services, mobile telephony and/or wireless interconnection. The distribution of Internet traffic is extremely uneven in the UNECE region with the main volume falling on the Internet Exchange Points (IXPs) in the Netherlands and the United Kingdom. A serious technical problem at these two exchanges might severely hamper the entire regional Internet traffic routing. Further, some studies indicate that part of the region’s network is already overloaded and suffers from loss of data. The risk of congestion may also increase with intensifying Internet penetration in Europe and Central Asia. In addition, with the growing uptake of multimedia there will likely be an increasingly large traffic
xvi Executive Summary
asymmetry between content-heavy networks and end user-heavy networks. Forthcoming massive traffic inflows from Asia and Africa may exacerbate the vulnerability of the regional internet infrastructure. In view of this development present traffic handoff policies might need to be adjusted. Internationalizing Domain Names in Applications (IDNA), the report notes, would allow local communities to utilize opportunities and capture benefits, which are available at the local markets, by bringing business online, extending the reach and reducing costs of public and private services providers. To overcome the technical hurtle, which is that the ICANN standard for domain names does not allow letters with diacritics that are used by many European languages, requires a political consensus be reached on further developing and implementing internationalized domain names. Six of the ten leading languages of Internet users in the world are European languages. Facilitating the development of national language content and putting in place technical conditions (IDNA) to facilitate the presence and use of all world languages on the Internet should be a priority for the UNECE region. The transition countries’ choice of priorities and emphasis differ to some extent from that of the EU. The analysis of ongoing conceptual debates and current situations in the CIS countries allow assuming that in the nearest future most CIS Governments will be focusing on:
(a) Creating and/or perfecting ICT legislation; (b) Building up and/or extending ICT infrastructure;
(c) Human resources development (e-education, e-literacy);
(d) Improving information security; and
(e) E-Government.
1.3 Constraints for Internet development
A number of constraining factors appear to be responsible for the lack of demand, affordability and access for ICT and Internet and, ultimately, for the digital divide:
(a) Differences in the availability of ICT/Internet physical infrastructure and, therefore, differences in the level of ICT and Internet penetration;
(b) Differences in per capita income;
(c) Unequal distribution of income, discrimination and/or mental barriers (as in the case of the elderly);
(d) High costs of the ICT equipment (hardware and soft ware) and services;
(e) Lack of awareness of the potential benefits associated with the ICT and the Internet usage;
(f) Lack of trust in the security of online economic transactions;
(g) Reluctance of businesses to uptake informatization of their business operations;
(h) A relatively low level of e-literacy and e-skills among the population.
The most important impeding factors for supply were identified as follows:
(a) Monopolization of the ICT sector, and, consequently, the lack of competition;
(b) Loopholes in and/or an underdeveloped ICT institutional regime;
(c) Lack of and/or restricted access of businesses to public financial resources;
(d) Insufficient and unstable level of public and private investment in the ICT/Internet infrastructure development;
Executive Summary xvii
(e) Bureaucratization of the decision-making process and implementation of e-development strategies and plans of action;
(f) A relatively high level of the ICT market entry costs.
1.4 The role of UNECE
In conclusion, it appears that all the countries in the UNECE region have made progress on a national level towards a knowledge-based economy. However, a large divide still remains between most transition economies and the western developed countries. It seems that the digital divide has narrowed to some extent, but there is no conclusive catching up from the less advantaged countries. In order to close the divide and change the relative positions between the countries, concerted efforts have to be made both on policy as well as practical levels. It is clear that the transition economies made good level of investment on ICT equipment and infrastructure like many other developing countries. An additional constraint is the legacy of the centrally planned economies over knowledge production, dissemination and the ICT infrastructure, even in the countries which have implemented formal liberalization reforms. Here an exchange of views and experiences and knowledge of legislative reform could provoke a shift in behaviour and attitudes enabling the creation of new ICT services providers and new consumer services. UNECE could draw on its expertise in the transition processes, linking experience from developed and former transition countries to those that have still not finalized their transition process. This could be achieved through a policy dialogue facilitated by the UNECE and by sharing know-how from countries encompassing the knowledge-based economy. UNECE could further facilitate regional cooperation in the area of ICT and Knowledge-based development under the existing framework of the UN Special Program for the Economies of Central Asia (SPECA). In cooperation with the United Nations Economic and Social Commission for Asia and the Pacific (ESCAP), ECE has been contributing capacity-building of ICT policymakers, and created a forum for information exchange among senior policymakers. Finally, UNECE should contribute to the informatization process in the region by further developing ICT in the work of its sectoral committees.
1
Chapter 1
TOWARDS A KNOWLEDGE-BASED ECONOMY:
PROGRESS ASSESSMENT
Since 2000, there has been a dramatic acceleration of the accumulation and/or build-up process of all the necessary components constituting the foundation of knowledge economy in the UNECE region. Even the poorest countries of the region have undertaken remarkable efforts to catch up with leading countries at least in some areas vital for the development of a knowledge economy.
1.1 Is the digital divide narrowing?
1.1.1 The digital divide between countries
From 2000 to 2005, practically all of the member countries of the UNECE made progress in advancing national capacities and capabilities necessary for participation in the emerging global knowledge economy. However, the speed of progress has been uneven across countries. According to a joint ITU/UNCTAD report presenting the ICT Opportunity Index (ICT OI), a newly developed measure of the digital divide, some countries were able to jump over 6-7 or even 10 ranks in the regional ranking; for example, Israel, the United Kingdom, Latvia and Luxembourg (table 3).1 Some others, on the contrary, have slowed down their pace: for instance, Canada and Austria. The overall results of the ITU/UNCTAD survey of the ICT economy imply that the digital gap between the countries of the UNECE region has certainly narrowed (figure 1). The difference in the ICT OI score of Sweden (the top performer) and that of Tajikistan (the bottom performer) was reduced from 1:11 to 1:8. The digital divide also exists at the subregional level. Thus, for example, in the CIS, the gap between Russia (the top subregional performer) and Tajikistan remained practically unchanged (1:3), as well as between Russia and the rest of the CIS (figure 2). This suggests that the countries of the subregion have been advancing at the same speed. However, they have shown marked differences in performance. For example, Tajikistan, one of the poorest countries of the region, practically doubled its ICT OI score, increasing it by 92 per cent (table 3). Kyrgyzstan, Uzbekistan and Turkmenistan, on the other hand, have a very modest increase in their scores, allowing them to preserve their 2001 ranks. Georgia has moved one rank down, switching place with Moldova. Ukraine and Kazakhstan gained a modest increase in their scores, respectively, by 58 and 53 per cent. Belarus, the Russian Federation, Moldova and Armenia significantly improved their average scores, respectively, by 76, 71, 71 and 69 per cent, during 2001-2005. None of the CIS, however, were able to move out from the group of medium average performers.
1 ICT OP measures access to and usage of ICT by individuals and households in an inclusive sense. Conceptually, it is based on the dual nature of ICT: ICT as a productive asset and ICT as a consumer good. Therefore, it incorporates indicators reflecting (a) a country’s overall capital as well as labor stocks to evaluate a country’s productive capacity (supply side), and (b) those that capture the consumption flows of ICT. All these indicators are aggregated; first, to produce two sub-indexes: Infodensity sub-index and Infouse sub-index, which then are used to generate a country’s ICT OP (See: ITU/UNCTAD. 2007 World Information Society Report. Beyond WSIS, Geneva, June 2007).
2 Towards a knowledge-based economy – Europe and Central Asia: Internet development and governnance
Figure 1. The digital gap in the UNECE region: Changes in the ICT Opportunity Index, 2001 and 2005
0
50
100
150
200
250
300
350
400Sweden
DenmarkCanadaSwitzerland
NetherlandsAustria
Belgium
Iceland
USA
Norway
Germany
Luxembourg
UK
Finland
France
Ireland
Italy
Spain
Malta
Israel
Cyprus
Slov eniaEstonia
PortugalCzech Rep.Slov akiaGreeceHungary
CroatiaLatv ia
Poland
Lithuania
Bulgaria
Turkey
Serbia and Montenegro
Romania
Russia
TFYR Macedonia
Bosnia
Belarus, Rep. of
Ukraine
Georgia
Moldov a
Kazakhstan
Armenia
Albania
AzerbaijanKyrgyzstan
UzbekistanTurkmenistanTaj ikistan
2001 ICT OI
2005 ICT OI
Source: ITU/UNCTAD. 2007 World Information Society Report: Beyond WSIS, Geneva, June 2007.
Figure 2. The digital gap in the CIS subregion, 2001 and 2005
Source: ITU/UNCTAD. 2007 World Information Society Report: Beyond WSIS, Geneva, June 2007.
Figure 2. The Digital Gap in the CIS Sub-region
0
20
40
60
80
100
120
140Russia
Belarus, Rep. of
Ukraine
Georgia
Moldova
Kazakhstan
Armenia
Azerbaijan
Kyrgyzstan
Uzbekistan
Turkmenistan
Tajikistan
2001 ICT OI
2005 ICT OI
Towards a knowledge-based economy – Progress assessment 3
Figure 3. Central and Eastern Europe: The Digital G ap in the Sub-region
0
50
100
150
200
250Slovenia
Estonia
Czech Rep.
Slovakia
Hungary
Croatia
Latvia
PolandLithuania
Bulgaria
Serbia and Montenegro
Romania
TFYR Macedonia
Bosnia
Albania
2001 ICT OI
2005 ICT OI
In Eastern and Central Europe, the situation appears similar to that in the CIS, although this subregional grouping is more advanced on the average than the CIS (figure 3). In 2001 the digital gap between Slovenia (the top subregional performer) and Albania (the bottom subregional performer) was 1:3. It has not changed since then, although in 2005 Estonia became the top subregional performer. Estonia and Slovenia continue outperforming the rest of the countries of the subregion. Estonia moved five ranks up, reaching the eighteenth position in the UNECE regional ranking outpacing Slovenia. Latvia is another showcase of the subregion. It was the only one of the 27 countries with the ICT OI score below the 2001 regional average, which made it to the upper performers’ group. Lithuania has also accelerated its pace; climbing five ranks in the UNECE Member States’ ranking, and Romania gained 86 per cent in its score and moved three ranks up (table 3). The smallest increase of the ICT OI score was registered for Bulgaria (30%) and Serbia and Montenegro (36%), resulting in the loss of their previous position in the regional ranking, respectively, three and five ranks down.
Figure 3. The digital gap in the subregion: Central and Eastern Europe, 2001 and 2005
Source: ITU/UNCTAD. 2007 World Information Society Report: Beyond WSIS, Geneva, June 2007.
A more detailed analysis of the UNECE member States’ ICT OI allows factors to be identified which are responsible for differences in performance among the countries of the region (table 4). Highly developed ICT networks (in terms of fixed and mobile telephony and international Internet bandwidth penetration) have been one of the key factors behind a rapid evolvement of a knowledge economy in Western European countries, United States, Canada, but also in Estonia, Lithuania and Israel. While educational achievements of population (adult literacy rates and primary, secondary and tertiary gross enrollment rates) constitute an important precondition for development of a knowledge economy, they may remain largely under-utilized, if the ICT infrastructure is not sufficiently developed, thus constraining the access to and use of information and knowledge by the population. This seems to be the case in the majority of the CIS and in some Balkan countries. Other components of the ICT OP, particularly the uptake and intensity sub-indexes, bring to light other aspects of the digital divide in the UNECE region. There is a large gap between the UNECE member States in terms of Internet usage, computer and TV availability (uptake sub-index). Taking into
4 Towards a knowledge-based economy – Europe and Central Asia: Internet development and governnance
0
100
200
300
400
500
600
Sw
eden
Den
mar
kC
anad
aS
wi t
zer l
and
Net
her la
nds
Aus
tria
Bel
g iu
mIc
e lan
dU
SA
Nor
way
Ger
man
yLu
xem
bour
g UK
Finl
and
Fran
ceIr
elan
dIta
lyS
pain
Mal
taIs
rael
Cy p
rus
Slo
ven i
aE
ston
iaP
ortu
gal
Cze
ch R
ep.
Slo
vaki
aG
reec
eH
unga
r yC
roat
iaLa
tvia
Po l
and
Lith
uan i
aB
ulg a
r iaTu
r key
Ser
bia
and
Mon
t ene
gro
Rom
ania
Rus
s ia
Bos
n ia
TFY
R M
aced
onia
Bel
aru s
, Rep
. of
Uk r
aine
Geo
rgia
Mo l
dova
Kaz
akhs
tan
Arm
enia
Alb
ani a
Aze
rbai
jan
Ky r
gyzs
tan
Uzb
ekis
tan
Turk
men
ista
nTa
jiki s
tan
Infodensity Index
Infouse Index
consideration existing disparities in the size and level of development of the ICT infrastructure, it is not surprising to note such significant differences in the intensity of ICT use (intensity sub-index) as well. In some countries with a low uptake index, the use of information flows has been relatively high: for example, in Tajikistan, Uzbekistan, Turkmenistan, Kyrgyzstan and Albania. This could be explained by two factors: a recent leap in mobile telephony penetration and a large outflow of temporary migrants to neighboring countries. In more advanced countries, high intensity of information usage could be attributed to the latest technological advancements, particularly, to the diffusion of broadband Internet. Significant differences that exist across and within countries between the infodensity (national capacities and capabilities to generate and deliver knowledge and information) on the one hand, and the infouse (the intensity of usage of ICT products and services) on the other, suggest that other factors than technology alone play a certain role in determining the development patterns and pace of a knowledge economy in the UNECE region (figure 4).
Figure 4. Infodensity and infouse ICT opportunity index sub-indexes
Source: ITU/UNCTAD. 2007 World Information Society Report: Beyond WSIS, Geneva, June 2007.
1.1.2 The digital divide within countries
The digital divide within UNECE member States, including some of the most advanced ones, has also not vanished and continues to endure, although it has been gradually shrinking due to efforts, undertaking both by Governments and civil society groups. The digital divide, according to various definitions, has several dimensions: social (gender, age, health status, ethnicity, education level), economic (income, employment, size of business), geographic (rural vs. urban, territorial location). According to the EUROSTAT, among the EU Member States, the proportion of households with Internet access in 2006 ranged from 23 per cent in Greece to 80 per cent in the Netherlands, the proportion of individuals using Internet at least once a week – from 23 per cent in Greece to 84 per cent in Iceland (tables 5 and 6, and figure 5). The Internet users in all the EU countries are overwhelmingly males. Only a few countries reached the point of closing the gender digital gap: Iceland – with a proportion of Internet users among males and women, respectively, 86 per cent and 82 per cent; Denmark, correspondingly, – 80 per cent and 76 per cent; Sweden – 84 per cent and 76 per cent; and Norway – 80 per cent and 73 per cent.
Towards a knowledge-based economy – Progress assessment 5
Figure 5. Proportion of individuals using Internet at least once a week in the EU 25, 2006
Source: EUROSTAT Press release, “Internet Usage in the EU25”, 10 November 2006, STAT/06/146. As seen from figure 6, the digital age gap is rather pronounced in all EU Member States. The highest incidence of Internet use is among the youth (16-24 years old), and the lowest among the age group of 55 to 74 years old. However, the situation differs from country to country. Iceland achieved outstanding results in narrowing the digital age gap. The incidence of Internet use in each of the age groups was, respectively, 96 per cent, 90 per cent and 59 per cent (table 6). Impressive progress was also made in this respect by Denmark with corresponding results, 94 per cent, 86 per cent, 56 per cent; and Sweden – 94 per cent, 89 per cent, 56 per cent. Greece, Cyprus and Italy have been significantly lagging behind the rest of the EU 25, including new member States (Estonia, Hungary, Latvia, Lithuania, Poland, Slovakia, and Slovenia). The rural-urban digital divide is also considerable in some of the EU Member States (table 7 and figure 7). As on 1 January 2005, broadband, for example, was available to more than 90 per cent of EU 15/EEA-urban population but only to 62 per cent of its rural population. Only in few countries, Belgium, Denmark, Luxembourg and the Netherlands, the Digital Subscriber Line (DSL) coverage of rural and urban population was equal in 2005. But in Slovakia and Slovenia the coverage of rural population was less than 30 per cent. According to some estimates, at least 4.7 million people in remote and rural regions of the EU 25 will be excluded by commercial rollout in 2013 due to high cost of deployment caused by distance and population scarcity.2
2 Source: Commission of the European Communities. i2010 – Annual Information Society Report 2007, Vol. 3, Brussels, 30.3.2007, SEC(2007) 395; IDATE Consulting and Research. Broadband Coverage in Europe, Final Report, 2006 Survey, November 2006.
Greece; 23 Hungary; 42
Latvia; 46
Poland; 34 Lithuania; 38 Sweden; 80
Slovakia; 43
Portugal; 31
Estonia; 56
Slovenia; 47
Cyprus; 29
Spain; 39
Italy; 31 Ireland; 44
France; 39 Finland; 71
UK; 57 Luxembourg; 65 Germany; 59
Norway; 77
Iceland; 84
Belgium; 58
Austria; 55
Netherlands; 76
Denmark; 78
6 Towards a knowledge-based economy – Europe and Central Asia: Internet development and governnance
Figure 6. Internet use by individuals in each age group in the EU 25, 2006 (percentage)
Source: EUROSTAT Press release, Internet Usage in the EU25, 10 November 2006, STAT/06/146
Source: EUROSTAT Press release, “Internet Usage in the EU25”, 10 November 2006, STAT/06/146.
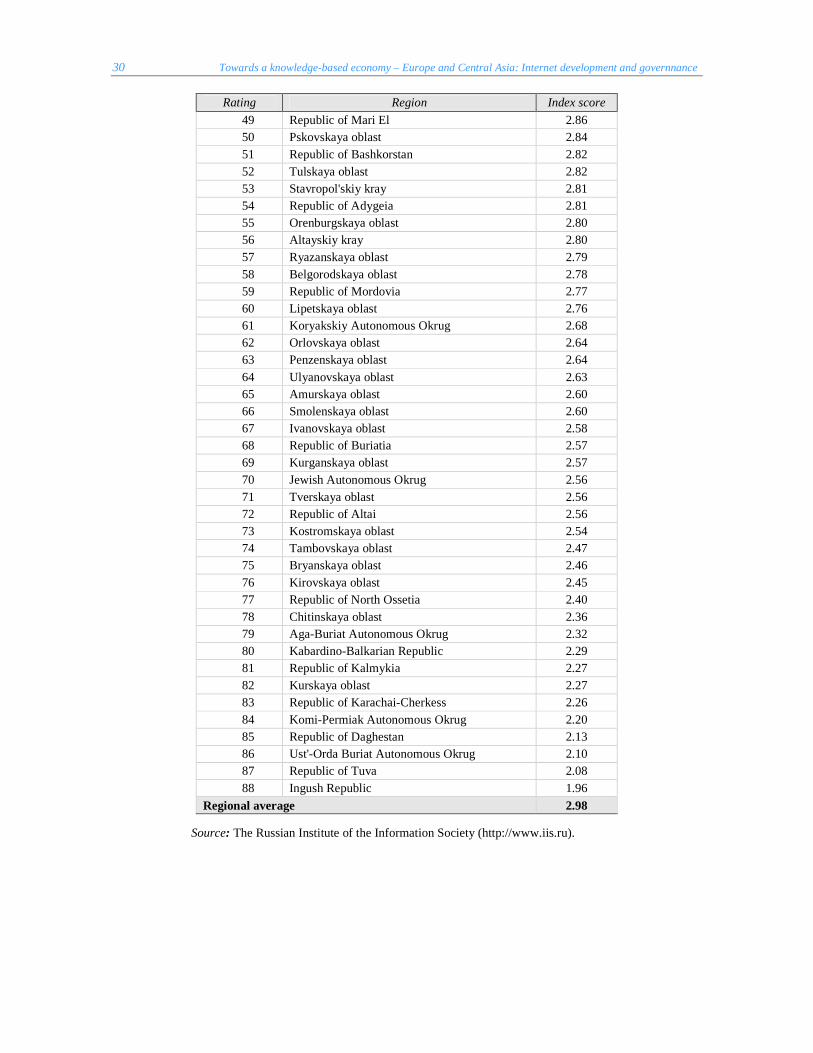
The patterns of digital division are practically the same throughout the entire UNECE region. However, the corresponding digital divides and gaps in most of the CIS are wider and deeper due to the overall shortage of and/or aging of the ICT infrastructure. Vast territory, disperse population settlement and low population density in some countries (Russian Federation, Kazakhstan and Turkmenistan, for example), in combination with a relatively lower than in most European countries per capita income and average wages further constrain the evolution of knowledge economy in this subregion. This is especially true with regard to the Russian Federation. Its gigantic territory, severe climatic conditions in most of the regions, low population density, uneven geographic distribution of capital assets and production capacities, including those of the ICT, human resources and economic opportunities present a formidable challenge. This could be seen, at least in part, from digital disparities across Russia’s regions. According to the 2005 e-readiness assessment carried out by the Russian Institute of the Information Society (IIS), only 12 of the 88 regions of the Russian Federation may be considered well equipped for the knowledge economy uptake (table 8).3 These are, first of all, two largest Russian cities – Moscow and Saint Petersburg (with the index score, respectively, 5.65 and 4.86), followed by Khanty-Mansi Autonomous Okrug (Area), Yamal-Nenets Autonomous Okrug, Tomskaya, Samarskaya and Murmanskaya oblasts, Chukchi Autonomous Okrug (Area), Nenets Autonomous Okrug, and the Autonomous Republic of Karelia. The IIS study reveals the magnitude of the developmental and politically sensitive problems facing the Russian Federation and its regions. The ICT imbalances between Russia’s 31 autonomous republics and okrugs are as significant as those on the nation-wide scale. Thus, the national average of the e-readiness index score was 2.98, and it ranged between 1.96 (the Ingush Autonomous Republic) and 5.65 (Moscow).
3 The methodology applied for assessing the e-readiness of the Russian regions was similar to that of the Networked Readiness Index (NRI) constructed for the World Economic Forum. For more information see: http://www.iis.ru.
Swed
en
Denm
ark
Neth
er lands
Austria
Belgium
Iceland
Nor w
ay
Germ
any
Luxem
bour g
UK
Finland
France
Ir eland
I taly
Spain
Cypr us
Slovenia
Estonia
Portugal
Slovakia
Greece
Hun
gary
Latvia
Poland
Lithuania
0
10
20
30
40
50
60
70
80
90
100
Figure 10. EU25: Internet Use by Individuals in Eac h Age Group, 2006
(%)
16-24 years old 25-54 years old 55-74 years
Towards a knowledge-based economy – Progress assessment 7
0% 20% 40% 60% 80% 100%
Cyprus
Greece
Malta
Czech Republic
Estonia
Latvia
Slovakia
Slovenia
Italy
Poland
Lithuania
Germany
Ireland
Sweden
Austria
Hungary
Finland
Iceland
Portugal
Spain
Norway
France
UK
Netherlands
Belgium
Denmark
Luxembourg
average 27
na
na
na
0% 10% 20% 30% 40%
Cyprus
Greece
Iceland
Italy
Malta
Norway
Slovakia
Czech Republic
Estonia
Latvia
Slovenia
France
Germany
Ireland
Poland
UK
Luxembourg
Lithuania
Spain
Hungary
Sweden
Austria
Finland
Belgium
Netherlands
Denmark
Portugal
average 27
na
na
na
na
The average of the index scores of the 31 autonomous republics and autonomous okrugs was 2.83 spanning from 1.96 (the Ingush Autonomous Republic) to 4.41 (the Khanty-Mansi Autonomous Okrug). Hence, the territorial digital divide in Russia has also a distinct ethnic characteristic. To solve this problem and equalize ICT opportunities for each and every nationality and ethnic group would require from Russia a significant investment not only in furthering the development of regional ICT infrastructures but also in creating conditions which could ensure that spatial, linguistic and/or economic barriers are not preventing individuals from participation in and/or capturing the benefits of knowledge economy.
Figure 7. DSL and cable coverage in rural areas at the end of 2005 (percentage of inhabitants)
Source: IDATE Consulting and Research. Broadband Coverage in Europe. Final Report, 2006 Survey, November 2006.
The regional distribution of Russia’s Internet users is a reflection of regional infrastructural disparities. Most of the Russian Internet users are located in the European part of the country. The combined share of the eastern regions (behind the Urals) is only 16 per cent, less than that of Moscow. The above data
DSL Coverage Cable Coverage
8 Towards a knowledge-based economy – Europe and Central Asia: Internet development and governnance
conceals another important digital divide – the divide between rural and urban population. Almost all of the Internet users as well as fixed and mobile telephone in Russia are urban inhabitants. Apart from geographic location and nationality/ethnicity, gender, age and/or social status also play an important role in shaping the profile of the digital divide in Russia and other CIS. Available data suggest that the gender and age digital divides are much more prominent in the CIS than in the EU Member States. Figures 8 to 11 below attest a current situation in Russia. They show that the most important factors constraining the participation of social groups in emerging knowledge economy are age and level of income. Limited data on other CIS countries point to the same underlying causes of the digital divide. Thus, in 2005, the average price of a basic computer in Russia was €420 (or 14,420 roubles), or about 17.25 per cent of the average salary.4 In Ukraine, the cost of a personal computer was twice the average monthly salary. In Armenia, where the average monthly wages in the public and the private sector were, respectively, €50 and €125, the cost of Internet connection in Yerevan (the capital) ranging from €20 to €35 per month for a dial-up connection and from €60 to € 100 per month for a shared xDSL connection at 128 Mbps, the ownership and use of a personal computer at home was a luxury for the majority of the city population.5 The gender digital divide, according to available data, was similar to that of Russia in Kyrgyzstan and Kazakhstan, where the percentage of females among Internet users was 45 in 2005. It was, however, larger in Belarus (only 17.5% of Internet users are women), Azerbaijan (30%) and Tajikistan (7 to 10%).6
Figure 8. The gender digital divide in selected regions of the Russian Federation
Source: The Public Opinion Foundation. Project, The Internet in Russia/Russia on the Internet. Eighth release. Winter 2006-2007.
4 Political Intelligence. Final Report: Monitoring of Russia and Ukraine (priority 1), and Armenia, Azerbaijan, Georgia, Kazakhstan and Moldova (priority 2): Telecommunications and the Information Society. Commission contract No: 30-ce-0009814/00-41, December 2006. 5 Ibid. 6 ITU database and other sources.
Towards a knowledge-based economy – Progress assessment 9
Figure 9. The age digital divide in selected regions of the Russian Federation
Source: The Public Opinion Foundation. Project, The Internet in Russia/Russia on the Internet. Eighth release. Winter 2006-2007.
Figure 10. The digital divide by level of education in selected regions of the Russian Federation
Source: The Public Opinion Foundation. Project, The Internet in Russia/Russia on the Internet. Eighth release. Winter 2006-2007.
10 Towards a knowledge-based economy – Europe and Central Asia: Internet development and governnance
Figure 11. The digital divide by level of income in selected regions of the Russian Federation
Source: The Public Opinion Foundation. Project, The Internet in Russia/Russia on the Internet. Eighth release. Winter 2006-2007.
On the whole, according to ITU data, Internet and personal computer penetration rates are comparatively lower in most of the CIS than in the majority of the EU Member States (figures 12 and 13, and table 7).
Figure 12. Personal computers per 100 inhabitants in CIS, 2005
0 2 4 6 8 10 12 14
Armenia
Azerbaijan
Georgia
Kyrgyzstan
Tajikistan
Turkmenistan
Uzbekistan
Belarus
Moldova
Russia
Ukraine
Figure 22: The CIS: PCs per 100 inhabitants, 2005
Source: ITU database. Data reproduced with the kind permission of ITU.
Towards a knowledge-based economy – Progress assessment 11
Figure 13. Internet users per 100 inhabitants in CIS, 2005
Source: ITU database. Data reproduced with the kind permission of ITU. The above measurements may not capture the true picture due to a widespread practice of sharing access to personal computers and/or the Internet.
1.1.3 Underlying causes of the digital divide
Since the mid- of the 1990s numerous studies and surveys have attempted to highlight the underlying causes of the digital divide. Most findings could be grouped as follows:
(a) Global and regional levels: Unevenness of the global development process; differences in the level of economic development; differences in the human resources development; differences in the adopted development model; differences in the political regime, differences in culture etc.
(b) Macro (national) level: Monopolization of the ICT market and consequent lack of competition;
inefficient and/or week institutions; lack of financial resource; lack of or underdevelopment of the ICT infrastructure; sizable poverty and pronounce income inequality (affordability issues); relative lack of skills among the labor force; lack of the key stakeholders’ awareness; lack of government commitment to ICT development; systemic corruption; ineffective public policies etc.
(c) Micro level (enterprises, NGOs, individuals): Constrained access to the ICT market due to either
monopolization of the market and/or corruption; absence of ICT services provision in the geographic area (connectivity and access issues); lack of knowledge and understanding of the potential benefits of using ICTs among individuals and small and medium-sized enterprises (SMEs); lack of ICT skills; high costs associated with acquisition of computer skills, PC and equipment, and with the usage of the Internet (affordability issues); risks associated with the use of the Internet (security issues); unclear regulatory environment with regards to access to information, privacy, dispute settlement, web content, IPRs and other; specific barriers to the usage of the Internet being faced by disabled, elderly, and some other social groups (accessibility issues).
Figure 24. The CIS: Internet Users per 100 Inhabita nts, 2005
Tajikistan; 0,3Turkmenistan; 1
Uzbekistan; 3,31
Belarus; 34,8Moldova; 13,02
Russia; 15,19
Ukraine; 9,81Kazakhstan; 4,11
Armenia; 5,34
Azerbaijan; 8,07
Georgia; 6,07
Kyrgyzstan; 5,32
12 Towards a knowledge-based economy – Europe and Central Asia: Internet development and governnance
Therefore, the diffusion of new technologies and, particularly, of ICT could be impeded by various factors: economic, social, cultural, political, as well as geographic. In this context, the member States of the UNECE represent a diverse group of countries differing from each other in many respects. From the perspective of the Information Society, the recent historic experience of a large group of the UNECE countries, particularly, the Eastern and Central European countries and the CIS, should not be disregarded. This historic experience left an imprint on the social fabric of these countries, which interplays with other factors and, therefore, impacts on the development process in these countries. It reveals itself in various forms such as, for example, a tendency to ignore intellectual property rights or the right to privacy, or a tendency to impose centralized control over sources of information and to exclude some of the key stakeholders from the decision-making process regarding e-development strategies and policies. In some countries, a revival of nationalistic sentiments coupled with a resurgence of discriminatory practices based on gender, age, health status and/or ethnicity also impose artificial barriers to accessing new skills and technologies. The legacy of the absolute State control over the knowledge production and dissemination and the ICT infrastructure designed to provide support for the state monopoly in these countries continue to constrain the ICT uptake even in the countries, which implemented formal liberalization reforms. In some instances, the patterns of relationship, behavior and attitudes that were shaped in the past continue operating informally resulting in the monopolization of the access to market opportunities and control by groups with vested interests over the access to resources, thus, preventing the emergence of new ICT services providers and new consumer services. As was highlighted above, advanced countries of the UNECE region are not free of barriers constraining the access to and utilization of the ICT and Internet potential benefits. Some of them, for example, the United Kingdom, Germany, France, Spain and Portugal have social groups significantly lagging behind the mainstream society in terms of the ICT usage. These are: recent immigrants, racial and ethnic minorities, children from poor families and disadvantaged communities, disabled and long-term unemployed people, and population of remote areas. Hence, it is not surprising that e-Inclusion strategy is viewed as one of the means in achieving a larger objective – a strengthening of the social solidarity and social cohesion in the EU Member States.
1.2 Strategies and policies to bridge digital divides
Since 2000, practically all countries of the UNECE region have adopted national e-strategies. Depending on developmental problems facing a country, the major emphasis of e-strategy could vary focusing on either of the directions:
• Sustaining wealth creation process by improving and strengthening the competitiveness of national producers in the globalizing world;
• Catching up with advanced economies of the region;
• Further improving quality of life of the population;
• Equalizing opportunities for different social groups to participate in and benefit from Post-industrial economy and Information Society.
Most countries of the UNECE region follow the lead of the EU Member States which have embarked on implementing an e-Inclusion initiative attempting to bring all relatively marginalized social groups into the mainstream economic and social activities (box 1). This new policy complements both the Lisbon Council agreement of 2000 and i2010 strategy “A European Information Society for growth and employment” aiming at the creation of a Single European Information Space, strengthening innovation and investment in ICT research and achieving an inclusive European information and media society.
Towards a knowledge-based economy – Progress assessment 13
A strong underpinning of the EU e-inclusion initiative is equality of opportunity understood as a human right. The e-inclusion initiative is based on the belief that each member of society is entitled to full participation in the mainstream social and economic activities, and that new technologies underlying and/or driving the transformation process towards Information Society can be used to support and further increase social cohesion. Conditions enabling each and every citizen of the EU Member States to take part in and reap benefits of the emerging information society and knowledge economy should also incorporate those, which make it possible for individuals to exercise their right to information. He or she should be equipped, in terms of capability (skills, knowledge etc.) and in terms of capacity (accessibility to or ownership of PC or other technological devices, access to Internet, information and to other telecommunication services). To achieve the goals and targets lay down by the Riga Declaration the EU
Box 1. E-Inclusion policy of the European Union
The Lisbon Council in 2000 agreed to make a decisive impact on the eradication of poverty and social exclusion by 2010 in the EU. Through the Open Method of Coordination Member States are encouraged to set out concrete steps in their National Action Plans against poverty and social exclusion and to improve access to the new ICTs and opportunities new technologies can provide. The Riga Ministerial Declaration on e-Inclusion of June 2006 demonstrated the commitment of EU Member States. It has identified six themes which the European Commission uses to foster e-Inclusion. Overall objectives of the thematic areas include:
E-accessibility - make ICT accessible to all, meeting a wide spectrum of people's needs, in particular any special needs.
E-ageing - empower older people to fully participate in the economy and society, continue independent lifestyles and enhance their quality of life.
E-competences - equip citizens with the knowledge, skills and lifelong learning approach needed to increase social inclusion, employability and enrich their lives.
Socio-cultural e-inclusion - enable minorities, migrants and marginalized young people to fully integrate into communities and participate in society by using ICT.
Geographical e-inclusion - increase the social and economic well being of people in rural, remote and economically disadvantaged areas with the help of ICT, and
Inclusive e-government - deliver better, more diverse public services for all using ICT while encouraging increased public participation in democracy.
“E-inclusion” means both inclusive ICT and the use of ICT to achieve wider inclusion objectives. The initiative focuses on participation of all individuals and communities in all aspects of the information society. E-inclusion policy, therefore, aims at reducing gaps in ICT usage and promoting the use of ICT to overcome exclusion, and improve economic performance, employment opportunities, quality of life, social participation and cohesion.
By implementing e-inclusion policies EU Member States intend to reduce the current differences in Internet usage (between current average use by the EU population and the use by older people, people with disabilities, women, lower education groups, unemployed and “less developed” regions) by half by 2010.
14 Towards a knowledge-based economy – Europe and Central Asia: Internet development and governnance
Member States must formulate and implement policies and programmes, which are tailored to specific needs of underrepresented and/or excluded groups (box 2). The e-Europe + action plan is designed in a way that allows for meeting relevant goals in a number of areas (institutions, ICT infrastructure, employment, education, health etc.) by mainstreaming ICT into all the EU sectoral programmes. A review of the situation in the EU, including the EU Member States in Central and Eastern European subregions, indicates that most of the countries have adopted an e-inclusion strategy tailored to their needs, which differ significantly from country to country. Many of the new EU Member States considerably lag behind the EU 15 with regard to ICT penetration and usage. Furthermore, some of the composite indexes imply that the EU Member States do not constitute a homogeneous group and could be clustered into distinct country-groupings. For example, one study, using the ICT Maturity Index, identifies five distinct country groupings among the EU 25:
(1) Laggard CEEC; (2) Frontrunner CEEC; (3) Laggard EU 15; (4) Follower EU 15, (5) Frontrunner EU 15 (table 1).7
Table 1. The European Union ICT frontrunners and laggards
Laggard CEEC
Latvia Lithuania Hungary Poland Slovakia Bulgaria Romania
Frontrunners CEEC
Czech Republic
Estonia Slovenia
Laggard EU15
Greece Spain France Italy Portugal
Follower EU15
Belgium Germany Ireland Luxembourg Austria
Frontrunner EU 15
Denmark Netherlands Finland Sweden United Kingdom
Source: Empirical/World Research Centre/University of Bath. Thematic Study to Analyse policy measures to promote access to information technologies as a means to combating social exclusion. Final Report, Bonn, February 2006.
The countries that form the laggard group within the new EU Member States share some common characteristics, including a sizeable rural population and unfinished regulatory reforms. They are relatively poorer than the rest of the group. Therefore, it is not surprising that these countries have been lagging behind in terms of ICT availability and accessibility. Within the EU 15, some of the Southern European countries (Spain, Portugal and Greece) were the latecomers to the EU. By many parameters, they are still behind the most advanced Member States of the EU 15. Another composite index, the World Economic Forum Networked Readiness Index (NRI), which depicts a nation’s degree of preparation to participate in and benefit from new ICT developments, largely confirms the existence of distinct country clusters in the EU (and in the UNECE region as a whole). It further spotlights the existing gaps and divides between and within the countries, particularly, in the institutional area. The index also reflects advancements and failures, which, in some instances, could be a direct result of policies (table 2).8
7 The ICT Maturity Index is a composite index based on six variables: Internet users, computer users, people with Internet home access, PIAP users, regular e-commerce users, and owner of mobile phones (source: Empirica/World Research Centre/University of Bath. Thematic Study to Analyse Policy Measures to Promote Access to Information Technologies as a Means to Combatting Social Exclusion. Final Report, Bonn, February 2006). 8 The Networked Readiness Index is a composite of three components: the environment for ICT offered by a given country or community, the readiness of the community’s key stakeholders (individuals, businesses, and governments) to use ICT, and finally the usage of ICT amongst these stakeholders (World Economic Forum 2004, p. 4).
Towards a knowledge-based economy – Progress assessment 15
Table 2. The Networked Readiness Index score in UNECE member States, 2002-2007
Moldova 3.13 92 42 Georgia 3.12 93 43 Armenia 3.07 96 44 Kyrgyzstan 2.90 105 45 Albania 2.87 107 46
Source: World Economic Forum (See http://www.weforum.org).
16 Towards a knowledge-based economy – Europe and Central Asia: Internet development and governnance
As the comparison of the NRI scores for the periods 2002-2003 and 2006-2007 indicate, between 2002 and 2007, some improvement has been observed in a number of the new EU Member States, as well as in some of the Southern European countries. Among the Central and Eastern European countries, Estonia and Slovenia continue outperforming the rest, but Romania has also markedly improved its score. Lithuania outpaced Latvia and climbed three ranks up in the regional ranking. The performance of Poland and Czech Republic in terms of the NRI has somewhat worsened. Both countries moved down in the regional rankings. In Southern Europe, the NRI scores of Spain and Portugal have been eroded, while the score of Greece has gained some weight. It appears that the most important constraining factors have been economic ones. All the countries of this sub-group have a per capita income, which is lower than the average per capita income of the world high-income country group (by the World Bank classification). In 2005, Spain’s per capita income ($25,250) was 71.6 per cent of the average per capita income of the world high-income country group ($35,264). Portugal’s per capita income was only 48.7 per cent of the average per capita income of the world high-income country group, and Greece’s per capita income was 56 per cent. At the same time, according to the World Bank data, the price basket for Internet in Spain and Portugal was almost twice the average price basket for Internet of the world high-income country group.9 Consequently, both the PC and Internet penetration rates were significantly lower the average penetration rates in the world high-income country group. For instance, the PC penetration rate in Greece was only 15.4 per cent of that of the world high-income country group. In Portugal and Spain, it was, respectively, 23 per cent and 52.6 per cent of the average PC penetration rate in the world high-income country group.10 A review of the national e-Inclusion strategies and policies of the EU Member States indicates that most of the Central and Eastern European countries focus on the provision of an affordable access to the Internet at public places (Poland, Lithuania, Latvia, Estonia, Romania and Bulgaria), improvement of computer literacy with the emphasis on school children and long-term unemployed (all the countries of the group), and on improvement of public services (e-services). Some of the countries specifically target the rural population (Lithuania, Bulgaria, Hungary and Romania). For example, Poland sets a goal to facilitate access to knowledge for people in small villages and towns, and also in areas distant from academic and cultural centres by providing a broadband Internet access to all rural schools and libraries. However, only a few countries target disadvantaged groups (Poland, Hungary and Slovakia). Hungary and Slovakia give high priority to integration into the Information Society of Roma, people with disabilities, and the elderly. Poland also targets people with disability. Southern European countries adopted a similar approach to implementing e-Inclusion policy. They also focus on achieving a mass effect in terms of e-Inclusion, therefore, most of their programmes and projects aim at raising higher computer literacy of the population, improving ICT skills of the labour force, widening the access to the Internet and integrating rural population in Information Society. Spain’s programme “Internet for all”, for example, envisages the establishment of new Public Internet Access Points (PIAPs) throughout the country. Furthermore, in order to improve the ICT skills and computer literacy of the working population, Spain intends to introduce ICT training programmes and to promote the use of new technologies in training and educational process at all public centres of education. Considering that NGOs could reach most disadvantaged groups and assist in spreading of digital literacy, the Government of Spain intends to implement a number of measures to provide ICT training to NGOs. To encourage their participation in promoting digital literacy, NGOs will be granted laptop computers.11 Countries belonging to the region’s frontrunners focus on deepening the ICT diffusion by concentrating their efforts on bringing disadvantaged and at high risk groups into the Information Society. This goal is to be achieved by varying methods. Some countries such as Austria and Belgium envisage introduction of special allowances for certain groups to help purchase ICTs and Internet access. Some other countries, for
9 The World Bank. ICT at a Glance (http://web.worldbank.org/WBSITE/EXTERNAL/STATISTICS/). 10 Ibid. 11 Empirica/World Research Centre/University of Bath. Thematic Study to Analyse Policy Measures to Promote Access to Information Technologies as a Means to Combating Social Exclusion. Final Report, Bonn, February 2006.
Towards a knowledge-based economy – Progress assessment 17
example, Germany, have allocated public funds to finance the design and construction of special web sites that could be easily accessed and used by disabled people. Another important priority of this group of countries is the improvement of public services by employing ICT and the Internet (e-Government). CIS Member States have been following similar patterns in addressing the problem of the digital divide, although only a few countries target social groups with special needs (Belarus, Moldova and Ukraine). Shortage and underdevelopment of the ICT physical infrastructure, on the one hand, and lower per capita incomes and the size of territory in need of connectivity, on the other hand, have made the task of building up an Information Society much more challenging in comparison with the EU Member States. With the exception of the South Caucasus countries and Moldova, most country members of the CIS focus on extending their Internet physical backbone to geographic regions experiencing a teledensity deficit and on improving their countries’ connectivity with global Internet networks. Some of the CIS countries (Russian Federation and Kazakhstan, in particular) envisage undertaking measures aiming at narrowing the rural-urban digital divide by implementing large-scale public projects. Efforts have been made to raise the ICT literacy of the population by introducing computer training at schools and universities, connecting educational establishments to the Internet and promoting ICT research by encouraging networking within and between academic communities of the CIS. As of September 2007, almost 90 per cent of Russian’s schools and universities were connected to the Internet. Therefore, at present, the emphasis of most of the CIS member States has been on actions which could allow expanding rather than deepening the base of their future Information Societies. From the perspective of the Information Society development, the situation in this group of countries is complicated by the overall weakness of their civil societies in terms of organizational capacity, resource availability and experience and, consequently, their limited ability to influence the decision-making process regarding the content of national and regional e-development strategies. Furthermore, there is also lack of interest on the side of business communities, especially, small and medium enterprises due to the lack of funding, but also lack of understanding of the potential benefits associated with the use of the Internet, although newly developed companies in the ICT areas have been rapidly networking and developing their own mechanisms of mobilization and lobbying. An important contribution in raising the ICT awareness among local stakeholders has been made by the international community (bilateral and multilateral donor organizations, including the World Bank, European Bank for Reconstruction and Development, Asian Development Bank, United Nations Development Programme and Non-Governmental Organizations (NGOs). Networking among the CIS NGOs has been steadily promoted and supported by United Nations agencies and the United Nations regional commissions (UNECE and ESCAP). These actions have also brought some positive results in terms of NGO participation in setting up a national Information Society agenda.
1.3 The UNECE contribution to the Information Society and to narrowing the digital divide in the region
In the past several years, the UNECE, together with the other regional commissions, has cooperated very successfully in the preparation, participation and follow-up of the World Summit on the Information Society (WSIS, Geneva 2003 and Tunis 2005). In the follow-up, the regional commissions have organized side-events to sessions of the Commission on Science and Technology for Development (CSTD) and the Internet Governance Forum. UNECE has been innovative in mobilizing stakeholders’ contribution to trade facilitation, protection of environment, improvement of transportation, energy efficiency, housing and some other areas. As a standard-setting body, the UNECE has been heavily focused on environmental democracy using electronic information tools, simplification and standardization of international procedures, documentation, data terminology and transmission. At present, UNECE provides a forum for policy dialogue and continues dealing with issues related to ICT in its subprogrammes.
18 Towards a knowledge-based economy – Europe and Central Asia: Internet development and governnance
1.3.1 Environmental democracy
The broad aim of the environment activities of UNECE is to safeguard the environment and human health, and to promote sustainable development in its member countries in line with Agenda 21. The practical aim is to reduce pollution so as to minimize environmental damage and avoid compromising environmental conditions for future generations. To this end, UNECE has adopted a four-pronged approach:
(a) Its Committee on Environmental Policy brings together Governments to formulate environmental
policy and support its implementation by organizing seminars, workshops and advisory missions and providing a forum for sharing experiences and good practices;
(b) UNECE also takes a very active role in certain regional and cross-sectoral processes, especially:
the “Environment for Europe” Ministerial process; Environment, Transport and Health; and Education for Sustainable Development;
(c) Through its environmental performance reviews, UNECE assesses individual countries’ efforts to
bring down pollution levels and manage their natural resources, and makes recommendations to improve their environmental performance;
(d) Adoption of multi-lateral environmental agreements.
UNECE has negotiated five environmental treaties, all of which are now in force:
• The Convention on Long-range Transboundary Air Pollution;
• The Convention on Environmental Impact Assessment in a Transboundary Context;
• The Convention on the Protection and Use of Transboundary Watercourses and International Lakes;
• The Convention on the Transboundary Effects of Industrial Accidents;
• The Convention on Access to Information, Public Participation in Decision-making and Access to Justice in Environmental Matters (Aarhus Convention).
In many countries of Eastern Europe, Caucasus and Central Asia (EECCA), the use of up-to-date information technologies by environmental monitoring authorities needs to be expanded. These technologies may substantially improve environmental data handling, exchange and supply to public authorities and the public. The Working Group on Environmental Monitoring and Assessment has established a task force, with the Russian Federation as lead country, to review the collection of meta information on available sources of environmental information and activities in EECCA countries and to develop practical tools and instruments, using modern information technologies, to improve the use and exchange of information in these countries, and to harmonize their approaches with those applied within European Environment Agency (EEA) networks. With the support of EU/Tacis funds the implementation activities of the UNECE include:
• Creation of national reference institutions on electronic tools in EECCA countries;
• Provision of national reference institutions with computer equipment and access to Internet;
• Creating a harmonized meta-database with data sources and datasets, institutes, reports and other information products;
• Training of national experts of EECCA countries on methodologies, standards and formats for environmental information exchange developed by EEA;
• Development or expansion of national metadata bases on sources of data and data sets, institutes, reports and other information products in EECCA countries;
Towards a knowledge-based economy – Progress assessment 19
• Development of national websites on the basis of EEA guidelines and uploading the national meta information.
The Aarhus Convention grants the public rights and imposes on Parties and public authorities obligations regarding access to information and public participation and access to justice. In order to achieve this, effectively electronic tools should be used, and the Parties to the Aarhus Convention adopted in 2005 the Recommendations on the more effective use of electronic information tools to provide public access to environmental information (ECE/MP.PP/2005/2/Add.1412). The capacity-building activities on electronic information tools targeting Government and NGO representatives in the EECCA region13 have been emphasized, and together with the Organization for Security and Co-operation in Europe (OSCE) a network of Public Environmental Information (Aarhus) Centres in the South Caucasus, Central Asia, and South and Eastern Europe serving as community access and training points for citizens and entrepreneurs, have been established.14 In the area of environment protection the tasks of raising public awareness of the environmental situation and early warning are among the most important. In fulfilling these tasks the UNECE in collaboration with UNESCO has collaborated on promoting education for sustainable development15 as well as environmental education, including dissemination of information on the state of environment in the region via the Internet and networking with local partners (both governmental and non-governmental organizations). The activities associated with environmental education include the development and provision of multilingual contents for interactive websites throughout the region. Thus, in pursuing its environmental objectives the UNECE has also provided leadership in the field of e-environment, e-access, and e-governance, and produced several important normative instruments.
1.3.2 Trade facilitation and electronic business
Economic development is important for all countries and reducing these unnecessary costs by implementing simpler trade procedures is a crucial element. Simplified trade procedures could save millions for one single company. The emergence of electronic means of data exchange and storing has opened new opportunities for trade facilitation – to replace traditional methods of information handling and transmission in the form of paper by alternative teletransmission methods. Even though the required technology and services are available, this does not, however, suffice to make data interchange of this type an operational reality. There is an equally important requirement to develop and agree on standards, procedures, and other essential elements of data handling methodologies to ensure intelligible communications between different systems used by trade and transport operators. In 1996, the United Nations Centre for Trade Facilitation and Electronic Business (UN/CEFACT) was established. Its principal focus is on facilitating national and international transactions, through the simplification and harmonization of processes, procedures and information flows, and so to contribute to the growth of global commerce. The development of e-business standards and trade facilitation recommendations is carried out in the UN/CEFACT Forum which is the concurrent meeting of all permanent UN/CEFACT Expert Groups. The Forum is the operational entity of UN/CEFACT where the work of around 1000 technical experts is coordinated. It convenes twice a year in different parts of the world to allow all five Groups, their sub-groups and project teams to meet for one week in the same location. 12 See http://www.unece.org/env/documents/2005/pp/ece/ece.mp.pp.2005.2.add.4.e.pdf. 13 See http://www.unece.org/env/pp/electronictools/documents/REC_workshop_prospectus_2006_10_26.pdf. 14 See http://www.osce.org/publications/eea/2005/07/15634_429_en.pdf. 15 See http://www.unece.org/env/esd/welcome.htm.
20 Towards a knowledge-based economy – Europe and Central Asia: Internet development and governnance
The most recognized international standards developed by UN/CEFACT are:
• The UN Layout Key for Trade Documents, which is the foundation for the EU Single Administrative Document (SAD);
• UN/EDIFACT, the international standard for electronic data interchange and numerous trade facilitation recommendations16.
The UN/CEFACT Forum has focused on improving the delivery of its outputs including a wide range of trade facilitation and best practice recommendations, electronic business standards and technical specifications.17 In addition, an important extrabudgetary project for a Trade Facilitation Guide and its Capacity-Building programme, funded by the Government of Sweden, is in the process of being implemented.
1.3.3 Transport
In order to further improve the efficiency, safety, environmental performance and security of its transport system work, UNECE has focused, inter alia, on the computerization of the Customs Convention on the International Transport of Goods under cover of TIR (transport routier international) Carnets in order to eliminate the use of paper TIR Carnets. The World Forum for Harmonization of Vehicle Regulations (Working Party 29) has an informal group which is studying how intelligent transportation systems (ITS) can improve the safety and environmental performance of vehicles. Some intelligent systems have already been incorporated into UNECE vehicle regulations. The Transport, Health and Environment Pan-European Intersectoral Programme (the PEP) Clearing House18 is an Internet-based portal for user-friendly access and exchange of information in English and Russian on transport, health and environment in the pan-European region.
1.3.4 Statistics
The Statistics subprogramme is naturally oriented towards information management, and therefore is making information available through the use of modern ICT, particularly through its statistical database19 and the Database on International Statistical Activities (DISA-IP), and its Web-based documents library.
1.3.5 Energy
The ICT projects of energy include two separate websites in addition to maintaining webpages on the main UNECE website. While the Energy Efficiency 21 Project website20 has been used mainly for communications so far, in the next phase of the project, it will be used for more substantive purposes, including projects proposals and assessment of energy resources. The Gas Centre Database and website21 provide the 22 participating companies in the UNECE Gas Centre with information about Gas Centre activities, electronic publishing of Gas Centre reports, a forum of
16 See http://www.unece.org/cefact/about.htm. 17 See http://www.unece.org/cefact/. 18 See http://www.thepep.org/CHWebSite/. 19 See http://www.unece.org/stats/stats_h.htm. 20 See http://www.unece.org/ie/se/eneffic.html#ee21. 21 See http://www.gascentre.unece.org/.
Towards a knowledge-based economy – Progress assessment 21
information exchange and a database on the legal, policy, regulatory and structure of national gas markets and the European gas market as a whole. ICT will make it possible to achieve new political objectives in the gas market. The liberalization of the gas market requires detailed tracking and monitoring of volumes and billing data. Without the new ICT this would have been very difficult to attain. The new ICTs have provided and will provide the necessary technical solutions to serve industrial objectives.
1.3.6 Gender and ICT
ICT have a great potential as a tool to enhance women’s economic, political, and social empowerment. Women entrepreneurs in particular can benefit from these to improve their access to information and to increase competitiveness and market outreach of their businesses. At the same time, a “gender divide” within the digital divide is apparent in all the regions, including the UNECE region. It is reflected in the lower numbers of women users of ICT, compared to men, as well as in the persistence of gender-specific structural inequalities that constitute barriers to access. Therefore, mainstreaming gender aspects into ICT policy debates and decision-making processes is necessary to ensure adequate access to and utilization of ICT by women entrepreneurs. Improving access to ICT for women requires a multidimensional approach that addresses the immediate barriers preventing women’s access to ICT, as well as the underlying structural forces creating these barriers. The gender-specific barriers include high access costs, time constraints, lack of networks, cultural barriers, and traditional views that technology is a “male” domain. Educational background and access to training opportunities as well as cultural and social norms constitute other significant barriers for women to ICT use. A dialogue on how to close a “gender divide” within the digital divide is thus very relevant to countries in the UNECE region. That is why raising awareness on gender aspects of ICT in the context of the knowledge-based society, developing gender disaggregated ICT data and analysis, training and access to low-cost ICT infrastructure and building partnership among stakeholders to change stereotypes and traditional social climate should be particularly considered to address the problem. UNECE promotes a regional dialogue on gender and information society through:
• Providing a regional platform for dialogue and mainstreaming gender into the discussion on ICT strategy and action plans at regional and subregional levels. The regional discussion on Building an Information Society within the WSIS process provides a good framework to incorporate gender issues from the outset. UNECE organized in cooperation with partners a number of round tables on gender and ICT, including at WSIS (Geneva, 2003 and Tunis, 2005) as well as at regional preparatory meetings in Bishkek (2003) and Bucharest (2003);
• Supporting national efforts for mainstreaming gender into ICT policies concerning SMEs. UNECE promotes the exchange of good practices and building networks among women entrepreneurs through UNECE forums (Geneva, 2001 and 2003) and publication of good practices in access to ICT and financing;22
• Contributing to capacity-building through training workshops for policymakers at national and local level responsible for SME policies, representatives of women’s business associations, members of academia and NGOs from the SPECA member countries. The objective of the workshops was to address issues, such as the support systems for women in small business and the use of ICT for SMEs. In total, 110 people were trained. Four such training workshops, each consisting of 14 days, were organized in 2006 and 2007, and two more training workshops have been planned for 2008;
22 See http://www.unece.org/gender/news.htm and http://www.unece.org/gender/pubreps.htm).
22 Towards a knowledge-based economy – Europe and Central Asia: Internet development and governnance
• Providing methodology and supports capacity building within National Statistical Offices to develop gender disaggregated data related to ICT.
1.3.7 Digital divide
The UNECE efforts aiming at narrowing the digital divide between the UNECE member States have been centered on countries in transition, particularly on Central Asian and South Caucasus countries. During 2002 and 2003, the UNECE organized an assessment of 14 countries in transition in terms of their readiness for the knowledge-based economy (Armenia, Azerbaijan, Belarus, Bulgaria, Georgia, Kyrgyzstan, Latvia, Lithuania, Russian Federation, Slovakia, Tajikistan, Yugoslavia, Ukraine, and Uzbekistan).23 A number of regional studies were also prepared, including: “Towards a Knowledge-based Economy. Regional Assessment Report” (2002), “Information Economy Report – E-Policy Development in Transition Economies 2002-2003”, “Internet Infrastructure Development in Transition Economies” (2000). The UNECE organized two regional forums of women entrepreneurs in 2001 and 2003, at which the main focus was on the role of ICT in ensuring the development and survival of women-led and women-owned enterprises. In 2002, the UNECE held its First Regional Forum on Youth: “Security, Opportunity and Prosperity”, at which various remedial options to combat youth unemployment and poverty were considered, including youth entrepreneurship and ICT. Following this event, the Government of Ukraine in cooperation with the UNECE, CIS Executive Committee and other United Nations agencies organized the CIS Youth Forum “Youth of the 21st Century: Realities and Perspectives” held in Kiev in September 2003. The CIS Youth Forum devoted much attention to developing youth entrepreneurship in the ICT area as well as to such issues as: youth e-education, youth teleworking and venture enterprising.24
1.3.8 Facilitating regional cooperation and integration with special reference to Central Asia
Within the framework of SPECA25, which is jointly supported by the UNECE and ESCAP, a Project Working Group (PWG) – the Project Working Group on ICT for Development was established in 2004 with the aim to facilitate cooperation in implementing the initiatives related to knowledge-based economy development. During the period of 2004 to 2007, The PWG on ICT for Development served as a forum for discussion and knowledge sharing among ICT policymakers of SPECA member countries. For example, the PWG facilitated organization of regional capacity-building activities under the technical cooperation project on “Capacity-building for ICT Policymaking”, financed by the United Nations Development Account. In cooperation with the Ministry of Transport and Communications of Kyrgyzstan, the two United Nations regional commissions organized the Regional Seminar on Capacity-building for ICT Policymaking in Central Asia in Bishkek from 11 to 14 July 2006. The seminar supported Central Asian countries in building the capacity in the area of legal aspects of ICT policymaking, development of ICT policy and strategy integrating ICT into national development programmes. The PWG also facilitated national capacity-building activities in the area of ICT policy formulation and on legal issues on ICT policy development These are the National Seminar on Capacity Building for ICT Policymaking held in Baku from 27 to 28 November 2007 in cooperation with the Ministry of
23 All the reports were prepared by national experts and published by UNECE (see: http://www.unece.org/pub_cat/topics/ict.htm; http://www.unece.org/operact/enterp/assesreport.htm). 24 The contribution of participants and UNECE to the work of forums were published by UNECE. Youth in the UNECE Region: Realities, Challenges and Opportunities (United Nations publication, Sales No. E/R.03.II.E.47; Youth of the XXI Century: Realities and Perspectives (United Nations publication, Sales No. E/R.04.II.E.18); Women’s Entrepreneurship in Eastern Europe and CIS Countries (United Nations publication, Sales No. E.03.II.E.3); UNECE. Access to Financing and ICT for Women-Entrepreneurs in the UNECE Region. Challenges and Good Practices (United Nations publication, Sales No. E.04.II.E.11). 25 SPECA member countries are: Afghanistan, Azerbaijan, Kazakhstan, Kyrgyzstan, Tajikistan, Turkmenistan and Uzbekistan as of 2008.
Towards a knowledge-based economy – Progress assessment 23
Communication and Information Technologies of the Republic of Azerbaijan; and the National Capacity-building Seminar on Information and Communication Technology Policy and Legal Issues held in Dushanbe from 30 to 31 October 2007 in cooperation with the Ministry of Transport and Communications and the Ministry of Economy and Trade of Tajikistan. With reference to the issues on Broadband and ICT Development, the UNESCAP and UNECE organized the Regional Workshop on Broadband and ICT Development for Improved Communication in Central Asia in Tashkent from 21 to 22 June 2007 jointly with the Communication and Information Agency of Uzbekistan, ESCAP, Asia-Pacific Telecommunity, the United Nations Development Programme and the Information Technology Association of Uzbekistan. It contributed to an increased awareness and knowledge on broadband and ICT development issues among policymakers of Central Asia, served as a multi-stakeholder discussion forum on the issues and adopted Tashkent Statement on Broadband and ICT Development for Improved Communication in Central Asia. At the request of the PWG on ICT for Development, UNECE produced a publication on Information and Communication Technology Policy and Legal Issues for Central Asia – Guide for ICT Policymakers in October 2007. The Guide examines legal issues related to the sound development of eCommerce on five distinct areas such as legal infrastructure, legal certainty, legal security, legal protection and legal deterrence. The Russian version of the publication will be published in the first half of 2008. It will also be used in the future UNECE capacity-building activities in the SPECA member countries such as in Uzbekistan and Azerbaijan envisaged through 2008. With reference to the issue of the ICT access, UNECE prepared an assessment review of the ICT access points in selected countries in Eastern Europe and Central Asia. The review analyses the current status of the community ICT access points and identifies good practices. The review will be used in future capacity-building activities to be organized in the SPECA member countries in 2008-2009. It has been decided that the SPECA PWG on ICT for Development will be transformed into a new Project Working Group on Knowledge-based Development (PWG on KBD) in 2008. This transformation will enable UNECE and ESCAP to work wider range of issues related to the knowledge-based development for the SPECA member countries. The ICT related works, which have been covered by the PWG on ICT for Development, such as the capacity-building activities on ICT policymaking and the field implementation of the UN Development Account project on knowledge-networks through ICT access points for disadvantaged communities in Central Asia, will continue to be carried out under the new PWG on KBD.
24 Towards a knowledge-based economy – Europe and Central Asia: Internet development and governnance
Table 3. ICT opportunity index, regional ranking in UNECE member States, 2001 and 2005
Note: *EU 25 excludes member States for which data was not available. Source: EUROSTAT Press release, Internet Usage in the EU 25, 10 November 2006, STAT/06/146.
Towards a knowledge-based economy – Progress assessment 27
Table 6. Internet access by individuals (by age): the digital divide within the EU Member States, 2006
(percentage)
Internet Use by Individuals (at least once a week)
Note: *EU 25 excludes member States for which data was not available. Source: EUROSTAT Press release, Internet Usage in the EU 25, 10 November 2006, STAT/06/146.
28 Towards a knowledge-based economy – Europe and Central Asia: Internet development and governnance
Table 7. National versus rural coverage and penetration: broadband in the EU Member States, 2003-2005
Note: *2006, **2004 Source: Commission of the European Communities. i2010 – Annual Information Society Report 2007, Vol. 3, Brussels, 30.3.2007, SEC (2007) 395.
Towards a knowledge-based economy – Progress assessment 29
Table 8. E-readiness regional index in the Russian Federation, 2005
Rating Region Index score
1 Moscow 5.65 2 Saint Petersburg 4.86 3 Khanty-Mansi Autonomous Okrug 4.41 4 Yamal-Nenets Autonomous Okrug 4.27 5 Tomskaya oblast 4.06 6 Samarskaya oblast 3.80 7 Murmanskaya oblast 3.75 8 Chukchi Autonomous Okrug 3.63 9 Nenets Autonomous Okrug 3.62
10 Republic of Karelia 3.58 11 Tyumenskaya oblast 3.55 12 Taimyr Autonomous Okrug 3.51 13 Khabarovskiy kray 3.45 14 Moscovskaya oblast 3.43 15 Yaroslavskaya oblast 3.39 16 Irkutskaya oblast 3.38 17 Primorskiy kray 3.35 18 Novosibirskaya oblast 3.33 19 Kamchatskaya oblast 3.32 20 Permskaya oblast 3.32 21 Sakhalinskaya oblast 3.30 22 Arkhangel'skaya oblast 3.29 23 Magadanskaya oblast 3.28 24 Sverdlovskaya oblast 3.27 25 Kaluzhskaya oblast 3.26 26 Republic of Sakha 3.25 27 Kaliningradskaya oblast 3.18 28 Novgorodskaya oblast 3.15 29 Nizhegorodskaya oblast 3.12 30 Chelyabinskaya oblast 3.11 31 Republic of Komi 3.10 32 Vologodskaya oblast 3.08 33 Omskaya oblast 3.07 34 Rostovskaya oblast 3.03 35 Republic of Tatarstan 3.02 36 Voronezhskaya oblast 3.01 37 Leningradskaya oblast 3.01 38 Kemerovskaya oblast 3.01 39 Krasnodarskiy kray 2.97 40 Krasnoyarskiy kray 2.96 41 Saratovskaya oblast 2.95 42 Evenk Autonomous Okrug 2.94 43 Republic of Udmurtiay 2.93 44 Vladimirskaya oblast 2.93 45 Chuvash Republic 2.91 46 Republic of Khakassia 2.89 47 Astrahanskaya oblast 2.89 48 Volgogradskaya oblast 2.89
30 Towards a knowledge-based economy – Europe and Central Asia: Internet development and governnance
Rating Region Index score
49 Republic of Mari El 2.86 50 Pskovskaya oblast 2.84 51 Republic of Bashkorstan 2.82 52 Tulskaya oblast 2.82 53 Stavropol'skiy kray 2.81 54 Republic of Adygeia 2.81 55 Orenburgskaya oblast 2.80 56 Altayskiy kray 2.80 57 Ryazanskaya oblast 2.79 58 Belgorodskaya oblast 2.78 59 Republic of Mordovia 2.77 60 Lipetskaya oblast 2.76 61 Koryakskiy Autonomous Okrug 2.68 62 Orlovskaya oblast 2.64 63 Penzenskaya oblast 2.64
64 Ulyanovskaya oblast 2.63 65 Amurskaya oblast 2.60 66 Smolenskaya oblast 2.60 67 Ivanovskaya oblast 2.58 68 Republic of Buriatia 2.57 69 Kurganskaya oblast 2.57 70 Jewish Autonomous Okrug 2.56 71 Tverskaya oblast 2.56 72 Republic of Altai 2.56 73 Kostromskaya oblast 2.54 74 Tambovskaya oblast 2.47 75 Bryanskaya oblast 2.46 76 Kirovskaya oblast 2.45 77 Republic of North Ossetia 2.40 78 Chitinskaya oblast 2.36 79 Aga-Buriat Autonomous Okrug 2.32 80 Kabardino-Balkarian Republic 2.29 81 Republic of Kalmykia 2.27 82 Kurskaya oblast 2.27 83 Republic of Karachai-Cherkess 2.26 84 Komi-Permiak Autonomous Okrug 2.20 85 Republic of Daghestan 2.13 86 Ust'-Orda Buriat Autonomous Okrug 2.10 87 Republic of Tuva 2.08 88 Ingush Republic 1.96
Regional average 2.98
Source: The Russian Institute of the Information Society (http://www.iis.ru).
31
Chapter 2
INTERNET DEVELOPMENT: CURRENT STATE OF
CRITICAL INTERNET RESOURCES IN THE UNECE REGION
Countries of the UNECE region are among the forerunners and today’s leaders in the level of Internet development in terms of both innovation and penetration. This success is attributable to several factors, including:
• High density of and constant modernization of ICT infrastructure;
• On-going liberalization of ICT markets;
• Accumulation of significant capital stocks, both tangible and intangible, including highly developed human resources;
• High adaptability and flexibility of institutions;
• Efficient corporate sector;
• Political commitment to and public support of the innovation process. The region, however, is not free of socio-economic disparities, which have affected the pace and pattern of Internet penetration across the UNECE region. At the same time, strong political commitments to modernization, especially in the former socialist countries, and stakeholders’ cooperation at all the levels, national, subregional and regional, have been contributing to narrowing these disparities.
2.1. ICT infrastructure
In comparison with the other world regions, the UNECE region is more advanced in terms of ICT density and penetration although actual rates vary greatly from subregion to subregion and from country to country. The ICT infrastructure in the Western European subregion, for example, is highly developed, with fixed line teledensity above 50 per cent on average. Mobile penetration rates are also very high with several countries achieving the penetration rate over 100 per cent. The situation in the Eastern and Central Europe is more diverse with some countries rapidly catching up with the leading Western European countries while others lagging behind. Unevenness of ICT development across the CIS is even greater, mirroring disparities in distribution of ICT infrastructure, capacities and capabilities inherited from the Soviet past.
2.1.1 Main (fixed) telephone lines
Despite the continuous introduction of new technologies, fixed lines remain an important means of accessing Internet in the region, although their growth has been somewhat stagnant over the past decade in most countries of the region. The total number of terrestrial telephone lines has not increased significantly since the mid 1990s. Actually, since 2001 the growth of main lines has been negative in several countries. However, in the CIS and some Balkan states, there was an impressive upsurge in main telephone line deployment, resulting in a teledensity increase (figure 14). Albania, for example, augmented its main telephone lines by 8 times the level of 1995 and, consequently, teledensity – by 11 times. In the majority
32 Towards a knowledge-based economy – Europe and Central Asia: Internet development and governnance
of the countries presented in figure 14 table the teledensity remained either at the same level or even declined.
Figure 14. Main telephone lines availability in UNECE economies in transition
Source: ITU data-base
Source: ITU database. Data reproduced with the kind permission of ITU. In a number of countries of the region, stagnation in the main line segment of the communication sector was partly due to saturation. In Western European countries, for example, the overall fixed penetration rate reached over 50 per cent with most households owning a telephone line (over 90 per cent in France, Netherlands, Spain, Belgium, Finland and United Kingdom, for example).26 Fierce competition from mobile telephony and alternative (cable) providers was another factor behind a growth contraction in the main line segment. A rapid proliferation of affordable mobile telephony causing a fixed to mobile substitution (FMS) in many countries of the region has been among the factors constraining further expansion of the main line infrastructure. This phenomenon was especially noticeable in Eastern and Central Europe and in some countries of the CIS, where, on the one hand, the shortage of funding undermined the ability of national telecoms to extend their traditional services to the country regions with a low telephony penetration, and, on the other hand, the aging and a relatively low quality of the fixed line infrastructure prevented them from producing and diversifying their services that could meet consumers’ expectations. Gradual liberalization of the ICT sector and privatization of national telecoms in the new EU Member States, as well as in those in line for an EU membership and in some of the CIS member-sates, led to setting up an institutional framework conducive to competition and, hence, to the emergence of alternative (to fixed line) providers, but also of new telecommunication companies. The process of liberalization, however, has been patchy across the region with some countries still retaining Government control over national telecoms. In these countries, state-owned and/or -controlled fixed line incumbents with significant market power have resisted new and/or alternative incumbents’ entry to the market, e.g. in Belarus and Azerbaijan. According to EU data, in October 2005, a combined fixed line market share of only one operator was 90 per cent in each of the five new EU Member States (Cyprus, Latvia, Lithuania, Slovakia and Slovenia). In each of three countries (Czech Republic, Estonia and Poland), three operators captured more than 90 per cent of the fixed line market in terms of revenues.27
26 ITU database. 27 EU database.
Figure 28. The UNECE Economies in Transition: Main Telephone Lines Availability
Albania
Bosnia &
Herzegovina
Bulgaria
Croatia
Czech Rep.
Estonia
Hungary
Latvia
Lithuania
Poland
Romania
Serbia & Montenegro
Slovakia
Slovenia
Macedonia
Belarus
Moldova
Russia
Ukraine
Armenia
Azerbaijan
Georgia
Kazakhstan
Kyrgyzstan
Tajikistan
Turkmenistan
Uzbekistan
0
5
10
15
20
25
30
35
40
45
Mai
n te
leph
one
lines
per
100
inha
bita
nts
2000
2005
Internet development: Current state of critical Internet resources in the UNECE region 33
Responding to competition pressure, fixed line operators particularly in Central and Eastern European countries have embarked on modernization in an attempt to improve the quality and the bundle mix of communication services. A strategy adopted by most of the telecoms in the subregion has been as follows: (a) upgrading and extending basic infrastructure; (b) introduction of new technologies, which could improve the quality, volume and diversity of services, such as broadband, wireless and digitization; (c) integrating various services; and (d) widening consumer choice by offering a variety of packages of services. These efforts have been translated into growing digitization of the fixed line infrastructure, as well as wireless and broadband connectivity. Consequently, there was an increase in the Digital Subscriber Line (DSL) coverage throughout the region (figures 15 and 16). By the end of 2006 in 15 of the 27 EU Member States including Estonia, the DSL coverage rate reached above 90 per cent. This also allowed telecoms in many Central and Eastern European countries and in the CIS to provide a relatively low-cost but significantly enhanced access to Internet. In some of the CIS Member States with comparatively low teledensity and significant rural-urban and geographical divides, telecoms have undertaken efforts to upgrade and extend their basic infrastructures by deploying fibre-optic lines and New Generation Networks. For instance, Kazakhtelecom, a key fixed line incumbent of Kazakhstan, has been constantly improving its capacity. It recently completed the construction of the main ring of the National Information Super Highway (NISH) by launching the North segment of the network, which connected Petropavlovsk, Kostanai and Aktobe. The NISH now consists of over 11,000 km of fibre-optic lines that link up regional (oblast) centers, Almaty and Astana (in total 14 large cities) and 116 smaller cities and towns.28 Over the period 2000-2005, Moldtelecom (Moldova) had been focused mainly on extending the digitization of its telephony networks. As a result, the overall capacity of installed digital lines reached 67 per cent by 2006. The company also devoted significant resources to construction of a state of the art fibre-optic network that connects all urban centres in Moldova.29 Telecoms in many EU countries are now moving beyond voice and data and entering the world of interactive video and digital TV (box 2). At present, they are investing in Asymmetric Digital Subscriber Lines (ADSL), a technology which is viewed as a means of reducing fixed to mobile substitution and as a channel through which future converged services can be or already are being offered. As a result, ADSL networks have been steadily growing throughout the UNECE region.
28 Political Intelligence. Final Report: Monitoring of Russia and Ukraine (priority 1) and Armenia, Azerbaijan, Belarus, Georgia, Kazakhstan and Moldova (priority 2): Telecommunication and the Information Society, London-Brussels-Madrid, 2006, p. 17. 29 See http://www.moldtelecom.md/about/repports/en.html.
Box 2. Telecoms throughout the UNECE region are entering a new world – the world of interactive video and digital TV
The reason why European Telecoms should want to do something 'different' is crystal clear. Like many other national telecoms around the world, their traditional voice service is in decline. A solution to this problem appears to be found in the so-called triple play package - an IP platform capable of delivering high-speed internet access, voice and a range of TV-based services to broadband customers (IPTV). In Europe, telecoms who have publicly announced trials of IPTV services include Swisscom, Telekom Austria and Telecom Italia (France Telecom already offers a video-on-demand service, while Iceland Telecom launched a commercial IPTV service late last year).
34 Towards a knowledge-based economy – Europe and Central Asia: Internet development and governnance
0% 20% 40% 60% 80% 100%
Greece
Slovenia
Slovakia
Poland
Cyprus
Czech Republic
Lithuania
Ireland
Hungary
Latvia
Austria
Italy
Norway
Spain
Estonia
Finland
Germany
Iceland
Portugal
Sweden
France
Malta
Netherlands
UK
Belgium
Denmark
Luxembourg
average 27
0% 20% 40% 60% 80% 100%
Cyprus
Greece
Italy
Latvia
Slovenia
Ireland
Slovakia
Poland
Germany
Norway
Czech Republic
France
Austria
Iceland
Finland
Luxembourg
Spain
Sweden
UK
Estonia
Lithuania
Denmark
Hungary
Portugal
Belgium
Netherlands
Malta
average 27
na
na
Figure 15. National DSL coverage in EU Member States at the end of 2005
(% of inhabitants)
National cable modem coverage in EU Member States at the end of 2005
( % of inhabitants)
Source: IDATE Consulting and Research. Broadband Coverage in Europe. Final Report. 2006 Survey.
Faced with mature cable and satellite competition in the TV space, telecoms are going to find it hard to develop and market unique selling points (USPs) for their own triple-play offering. Swisscom, which conducted a trial of the Microsoft TV platform from November 2004 to February 2005, appears to have more straightforward IPTV ambitions--at least in the short term. "Our main concern is that the picture and sound quality is at least as good as what the cable operators can provide," says Felix Graf, triple-play manager at Swisscom. "Without that, we can't compete. Network-based applications and functions, such as e-mail and caller ID on the TV, are not priorities right now for us." Source: Horizon House Publications.
Internet development: Current state of critical Internet resources in the UNECE region 35
2.1.2 Mobile networks
The UNECE region is also among the world leaders in terms of mobile penetration (table 21 and table 9). In many countries, the penetration rate has reached 90 to 100 per 100 inhabitants. As it is seen from table 9, in 20 of the 40 countries more than 80 per cent of population own one or more mobile contracts. In Portugal and Italy – 90 percent of population own a mobile contract. However, in Uzbekistan, Kazakhstan and Moldova, this indicator is significantly lower with, respectively, only 13 per cent, 16 per cent and 19 per cent of the population owning a mobile contract. The mobile network is rather extensive in many countries of the region, thus allowing for a further proliferation of mobile telephony particularly in those countries where the penetration has not yet reached its limit (table 22). At the same time, the mobile telephony market appears to have crossed over and/or is approaching a theoretical saturation point in most countries of the region. In 14 of the 49 countries presented in table 21, the penetration rate was far above 100 per cent in 2005. The mobile network has overtaken fixed lines in a number of the region’s countries, including the Russian Federation, Kazakhstan and Azerbaijan.
Table 9. Percentage of population who owns one or more mobile contracts
Source: Worldwide Mobile Penetration Rates, Wireless World Forum 2006. (See www.w2forum.com/i/Reports).
The mobile telephony market differs from that of the fixed line market. Firstly, the intensity of competition is much higher. Secondly, the total number of mobile operators is significantly larger. Thirdly, it is less strained by regulation. Such market conditions have been conducive to innovation in pricing, product and services. In order to stay in the market, mobile providers have been forced to constantly search for new business and technology solutions. Apart from mobile voice services they are now focusing on data transmission, particularly on mobile Internet, and various media, such as: audio, video, mobile TV, games, among others. SMS/MMS (Multimedia messaging services) messaging still accounts for the largest share of mobile data revenues due to several advantages (affordability, accessibility, practicality and easy access). With the introduction of new technologies/applications (new platforms, mobile Public Key Infrastructure (PKI), mobile digital broadcasting (DVB-H), third generation handsets and etc.), mobile network virtual operators have been slowly gaining a market share in the Internet services provision. Despite some concerns associated with the saturation of the mobile telephony market, it is precisely mobility and portability that makes this mode of interconnection so attractive and effective, especially in such areas as: e-Government, e-services (e-health, e-education, e-advertising and e-commerce) and e-business. It is not surprising that such impressive growth of the mobile segment raised the idea that one of the possible dimensions of the Information Society may be a mobility dimension. According to ITU, the combination of mobile with Internet and IP-based technologies and the integration of fixed and mobile technologies open a host of possibilities for innovative applications and new modes of interaction:
• Wireless applications of pervasive or ubiquitous technologies conjure up images of intelligent homes and always-on human monitoring;
• Location-based technologies can help police and individuals protect themselves and their family members from various forms of crime. Combined with customized advertising, such technologies can benefit retailers wishing to promote their products to potential buyers passing by ;
• MMS and streaming mobile video are opening up more person-to-person services and customized entertainment30.
Therefore, these new technologies, enabling the mobility of individuals, businesses and civil workers everywhere and anytime, will unavoidably impact on the shape and direction of the future information society.
30 ITU. Shaping the Future Mobile Information Society: The Case of the United Kingdom and Norway, February 2004.
Internet development: Current state of critical Internet resources in the UNECE region 37
Box 3. In Moldova, users are turning to WAP and mobile Internet access
In the first quarter of 2006 the number of mobile telephony users in Moldova grew by 44.5 thousand and is now one million 134 thousand. As a result, the mobile penetration rate per 100 residents increased to 33.5 per cent, as shown in a Report of the National Regulatory Agency in Telecommunications and Informatics on the evolution of this market segment.
In the same period JSC VOXTEL connected 30.5 thousand subscribers to its network, while JSC MOLDCELL – 10 thousand. According to the number of subscribers, the market share of VOXTEL was 60.82 per cent, and MOLDCELL – 39.18 per cent. According to the statistical reports submitted to the Agency by the two mobile operators, at the beginning of April 2006 the number of subscribers to WAP (Wireless Access Protocol) access services and mobile access to the INTERNET reached 222.5 thousand, of which 154.2 thousand are VOXTEL subscribers and 68.3 thousand - MOLDCELL.
The Agency experts consider that this evolution confirms the fact that mobile telephony operators realize the advantages of the services mentioned above and use them more and more often to access the INTERNET over a mobile phone. The multiplication in the number of mobile offerings, they expect, in particular WAP access and mobile access to the INTERNET will become the main development trends on this market in 2006.
WAP access service offers the possibility to access the INTERNET by means of a mobile phone on basis of GPRS and EDGE technologies. The service of mobile access to the INTERNET allows accessing the INTERNET by means of a mobile phone and a computer. MOLDCELL launched these services in January, and VOXTEL in September 2005.
Source: ANRTI Press Service. 18 May 2006.
2.1.3 Cable networks
Cable networks have been an important alternative to fixed lines in providing a modem access to Internet.31 New technologies, such as: broadband, digital and wireless, have enabled cable providers to diversify and enhance their services, including data transmission.32 As a result, total number of cable modem subscribers in 27 EU Member States increased from 3.8 million to 10.2 million.33 The average cable modem coverage grew from 23 per cent in 2002 to 35 per cent of inhabitants in 2005, and the average penetration rate – from 1.2 per cent to 2.8 per cent, respectively. The highest cable penetration rate in the EU in 2005 was in the Netherlands (9.6%) followed by Denmark (8.6) and Belgium (6.8%). In Eastern and Central Europe, Estonia (3.7% penetration rate) and Slovenia (3.2%) were ahead of the rest of the countries of the subregion in terms of penetration. However, in terms of coverage, Hungary had a rate of more than 66 per cent in 2005, and Lithuania and Estonia had respective rates of 54 per cent and 53 per cent (table 24). In the CIS, according to available information, in 2005 the cable penetration rate was the highest in Moldova followed by Ukraine. At present, the cable network subsector is undergoing a digital revolution led by the United Kingdom, Norway, Ireland and Sweden (table 10 and box 4). About 20 per cent of EU homes now have digital TV,
31 A cable modem is a type of modem that provides access to a data signal sent over the cable television infrastructure. Cable modems are primarily used to deliver broadband Internet access, taking advantage of unused bandwidth on a cable television network. 32 The proliferation of cable modems, along with DSL technology, has enabled broadband Internet access. 33 IDATA. Broadband Coverage in Europe. Final Report. 2006 Survey.
38 Towards a knowledge-based economy – Europe and Central Asia: Internet development and governnance
including 11 per cent in Germany and 57 per cent in Britain, while 24 per cent have broadband Internet, including 23 per cent in Britain and 44 per cent in the Netherlands.34
In 2006, the leading cable providers in the EU were German companies, Kabel Deutschland and Unity Media, with a total number of TV subscribers of more than 14 million. The top Internet Protocol Television (IPTV) providers in Europe were: France Télécom, Telefónica, Free, Neuf Télécom, Fastweb, Belgacom and Tiscali UK. Their combined number of TV subscribers was almost 2 million at the end of 2006.35
Table 10. Top 10 digital TV European countries, 2006
Ranking Country
Digital TV Penetration Rate
June 2006 ( %)
1 United Kingdom 70 2 Norway 53 3 Ireland 52 4 Sweden 51 5 Finland 49 6 Italy 43 7 France 41 8 Spain 33 9 Germany 28 10 Austria 22
34 See http://technology.guardian.co.uk/. 35 Source: e-Media Institute 2006.
Box 4. European digital TV to soar Demand for digital television in Europe will reach a record number of customers this year, according to research from Strategy Analytics and its Broadband Media and Communications service. Nearly 19 million homes will buy digital TV for the first time this year, an increase of 20 per cent, according to the report, "Digital TV Subscriber Market Forecast Europe”. The most popular option for new subscribers is still digital terrestrial television, with more than 10 million homes that could be added this year, the company said. However, the newest entrant, IPTV, also is beginning to make inroads and take a share from established satellite TV and cable providers. The Strategy Analytics report predicts 16 million homes will subscribe to IPTV by 2010. The report also predicts 75 million European homes, or 47 percent of the total, will have at least one digital television service by the end of the year, a third higher than last year. By 2010, digital TV penetration will have reached 77 percent, or 127 million homes, says Strategy Analytics. The United Kingdom, with 94 percent penetration, will remain Europe's leading digital TV market in 2010, with Ireland, Austria and Sweden next in line. Digital terrestrial TV will overtake satellite to become Europe's largest digital TV platform by 2008, says the firm. Source: Strategy & Analytics. 16 October 2006.
Internet development: Current state of critical Internet resources in the UNECE region 39
2.1.4 Wireless networks
Wireless networks have been proliferating at the highest speed in the UNECE region, especially in some of the CIS countries (boxes 5 and 6) where the fixed line teledensity is lower than in other subregions of UNECE. At present, the wireless networks are mainly represented by: satellite telecommunications systems, Wi-Fi and WiMAX.36 Satellite communications have not been widely used in Europe and the CIS to provide Internet access services for a number of economic and technical reasons. Firstly, in most European countries mainland alternatives are cheaper and more readily available. Secondly, terrestrial alternatives are generally more powerful and reliable. This situation seems to be slowly changing driven by political commitments to provide a high-speed access to Internet for all, targeting the households and businesses located in remote and/or underdeveloped areas. In the EU, one of the major satellite service providers is Europe Online (owned by Europe Online Investments S.A.), which since 1999 is also one of the world’s first and largest broadband Internet via satellite operators. Europe Online has been using the ASTRA satellite system to provide “Direct-to-Home” satellite television to European households since the 1980s. Since 2003, Europe Online has begun operating the Eutelsat satellite system, which allowed for widening its geographic coverage and, bringing its services to Eastern and Southern Europe, Turkey, North Africa and the Middle East.37
Box 5. Wireless broadband is the next big thing in the Russian Federation The IKS Consulting analytical and market research agency reports that the 61 per cent growth rate achieved by the Russian wireless broadband market in the first half of 2006 will most likely remain constant in the second quarter of 2006. The market size is estimated at $33 million, representing approximately a 5 per cent share of the total Russian Internet market, and about an 8 per cent share of the domestic broadband market. It is expected that the current growth trend will continue and that the market will grow to $80 million by the end of 2006, thus accounting for a 6 per cent share of the Russian total Internet market size. The wireless broadband networks are concentrated in the greater regions of Moscow and St. Petersburg. Most of the existing broadband networks (about 220) are built on Radio Ethernet (IEEE 802.11), but from now on, the networks will be built on WiMAX. The number of Internet users directly connected to broadband networks grew by eight thousand in the second quarter of 2006 to reach 35,000 in total. Source: C*News, 31 August 2006. In 2004, Europe Online was granted the European Patent for “Integrated High-Speed Terrestrial and Satellite Communications Systems for Internet and Other Uses”. (The patent had first been applied for on 8 April 1999. The invention related to systems and methods for managing the delivery of a plurality of types of data content to data users, and more particularly, to systems and methods for managing the allocation of bandwidth resources for the transmission and delivery via a satellite telecommunications network. The key objectives of this invention were to:
36 Wi-Fi (wireless fidelity) is a technology enabling a PC, laptop and/or cell phone to access the Internet; WiMAX is another enabling technology, which could provide a high-speed broadband Internet connection to home, corporate and roaming users over wireless connection. Both technologies can be bridged and routed with the wired or wireless LAN. 37 See www.europeonline.net.
40 Towards a knowledge-based economy – Europe and Central Asia: Internet development and governnance
• Provide systems and methods that take advantage of the broadband resources available in satellite telecommunication network systems to deliver Internet Protocol (IP) data content to data users at rates of speed that may not be available in traditional terrestrially-based Internet communication networks;
• Provide systems and methods that are able to deliver non- IP data content, such as films and video on demand as well as MPEG streams of audio or video digital content;
• Provide systems and methods that take advantage of the multicasting capabilities of satellite communication network systems to be able to simultaneously deliver data content to a multitude of data users with a single transmission of data content;
• Take further advantage of the multicasting capabilities of satellite telecommunication networks, methods for queuing the delivery of digital data content to data users;
• Provide an integrated communications system manager, bi-directional control and signaling capability interconnecting a plurality of diverse bandwidth-originating communications networks, an integrated high-speed data content manager and a distribution network, in order to facilitate the delivery of a plurality of types of data.38
Europe Online has become one of the largest Satellite Internet/Multimedia networks in the world. Its user base for E-DSL Broadband Internet via satellite and service complete with video on demand, MP3, games, software and films was estimated at 60,000 in 2003.39 Satellite communication services in the CIS have been provided by NTV+ (Russia), Armentel (Armenia), Kazakhtelecom and Nursat (Kazakhstan), Egrisi (Georgia), Lucky Link and Thuraya (Ukraine), Delta Telecom, Aztelekom and AzEuroTel (Azerbaijan). In Belarus, Beltelecom and Intersputnik recently conducted negotiations on the establishment of a joint stock company which could provide modern multimedia satellite communication services in the country.40 Apart from its own satellite systems, the Intersputnik has more than 150 ground base stations for long-distance communications and more than 1500 ground base stations in VSAT and television distribution networks. In Russia and Kazakhstan, whose large territories pose a challenge in terms of teledensity, satellite telecommunication services have been regarded as one of the key means of meeting this challenge. Therefore, both countries have been keen to cooperate and advance satellite telecommunication technologies. In 2006, Kazakhstan launched its own satellite lowering the costs of satellite telecommunication services. Wireless networks Wi-Fi and WiMAX have been playing an increasingly important role in the countries or regions experiencing a deficit of basic terrestrial ICT infrastructure, and/or where economic costs of extending fixed lines are too high due to the remoteness or sparse population. In most instances, however, they have been used to fill the connection gap bridging local networks. In Europe, Wi-Fi services have been provided by the fixed line operators, alternative fixed line operators and/or mobile operators. The top three broadband providers in France, France Telecom (now known as Orange), IPO candidate Neuf Cegetel and Iliad have started rolling out services that allow cellular phone customers to use mobile and Wi-Fi networks with the same handset. Such efforts have turned France into one of the world's most advanced markets for dual-mode Wi-Fi mobile services, which could profoundly change operators' business models in the months to come.
38 Europe Online Investments, S.A., The RTL Center. (See http://www.europeonline.com/en/company/press_releases/anniversary.shtml). 39 See http://www.europeonline.com. 40 Intersputnik provides services to telecommunication operators and corporate clients using LM-1 (Lockheed), Express-A and Express-AM (Russia) satellites. It also manages the marketing and provision of Eutelsat satellite telecommunication system services (23 satellites) and Gazkom system (Jamal-200 satellites) services (source: www.interspitnik.com).
Internet development: Current state of critical Internet resources in the UNECE region 41
France has also become one of the least expensive places in Europe for high-speed Internet. Paris is one the capitals with the most Wi-Fi hotspots in cafes, airports, train stations and homes. While some Wi-Fi hotspots are free, others charge or can only be used by members of Wi-Fi sharing communities. Wi-Fi hotspot approaches are to be found in many networks and some of the more recent include a network in Turku, Finland. Extending over a broad continuum are variants on a Wi-Fi mesh model. Networks such as United Kingdom-based Telabria use these, as does BT with its 5-city trial and "The Cloud," a city network planned for 10 cities in the United Kingdom (box 7). AWA of Spain also uses mesh Wi-Fi technology. Many countries in Western Europe (Germany, Italy, Spain, Finland among
Box 6. Closing the territorial digital divide: Satellite telephony in the Russian Federation
Aimed at solving the problem of digital deficiency, FSUE Russian Post arranges the service using satellite technologies in localities lacking a telephone communications system. In July 2004, within the framework of pilot project, 100 call offices for long-distance communication based on satellite terminals of the Russian operator Globalstar - JSC “GlobalTel” - were opened at post offices. Call offices were created in difficult-to-access localities lacking telephone communication. Presently the telephone services are provided in 36 regions of Russia covering all the federal districts. In 2005, the number of call offices exceeded 300. The majority of public call offices included Siberian and Far East federal districts. The success of the project proved that the services were popular in the regions, thus by the end of 2006 the number of public call offices was increased to 500. CJSC “GlobalTel” is an exclusive provider of the global mobile satellite communications system Globalstar in Russia. CJSC “Rostelecom” and Globalstar L.P. are the founders of the company. In May 1997, Globalstar L.P. and CJSC “GlobalTel” signed an Agreement providing that CJSC “GlobalTel” has exclusive rights to grant Globalstar services within the territory of Russia. Since November 2000, full commercial exploitation of the Globalstar system was put into practice in the whole territory of the Russian Federation and a number of CIS countries. Presently Globalstar serves over 21 thousand subscribers. In 2004, within the framework of the “Program on the Provision of Telephone Communication to the Underpopulated Localities by Installing the Universal Call Boxes in Post Office of the North-West Federal District” approved by the Ministry of Information Technologies and Communications of the Russian Federation, JSC “National Call Boxes Net” set up 800 universal call boxes at post offices in the Siberian and Far-East federal districts. In the first half of 2005, inter-regional companies of JSC «Sviazinvest» upgraded over 3400 call boxes in the post offices of the FSUE Russian Post. JSC “National Coin-box Net” (NCN) was established in 2000 to modernize the call box industry in Russia and grant people high-quality profitable call box services based on a single card. To expand the range of the provided services, FSUE Russian Post implemented a project to create a multi-service satellite network. Within the framework of the project, a contract with the manufacturer of satellite equipment Gilat Satellite Networks Ltd. was contracted to supply and install over 500 small ground-based stations in the Siberian and Far-East Federal Districts. The implementation of this communication system will provide the most advanced high-level telecommunications, financial, banking and insurance services at the remotest post offices. Source: http://www.russianpost.ru/portal/en/home/public/telephony.
42 Towards a knowledge-based economy – Europe and Central Asia: Internet development and governnance
others) adopted or are about to adopt the dual-mode technology. The German Deutsche Telekom's fixed-line unit T-Com, for example, introduced a dual-mode Wi-Fi mobile phone service early 2007.
Box 7. A major new initiative to bring wireless Internet access to Britain’s city centres The Cloud announced a major initiative to deploy widespread wireless broadband networks in city centers throughout the United Kingdom. The plan to have “clouds” of wireless broadband internet access over the United Kingdom's major centers of population will begin with nine city centre areas. This is the first major initiative to bring coverage to multiple cities simultaneously since mobile phone networks were built in the early 1990s and will allow more than four million people to connect to the Internet without wires. The first phase was to be completed by March 2006. Hundreds of Wi-Fi hot zones were rolled out in the city centres of Edinburgh, Leeds, Manchester, Birmingham, Nottingham, Oxford, Cambridge, Liverpool and the three London Boroughs of Kensington and Chelsea, Camden and Islington. More cities will follow. Each Wi-Fi hot zone turns broadband-speed internet into radio signals which can then be accessed by laptops, PDAs, handheld games consoles and Wi-Fi-enabled mobile phones to allow quick and easy Internet access. This means in these city centres it is possible to access the Internet wherever you are by simply turning on your device and logging on. People are able to send e-mails, surf the Internet, access work networks, play games online and make cheap phone calls over Wi-Fi and more from wherever they are within the city centre. The Cloud's networks are open to any service provider who would like to provide advanced wireless services to their customers. In some countries city networks have been built by a single service provider, who then has a monopoly on the provision of Wi-Fi. The Cloud's wholesale network approach means this will not happen. The new city networks will immediately be available to people using BT Openzone, O2, SkypeZones and Nintendo Wi-Fi. The networks can also be quickly available to other companies such as T-Mobile, NTL/Virgin, BSkyB/EasyNet, TalkTalk, Sony, Vonage, iPass and other ISPs and network operators who may want to offer services to government, consumers and business customers. The Cloud is no stranger to creating large metro Wi-Fi zones, having executed a similar programme in Canary Wharf in London to make it Europe's largest Wi-Fi-enabled financial area. In addition, the company has Wi-Fi-enabled Old Trafford, Royal Festival Hall and the British Library, as well as numerous airports, railway stations, hotels, coffee shops, pubs and restaurants. Source: http://www.thecloud.net/.
A growing trend, according to some analysts, has been the promotion of Wi-Fi by non-telecom operators, especially in Eastern and Central Europe.41 The city council of Prague, for example, offers users a 12-hour Wi-Fi access for free through a pilot Wi-Fi network. As a result of efforts by various social agents to ensure an affordable access to Internet for as many citizens as possible, Europe became a leader in establishing public Wi-Fi hotspots (table 11). According to some estimates, at present there are about 57 thousand hotspots throughout Europe.42
41 Budde Paul. Europe (Eastern) Telecoms, Mobile & Broadband Overview and Analysis 2006-2007. (www.budde.com.au). 42 See http://www.telecom.compulenta.ru/ and www.iwireless.ru/news/.
Internet development: Current state of critical Internet resources in the UNECE region 43
Table 11. Wi-Fi hotspot world leaders, the beginning of 2006
Country Total number of Wi-Fi Hotspots
United States 37073 United Kingdom 12668 South Korea 9415 Germany 8614 Japan 5951 France 3886 Italy 1767 Netherlands 1703 Canada 1397 Switzerland 1295
Source: JiWire, 2006. In the CIS, wireless technologies are gaining momentum. A number of large Wi-Fi network projects are currently under way in the Russian Federation and other CIS countries. In the Russian Federation, there are already 1000 Radio-Ethernet systems in operation. More than 200 ICT providers in 126 Russian cities have been involved in developing wireless networks based on this technology. Three wireless networks are already been deployed in Moscow. Large wireless networks have been established in Yekaterinburg, Surgut, Tyumen, and Krasnodar. The networks in Novosibirsk, Samara, Irkutsk, Kurgan and Rostov are already functioning. Radio-Ethernet has been used in Ukraine, Belarus, Kazakhstan, Moldova, Georgia, Armenia and Uzbekistan. In Armenia, about five per cent of the connections are wireless. In Georgia, a Wi-Fi network was established in Tbilisi. There are already 285 Wi-Fi hotspots in Moscow, mostly at hotels. Another 400 hotspots will be added in the nearest future. In Belarus, there were ten public Wi-Fi spots, mostly in Minsk, in mid-2005. In August 2007, Golden Telecom Incorporated, the leading provider of integrated telecommunications and Internet services in the largest population areas throughout the Russian Federation and other CIS countries, announced that it had signed an agreement to provide Wi-Fi equipment and services to McDonald's company. In accordance with the agreement, Golden Telecom will provide the chain of Russia’s McDonald's restaurants with Golden Wi-Fi services. The Wi-Fi Internet access will be available to all the restaurants visitors in Russia. McDonald's now operates 175 restaurants in Moscow, the Moscow region, St. Petersburg, Nizhny Novgorod, Yaroslavl, Samara, Kazan, Voronezh, Volgograd, Krasnodar, Sochi, Nizhnekamsk, Almetievsk, Saratov, Rostov-on-Don, Ufa and Orenburg.43 Wi-Fi technology has been challenged by WiMAX in the CIS. This technology could be employed by both fixed line and mobile telephony providers, but it also can be used for setting up an independent WiMAX network. This distinct characteristic makes the technology especially attractive in the countries like Russia and Kazakhstan. WiMAX networks, which are currently being deployed in the Russian Federation, aim at providing broadband Internet access rather than mobile Internet access. Summa Telecom, the Russian company holding the sole nationwide license for WiMAX, plans to invest almost $1 billion to develop WiMAX networks in 330 cities of Russia by 2010. In 2007, the company intends to deploy WiMAX networks in six to seven cities.44
43 See http://www.goldentelecom.com. 44 See http://www.cnews.ru, 27 July 2007.
44 Towards a knowledge-based economy – Europe and Central Asia: Internet development and governnance
2.2. Connectivity
Differences in the physical Internet backbone infrastructure coupled with differences in per capita income between and within the UNECE Member States have been translated into disparities in terms of connection to and usage of the Internet. Connection to the Internet in the UNECE region has been provided by different platforms. Available ITU data suggest that the most widespread type of access to the Internet in the EU Member States has been a wired access and, first of all, an Internet access via DSL (tables 25 and 26). In 2005, in the 26 countries presented in table 25, there were more than 48 million DSL and 10 million cable modem Internet subscribers. More than 16 million in 23 EU Member States were dial-up subscribers (table 26). In the CIS, the situation has been similar to that in the EU. For example, in Moldova, dial up Internet access subscribers constituted 83 per cent of the total number of Internet subscribers, while cable Internet access subscribers – 5.4 per cent and DSL Internet access subscribers - 11.1 per cent in 2005. In Russia, the total number of dial up Internet subscribers was 11 million by 2005, cable Internet access subscribers – 1.2 million and DSL – only 0.5 million.45 In Armenia, about 60 thousand households were connected to Internet (mainly via dial-up and cable modem). The CIS and Eastern and Central European subregions have been lagging behind the most advanced countries of the EU in terms of Internet connection, including broadband, although the situation has been rapidly changing due to national efforts and foreign capital penetration. In 2005, the average DSL Internet access penetration rate in Central and Eastern European countries was four per cent of the population, while in the Western European countries, 12 per cent with Iceland having almost 26 per cent penetration rate and Finland, 10 per cent (figure 16 and table 27). Apart from DSL providers, other operators also supply broadband access to Internet, including via cable modem, Wi-Fi and/or WiMAX. On the whole, the total number of subscribers to broadband has been growing at amazing speed, especially in Central and Eastern European countries and in some of the CIS (figure 16 and table 28). In Latvia and Lithuania, for example, the total number of broadband Internet subscribers increased, respectively, by 800 per cent and 1070 per cent between 2002 and 2005. Over the same period, in the Russian Federation, the total number of broadband Internet subscribers grew by 144 times, reaching the penetration rate of 3.5 per cent of the total number of households in 2006.46 But the broadband Internet access remains extremely uneven in the Russian Federation. Access is concentrated in large cities, mainly in Moscow and Saint Petersburg. According to estimates made by J'son & Partners and iKS-Consulting, the total number of the broadband Internet users in Moscow had grown to 1.01 to 1.1 million people (or 60% of the Moscow households and almost 50% of the total broadband Internet users of the country) in 2006.47 In Azerbaijan, Belarus, Kazakhstan and Kyrgyzstan, the total number of broadband Internet subscribers has also grown very fast, increasing by 200 times in each country between 2002 and 2005 (table 28). In Georgia, connection to the Internet has been provided from different platforms: cable, satellite, dial-up, Wi-Fi and WiMAX and ADSL. Two companies, Telenet and ICN (the Caucasus Network), dominate the Internet services market (60%) in the country, including the provision of broadband Internet access. Despite a comparatively favorable situation (to other CIS countries) in terms of the basic ICT infrastructure availability, low per capita income constitutes an important barrier to Internet penetration in
45 ITU database. 46 Some analysts suggest that their total number may increase up to 10 millions by the year 2010. (source: CNews. Broadband access: a new locomotive?) (See www.cnews.ru). 47 CNews. (Broadband access: a new locomotive?) (See www.cnews.ru).
Internet development: Current state of critical Internet resources in the UNECE region 45
Figure 16. Broadband (DSL) connection to Internet in selected Central and Eastern European countries, 2005
Source: IDATE. Development of Broadband Access in Europe, November 2006. Georgia, where it remains at four per cent (in terms of the Internet usage). One of the solutions to this problem has been the creation of public Internet access places. With financial assistance from international donors, 12 PIAPs were constructed in Tbilisi, Kutaisi, Batumi, Gori, Poti and some other cities.48 The impressive growth of the broadband Internet subscription in the UNECE region hides, however, the sharp unevenness of the broadband Internet penetration throughout the region. Secondly, the gap between and within subregions in terms of household connection to the Internet and PC penetration remains significant (tables 12 and 13). Thirdly, the growth and penetration rate of Internet usage has surpassed that of Internet subscription in all the subregions (table 29). This discrepancy suggests that a significant proportion of the Internet users have been accessing the World Wide Web from other places rather than home. Some researchers also noted that extremely high costs of the Internet connection and services (in terms of per capita income or average monthly wage) in some CIS and Eastern and Central European countries has been hindering the Internet subscription and usage growth. Thus, for example, in Kazakhstan, the unlimited dial-up Internet connection package offered by Kazakhtelecom cost about €86 per month, the unlimited ADSL connection – from €102.45 (at 64 Kbps) to €3278.57 (at 2048 Kbps) per month, and the unlimited cable Internet connection – from €9,163.09 (at 3 Mbps) to €24,432 (at 10 Mbps) per month. Taking into consideration that the average monthly salary in Kazakhstan was 292 euros (as of January 2007), it is not surprising that most of Internet users have been accessing the Internet at their workplaces.49
48 Political Intelligence. Final Report: Monitoring of Russia and Ukraine (priority 1) and Armenia, Azerbaijan, Belarus, Georgia, Kazakhstan and Moldova (priority 2): Telecommunication and the Information Society, London-Brussels-Madrid, 2006, pp. 23-24. 49 Governing the Internet: Freedom and Regulation in the OSCE Region, Vienna, 2007, pp. 119-131.
Figure 40. Selected Central and Eastern European co untries: broadband (DSL) connection to Internet, 2005
0
200
400
600
800
1000
1200
1400
Czech
Rep.
Estonia
Hunga
ry
Latvi
a
Lithu
a nia
Poland
Slovak
ia
Sloven
ia
0
1
2
3
4
5
6
7
8
9
DSL subscribers(Thousands)DSL penetration rate (%of the population)
46 Towards a knowledge-based economy – Europe and Central Asia: Internet development and governnance
Table 12. Percentage of homes connected to Internet, 2000-2006
Source: ITU database and EUROSTAT Press release, Internet Usage in the EU25, 10 November 2006, STAT/06/146. Data reproduced with the kind permission of ITU.
With regards to the Internet connection of the business community, a recent review of ten business sectors (food and beverages, telecommunications, hospitals, construction, shipbuilding, tourism, pulp and paper, footware, consumer electronics, ICT manufacturing) in 10 EU Member States (Czech Republic, Finland, France, Germany, Hungary, Italy, the Netherlands, Poland, Spain and the United Kingdom) found that nearly all companies (93%) which used computers and had at least ten employees were connected to the Internet.50 The companies with the Internet connection had been using mainly a broadband access to Internet (about 70% of the surveyed firms) via DSL or some other technologies (cable, direct fibre or wireless broadband). Significant differences in the use of ICT and Internet among the surveyed enterprises and across the sectors were also observed. Thus, the Internet penetration rate was found to be the highest among enterprises with more than 250 employees (99%) and the lowest among the micro-enterprises with one to nine employees (89%). Among the business sectors, shipbuilding and telecommunications were the leaders in terms of broadband Internet access, with respective rates 100 per cent and 99 per cent. In the
50 The European e-Business Report, 2006/2007 edition, EU publication, Bonn, January 2007.
Internet development: Current state of critical Internet resources in the UNECE region 47
traditional sectors like footware and food and beverages, where small firms prevail, Internet use was relatively low, as only 20 to 30 per cent of the workers needed Internet access to perform their tasks.51
Table 13. PC penetration rate: PCs per 100 inhabitants, 1990-2005
Source: ITU database. Data reproduced with the kind permission of ITU. Analogous patterns were observed in the use of internal computer networks. The use of ICT to connect computers internally to a company network (LAN or Wireless LAN) varied with the size of the firm. At the same time, the use of LAN was rather widespread. As far as the Wireless LAN is concerned, it was mainly used within the Telecommunications and ICT manufacturing sectors, respectively, 44 per cent and 34 per cent of the surveyed firms. The use of other advanced technologies, such as: VoIP (Voice-over-IP) or VNP for remote access was mainly concentrated in two sectors: telecommunications and consumer electronics.
Table 14. Enterprises with broadband Internet access in the EU 10
Small firms Large firms
Total (small firms) 75 84 Food and beverages 62 83 Footware 73 91 Pulp and paper 77 86 ICT manufacturing 86 83 Consumer electronics 81 100 Shipbuilding 82 Construction 73 87 Tourism 82 75 Telecoms 87 79 Hospitals 71 86 Czech Republic 61 77 Germany 76 81 Spain 83 93 France 84 91 Italy 76 94 Hungary 66 96 Netherlands 76 70 Poland 76 90 Finland 83 100
United Kingdom 72 75
Source: The European e-Business Report, 2006/07 edition, EU publication, Bonn, January 2007.
These differences in the use of Internet, LAN and other connecting technologies among the enterprises become even more pronounced when a geographical location is added. Thus, in Hungary and the Czech Republic, the percentage of small firms with an Internet access was lower than the EU 10 average, while the percentage of large companies with an access to Internet was close to the EU 10 average in the Czech Republic and bigger than the EU 10 average in Hungary (table 14). The surveyed companies in the EU 10 had been increasingly conducting their business operations online. More than 10 per cent of the total orders to suppliers were placed online by 15 per cent of the small
Internet development: Current state of critical Internet resources in the UNECE region 49
companies and by 32 per cent of the large firms. Respectively, 11 per cent of the small companies and 11 per cent of the large companies received more than 10 per cent of orders from customers online. Eight percent of the small companies and 21 per cent of the large ones had their ICT system linked with suppliers.52 The available data on CIS countries imply that prevailing trends in the usage of the Internet and ICT in general by businesses are identical to those in the EU business sector; although the penetration rate of the Internet and ICT is lower on the average. Thus, in Moldova 64.9 per cent of all companies used computers in their operations and 35 per cent planned to purchase ICT equipment. Of all the companies with computers, 76.5 per cent used local networks and 29.4 per cent used teleworking services via the Internet.53
Figure 17. Internet usage in the UNECE region, 2007
Source: http://www.internetworldstats.com/. In the Russian Federation, according to some studies, companies in key production and services sectors are in the process of modernizing their own ICT infrastructure and/or developing their own corporate telecommunication networks. Almost half of the total expenditure on ICT of the Russian businesses, or about $2.5 billions, was invested in telecommunications (equipment and services) in 2005. Some industrial holdings and public transportation companies like Gazprom and the Russian Railways, for example, successfully upgraded their ICT infrastructure and became significant providers of ICT services to other businesses through their own operators. Gazprom set up Gazcom to provide ICT services to their holding partners. The Russian Railways set up TransTeleCom to meet the communication needs of railway transportation (box 8).
52 Ibid. 53 Political Intelligence. Final Report: Monitoring of Russia and Ukraine (priority 1) and Armenia, Azerbaijan, Belarus, Georgia, Kazakhstan and Moldova (priority 2): Telecommunication and the Information Society, London-Brussels-Madrid, 2006.
Figure 43. Internet usage in the UNECE region, 2007
Internet users (thousands) Internet usage penetration rate (% of population)
50 Towards a knowledge-based economy – Europe and Central Asia: Internet development and governnance
Box 8. TransTeleCom fibre-optic network in the Russian Federation Fibre-optic lines of the TransTeleCom fibre-optic network run along all the mainline railways, which are over 50,000 km in length, cover all the densely populated areas of the Russian territory and link up western and eastern parts of the country. The Backbone Digital Network has over 900 resource allocation points in 71 regions of the country which account for 90 per cent of the population and accommodate all the main production facilities of the Russian Federation. The high reliability of the network is ensured by the reservation of fibre-optic communication lines for geographically spread routs and by the efficient operation system for line-cable structures. Connection points with the networks of foreign operators (Finland, the Baltic States, Poland, Ukraine, Kazakhstan, Mongolia and China) create an effective environment for the exchange of international operators’ traffic. These services are rendered by the TransTeleCom Company network comprised of the Backbone Digital Communications Network of the Russian Railways built up and operated by TransTeleCom, as well as MPLS IP network based on BDCN resources, the ATM network, and access networks all integrated into one interlinked multiservice network system. SDH technology (Synchronous Digital Hierarchy) has been chosen as the basis for installing the backbone primary network; it ensures the required scalability (2 – 10,000 Mbps) both in terms of capacity and zone coverage and enables the most effective operation of optical channels. The network uses SDH multiplexers provided predominantly by Lucent Technologies; they are capable of multiplexing the standard PDH and SDH signals to 2.5 Gbps level (STM-16). A wide range of covered distances, high capacity and connection flexibility make the SDH equipment the key component of effective and economical backbone networks. The combination of the equipment used with the SDH technology increases the primary traffic network reliability by integrating its units into ring configurations, which allows the network control system automatically to switch from a main channel to an alternate channel in case of deviations of the main channel quality parameters from the standard. Switching the channel in the network takes no more than 50 ms which means no interruption for the user. Currently TranTeleCom is in the process of implementing Dense Wavelength Data Multiplexing (DWDM) technology into its network. Due to that improvement, in the near future the network capacity will grow from 2.5 Gbps to 40 Gbps.
However with the further traffic growth, the capacity may be increased up to 400 Gbps. MPLS IP Network The multiservice MPLS IP network built by TransTeleCom on the basis of its BDN, with its nodes spread throughout the Russian Federation, is this country’s first MPLS network boasting such territorial span and capacity. The MPLS (Multiprotocol Label Switching) IP-network based on the promising state-of-the-art technology, has a two-level hierarchical architecture, which includes the core of MPL-switching of IP-traffic, and the
border layer responsible for serving subscribers. The latter is often referred to as the network’s “intellect.” The IP network uses the channels of the primary STM-1 network as the main transport environment, with the prospect of developing them to the level of STM-4 and STM-16. The IP network core includes highly productive switching routers supplied by Cisco Systems. The border layer also uses Circo Systems routers, which ensure the aggregation of subscriber traffic, and Fast Ethernet switchboards responsible for the integration of the node’s infrastructure and the connection of subscriber equipment. The IP network also includes a devices-and-services management system, and a set of servers ensuring traditional Internet services such as DNS, SMTP, and WWW. The MPLS IP network lays the foundation for the most important services offered by TransTeleCom, primarily IP VPN, access to the Internet. The modern MPLS IP infrastructure is the basis for multi-service operator and corporate networks, facilitating infocommunications services and integrating telecommunications and information services.
Internet development: Current state of critical Internet resources in the UNECE region 51
The MPLS IP network expansion and development of innovative services on its basis is the company’s priority. Asynchronous Transfer Mode (ATM)-based Network The multiservice ATM-switched network is built on top of SDH digital paths and is based on a packet-oriented asynchronous transfer mode in accordance with the hierarchical principle. Two levels are distinguished within its architecture – the backbone level (the network’s core) and the access level. The core includes backbone switches supplied by Lucent Technologies, which are connected by SDH network channels of the STM-1 level. Client access is ensured by concentrators connected to the backbone network core by STM-1 digital paths. The access concentrators allow for the use of the following connection interfaces: STM-1 chan, STM-1 ATM, A3, E1, serial, and Fast Ethernet. To provide the clients with the ATM network access even in the nodes with no ATM equipment in place, dedicated channels of the primary network are used. The technology used makes it possible to build a multiservice packet network capable of voice, video and data transmission, and ensures excellent quality management tools. The dynamic distribution of the communication channels’ capacity, characteristic of the ATM, and different classes of data streams servicing (QoS) available, improves the network’s cost-effectiveness by optimizing its channels’ employment. Access Networks To attract a broader scope of users in remote regions as well as those close to the TransTeleCom BDN, we build access networks to the trunk network. These networks are a necessary addition to the company’s trunk networks, as they help develop and provide a whole range of communications products and services. Access networks will help us provide our services in places of greater concentration of potential users, and to expand the zone covered by the Backbone Digital Network. The access networks are based on access nodes, through which end users are connected; the nodes are also responsible for traffic concentration and routing and delivering it to the end users. The nodes can be either combined with the trunk network ones, or deployed separately. There are plans to build access nodes of two types:
Territorial nodes are deployed in cities and towns. Remote access nodes are built in places of higher concentration of users, inside a big city or in small towns, in order to directly connect specific customer premise equipment to a territorial node, that is, to extend the service channel to reach the customer. The DWDM Network of TransTeleCom The DWDM technology increases the capacity of fibre-optic backbones by hundreds of times. TransTeleCom began to implement the DWDM technology in all the main lines of the backbone. In the near future, the capacity of the network will grow considerably for the most popular telecommunication routes, which will allow TransTeleCom to completely satisfy the requirements of all clients. The construction of the DWDM network consists of three phases:
Phase 1 was finished in the early 2005 with the DWDM system installed on the 8700-km-long route through Kamennogorsk, Saint Petersburg, Moscow, Ekaterinburg, Novosibirsk, Irkutsk, and Zabaikalsk.
Phase 2 was finished on 1 July 2005. TransTeleCom started commercial exploitation of the line between Kamennogorsk (Leningrad region) and Karymsky (Chita region). Completion of this stage increased the DWDM network length to 12,700 km and provided redundancy for the most important routes.
Phase 3 was finished on 15 November 2005. This stage ensured the full redundancy of the DWDM network. Its total length reached 18,925 km.
TransTeleCom continuously develops the DWDM network:
In February 2006, the line between Moscow - Kursk - Voronej - Rostov-on-Don - Volgograd - Saratov - Syzran - Samara, so-called South Way, was put into work. The length of the new DWDM line reaches 3,500 km.
At present, TransTeleCom is developing a project to increase the network capacity in the Far East region. The project envisages the construction of the 2,200 km long DWDM line between BAM station and Vladivostok. Source: TransTeleCom (http://www.transtk.ru/www/nsf/netmap.nsf/eng!open).
52 Towards a knowledge-based economy – Europe and Central Asia: Internet development and governnance
Most active in the ICT infrastructure modernization have been heavy industry (in the energy, mining, metallurgical and chemical industrial sectors) and those in machinery and equipment production. A significant proportion of the Russian banks and insurance companies is connected to the Internet, and these entities have their own internal communication networks. Companies in food, lighting and pulp and paper industries are, however, less active in upgrading their ICT infrastructure. Practically all Russian telecoms offer a broadband Internet connection to corporate clients via either DSL or cable modem and, in some instances, satellite Internet access (for example, Gazcom offers an Internet access via satellite to their corporate clients). There were more than 50 million Internet hosts in the EU in 2006. In terms of total Internet hosts, Germany was ahead of the rest with almost 12 million. The Netherlands and the United Kingdom occupied respectively the second (8 million) and the third places (6 million).54 In Central and Eastern Europe, Czech Republic was the leader with more than 1.2 million Internet hosts (table 15). Among the CIS, Russia had the largest number of Internet hosts, almost 2 million. However, in terms of the penetration rate, it is far from being sufficient.
2.3. Interconnection
Two trends dominate the present development of the ICT sector in the UNECE region:
(1) A growing network interconnection;
(2) A convergence of different means of transmission of data and voice.
Both trends have been heavily intertwined as ICT producers, network operators and service providers have had to cope with growing competition, on the one hand, including from Asian NICs, and with the saturation of the domestic consumer electronics market. While technological advances and competition were among the key drivers of these development trends, the impact of public policies aiming at accelerating the convergence and transition of the economies into the information age should not be underestimated. In the EU, conscious liberalization, harmonization policies and policy actions targeting ICT markets have brought about noticeable benefits to all the stakeholders: ICT users, ICT manufacturers, network operators and service providers. These benefits include: reduction of barriers to market entry, harmonization of national regulatory frameworks, public support and encouragement of research and development in the area of ICT, launching and implementation of public projects (community-wide and/or national) that had a strong effect on the ICT market as a whole. On the supply side, regulatory changes and policies to promote network interconnection and, hence, production and application of technologies allowing for and improving interoperability between different devices and equipments installed within existing telecommunication networks, encouraged a convergence of markets and the emergence of new generation telecommunication networks and technologies. On the demand side, policies and programmes aiming at overcoming digital divides and gaps like: e-Education, e-Accessibility, e-Health, e-Governance, and others, provided incentives for electronic equipment producers, network operators and service providers to invest in upgrading and/or development of new products and services improvement.
54 CIA. The World Factbook, 2006 and 2007. (See http://www.cia.gov/library/publications/the-world-factbook/index.html).
Internet development: Current state of critical Internet resources in the UNECE region 53
Table 15. Internet hosting in Europe and Central Asia, 2005-2006
Country Total number of the Internet hosts, 2005
Total number of the Internet hosts, 2006
Austria 1,812,776 2,062,000 Albania 749 430 Armenia 8,852 8,163 Azerbaijan 460 880 Belarus 20,973 33,641 Belgium 2,238,900 2,871,000 Bosnia and Herzegovina 8,525 31,490 Bulgaria 95,539 184,975 Croatia 19,369 18,825 Czech Rep. 819,773 1,267,000 Cyprus 46,863 67,589 Denmark 2,110,002 2,416,000 Estonia 50,440 52,241 Finland 1,503,976 1,634,000 France 2,922,040 3,149,000 Georgia 8,942 10,752 Germany 7,657,162 11,859,000 Greece 414,724 587,717 Hungary 261,294 608,085 Iceland 190,140 212,897 Ireland 238,706 238,191 Israel 1,069,088 1,252,000 Italy 1,246,253 1,731,000 Kazakhstan 20,327 21,187 Kyrgyzstan 18,539 18,928 Latvia 53,251 65,858 Liechtenstein 7,491 4,697 Lithuania 136,346 148,675 Luxembourg 70,465 88,661 Malta 10,739 14,025 Moldova 30,861 58,886 Netherlands 6,781,729 8,363,000 Norway 1,342,667 1,364,000 Poland 366,898 358,476 Portugal 845,980 845,980 Romania 56,188 57,470 Russian Federation 1,306,427 1,980,000 San Marino 3,140 Slovakia 135,991 210,758 Slovenia 59,090 61,735 Spain 1,380,541 2,521,000 Sweden 2,701,456 2,958,000 Switzerland 1,823,012 2,443,000 The former Yugoslav Republic of Macedonia
3,541 3,716
Tajikistan 63 98 Turkmenistan 557 585 Turkey 753,394 1,313,000 Ukraine 167,501 229,110 United Kingdom 4,688,307 6,065,000 Uzbekistan 7,124 9,058,000 United States 195,138,696 195,139,000 Canada 3,525,392 3,934,000 European Union 22,000,414 (2004) 50,500,000
Source: CIA. The World Fact Book, 2006 and 2007.
54 Towards a knowledge-based economy – Europe and Central Asia: Internet development and governnance
The initial EU regulatory reform package introduced at the end of the 1980s was based on article 86 of the Treaty, which requires the removal of special or exclusive rights granted to national economic agents (in this case public telecoms) by Member States. In a series of directives the European Community specified measures to be implemented by the Member States in order to bring the ICT sector in compliance with the Treaty:
• Removal of special or exclusive rights to ensure that any operator is allowed to supply telecommunication services;
• Separation of regulator from incumbent to ensure that the historic regulatory functions of telecommunications organizations were removed and placed with independent regulatory bodies;
� Establishment of objective, non-discriminatory and transparent conditions for granting licenses and access to networks together with the right to appeal.55
The above directives have been complemented with a number of harmonization measures adopted under articles 95 (internal market), 47 and 55 (freedom to provide services). A compliance with these articles stipulates the upholding of the following principles:
• Open Network Provision (ONP), which implies that the conditions for access and use of publicly available networks and services are harmonized (in terms of standards for technical interfaces of networks) and ensure universal services; 56
• Significant Market Power (SMP) stipulates that operators with a market share of more than 25 per cent shall be subject to heavier regulation than other operators because of their market power;
• Fixed/Mobile. This principle calls for a differentiation in the level of regulation applicable to the fixed and mobile sectors taking into consideration that the mobile sector is subject to much more competition pressure than the fixed one. 57
The reforms of the telecommunications sector in the EU Member States were carried out in several stages, but the interconnection framework was among the first, providing new entrants to the market with an opportunity to concentrate on services by using the readily available public physical ICT infrastructure. In the absence of such a framework, there would be little incentive for incumbent operators to conclude interconnection agreements with new entrants or they would do so under the terms reflecting their market position. Directive 97/33/EC of the European Parliament and of the Council Interconnection in Telecommunications specifies that rights and obligations to negotiate interconnection fall on any organization providing public telecommunications networks and/or publicly available telecommunications services controlling access to customers. Therefore, they apply to:
• Organizations providing fixed and/or mobile public switched telecom networks or services where they control access to one or more network termination points to one or more unique numbers;
• Organizations providing leased lines to user’s premises;
• Organizations authorized in a member-sate to provide international telecoms circuits between the EU and third countries, for which they have specific and exclusive rights;
• Organizations providing telecommunications services which are permitted to interconnect under national licensing provisions (table 16).58
55 Commission Staff Working Document. Europe’s Liberalized Telecommunications Market – A Guide to the Rules of the Game, p. 7. (See http://europe.eu.int/comm/dg04/). 56 Council Directive 90/387/EEC of 28th June 1990 on the establishment of the Internal Market for telecommunications services through the implementation of Open Network Provision. Directive 97/51/EC of the European Parliament and of the Council of the October 1997 amending Council Directives 90/387/EEC and 92/44/EEC for the purpose of adaptation to a competitive environment in telecommunications Directive 90/387/EEC, 28 June 1990. 57 Commission Staff Working Document. Europe’s Liberalized Telecommunications Market – A Guide to the Rules of the Game, p. 8 (http://europe.eu.int/comm/dg04/). 58 Commission Staff Working Document. Europe’s Liberalized Telecommunications Market – A Guide to the Rules of the Game, p. 25 (http://europe.eu.int/comm/dg04/).
Internet development: Current state of critical Internet resources in the UNECE region 55
The implementation of the Interconnection Directive by the EU Member States had not been smooth due to a number of reasons. Firstly, interconnection is one of the most complicated areas to regulate due to technical challenges. There are a wide range of technical possibilities for interconnection and new types of interconnection products are being developed constantly. Secondly, even small changes in the terms for interconnections may lead to serious financial implications. Therefore, it is crucial that the terms for interconnection are specified in detail. The latter is especially important for small operators, which depend on access to incumbent operators’ network facilities. The above complexities have been one of the major reasons behind the reluctance of most regulators to directly interfere into interconnection arrangements. That is why, in most of the EU countries, interconnection agreements are commercial agreements between the operators. The regulation of interconnection mainly focuses on the definition of procedures for establishing interconnection agreements along the guidelines prepared by the regulator. However, the implementation of the Interconnection Directive together with a new licensing regime permitted a large-scale market entry of new operators. As a result, between 1999 and 2001 the value of telecommunications services in Europe increased by 24 per cent. The number of infrastructure-based fixed access operators grew by 42 per cent between August 2001 and August 2002. Prices charged by new entrants to the market were significantly lower than those of incumbent operators (up to 56% for national calls and 65% for international calls in some member countries). Competition in the retail mobile market brought monthly average consumer charges down by 23 per cent over the period 2000-2002.59
Table 16. Obligations under the EC Access and Interconnection Directive Type of operator Obligations
All operators offering publicly available telephone services and controlling access to end-users
• The right and obligation when requested by another operator to negotiate interconnection with each other
• Must provide sufficiently detailed financial information to NRA (National Regulatory Authority) on request, and submit financial reports to an independent audit
All operators with SMP • Meet all reasonable requests for access, including at point other than network termination points offered to majority of end-users
• Requirement to act in a non-discriminatory manner; make available all necessary information to organizations considering interconnection
• Make available interconnection agreements to NRAs who must make parts of them available to interested third parties
Mobile operators with SMP on national market for interconnection
• Offer cost-oriented interconnection; NRAs may require full justification and adjustment of charges if not satisfied
Fixed operators with SMP • Offer cost-oriented interconnection
• Required to publish a reference interconnection offer
• Interconnection charges should be unbundled
• Maintain separate accounting of their interconnection and other activities
Source: Commission Staff Working Document. Europe’s Liberalized Telecommunications Market – A Guide to the Rules of the Game. (See http://europe.eu.int/comm/dg04/).
59 The Eighth report on the implementation of the telecommunications regulatory package – European telecoms regulation and markets 2002 . COM(2002) 695 final.
56 Towards a knowledge-based economy – Europe and Central Asia: Internet development and governnance
In 2002, the EU initiated another wave of liberalization of the telecommunications market, particularly, its electronic telecommunications segment, aiming at establishing a harmonized regulatory framework for electronic communications networks and services (Directive 2002/21/EC of the European Parliament and of the Council of 7 March 2002). The Framework Directive was complemented with four others:
(a) Directive on the authorization of electronic communications networks and services (the “Authorization Directive”);
(b) Directive on access to, and interconnection of, electronic communications networks and associated facilities (the “Access Directive”);
(c) Directive on the universal service (the “Universal Service Directive”);
(d) Directive on the processing of personal data (the “Privacy and Electronic Communications Directive”).
The Access Directive established rights and obligations for operators and for undertakings seeking interconnection and/or access to their networks. The objective was to set up a framework which will encourage competition by stimulating the development of communications services and networks, and also ensure that any bottlenecks in the market do not constrain the emergence of innovative services benefiting users. The approach adopted was technologically neutral, i.e. the Directive was not intended to introduce rules which could be adapted to technological progress but, instead, to establish a modus operandi to address market problems. The Directive applied to all forms of communication networks carrying publicly available communications services. These included fixed and mobile telecommunications networks, networks used for terrestrial broadcasting, cable TV networks, and satellite and Internet networks used for voice, fax, data and image transmission. The national regulatory authorities were responsible for carrying out regular market analyses in order to determine whether one or more operators have significant power on the market in question and then impose certain obligations on that operator, according to the circumstances, which could include:
(a) Obligations of transparency in relation to interconnection and/or access requiring operators to make public specified information such as accounting information, technical specifications or network characteristics;
(b) Obligations of non-discrimination to ensure that operators apply equivalent conditions in equivalent circumstances to undertakings providing equivalent services;
(c) Obligations of accounting separation in relation to specified activities concerning interconnection and/or access;
(d) Obligations of access to, and use of, specific network facilities. Operators may be required inter alia:
- To negotiate in good faith with undertakings requesting access; - Not to withdraw access to facilities already granted; - To grant open access to technical interfaces, protocols or other key technologies that is
indispensable for the interoperability of services; - To provide co-location or other forms of facility sharing, including duct, building or mast
sharing;
(e) Obligations relating to cost recovery and price controls, including obligations for cost orientation of prices and obligations concerning cost accounting systems.
By the year 2004, 20 member States of the EU, including some of the new EU Member States, transposed the new regulatory framework. The market response to the new regulatory regime in the area of
Internet development: Current state of critical Internet resources in the UNECE region 57
interconnection was increased competition resulting in a 14 per cent reduction of the fixed-to-mobile termination rate for operators with SMP.60 Major EU telecoms are now offering a wide range of interconnection products and services, including:
(a) Switched interconnection products (fixed network products: wholesale of end-user products, such as subscription and traffic; origination (local, single and double) and termination (local, single and double transit); transit and exchange of international traffic; and mobile network products: wholesale of end-user products; origination and termination; and roaming (national and/or international);
(b) Unbundled network components (network access lines: raw copper, shared access, bit stream access, fibre, coax, mobile; transit lines: fibre, coax, radio links, satellite, submarine cables and other infrastructures; switching functions: local and tandem switching; network management, directory service functions and etc.: subscriber listening, operator services, directory assistance, others);
(c) Interconnection of packet switched networks (interconnection of IP networks: bilateral peering, public peering, hierarchical peering; interconnection of other packet switched networks: ATM, SDH, Ethernet);
(d) Co-location and sharing of common facilities (installation of telecom local facilities, sharing ducs and mast);
(e) Interconnection of application (Web browsing, instant messaging services, VoIP and other applications).
For example, British Telecom provides network services within the United Kingdom to more than 400 communications companies, network operators and service providers. Its assets in the United Kingdom include fibre-optic cable and copper networks, the core telecommunication network and local exchanges. The BT services include: ADSL, Internet Protocol, private circuits, frame relay and Integration Services Digital Network (ISDN). Its subsidiary BT Ignite provides the whole range of connectivity services from Frame Relay, IP, LAN switches, WAN routers, voice switches, among others, to equipment services.61 TeliaSonera International Carrier provides wholesale international IP, capacity and voice services to selected high volume destinations in Europe and across the Atlantic. Telecom Italia Mobile has roaming agreements with 49 GSM operators in more than 32 countries. Koninklijke PTT Nederland (KPN), the largest and oldest supplier of fixed-network telecommunications services in the Netherlands, heavily invested in the construction of a new fibre-optic network, Lambda, which interconnects major urban districts in the Netherlands. The network was a stepping stone for the company intending to further develop as a provider of services to other Internet service providers and telecom operators active in the Netherlands.62 In the CIS, most of the countries have undertaken some reforming of their telecommunications markets albeit with different degrees of consistency. These reforms eased the entry of new telecommunications services providers and encouraged the development of new services, mainly, mobile telephony. The interconnection regulation was introduced in Moldova (The Regulation on Interconnection in 2002), and at present Moldtelecom has concluded 13 interconnection agreements with other fixed line operators, including SC RISCOM, EUROSTOK LLC , SICRES LLC, Telcom Technologies LLC, Telemedia Group JSC among others.63 In Armenia, the interconnection issues are covered by the Law on Electronic Communications of 8 July 2005. In Kyrgyzstan, the interconnection and tariff regulation legislation prepared with the EBRD assistance is currently under consideration by authorities. In Ukraine, the interconnection has been heavily regulated (especially regarding tariff-setting for calls from fixed to
60 Commission communication of 2 December 2004: “European Electronic Communications Regulation and Markets 2004. COM(2004) 759 final. 61 See http://www.btignite.com. 62 See http://www.kpn.com. 63 See http://www.moldtelecom.com.
58 Towards a knowledge-based economy – Europe and Central Asia: Internet development and governnance
mobile phones, which are subject to Government intervention) under Chapter IX of the 2003 Law on Communications. The Law requires operators to provide other operators willing to conclude an interconnection agreement with exhaustive information and to offer interconnection terms that are at least equivalent to those proposed to other operators (Article 58). The Ukrainian Interconnection regulation is currently in the process of revision by the National Regulatory Authority in response to loud complaints of operators about the procedures as being non-transparent and, in some instances, discriminatory.64 In Azerbaijan, the interconnection is regulated by the 1997 Communications Law, the 1988 Information, Informatization and the Protection of Information Law and the 2005 Law on Telecommunications. Tariffs of the state-owned operators (Aztelekom and Baktelekom) are set up and overseen by the Government agencies (by the Inter-Ministerial Tariff Council, in particular). All telecom operators are required by the Law to mutually facilitate interconnection through formal commercial agreements. At present, a new interconnection regulation is being drafted in order to further elaborate interconnection procedures. In Belarus, the interconnection is governed by four laws (Law on Communications of 2005, Regulation on Communications Operators’ Interconnection of 1999, Regulation on Supervision Procedures for Telecommunications Networks Connected to General Use Networks of 1997, and Regulation on Land Mobile Radio Communications Network Creation of 1995).65 In Georgia, the Law on Electronic Communications of 2005 (Articles 41 and 42) establishes procedures on interconnection agreements. Each operator is required to publish standard conditions and tariffs for interconnection and to provide interconnection to other operators at any technically feasible point. The regulation requires implementation of interconnection within 3 months from the date of submission of application to the interconnection provider.66 In the Russian Federation, a new interconnection regime was established by the 2003 Law on Communications. It finally abolished the monopoly of the state-owned agencies and opened the access to public infrastructure. The Law specifically underscores that “refusal by the operator having significant market power to conclude a network interconnection agreement is prohibited, except for cases wherein the network interconnection and interaction contradict the network operator license conditions or regulatory acts determining the establishment and functioning of the unified electronic communications network in the Russian Federation”.67 In January 2006, a new regime for mobile-fixed interconnection was established. Under the new regime, mobile operators are permitted to terminate domestic calls from the fixed line network without incurring charges, which, in the past, were passed on to the users. It should be noted that liberalization of the telecommunications market has brought unexpected results in many countries of the region, especially in the CIS. Firstly, many public telecoms diversified themselves by adding new services, such as Internet services, mobile telephony and/or wireless interconnection. Secondly, through numerous internal restructuring measures, mergers and acquisitions, partial privatization, among others, they converted themselves into large holdings, which are now offering full-range telecommunication services. For example, Svyazinvest was set up as a holding company of Russian Federation’s 80+ regional telecom operators in 1995. It was drastically restructured in 2002. As a result, it now holds stakes of over 50 per cent in most of the mega-regional operators (figure 18). All regional telecoms now offer interconnection to other service providers. For example, OJSC CenterTelecom, one of the largest telecommunication operators in Russia and Eastern Europe, serves over 6 million access lines and offers PSTN interconnection to other operators. The company owns telecommunication infrastructure in the most densely populated Central Federal district of Russia. CenterTelecom is licensed to provide a wide range of telecommunication services from POTS and Internet access to air-broadcasting and cable TV.68
64 See http://www.nkrz.gov.ua/ua/docs/pravila_v3.zip. 65 See http://www.mpt.gov.by/new/modules/about/. 66 See http://www.gncc.ge/files/7050_3555_376651_elegtr.eng.pdf; Georgia: Structural Reforms Support Project Regulatory Development, GNCC, DETECON-WB-GNCC, August 2003. 67 See http://www.minsvyaz.ru/ministry/documents/. 68 See http://www.geneva-telecom.ru/index.cfm?id=5.
Internet development: Current state of critical Internet resources in the UNECE region 59
Figure 18. Svyazinvest holding structure
2.4. Connectivity within the Internet
The ceaseless operation and growth of the Internet in the UNECE region is now critically dependable on the effectiveness and cohesion of policies relating to the interconnection of the component networks both within national and region administrative domains and between the world regions on the global scale. Moreover, as the total number of networks within Administrative Domains (AD) and the total number of ADs themselves increases, and the risk of destabilization grows, the issue of sustaining the stability of the Internet and its ability to provide reliant and ubiquitous interconnection becomes crucial and needs to be addressed collectively. So far, the existing system of the Internet management both at the global and regional levels, which are organized as a non-profit voluntary participation of ISPs, has been able to cope with a growing complexity of the Internet utilizing the IP suite. Each network wishing to interconnect with other intra- and inter-regional networks, directly or indirectly, has been able to do this following a rather simple procedure, assuming that it is equipped with the necessary capacity and capabilities in terms of hardware and applications. The overall hierarchy of the Internet networks, traffic arrangement and regulation also seemed straightforward. All the networks (or ISPs) were classified by three tiers taking into consideration the nature of their connection to other networks. Large ISPs, both global and regional, which have self-owned operating infrastructures, including the routers, switches and other intermediate devices, form tier 1.69 They interconnect with other tier 1 ISPs via public or private peering for exchanging traffic.70 Other ISPs are dependent on the capabilities of the tier 1 ISPs to manage the peering infrastructure, although these boundaries have begun blurring over the last decade. Global tier 1 ISPs like AboveNet, AT&T, Global Crossing, MCI EMEA, NTT Communications, among others, usually have their own Internet backbones with international coverage. Therefore, they have large traffic volume, a large customer base and a large number of routers. Such a capacity allows them to support a large number of Autonomous Systems (AS). Some of the 2 tier ISPs were able to extend their operations to more than one continent, while some of the tier 1 ISPs have been using circuits provided by alternative carriers. Finally, tier 3 ISPs cover local retail and consumer markets and provide local access to the Internet. Usually, the traffic of tier 2 and tier 3
69 Tier 1 ISPs are further broken into 2 categories: global tier 1 ISPs and regional tier 1 ISPs. 70 Public peering refers to an implementation of a BGP-4 peering session between NSPs through an exchange point (IX or NAP). The interconnection supports for public peerings are not dedicated. Direct peering refers to an implementation of dedicated bandwidth between the larger Network Service Providers (“NSPs”) to reduce inefficiencies related to scaling interconnections between the large Internet backbones. Traffic is exchanged on a bilateral basis via local BGP-4 peering sessions.
SVYAZINVEST
Uralsvyainform 51.42%
CenterTelecom 50.69%
North Western Telecom 39.89% VolgaTelecom
50.67%
Southern Telecom 50.69%
JSC D’vostochnaya50.56%
Sibirtelecom 50.67%
Rostelecom 51%
MGTS 28%
60 Towards a knowledge-based economy – Europe and Central Asia: Internet development and governnance
needs several router hops to get out to a URL and their users have to share a common gateway to higher-tier ISPs.
2.4.1 Peering
The public peering in the UNECE region is taking place either at Network Access Points (NAPs) and/or Internet Exchange points (IXPs). There are 250 IX points around the world today. The largest NAP/IXs in the UNECE region in terms of traffic are: Amsterdam AMS-IX and London Internet Exchange (LINX). These large exchange points bring together hundreds of tier 1, 2 and 3 ISPs for access to multiple networks over a shared connection. Private peering is conducted on the basis of a bilateral agreement between two ISPs with similar network capacity and traffic level, and involves a direct connection over a Layer 1 or Layer 2 link. It should be noted that a significant share of the Internet traffic volume has been exchanged via a private tier 1 peering system. In comparison with public peering, private peering entails significant costs, making this model of the Internet traffic arrangement very exclusive and affordable only to the highest tier ISPs. Private peering is bilateral and restrictive whereas public peering enables multiple streams. In Europe and the CIS, many public peering IXPs have been operated by various academic and government research networks or by non-profit organizations like, for example, National Research and Educational Networks of the European Union (GEANT), CIXP - CERN eXchange for Central Europe, or NORDUnet. However, the proportion of non-profit IXs declined from 100 per cent in 1993 to 64 per cent in 2006. At present, most countries of the UNECE region have at least one IXP (table 17).
Table 17. Number of IXPs per country in Europe, 2006
Country Total number of IXPs France 13 Germany 12 United Kingdom 12 Sweden 7 Spain 6 Netherlands 5 Poland 5 Russian Federation 5 Italy 4 Romania 3 Switzerland 3 Belgium 2 Estonia 2 Finland 2 Norway 2 Austria 1 Croatia 1 Cyprus 1 Czech Republic 1 Denmark 1 Greece 1 Hungary 1 Iceland 1 Latvia 1 Luxembourg 1 Malta 1 Portugal 1 Slovakia 1 Slovenia 1 Ukraine 1 31 countries 99
Source: European Internet Exchange Association. 2006 Report on European IXPs. October 2006. (See http://www.euro-ix.net).
Internet development: Current state of critical Internet resources in the UNECE region 61
At the same time, the total number of IXPs increased from 3 in 1993 to 99 in 2006 and, consequently, the traffic volume increased as well. In 2006, it reached 631.43 Gbps. Distribution of the Internet traffic is extremely uneven in the UNECE region, with almost 45.5 per cent of total volume falling on the IXPs located in the Netherlands (mainly on the Amsterdam IXs) and the United Kingdom (mostly the London IXs). More than 47 per cent of the total traffic falls on the IXPs situated in Germany (12.83%), Spain (10.04%), Sweden (9.8%), Italy (4.15 %), Hungary (3.77%), France (2.43%), Czech Republic (2.36%) and Norway (1.9%). Therefore, total 92 per cent of the Internet traffic in the UNECE region has been relying on the support of the Internet Exchange point infrastructure of ten countries (table 18).71 Furthermore, 53 per cent of European IXP participants have been peering at more than one European IXP, while the remaining 47 per cent only peer at one European IXP. Of all the European IXP participants (3401), 66 per cent have been peering at the IXPs located in ten European countries and almost half of the participants peering at 12 IXPs located in Amsterdam, London, Frankfurt, Moscow, Riga, Paris, Vienna, Kiev and Oslo (tables 18 and 19).
Table 18. Peak aggregated IXP traffic: ranking per country/city, 2006
Country Per cent of total traffic
Ranking Total number of IXP
participants per country City
Per cent of total traffic
Ranking
Total 23 Countries 100.00
Total 31 Countries 3401
Total 38 Cities 100.00
Netherlands 28.65 461 Amsterdam 28.41 1 United Kingdom 15.89 1 506 London 15.82 2 Germany 12.83 2 365 Frankfurt 11.56 3 Spain 10.04 3 66 Madrid 10.11 4 Sweden 9.80 4 125 Stockholm 6.36 5 Italy 4.15 5 127 Budapest 3.73 6 Hungary 3.77 6 50 Milan 3.21 7 France 2.43 7 398 Paris 2.43 8 Czech Republic 2.36 8 60 Prague 2.36 9 Norway 1.90 9 88 Oslo 1.90 10
Total 10 countries 91.82 10 Total 10 countries
2246 Total 10
cities 85.89
The rest of the region’s countries (13 countries with IXPs)
8.18
The rest of the region’s countries (21
countries) 1155
The rest of the cities (28 cities with IXPs) 14.11
Source: European Internet Exchange Association. 2006 Report on European IXPs. October 2006. The above situation causes some concerns:
• A high concentration of Internet traffic at the Amsterdam and London IXPs elevates the risk that any serious technical problem at these two exchange points could have a paralyzing effect on the entire regional Internet system and traffic routing. With a continuous growth of traffic and participating ISPs in the regional network, the risk of a system-wide breakdown will be amplifying;
• The risk of traffic congestion and loss of packets may also increase with intensifying Internet penetration in Europe and Central Asia. According to some studies, many public peering points in the region are already overloaded and suffer from packet loss.72 Proliferation of broadband access, convergence of communication media and the emergence of multimedia rendering
71 European Internet Exchange Association. 2006 Report on European IXPs. October 2006 (See http://www.euro-ix.net). 72 Winther, Mark. Tier 1 ISPs: What They Are and Why They Are Important. IDC White Paper, May 2006.
62 Towards a knowledge-based economy – Europe and Central Asia: Internet development and governnance
combined data, voice and image services to the users over one platform in the UNECE region will unavoidably and dramatically augment traffic loads;
• Current peering practices are based on the assumption of symmetry in traffic streams. However, with growing uptake of multimedia the traffic asymmetry will increase. For example, there will be a large traffic asymmetry between content-heavy networks and end user-heavy networks as content providers will have to send a large amount of data in response to consumers’ short queries. This means that one peering party will bear more of the cost as a result of peering;
• Considering that businesses also have been adopting broadband, present traffic handoff policies need to be adjusted. The problem lays in the fact that most DSL providers tend to hand off traffic at the nearest peering point. From that moment, the traffic may be handled by several upstream providers, none of which has a responsibility for performance monitoring and trouble resolution. Such a situation bears a number of risks for businesses which are much more sensitive to latency and packet loss than consumers;
• Considering the international significance of the largest Europe’s IXPs in terms of global Internet interconnection and their role in ensuring traffic transit between the world regions, forthcoming massive traffic inflows from Asia and Africa to and through Europe, may exacerbate the vulnerability of the regional Internet infrastructure;
• Compliance challenges push a growing proportion of enterprises towards few gateway connections that aggregate traffic and, hence, provide more secure connections, monitor and audit according to compliance guidelines. This trend indicates a need for more centralized and controlled network operations, but also a defragmentation of the Internet environment.
Table 19. IXP rankings by number of participants, 2006
10 PaNAP Paris 76 11 UA-IX Kiev 75 12 NIX Oslo 71 13 SFINX Paris 63 14 NIX.CZ Prague 60 15 FreeBIX Brussels 59 16 Swissix Zurich 59 17 MIX Milan 58 18 LIPEX London 57 19 TIX Zurich 57 20 BIX Budapest 50 21 BNIX Brussels 48 22 LONAP London 48 23 WIX Warsaw 45 24 SIX Bratislava 44 25 PARIX Paris 42
Source: Radovcic Serge. Euro – IX Report. VIX Technical Meeting. “Ten years of VIX”, Vienna, 23 November 2006.
Internet development: Current state of critical Internet resources in the UNECE region 63
2.4.2 ASN assignment
The binding element of the Internet is that independent networks share a common IP addressing and a global Border Gateway Protocol (BGP) routing framework allowing all the networks to interconnect with each other directly or indirectly. Internet routing architecture represents a two-level hierarchy: domains and interdomains. The Internet space is partitioned into domains with each domain using an internal routing environment based on Interior Gateway Protocol (IGP). IGP maintains a mapping set for the current topology of the domain together with the set of best paths between any two points within the network domain. The second level, interdomain routing space, is maintained using Version 4 of the Border Gateway Protocol (BGPv4), which describes how domains interconnect. A routing path to an address in the interdomain space is represented as a sequence of domains that must be transited to reach the domain that originates that particular address prefix. As each domain has its own set of routers under a single technical administration and common metrics to determine how to rout packets within its space, it is independent and autonomous. Therefore, within the overall routing architecture such a domain is termed an Autonomous System (AS). In the interdomain space, data packets are being routed using two components: address prefixes and AS numbers (ASNs), the latter being used for identifying domains. Since 1998 the responsibility for coordinating the allocation of the ASNs at the global level lies with the Internet Corporation for Assigned Names and Numbers (ICANN), an internationally organized, non-profit corporation that has the overall responsibility for Internet Protocol (IP) address space allocation, protocol identifier assignment, generic (gTLD) and country code (ccTLD) Top-Level Domain name system management, and root server system management functions. The Regional Internet Registries (RIRs), independent, not-for-profit membership organizations, are responsible for managing, distributing, and registering public Internet Number Resources within their respective regions. There are currently five RIRs operating at the regional level. In Europe and Central Asia, these functions have been performed by the Réseaux IP Européens (RIPE) Network Coordination Centre (RIPE NCC). As a Regional Internet Registry, the RIPE can allocate and assign Internet Resources (IPv4 and IPv6 address space, Autonomous System (AS) Numbers and Reverse DNS delegations) to its members – Local Internet Registries (LIRs). The ASN consumption at the regional level and among the regions has not been stable. Since 2005, the ASN consumption has been the largest in the RIPE area. The ASN consumption growth has been driven by Russia, where the total number of participating ASs/ISPs reached 672 in 2006 surpassing the United Kingdom (565) and Germany (529).73 On the whole, from 1999 to 2007, the RIRs assigned a total of 33758 ASNs.
2.4.3 Internet Domain Names assignment
Another key function of the present Internet Governance has been the domain name system management (DNS), also called the “root,” that consists of 264 suffixes. These include .com, .net, .org and country codes. Since 1998, the Internet Corporation for Assigned Names and Numbers (ICANN) has been responsible for the overall coordination of the management of the technical elements of the DNS. In order to ensure universal resolvability ICANN has been overseeing the distribution of unique technical identifiers used in the Internet operations, and the delegation of Top Level Domain names. It fully controls the assignment of generic Top Level Domain names (gTLDs) and authorizes the organizations responsible for the country code Top Level Domain names (ccTLDs). The ICANN master database of domain names is preserved in 13 “mirrors” - servers that automatically copy any changes made to the original database. The duplication makes the system robust in cases of attack or failure.
73 RIPE NCC. Annual Report 2006 (See http://www.ripe.net/ripe/docs/ripe-407.html#activities).
64 Towards a knowledge-based economy – Europe and Central Asia: Internet development and governnance
Regarding the ccTLD accreditation, ICANN is responsible for identifying and setting minimum standards for the performance of the domain name registries. The latter may take various forms. In some countries, domain name registries have been run by universities or research centers, in some other countries, by industry associations or independent authorities. Theoretically, ICANN is an independent non-profit corporation consisting largely of Internet Society Members. However, the fact that ICANN is based on authority given to it by the United States Department of Commerce and located in the United States and, therefore, is subject to the United States law, causes some uneasiness among Internet community members perceiving that there is a strong interdependence between ICANN and the United States Government. Moreover, ICANN ten of the 13 mirror servers are located in the United States (the others are in Amsterdam, Stockholm and Tokyo). This also contributes to tension over the existing DNS management arrangements. To some extent, the creation of the Government Advisory Committee (GAC), in which the representatives of 35 countries, including the United States and a number of the international organizations are participating, helped to counterbalance but not entirely resolve this issue.74 The GAC adopted principles and guidelines for delegation and administration of ccTLDs that stress the national responsibility for ccTLDs.75 According to GAC, every country or distinct economy should be able to ask for an appropriate country code in order to be represented as a ccTLD and to designate the registry:
“Country code top level domains are operated in trust by the Registry for the public interest, including the interest of the Internet community, on behalf of the relevant public authorities including governments, who ultimately have public policy authority over their ccTLDs, consistent with universal connectivity of the Internet.”76
This approach has also been challenged by some members of the Internet community who are fearful that too much government intervention in distribution of this critical Internet resource may undermine the evolution of the Internet. Attempts have been undertaken to set up an alternative rooting system (for example, the creation of “F-root” by Paul Vixie in 1994), which could neutralize politically motivated actions of ICANN and/or Governments aiming to restrict or exclude some countries or social groups from participating in the global NET. There are other issues associated with the DNS management that are currently debated. These include:
• Domain names internationalization;
• Dilution and massive duplication of domain names;
• Cybersquatting;
• Stability and reliability of the existing DNS;
• Congestion in the domain name space;
• Trademark conflicts;
• Transition to IPv6 and associated problems.
The UNECE member States are among the leaders in terms of the base of domain name registrations. According to the VeriSign Report, there were more than 240 ccTLDs in the world with total base registrations of 51.5 million by August 2007. Of these, as figure 48 shows, 66 per cent were contributed by the top ten ccTLDs , including .de (Germany), .uk (United Kingdom), .nl (Netherlands), .eu (European
74 More information on GAC may be found on: http://gac.icann.org. 75 Government Advisory Committee. GAC principles and guidelines for delegation and administration of ccTLDs, 2000. 76 See http://gac.icann.org/web/home/GAC_Operating_Principles.doc.
Internet development: Current state of critical Internet resources in the UNECE region 65
Union), .it (Italy), .ch (Switzerland).77 In terms of absolute volume growth, ccTLDs of Germany, United Kingdom and the Netherlands surpassed all the ccTLDs of Europe and Central Asia, but in terms of growth rate, it was .ru (the Russian Federation) that outstripped the rest of the region’s ccTLDs and reached a double-digit rate. The German and the United Kingdom ccTLDs remain the largest, both at the world and regional levels. Their combined share was 33 per cent of all the world ccTLD base registrations in August 2007.
Table 20. Geographic distribution of gTLD registrations, August 2007
Million Country 56.5 United States 4.8 Germany 3.2 United Kingdom 3.0 Bahrain 2.8 Canada 2.6 China 1.9 France 1.7 Hong Kong 1.6 Australia 1.1 Japan 1.0 Spain 0.9 Korea 0.8 Italy 0.7 Netherlands 0.6 Turkey 0.5 New Zealand 0.4 India 0.4 Cayman Islands 0.4 Russia 0.3 Denmark
Of the overall TLD base of domain name registrations (138 million), 86.5 million constituted the gTLD domain name registrations (table 14). More than 65 per cent of the total gTLD domain name registrations were in the United States. The combined share of the European countries (including Turkey) was 15.8 per cent. Among all gTLDs most demanded were .COM and .NET domains. Their total base of domain name registrations reached almost 73 million by August 2007. In the UNECE region the national institutional arrangements underlying the assignment of domain names are ranging between the public and private governance. Some organizations responsible for national domain administration are just governmental departments, for example, in Norway (NORID, .no registry, supervised by the Norwegian Post and Telecommunications Authority), Belarus (The State Centre of Security Information of Belarus, the Office of the President), Moldova (MolData), Uzbekistan (Uzinfocom) and Tajikistan (The State Center of Information Technologies, the Office of the President). Some others are cooperatives or associations of ISPs, for example, in Germany (DENIC). In a relatively large number of the region’s countries these functions have been carried out either by academic institutions such as RESTENA Foundation in Luxembourg or other non-profit organizations (companies or foundations) such as, for example, NOMINET, a non-profit company in the United Kingdom, or SIDN (the Foundation for Internet Domain Registration), a non-profit organization, in the Netherlands. In some countries, the national domains have been managed by private companies such as, for example, Internet an Islandi hf., ISNIC, in Iceland. In 2005, 18 of 27 national domain administrations, members of the Council of European National Top-Level Domain Registries (CENTR) were private
77 The VeriSign Domain Report. The Domain Name Industry Brief. Volume 4, Issue 5, August 2007.
66 Towards a knowledge-based economy – Europe and Central Asia: Internet development and governnance
entities by their legal status, of which nine were private foundations, one cooperative and three associations. Of the remaining nine administrations seven were departments of research centers and/or universities, including Croatia, Islamic Republic of Iran, Latvia, Lithuania, Poland, Romania, and Slovenia. The domain administration of Spain and Finland were under Government control.78 The policies of these institutions also vary. Some impose restrictions on access of non-citizens to national domains. For example, the rules of domain names registration in Germany (.de) require the registrant or administrative contact to reside in Germany. Similar rules are applied by AFNIC (France) as well as by national registries of Albania, Bosnia and Herzegovina, Belarus, Estonia, Hungary, Moldova, Norway, Slovakia and Slovenia. Few countries in the region allow non-nationals to register their domains in ccTLDs (Austria, Czech Republic, the Netherlands, Poland, Romania, Russian Federation and the United Kingdom). It should be noted that a new .eu TLD also restricts the participation of non-EU organizations and individuals. Some national domain administrations limit the number of domain names per juridical person (Cyprus, Hungary, Israel, Norway and Slovenia); some others do not allow domain name registration by individual (natural) persons (Hungary and Slovenia). In some countries of the region national domain administrative and operational functions are separated. Most of the ccTLD administrations, including the Coordination Center for TLD .RU, are responsible for developing rules of registration and the provision of technical and administrative support of registrars, while the registrars actually manage the domain name registration and all other transactions associated with domain names. However, eight domain administrations (Croatia, Cyprus, Iceland, Israel, Latvia, Luxembourg, Malta and The Holy See) register domain names directly.79 One of the major challenges facing national domain administrations is cybersquatting, a phenomenon of storing domain names in order to profit by re-selling them later on at prices higher than the prices at which they were initially bought. According to the United States federal law known as the Anti-Cybersquatting Consumer Protection Act of 1999, cybersquatting is registering, trafficking in, or using a domain name with bad-faith intent to profit from the goodwill of a trademark belonging to someone else. Commercial domain names are obtained from one of several registries, companies authorized to ensure that a domain name you want is unique (no one else already has it) and issue it to you if it is. However, these registries make no attempt to determine whether the domain name is one that rightfully ought to go to someone else. The principle is “First come, first served.” For this reason, a number of enterprising individuals and companies have applied for and reserved domain names, either new or expired, that they think someone else will want, either now or in the future. Many cybersquatters reserve common English words, reasoning that sooner or later someone will want to use one for their websites. Examples of words sold by cybersquatters to companies developing significant websites include drugstore.com, furniture.com, gardening.com, and Internet.com. Cybersquatters may also regularly comb lists of recently expired domain names, hoping to sell back the name to a registrant who inadvertently let their domain name expire. eBay, the auction site, sometimes lists domain names for sale. Several cybersquatter companies offer their wares at their own websites. It should be noted that only 46 domain name registrations throughout the world have been applying the World Intellectual Property Organization (WIPO) Uniform Domain Name Dispute Resolution Policy (UDRP Policy), adopted by the ICANN on 26 August 1999, and the Rules for Uniform Domain Name Dispute Resolution Policy (UDRP Rules), approved by ICANN on 24 October 1999. In addition to the ICANN Policy and Rules, the WIPO Center has developed its Supplemental Rules for the Uniform Domain Name Dispute Resolution Policy (UDRP) that entered into effect on 1 December 1999. In Europe and Central Asia, with the exception of a few countries (Latvia and Tajikistan, for example), most countries have not yet adhered to the WIPO UDRP Rules due to contradictions between the UDRP and
78 RU- center, Domain names registration in national domains. 07.08.2007 (See http://info.nic.ru/st/12/out_26.shtml). 79 See https://www.centr.org/members/.
Internet development: Current state of critical Internet resources in the UNECE region 67
existing local legislation.80 In the majority of the UNECE member countries, extrajudicial dispute settlement procedures are absent with the exception of the United Kingdom and Israel. In many countries of the UNECE region national domain administrations cooperate and/or consult with local Internet societies regarding rules and procedures that govern the domain names registration process. Many have established special committees and/or boards in which most of the local stakeholders are represented, including ISPs, business associations, independent legal professionals, national patent bureaus and respective ministries and government agencies. For example, the Consultative Committee of AFNIC (Association Française pour le Nommage Internet en Coopération) include representatives of ISPs, INRIA (French National Institute for Research in Computer Science and Control), and the Ministries of Telecommunications, Industry and Research. The AFNIC intends to open up more widely to Internet users in order to be more responsive to the current and future needs of its members and to have the kind of flexible management structure that would not be possible in a research institute. With this purpose in mind, it created some new membership categories: (a) user members; (b) subscriber members; (c) correspondent members: international or national organizations. These membership categories receive a range of information services from the AFNIC. Recently, a second “Users legal/corporate entities” consultative committee was set up to ensure that the “end user” was not excluded from discussions on the development of .fr domain names.81 In some of the CIS Member States (Belarus, Kazakhstan, Tajikistan and Uzbekistan) and countries of Central and Eastern Europe (Albania, for example), representation in the national domain administration is decided by the Government, and, although the Governments undertake occasional consultations with other stakeholder groups on strategic issues regarding the implementation of national e-strategies, the decisions are taken by the Government. In most instances, Internet users have to use online charts and/or forums to express their attitude towards domain names registration practices.
2.4.4 IPv4 and IPv6 allocation
IP addresses are another critical resource of the Internet. Currently, there are two types of IP addresses in active use: IP version 4 (IPv4) and IP version 6 (IPv6), although routing over the Internet is done via IPv4 addressing scheme. IPv4 was initially deployed on 1 January 1983 and is still the most commonly used version. IPv4 addresses are 32-bit numbers often expressed as 4 octets in “dotted decimal” notation (for example, 192.0.32.67). Deployment of the IPv6 protocol began in 1999. IPv6 addresses are 128-bit numbers (four times larger than IPv4) and are conventionally expressed using hexadecimal strings. Both IPv4 and IPv6 addresses are assigned in a delegated manner. Users are assigned IP addresses by Internet service providers (ISPs). ISPs obtain allocations of IP addresses from a local Internet registry (LIR), a national Internet registry (NIR), or from their appropriate Regional Internet Registry (RIR).82 The allocation of the IP addresses has been carried out in the same fashion as that of ASNs. The RIRs receive IP address blocks from the IANA and then distribute them through a system of Internet Registries. In Europe and Central Asia, it is the RIPE NCC who is responsible for allocation of IP address space. It does that through its members – LIRs. The LIRs then assign IP addresses to end-users and to their own network infrastructure. For IPv6 address allocations, the United Kingdom and Germany acquired the largest address spaces in 2006; respectively, 16 per cent and 14 per cent of the total allocations made by the RIPE. Of the countries of Eastern and Central Europe, Estonia and Poland were most active. Their respective shares in total allocations of IPv6 were four per cent and three per cent.83
80 See https://www.centr.org/members/. 81 See http://www.afnic.fr/. 82 IANA (http://www.iana.org/ipaddress/ip-addresses.htm). 83 Ibid.
68 Towards a knowledge-based economy – Europe and Central Asia: Internet development and governnance
However, few countries of the UNECE region have initiated the transition to IPv6. The delay is caused by relatively high costs associated with transition, especially for small ISPs. Another problem hampering the introduction of IPv6 is that it is not interoperable with IPv4. It is not possible to address a host that only knows IPv4, although it is possible to use both protocols simultaneously on the same host. This means that any host on the Internet needs to use both Internet protocols until all the Internet switches to IPv6. In the meantime, the shortage of IP addresses has been growing, and ISPs have been experiencing difficulties in obtaining IP addresses from the registries. Temporary solutions to this problem were found in dynamic IP allocation by giving end-users a different IP address on each connection or using Network Address Translation (NAT), a technique that allows connecting end-users to the Internet by a proxy or an address translating server. Both techniques, however, contribute to asymmetry in the Internet because they make it harder for end-users to run their own web servers and many type of peer-to-peer Internet applications. From a technical point of view, transition to IPv6 is a good thing, but so far the rewards in economic terms have not been very obvious. Some experts believe that it will take more time for the entire Internet community to totally shift to IPv6.84
2.4.5 Internationalized Domain Names
Since the end of the 1990s, many in the Global Internet community have been concerned with the issue of deepening the Internet penetration by bringing more people on line. The online predominance of languages based on the Latin alphabet was seen as one of the most important economic and social obstacles. Thirty-two per cent of all the Internet users in 2007 were using English, and 58 per cent of the users were employing languages based on the Latin alphabet. At the same time, the largest increase of the users by language over the period 2000-2007 was at the expense of those using the Arabic language (more than 940 %). The estimated world population for language and respective Internet penetration rate imply that there is an enormous potential of the Internet user growth. Even in the case of the English-speaking population, the Internet penetration rate was only 18 per cent in 2007.85 In order to release this potential, language barriers to access the Internet must be removed. Therefore, it is not surprising that this issue has become an important item on the international agenda of the WSIS. One of the objectives of the WSIS, which focused on the need to develop an inclusive Information Society, was “to promote the inclusion of all peoples in the Information Society through the development and use of local and/or indigenous languages in ICT” by encouraging the development of content and putting in place technical conditions to facilitate the presence and use of all world languages on the Internet.86 It should be noted, however, that the implementation of this goal faces a technical challenge. The standard for domain names does not allow letters with diacritics, as required by many European languages, or characters from non-Latin scripts such as Arabic or Chinese. Traditionally, the computers at the heart of the DNS only recognized a limited range of Roman letters, or to be more precise, a subset of US-ASCII (American Standard Code for Information Interchange) characters. Much work has to be done to find a way around this, either by changing the standard, or by agreeing on a way to convert internationalized domain names into standard ASCII domain names while preserving the stability of the domain name system.
84 IDC White Paper ‘Tier 1 ISPs: What they are and why they are important”, Mark Winther, May 2006. 85 Internet World Statistics. See http://www.internet worldstats.com/stats7.htm. 86 The World Summit on the Information Society. Tunis Commitment. Document, WSIS-05/TUNIS/DOC/7-E, paragraph 32. 18 November 2005.
Internet development: Current state of critical Internet resources in the UNECE region 69
The introduction of Internationalized Domain Names is changing this. Internationalizing Domain Names in Applications (IDNA) was designed for maximum backward compatibility with the existing DNS system. An IDNA-enabled application is able to convert between the restricted-ASCII and non-ASCII representations of a domain, using the ASCII form in cases where it is needed (such as for DNS lookup), but being able to present the more readable non-ASCII form to users. Applications that do not support IDNA will not be able to handle domain names with non-ASCII characters, but will still be able to access such domains if given the (usually rather cryptic) ASCII equivalent.87 The idea of introducing IDNs caused some controversy in the Internet community. Many feared that the fundamental unifying role of the Internet would be undermined, and the global Net would be partitioned into a mosaic of domains, which could only be accessible by local (language) communities, therefore, keeping them isolated from the global community and depriving them of economic and social benefits associated with the use of the global Internet. While the argumentation of the opponents of IDNs is not without grounds, so is the reasoning of those supporting the introduction and promotion of IDNs. The latter allow local communities to utilize opportunities and capture benefits, which are available at the local markets, by bringing business online, extending the reach and reducing costs of public and private services providers. Since 2001, the deployment of IDN ccTLDs as well as second level domain names within ccTLDs has intensified. In Europe and Central Asia, the domain names and websites in the following languages and corresponding scripts were found to be deployed; namely, Russian (Cyrillic) and Israeli (Hebrew).88
87 ICANN. Guidelines for the Implementation of Internationalized Domain Names. Version 1.0, 20 June 2003; Internationalising Domain Names in Applications, Network Working Group. RFC: 3490, March 2003. 88 MINC. De-Fragmenting the Internet Namespace. June 2006, and see http://www.itu.int/ITU-T/worksem/multilingual/presentations/S1-Tan.pdf.
70 Towards a knowledge-based economy – Europe and Central Asia: Internet development and governnance
Table 21. Mobile cellular telephone subscribers per 100 inhabitants, 2000-2005 Country 2000 2001 2002 2003 2004 2005
Source: ITU database. Data reproduced with the kind permission of ITU.
Internet development: Current state of critical Internet resources in the UNECE region 73
Table 24. Cable networks in selected EU Member States, 2002 and 2005
Country Cable modem penetration
(as % of inhabitants)
Cable modem coverage
(as % of inhabitants)
Total number of subscribers
(in thousands) 2002 2005 2002 2005 2002 2005
Austria 3.4 5.9 25 31 179.6 685
Belgium 3.4 6.8 55 80 348.5 699
Czech Republic 1 1.3 2 24 50 133
Denmark 2.5 8.6 25 60 133.5 462
Estonia 2 3,7 20 53 25 49,5
Finland 1 2,8 20 33 54 149
France 0.5 0.9 24 26 283 566
Germany 0.1 0.3 5 15 45 240
Hungary 0.3 1.9 66 31.2 192
Iceland 0.2 0.1 31 31 0.5 0.4
Ireland 0.1 0.6 4 4 2.3 25
Latvia 0 0.7 16
Lithuania 1 2.8 25 54 97
Luxembourg 0.1 1.5 25 34 0.6 6.9
Malta 2 5.2 81 95 8 21
Netherlands 4.9 9.6 82 82 796 1562
Norway 1.4 3 20 20 64 138
Poland 0.2 1 9 12 200 371
Slovenia 0.4 3.2 8 64
Slovakia 0.1 0.5 0 13 3.5 26
Portugal 3 4.9 56 75 315.6 509
Sweden 1.7 3.7 38 47 156.4 333
Spain 0.9 2.9 38 42 366.2 1176
United Kingdom 1.3 4.5 42 53 769 2663
Source: IDATE Consulting and Research. Broadband Coverage in Europe. Final Report. 2006 Survey.
74 Towards a knowledge-based economy – Europe and Central Asia: Internet development and governnance
Table 25. Access to Internet in selected UNECE member States, 2005 (total number of subscribers, in thousands)
Country Internet subscribers
(DSL) Internet subscribers
(Cable modem ) Austria 682 477
Belgium 1247.5 757.4
Bulgaria 39.4 51.9
Croatia 109.8 4.5
Czech Republic 279.8 133
Denmark 826.4 389.6
Estonia 84.8 49.5
Finland 1018.7 149
France 8902 563
Germany 10380 240
Greece 158 0
Hungary 412.9 212
Iceland 76 0.4
Ireland 239 32.5
Italy 6480 40.1
Liechtenstein 6.2 2.4
Lithuania 104.8 49.6
Luxembourg 64 6.2
Moldova 6.8 3.3
Netherlands 2500 1562.5
Norway 802 137.1
Poland 695 234
Portugal 697 511.5
Romania 7.3 249
Russian Federation 437 1152
San Marino 1.1 0
Slovak Republic 104.5 21.5
Slovenia 129.3 65.5
Spain 3814 1170
Sweden 1207 355
Switzerland 1132 499 The former Yugoslav Republic of Macedonia
8.3 1
Turkey 1539 50.3
United Kingdom 7220 2666
Total 51411.6 11835.8 Source: ITU database. Data reproduced with the kind permission of ITU.
Internet development: Current state of critical Internet resources in the UNECE region 75
Table 26. Dial-up access to Internet in selected UNECE member States, 2005 (total number of subscribers, in thousands)
Internet subscribers (Dial-up) 2005
Austria 598
Belgium 273
Bosnia and Herzegovina 176
Bulgaria 9
Croatia 838
Czech Republic 1616
Denmark 468
Estonia 18
Greece 725
Hungary 256
Iceland 9
Latvia 12
Lithuania 23
Luxembourg 49
Moldova 51
Norway 429
Poland 669
Portugal 271
Romania 1328
San Marino 4
Slovak Republic 113
Slovenia 201
Spain 1199
Sweden 1372
Switzerland 915 The former Yugoslav Republic of Macedonia
84
United Kingdom 5539
Total 17245
Source: ITU database. Data reproduced with the kind permission of ITU.
76 Towards a knowledge-based economy – Europe and Central Asia: Internet development and governnance
Table 27. DSL subscribers and DSL penetration rate, 2005
Country DSL subscribers, 2005
(in thousands) DSL penetration rate, 2005
( % of the population) Austria 684.6 8.5 Belgium 1294 12.5 Denmark 836.8 15.5 Finland 1018.7 19.5 France 8777.2 14.6 Germany 10380 12.6 Iceland 75.9 25.9 Ireland 202.2 4.9 Italy 6674 11.9 Luxembourg 63 14.2 Malta 30 7.5 Netherlands 2551 15.6 Norway 820.6 17.8 Portugal 708.5 6.8 Sweden 1227 13.6 United Kingdom 2663.4 12.1 Spain 3876.4 9.4 Greece 158 1.4 Cyprus 43.5 5.6 Czech Republic 279.8 2.7 Estonia 110.6 8.2 Hungary 372.5 3.7 Latvia 68.5 3 Lithuania 104.8 3.1 Poland 1254 3.3 Slovakia 104.9 1.9
Slovenia 130.6 6.5
Source: ITU database; IDATE Consulting and Research. Development of Broadband Access in Europe, November 2006. Data reproduced with the kind permission of ITU.
Internet development: Current state of critical Internet resources in the UNECE region 77
Table 28. Broadband Internet subscribers (all wired and wireless networks): total number of subscribers
Lithuania 20 234 Luxembourg 7.4 70 Moldova 0 10 Netherlands 1136 4173.6 Norway 205 1003.7 Poland 122 1637 Portugal 263 1212 Romania 16 751 Russian Federation 11 1589 San Marino 1 1 Slovak Republic 0.6 139 Slovenia 24.7 198 Spain 1333 5076 Sweden 711.6 1918 Switzerland 455 1658 The former Yugoslav Republic of Macedonia
0 12
Turkey 21 1590 United Kingdom 1359 9894 Uzbekistan 0 3
Malta 18 51
Source: ITU database; IDATE Consulting and Research. Development of Broadband Access in Europe, November 2006. Data reproduced with the kind permission of ITU.
78 Towards a knowledge-based economy – Europe and Central Asia: Internet development and governnance
Table 29. Internet usage in Europe, 2000-2007
Country Total number of Internet users (in thousands)
Turkey 16000.00 21.10 700.00 Ukraine 5278.00 11.50 2539.10 United Kingdom 37600.00 62.30 144.20 Total Europe 321853.00 39.80 206.20
Source: World Internet Statistics.
79
Chapter 3
GOVERNING THE EVOLVING INTERNET IN THE
UNECE REGION
As the Internet penetration is deepening, and its impact on communities is becoming more apparent, new issues are surfacing challenging communities throughout the UNECE region. These are, among others:
• How to mitigate risks and threats associated with online activities without undermining the Internet development;
• How to maximize the benefits brought about by the Internet;
• How to bring everybody online;
• How to raise the effectiveness of the use of the Internet.
3.1 The challenges
Internet Governance is a challenging and controversial issue. For some, it should be left to ICT specialists who are best equipped to manage the production of technical norms for the network, the distribution of unique identifiers, data exchange and trafficking and other technical aspects of the Internet operation. Therefore, Internet Governance should be purely technical. For others, who view the Internet as a public good, the Internet Governance should be broadened to encompass the issues of public concern and to insure that those who operate and interact online are in compliance with the Law. As more people move online, it becomes apparent that realities, good and/or bad, of our terrestrial life are rapidly acquiring their cyber life-forms. In the absence of an effective cyberspace legislation based on shared moral and social norms and, consequently, an adequate (for the Internet) enforcement mechanism, there is a real danger that the evolution of the Internet could come to a halt before we reap all the benefits. The Internet differs from other media in many respects, but the most important are the following:
• It is borderless;
• It is decentralized;
• It does not have a central point of control;
• Its participants are plural and diverse;
• It is in perpetual transformation;
• The space of social agents’ interaction it provides is not fully institutionally framed.
These very characteristics of the Internet were the reasons behind the failure of the earlier regulatory attempts of the States and the emergence of a regime of self-regulation set up by the private sector. While the private sector self-regulatory regime has been successful in resolving technical problems, it has not been able to respond to public concerns. On the other hand, the formal regulatory efforts aiming, for example, to bring online behavior of Internet participants in compliance with moral and social public norms were also unsuccessful precisely because of the borderless and global nature of the Internet. Neither corporations nor States alone proved able to impose and enforce the behavior rules on Internet participants worldwide. This situation brings in other problems, such as:
80 Towards a knowledge-based economy – Europe and Central Asia: Internet development and governnance
• Abuse of privacy of users, both by corporations and individuals;
• Abuse of human rights, such as inciting hatred and racism;
• Informatization of criminal activities (theft, money laundrying, human trafficking, child pornography and others);
• Abuse of consumers’ trust (fraud, selling bad quality goods, cheating, spamming and phishing);
• Abuse of the Internet and fair competition (data leakage, spyware, malware, virus distribution, hacking, cybersquatting, piracy, among others).
The economic damage of online violation of public norms borne by the end-users is enormous. Thus, according to the 2007 Consumer Reports, the likelihood and impact of four leading online hazards in the United States are the following: 89
SPAM VIRUSES SPYWARE PHISHING United States incidence
1 in 2 1 in 5 1 in 11 1 in 81
Average cost per incident
n.a. $100 $100 $200
Total damage n.a. $3.3 billion $1.7 billion $2.1 billion On the whole American Internet users spent almost $8 billions over the last two years on computer repairing and part replacement as a result of virus infection and spyware. With growing reliance of companies on digital information and technology, security-related business disruptions are becoming a major concern. Businesses such as banking, retail, civil aviation, digital television and radio, online music sales, VoIP telephony systems and many others can be completely shut down by security attacks. The same goes for Web advertising and digital media distribution. In these businesses, service disruption translates directly into loss of customers and revenue. According to the Computer Crime Research Center, in May 2006, alone, more than 20,109 e-mails and 11,976 phishing web sites, representing 137 hijacked brands were reported and tracked by the Anti-Phishing Working Group of the Center (APWG). In the United States, it was estimated that between May 2004 and May 2005, 1.2 million Internet users were victims of phishing, totaling approximately $929 million. In the United Kingdom, losses from phishing almost doubled to £23.2 million in 2005, from £12.2 million in 2004.90 The vulnerability of national infrastructure has also increased due to digitization and computerization. Computerized floodgates, power grids, confidential data of State strategic organizations are at risk, especially in the face of a terrorist attack. Security experts identified several full-scale attacks through the Internet following 11 September: one general onslaught that shut down 300,000 computer servers in just 15 minutes, disabling 911 systems and automated tellers; and one aimed at the White House. The unleashing of a so-called worm the week after the 11 September attacks that blitzed corporate computers caused damage of $3 billion.91 In 2006, in the United Kingdom there were a staggering 3,237,500 cybercrimes committed, according to a new report from online identity specialists Garlik in collaboration with leading criminologists. This means that every 10 seconds one cybercrime was committed in the United Kingdom alone.92 Computer crimes are increasingly prone to have international dimensions. Some of the challenges faced on the international front include: the need to harmonize countries' criminal laws; locating and identifying perpetrators across borders; and securing electronic evidence of their crimes so that they may be brought
89 ConsumerReports.org. 2007 State of the Net. 90 The Computer Crime Research Center (See http://www.crime-research.org/about/). 91 The Computer Crime Research Center (See http://www.crime-research.org/about/). 92 One cyber crime every ten seconds, September 9, 2007 (daniweb.com).
Governing the evolving Internet in the UNECE region 81
to justice. Complex jurisdictional issues arise at each step. Hence, in developing a new model of the Internet Governance this challenge needs to be taken into consideration too. Furthermore, in order to ensure the compliance of Internet participants with public social and moral norms, representatives of individual Internet users need to be given an opportunity to express their concerns and to influence the development of an institutional framework for cyberspace. The issues, such as the content of online materials, the quality of goods and services provided by Governments and companies, personal data protection and security of financial and other transactions conducted by consumers online represent only a short list of issues of concern to some groups of the Internet users. Therefore, the challenges posed by the evolving Internet cannot be met by applying technical methods alone and without participation of all the parties concerned: the State, the private sector and the civil society. This implies the need to develop a tripartite partnership upon which a new Internet Governance model could be designed. However, for the Internet survival it is also crucial to identify a proper role and function of each of the parties to Internet management.
3.2. The stakeholders
Since leaving the premises of research laboratory, the evolving Internet has been increasingly affecting the lives and activities of different social groups (civil servants, businessmen, youth and children, parents, researchers and educators, cultural communities, among others). Progressively, the ranks of those having vested interests in the Internet development have grown, bringing new issues to the agenda of global Internet Governance.
3.2.1 Governments
Contrary to a prevailing perception, the role of Governments in the development of the Internet in the UNECE region has been remarkable and multifaceted. Firstly, Government in many countries of Europe has heavily invested in and made public funds available for both research activities and the Internet physical infrastructure development (table 15)93. Secondly, Governments have been proactive in setting up an institutional regime conducive to development of the ICT sector. Thirdly, Governments have subsidized or fully financed programmes and projects, which have encouraged and accelerated the access and usage of ICT and the Internet, in particular, by various social groups. Fourthly, Governments have undertaken targeted efforts to narrow digital divides both within and between the countries of the region, initiating and supporting various programmes and projects tailored to specific needs and requirements of people with disabilities, the elderly, the long-term unemployed, women and other social groups. At the subregional level, Governments have cooperated in removing obstacles to transborder business operations and cultural networking via the Internet. They have contributed to the development and promotion of uniform ICT standards to improve interoperability and, thus, enabling the seamlessness of information transmission. They have provided various incentives to encourage research and innovation in the ICT area. At the same time, Governments in a significant number of countries have been trying to precisely define their role and set limits of public intervention in the process of development of the Information Society. The experience of the EU represents an example of successful consecutive intervention of the Government in the ICT market operation in the UNECE region. Starting with an information research project (Esprit), one of the specific subprogrammes within an integrated programme of industrial R&D projects, technology take-up measures and liberalization of the ICT market paving the way for the emergence of new ICT products and services, the EU moved to a second stage. This stage entailed a coordinated and comprehensive policy aiming to accelerate economic growth, improve competitiveness and generate new jobs by focusing the efforts on five priority directions: (a) diffusion of the principles of effective ICT
93 Information and Communications Technologies. OECD Communications Outlook 2007.
82 Towards a knowledge-based economy – Europe and Central Asia: Internet development and governnance
usage and development of ICT applications; (b) creation of a legislation stimulating and encouraging private initiative; (c) development of trans-European telecommunication infrastructure; (d) organization and promotion of ICT training; and (e) development of new ICT sectors and technologies. The results transformed the EU into an e-Europe.
Table 30. Public telecommunication investment (excluding spectrum fees) in selected European countries
Source: Information and Communications Technologies. OECD Communications Outlook 2007. At present, the EU is in the process of implementing “i2010 – A European Information Society for Growth and Employment” initiative adopted in 2005, which is seen as a renewed Lisbon strategy. In this initiative, three policy priorities are outlined:
(1) The creation of an open and competitive single market for information society and media services within the EU. To support technological convergence with “policy convergence”, the Commission will propose: an efficient spectrum management policy in Europe; modernization of the rules on audiovisual media services; updating of the regulatory framework for electronic
Governing the evolving Internet in the UNECE region 83
communications; a strategy for a secure information society; and a comprehensive approach for effective and interoperable digital rights management.
(2) The increase of the EU investment in research on ICT by 80 per cent.94 The i2010 initiative identifies steps to put more into ICT research and get more out of it, e.g. by trans-European demonstrator projects to test promising research results and by integrating small and medium sized enterprises better in EU research projects.
(3) The promotion of an inclusive European information society in order to close the gap between the information society’s “haves and have-nots”.95
The important characteristic of the EU policy in the area of ICT and the Internet development has been a strong reliance on partnership with businesses and civil society groups, although there are differences in this respect between the EU countries. Efforts have been undertaken to develop and set up channels and mechanisms allowing on-going consultations with all the stakeholders in order to ensure their involvement in the EU policy formulation and implementation regarding the ICT sector development. The EU has also paid much attention to the build-up of capacity and capabilities of civil society groups, which constitute a necessary precondition of their effective and constructive participation in the Internet Governance. In CIS member States and in Eastern and Central European countries, the Governments’ role in the ICT sector development has also been profound. Most of the ICT infrastructure and research capacity and capabilities currently in place were built up during the Soviet period. Over the period of 2000-2005, total annual investments in telecommunications were relatively unstable and far below the level needed to remove infrastructural bottlenecks (figures 19 and 20). Although in some CIS countries public companies like the Russian Railways or Rostelecom continue to play a leading role in developing and modernizing ICT, new and alternative ICT companies are slowly gaining economic power (and expertise) and beginning to look for new investment opportunities in the sector. Therefore, they are increasingly competing with public or semi-public ICT companies and are anxious to utilize chances provided by public nation-wide e-programmes and projects. Practically all the CIS countries adopted e-strategies and action plans, which are a result of learning and continue being adjusted in response to pressure of the above-mentioned groups. Some government agencies have been innovative in designing mechanisms of interaction with other stakeholders. In some of the CIS countries, in the Russian Federation in particular, regional and local governments have been active and effective in promoting ICT usage among SMEs, educational establishments and government agencies. However, the framework of local initiatives varies from country to country due to a number of reasons, among which the availability of financial resources has been the most important one. Therefore, it is not surprising that capitals and the largest cities are most advanced in terms of the ICT teledencity and Internet penetration. As in the EU, some CIS Governments adopted e-Government, e-education and e-health programmes (Ukraine, Russian Federation, and Azerbaijan, Armenia, Belarus, Georgia, Moldova, Kazakhstan, Kyrgyzstan, Uzbekistan), which are viewed as a catalyst of the informatization process.
94 Europe lags behind in ICT research, investing only €80 per head as compared to €350 in Japan and €400 in the United States. 95 The Commission will propose: an Action Plan on e-Government for citizen-centered services; three “quality-of-life” ICT flagship initiatives (technologies for an ageing society, intelligent vehicles that are smarter, safer and cleaner, and digital libraries making multimedia and multilingual European culture available to all; and actions to overcome the geographic and social “digital divide”, culminating in a European Initiative on e-Inclusion.
84 Towards a knowledge-based economy – Europe and Central Asia: Internet development and governnance
Figure 19. Annual total investment in telecommunications in selected CIS countries, 1995-2005 (% GDP)
Source: ITU. Data reproduced with the kind permission of ITU.
Figure 20. Annual total investment in telecommunications in selected Eastern and Central European countries, 1995-2005
(% GDP)
Source: ITU. Data reproduced with the kind permission of ITU.
Figure 58. Selected CIS Countries: Annual Total In vestment in Telecommunications, 1995-2005
(% GDP)
-0,5
0
0,5
1
1,5
2
2,5
3
3,5
4
4,5
5
1995 2000 2001 2002 2003 2004 2005
Armenia
Azerbaijan
Belarus
Georgia
Kazakhstan
Kyrgyzstan
Moldova
Russia
Tajikistan
Turkmenistan
Ukraine
Uzbekistan
Figure 59. Selected Eastern and Central European Co untries: Annual Total Investment in Telecommunications, 1995-2005
(% GDP)
0
0,5
1
1,5
2
2,5
3
3,5
1995 2000 2001 2002 2003 2004 2005
Albania
Bosnia andHerzegovinaBulgaria
Croatia
Czech Republic
Estonia
Hungary
Latvia
Lithuania
Poland
Romania
Slovak Republic
Slovenia
Governing the evolving Internet in the UNECE region 85
The ICT regulatory regime in most of the CIS Member States is far from being fully developed (table 31). In some of the CIS it is at the initial stage of formation (Tajikistan, Turkmenistan, Georgia). In some others it still needs further perfection.
Table 31. The emerging regulatory regime in selected CIS countries
Regulatory environment for electronic communications
Country Inter-connection
Numbering
Facility sharing
and collocation
Tariff policy
Leased lines
Licensing and
authorization
Spectrum regulation
Armenia x x x x x x x
(limited) Azerbaijan x x x x x x Belarus x x x x x Georgia x x x Kazakhstan x x x x x Moldova x x x x x x x
Russian Federation
x
In the process
of change
x x x x
Ukraine x x x x x x Uzbekistan x x x x x x
Regulatory environment for online services Country Digital
signature Payment systems
Taxation issues
Conditional access
Data protection
Illegal content
ISP rights protection
Armenia x x Azerbaijan x x Belarus x x x Georgia x Kazakhstan x Moldova x x Russian Federation
x x In
process x
Ukraine x Uzbekistan x x x
Source: Based on information collected from Government web sites. Although CIS countries have been trying hard to catch up with their European neighbors, they were forced to prioritize their efforts to cope simultaneously with other cardinal challenges associated with the process of transition and the build-up of a market economy. The role of the State in the CIS countries has been transformed, albeit to a different degree. Its direct involvement in the management of the economy has been significantly curtailed in most of the countries of the subregion. As a result, the public sector in the ICT area has been drastically reduced and a vibrant private sector was born. These distinctive development conditions and incompleteness of transition coupled with the unevenness of development between and within CIS countries predetermined a choice of priorities and emphasis, which differs to some extent from that of the EU. The analysis of ongoing conceptual debates and current situations in the CIS countries allows assuming that in the nearest future most CIS Governments will be focusing on:
(a) Creating and/or perfecting ICT legislation;
(b) Building up and/or extending ICT infrastructure;
(c) Human resources development (e-education, e-literacy);
(d) Improving information security;
(e) E-Government.
86 Towards a knowledge-based economy – Europe and Central Asia: Internet development and governnance
3.2.2 The private sector
The outstanding contribution of the private sector to Internet development is well recognized and appreciated. Until recently it was able to provide technical and business solutions to most of the problems arising in the course of the Internet evolution, including some problems of a moral nature (for example, online abuse of minors). However, today the private sector needs partnering with other stakeholders in order to ensure fair competition in the cyberspace, access to emerging cyber markets, security and predictability – all the conditions that enable wealth creation activities. Because of the very nature of the private sector and its focus on profit maximization, it would be naïve to expect that the private sector alone could solve societal problems which are at the root of digital divides. But it can provide technical ideas and contribute to solving such problems, in partnership with the public sector or if the right incentives are in place. In many countries in transition of the region, ICT businesses are reluctant to the idea of collective bargaining and action, although in some countries the creation of business and/or professional associations has accelerated (table 32). Factors impeding the self-mobilization of the business community in countries in transition include:
• Lack of organizational experience;
• Lack of mutual trust;
• Predominance of small and medium-sized firms among the ICT enterprises;
• Absence of formal channels of public-private dialogue;
• Monopolization and high concentration of real market power in the hands of few companies (in some instances);
• Attitudinal problems (reliance on support of friends or relatives; underestimation of the value of consulting and advising services);
• Corruption;
• High costs of self-organization and peering activities, both in terms of time and money.
In Ukraine, Russian Federation, Kazakhstan, Kyrgyzstan, ISPs and other professional and business groups, such as programmers, ICT engineers and others set up professional associations and forums at which they have been trying to work out common strategies regarding current development trends in the area of ICT. Their aim is to reach a consensus on technical issues relevant to the development of the Internet and the Information Society, and to contribute to the formulation of national e-strategies and the implementation of national action plans. Nonetheless, it is necessary to underscore that the potential of the private ICT sector to contribute to the development of an Information Society is far from being fully utilized in most countries in transition, although in some countries the situation has been rapidly changing. SMEs in most countries of the region have been lagging behind in the ICT uptake and, therefore, have not been active in pursuing their interests in the area of informatization. Such a situation affects the overall demand for ICT and Internet services in the region and, therefore, results in the loss of market opportunities due to a lower competitiveness of SMEs. SMEs make up the vast majority of businesses in all the countries of the region. In the EU alone there are 23 million SMEs. They account for 99 per cent of all enterprises and provide 75 million jobs. In some industrial sectors they contribute to up 80 per cent of employment (for example in textiles, construction and furniture).96
96 EU ICT Task Force Report 2006. Fostering the Competitiveness of Europe’s ICT Industry.
Governing the evolving Internet in the UNECE region 87
Table 32. Major representative business associations, forums and/or business groups in the ICT sector in selected CIS countries
Country Representative business association, forum and lobbying group
Russian Federation
- GSM Association - Association of Telephone Operators - Cable Television of Association; - Electronic Data Interchange Association - The Union of Internet Operators - AFK Systema - Alfa-Group/Altima - Telecominvest
Ukraine
- Ukrainian Union of Entrepreneurs and Industrialists (USPP)
- Internet Association of Ukraine - Ukrainian Wireless Association
Azerbaijan - Azerbaijan ISP Association (AziSPA) - annual business forum – dialogue with the President and
Government representatives
Belarus - Infopark (an association of IT companies, mainly
software developers)
Georgia
- Telecommunication League - Broadcasters Association - Cable TV Association - Internet Association
Kazakhstan
- National Telecommunications Association - Consultative Council of the Agency on Informatisation
and Communications - Council of Operators
Uzbekistan - Association of IT Companies and Organizations (2005) - Association of Business Incubators and Technology
Parks in Uzbekistan (ABIT) Tajikistan
- Association of ISPs
Moldova
- Union of Communications Sector of Moldova - Association of Patronage of Telecommunications and
Informatics (APOTIM) - Association of Private Operators
Armenia - Union of Information Technology Enterprises - Government IT Development Supporting Council
Source: Various publications and Internet sources. There are a number of factors that hold back the ICT uptake by SMEs in the UNECE region:
• Lack of ICT awareness;
• Lack of financial resources;
• Lack of ICT skills and digital literacy;
• High costs of ICT services.
Business groups with significant lobbying power
88 Towards a knowledge-based economy – Europe and Central Asia: Internet development and governnance
In many countries of the region specific programmes aiming to accelerate the ICT uptake by SMEs have recently been put in place. In Russia, for example, such programmes have been launched by various stakeholders at the local level. For example, St. Petersburg Foundation for SME Development provides ICT training within four modules:97
(1) “Using ICT for increasing effectiveness of SMEs”;
(2) “Information technologies in business”;
(3) “Introductory training course on e-commerce”;
(4) “Keys to online trade information”.
A great number of programmes (both at the national and region-wide levels), whose specific purpose is to enable SME acquisition of ICT capabilities and capacities exist in the EU region. Promoting SME use of ICT involves:
• Improving technical and management skills (Digital literacy initiative);
• Making appropriate e-business solutions available for SMEs;
• Addressing the high cost of ownership of ICT equipment;
• Tackling security and privacy issues (Privacy Enhancing Technologies initiative);
• Making available SME-specific information on e-business (e-Business Support Network for SMEs initiative);
• Promoting e-Government: reducing administrative overheads and creating an incentive to engage in e-business (e-Government).
3.2.3 Civil society groups
In most countries in transition, NGOs representing Internet end-user groups are too few (table 33). A similar situation exists in other countries in transition of the region. Their organizational capacity and financial resources are extremely limited to generate a noticeable impact on ICT policies and/or to effectively contribute to the Internet Governance. Furthermore, most of the existing civil society groups (except for ICT professional and research associations) lack capability to formulate realistic policy recommendations due to the knowledge and expertise gap. This lack of knowledge and understanding of the Internet as a new and unique medium in its turn increases the risk of excessive politization of the issues which are purely technical in nature and could be solved by technical rather than political means. There are other factors constraining the participation of civil society groups in the Internet Governance in the region. A significant proportion of the population in many countries is not familiar with the Internet. At the same time the participation of representative civil society groups in ICT policy formulation is crucial for maximizing economic and social benefits associated with effective utilization of the Internet potential (for example in the areas of medicine; agriculture; public services; wholesale and retailing; travel and tourism; access to new markets and clientele, particularly, for micro and small businesses, among others).
Governing the evolving Internet in the UNECE region 89
Table 33. Major civil society groups/NGOs active in the area of informatization and the Internet governance in selected CIS countries
Country Civil society group/NGO
Russia - Association of Protection of Consumer Rights - E-Development Partnership (multistakeholder
organization)
Ukraine - Internet Association of Ukraine - Ukrainian Internet Community - Virtual Internet Society
Armenia - Armenian Internet Society, Armenia’s chapter of
ISOC Azerbaijan - Azerbaijan Internet Society
Kazakhstan - Association of Protection of Consumer Rights - National League on Protection of Consumer Rights
Georgia - Internet Society, Georgia’s Chapter of ISOC - Internet Academy
Source: Online resources. While NGOs with special interests in the ICT development are not numerous, other civil society groups (educators, parents, social movements, youth organizations, organizations of people with disabilities, rural associations, medical professional associations and others) have shown a growing interest in utilizing the Internet in their activities. Many of these organizations have set up their own websites, containing databases and information pools needed for networking, activities support, advocacy and action mobilization. Some are offering ICT training courses to improve e-literacy and e-skills of their members.
91
Chapter 4
CONCLUSIONS AND RECOMMENDATIONS
The above analysis of the situation in the UNECE region demonstrates that the development of the Internet has been extremely uneven across the UNECE member States. Even in the most advanced countries of the region various digital gaps persist between urban and rural regions and between social groups.
4.1 Conclusions
On the demand side, a number of constraining factors appeared responsible for the lack of affordability and access to ICT and Internet and, consequently, for digital differentiation between and within countries:
(a) Differences in the availability of ICT/Internet physical infrastructure and, therefore, differences in the level of ICT and Internet penetration;
(b) Differences in per capita income;
(c) Unequal distribution of income, discrimination and/or mental barriers (for instance in the case of the elderly);
(d) High costs of the ICT equipment (hardware and software) and services;
(e) Lack of awareness of the potential benefits associated with the ICT and the Internet usage;
(f) Lack of trust in the security of online economic transactions;
(g) Reluctance of businesses to uptake informatization of their business operations;
(h) A relatively low level of e-literacy and e-skills among population.
On the supply side, the most important impeding factors were identified as follows:
(a) Monopolization of the ICT sector, and, consequently, the lack of competition;
(b) Loopholes in and/or an underdeveloped ICT institutional regime;
(c) A lack of and/or restricted access of businesses to public financial resources;
(d) Insufficient and unstable level of public and private investment in the ICT/Internet infrastructure development;
(e) Bureaucratization of the decision-making process and implementation of e-development strategies and plans of action;
(f) A relatively high level of the ICT market entry costs.
The exact combination of the demand and supply constraining factors varies from country to country and from subregion to subregion, resulting in differences in e-development priorities, means and methods of implementation of national e-development strategies. By applying these as criteria, the following country-groups could be distinguished:
(a) Advanced countries (Western European and Northern European countries mainly) with a high level of ICT development and penetration. Their main focus at this stage is to accelerate effective usage of ICT and the Internet by businesses and consumers and deepen the Internet
92 Towards a knowledge-based economy – Europe and Central Asia: Internet development and governnance
penetration in order to gain in competitiveness of national produce and quality of life of the population;
(b) Countries with an upper medium ICT development level (some Baltic, Central and Southern European countries). Their main focus is on extending the Internet outreach horizontally and vertically by means of e-Governance, e-education and targeted e-Inclusion program;
(c) Countries with a lower medium ICT development level (some Central, Eastern, Southern
European and Balkan countries, including Kazakhstan, Ukraine, Belarus and the Russian Federation). Their main focus is on horizontal extension of the ICT and Internet physical infrastructure, furthering and improving the institutional regime, digitization of public agencies and services, and investing in ICT education and research facilities;
(d) Countries with the lowest level of ICT development and Internet uptake (most of the Central
Asian, South Caucasus and some Eastern and Southern European countries). Their main focus is raising awareness of ICT and the Internet, establishing an enabling institutional environment, and widening the access to the Internet by means of PIAP.
Some countries (Kazakhstan and the Russian Federation, for example) cannot be placed neatly into the above classification. The Russian Federation possesses enormous potential in terms of capabilities and investment resources, which, under the right institutional conditions and by means of effective e-development policies and instruments, could bring the country back to the club of leaders in the area of ICT research and development. Kazakhstan with its huge territory and small population needs to invest heavily in both human capital and physical infrastructure in order to overcome a significant rural-urban and geographic digital divides. With regard to Internet Governance, in many countries of the region, especially the CIS, some Southern European and Balkan countries, either the Government agencies alone or the Government with a very modest private sector involvement have been making decisions regarding the Internet. Attempts by some professional or civil society non-for-profit groups to gain influence in the decision-making process concerning various ICT and Internet development issues have not been very successful.
4.2 Recommendations
4.2.1 At the national level
(a) It is obvious that many countries in the region need to bring together all the interested parties into the process of decision-making and implementation of national e-development strategies and plans of action. To meet this task, dialogue channels and negotiation mechanisms need to be designed and put in place within the framework of e-Government programmes;
(b) Various public-private partnership schemes should be considered as a means of overcoming financial constraints and as a means of implementing national e-programmes and projects;
(c) Technoparks, ICT business incubators and free trade zones could be more widely and actively employed as a means of accelerating the ICT and Internet penetration;
(d) Public funding of ICT projects and programmes should be made equally accessible to large and small businesses, and procedures including tendering should be made transparent;
Conclusions and recommendations 93
(e) International cooperation in the form of outsourcing, contracting out, joint ventures and full foreign ownership could be considered as an alternative source of financing for overcoming the lack of domestic investment resources;
(f) Business “angels” supporting venture enterprising, especially, among special social groups should be publicly recognized and encouraged, including by fiscal incentives;
(g) Large companies with their own backbone ICT networks could be encouraged to cooperate more actively with local small and alternative ICT firms and ISPs in implementing local e-development projects. Central and local Governments could stimulate such cooperation by bringing big and small companies into public ICT projects and programs;
(h) Establishing local chapters of the Internet Government could be considered as a means to bring all the stakeholders into the decision-making process. They could be instrumental in identifying effective and efficient solutions to local e-development bottlenecks;
(i) The Governments should focus on ensuring a high level of protection of the ICT and Internet critical resources, online business transactions and privacy. Effective solutions could be identified by the private and civil society groups;
(j) The Governments should also take additional steps to raise Internet awareness of the population. The possibility of employing mass media channels (public TV, for example) and public ICT affordable training courses, including long-distance courses could be considered among the available awareness-raising instruments.
4.2.2 At the regional level
(a) The UNECE region has established a dense cross-country cooperation and interaction network, including in the area of ICT and Internet development. Further efforts are needed to bring these interdependent relations to a higher level. In the area of ICT and Internet development, cross-border cooperation programmes and projects could contribute to furthering ICT development in the countries which are regional ICT development laggards. The experience of Estonia could serve as an example of how a country with a low initial level of ICT development could benefit from inclusion in the ICT network of a more advanced country. Other examples of successful cross-border cooperation can be found (for example, between the Russian North-West region and the Nordic countries), which could be replicated by others;
(b) At the regional level it would be useful to set up a network of the national Internet Governance Chapters as well as an annual Forum of the national chapters in one of the region’s countries. This could serve as a consultation channel and/or mechanism of the Global Internet Governance and provide the region and its stakeholders with an opportunity to participate in the Global Internet Governance.
4.2.3 At UNECE
(a) The UNECE could further mainstream ICT into its current programmes and projects. In particular, implementation strategies to exploit the benefits of ICT should continue in such areas as trade, especially tools for electronic business; collection and dissemination of statistical information; encouraging digital democracy to promote public participation in environmental decision-making; intelligent transport systems; and measures to promote a gender-sensitive Information Society;
94 Towards a knowledge-based economy – Europe and Central Asia: Internet development and governnance
(b) The UNECE could contribute to Internet development and governance through cooperation with the follow up process to the World Summit on the Information Society and, in particular through cooperation with the United Nations Regional Commissions.
(c) UNECE under the SPECA framework could further contribute knowledge-based development of the SPECA member countries and facilitate regional cooperation in Central Asia. It could continue its support on capacity-building activities on ICT policy development as well as the ICT access point project financed by the United Nations Development Account under the new Project Working Group on Knowledge-based Development (PWG on KBD).
95
REFERENCES
Budde Paul. Europe (Eastern) Telecoms, Mobile & Broadband Overview and Analysis 2006-2007. (www.budde.com.au).
CIA. The World Factbook, 2006 and 2007. https://www.cia.gov/library/publications/the- world-factbook/index.html).
Commission of the European Communities. i2010 – Annual Information Society Report 2007, Volume 3, Brussels, 30.3.2007, SEC(2007) 395.
Commission Staff Working Document. Europe’s Liberalized Telecommunications Market – A Guide to the Rules of the Game. (http://europe.eu.int/comm/dg04/)
Communications: The Next Decade. A collection of essays prepared for the United Kingdom Office of Communications. November 2006.
Economist Intelligence Unit. The 2005 e-readiness ranking. A white paper from the Economic Intelligence Unit, 2005.
Empirical. Thematic Study to Analyse Policy Measures to Promote Access to Information Technologies as a Means of Combating Social Exclusion. Final Report, February 2007. Bonn.
Empirical/World Research Centre/University of Bath. Thematic Study to Analyze Policy Measures to Promote Access to ICT as a Means to Combating Social Exclusion. Final Report, February 2006, Bonn, 2006.
EU. Equality and Non-discrimination. Annual Report 2006.
EU ICT Task Force Report 2006. Fostering the Competitiveness of Europe’s ICT Industry.
European Internet Exchange Association. 2006 Report on European IXPs. October 2006 (www.euro-ix.net)
Eurobarometer. Poverty and Exclusion, September 2007.
Eurobarometer. Safer Internet for Children. Qualitative Study in 29 European Countries. Summary Report, May 2007.
Governing the Internet. Freedom and Regulation in the OSCE Region, Vienna, 2007.
Georgia: Structural Reforms Support Project Regulatory Development, GNCC, DETECON-WB-GNCC, August 2003.
Huston Geoff. Exploring Autonomous System Numbers. The Internet Protocol Journal, Volume 9, No. 1, 2006.
International Telecommunication Union. World Telecommunication/ICT Development Report 2006. Executive Summary. Geneva, 2006.
IDATE Consulting and Research. Broadband Coverage in Europe, Final Report, 2006 Survey, November 2006.
96 Towards a knowledge-based economy – Europe and Central Asia: Internet development and governnance
ITU/UNCTAD. World Information Society Report 2007. Beyond WSIS. Geneva, June 2007.
ICANN. Guidelines for the Implementation of Internationalized Domain Names Version 1.0, 20 June 2003.
Internationalizing Domain Names in Applications, Network Working Group. RFC: 3490, March 2003.
OECD. Information Technology Outlook 2006. OECD, 2006.
Political Intelligence. Final Report: Monitoring of Russia and Ukraine (priority 1), and Armenia, Azerbaijan, Georgia, Kazakhstan and Moldova (priority 2): Telecommunications and the Information Society. Commission contract No: 30-ce-0009814/00-41, December 2006.
McMahon, Michael, Gabriel Sterne and Jamie Thompson. The role of ICT in the global investment cycle. Working Paper No. 257. Bank of England, 2005.
Microsoft. Small companies, Big Ideas: Turning Potential into Growth. June 2007.
MINC. De-Fragmenting the Internet Namespace. June 2006.
NRO. Internet Number Resources Status Report, June 2007.
OECD E-Government Studies. The e-Government Imperative. OECD, 2003.
OECD. Working Party on Information Security and Privacy. The Development of Policies for the Protection of Critical Information Infrastructures (CII). A comparative analysis in four OECD countries: Canada, Korea, the United Kingdom and the United States. DSTI/ICCP/REG (2006)15/FINAL. 06-Feb-2007.
Ofcom Office of Communications. The International Communications Market 2006. Research document, November 2006.
Ofcom Office of Telecommunications. The Consumer Experience. Research Report, November 2006.
Radovcic Serge. Euro – IX Report. VIX Technical Meeting. “Ten years of VIX”, Vienna, 23 November 2006.
Sachdeva, Sameer. Twenty Five Steps to Successful e-Governance, National Institute for Smart Government. 2007. (www. pdffactory.com).
Sokolova, Marina. Improving the Quality of eGOV Strategies in Belarus, Ukraine and Lithuania through Citizen Participation in eGOV Planning. Policy paper. Central European University/Open Society Institute, 2006.
The European e-Business Report, 2006/07 edition, EU publication, Bonn, January 2007.
The Eighth report on the implementation of the telecommunications regulatory package – European telecoms regulation and markets 2002. COM (2002) 695 final.
The Public Opinion Foundation. Project, The Internet in Russia/Russia on the Internet. Eighth release. Winter 2006-2007.
United Nations. Global E-Government Readiness Report 2005. From e-Government to e-Inclusion. New York, 2005. UNPAN/2005/14
References 97
United Nations. Department of Economic and Social Affairs. Compendium of Innovative e-Government Practices. New York, 2007. ST/ESA/PAD/SER.E/96
United Nations Conference on Trade and Development. Information Economy Report 2006. The Development Perspective. New York and Geneva, 2006. Sales No.: E.06.II.D.8
VeriSign Domain Report. The Domain Name Industry Brief. Volume 4, Issue 5, August 2007.
West, Darell. M. Global E-Government 2006. Brown University, August 2006.
World Bank. 2006 Information and Communications for Development. Global Trends and Policies. Washington, D.C., 2006.
World Economic Forum. The Global Information Technology Report 2005-2006. Leveraging ICT for Development. 2006.
World Economic Forum. The Global Information Technology Report 2006-2007. Connecting to the Networked Economy. 2007.
World Summit on the Information Society. Tunis Commitment. Document WSIS-05/TUNIS/DOC/7-E , 18 November 2005.
Winther, Mark. Tier 1 ISPs: What They Are and Why They Are Important. IDC White Paper, May 2006.