188

TOWARDS A SUSTAINABLE FUTUREFRASER AND NEAVE, LIMITED A N N UA L R E P O RT 2 0 1 6

Key
Hig
hlig
hts
7.5¢Earnings Per
Share (Basic)1,2
+70%
Key
Hig
hlig
hts
Notes:1 Continuing operations2 Before exceptional items3 PBIT denotes profit before interest, taxation and exceptional items; continuing operations only
Key
Hig
hlig
hts
#1Soft Drink in Malaysia
Isotonic Drink in Singapore
100PLUS is
new F&B products launched
in FY2016
20

export markets
106
Key
Hig
hlig
hts
Net Cash+5%
$908m
PBIT3
+36%
$179m
Key
Hig
hlig
hts
Key
Hig
hlig
hts
Soya Milk in Singapore and Malaysia
F&N NUTRISOY is
#1
Key
Hig
hlig
hts
F&N is delivering on our commitment
towards a sustainable future. Leveraging
our capillaries Reach in existing markets,
building on the strength and Diversity of
our Brands, and seeking out Growth
opportunities in new markets, we are
delivering sustainable value every day to
our stakeholders. Together with our
reputation for Professionalism, integrity
and innovation, we are geared towards
delivering on our vision to be a stable
and sustainable Food & Beverage leader
in the ASEAN region.
TOWARDS A SUSTAINABLE FUTURE

CONTENTS
0204 07 08 1012 18 22 2932 33
FY2016 Key HighlightsTowards A Sustainable FutureMilestonesCorporate ProfilePerformance at a GlanceGroup Financial PerformanceGlobal PresenceThe F&N Integrated Business ModelVision 2020Message from our ChairmanBoard of DirectorsGroup ManagementCorporate StructureCorporate Information
66 67 68 7091174
Investor RelationsCapital ResourcesEnterprise-Wide Risk Management Corporate GovernanceFinancial ReportNotice of Annual General MeetingProxy Form
CEO Business Review
Food & Beverage Overview
Food & Beverage – Beverages Core market • Malaysia Core market • Singapore
Food & Beverage – Dairies Core market • Malaysia Core market • Thailand Core market • Singapore Ice Cream
Food & Beverage – New Market Myanmar Vietnam Thailand
Publishing & Printing Group Results Publishing Print Retail & Distribution
34
3842
46 495254
56586062 636565
Only available in digital format Download it at www.fraserandneave.com/investor-relations/corporate-sustainability
SUSTAINABILITYREPORT2016
Accompanying this report: F&N Sustainability Report

JOURNEYING TOGETHER Since 1883
The Singapore and Straits Aerated Water Company went public as Fraser and Neave, Limited.
Coca-Cola’s franchise was secured for Singapore and Malaysia.
Formation of Malayan Breweries Limited (renamed Asia Pacific Breweries (“APB”) in 1990. APB is now known as Heineken Asia Pacific Pte. Ltd.) with Heineken to produce beer. Tiger beer was launched the next year.
John Fraser and David Chalmers Neave established The Singapore and Straits Aerated Water Company to produce carbonated soft drinks.
Acquired Warburg, a leading player in Singapore’s vending market.
1883
2016
18981936
F&N became a part of Thailand’s TCC Group, one of the largest companies in Thailand with businesses in food and beverage, real estate, industrial trading and consumer products, insurance and agriculture.
F&N distributed $3.28 per share in cash to shareholders, an aggregate amount of $4.73 billion, which was substantially the Company’s gain from the APB sale.
F&N secured a 22-year licensing agreement with Nestle for the manufacture and distribution of Nestle’s canned milk products in ASEAN.
F&N sold its 55% stake in a brewery in Myanmar for a cash consideration of US$560 million.
Spun off Frasers Centrepoint Limited (“FCL”) via a distribution in-specie of two FCL shares for each F&N share, at no cost to shareholders. FCL was successfully listed on the SGX on 9th Jan 2014.
2014
2015
2013
1931

Over 130 years ago, two visionaries set up a modest company to produce carbonated soft drinks. This company eventually became Fraser and Neave, Limited (“F&N”), a leading Asia Pacific Consumer Group in the region with expertise and prominent standing in the Food & Beverage and Publishing & Printing industries.
Restructured Malaysia’s soft drinks, dairies and glass businesses under Fraser & Neave Holdings Bhd (“F&NHB”), in compliance with National Development Policy of Malaysia.
Entered a joint venture with Beatrice Foods of Chicago to build the region’s first sweetened condensed milk plant in Petaling Jaya, Malaysia.
F&N divested its stake in F&N Coca-Cola Pte Ltd, retaining only soft drinks business in Malaysia under F&NHB.
Acquired 20.1% stake in Times Publishing Group. A takeover offer was subsequently launched for the company.
Dairy production commenced in Singapore.
F&N entered Myanmar’s beer market.
The dairy and property interests (Centrepoint Properties) of Cold Storage Holdings Ltd were acquired.
F&N Coca-Cola Pte Ltd was formed as an anchor bottler for The Coca-Cola Company in Singapore, Malaysia, Brunei, Vietnam, Cambodia, Sri Lanka, Nepal and Pakistan.
1959
Relocated its Singapore brewery and soft drinks plant to free up the prime sites for development. The Group’s second core business, Properties, was formed.
1985
Divested APB for a cash consideration of $5.6 billion.
F&N acquired Nestle’s canned and liquid milk business in Malaysia and Thailand.
2006
1968
1992
2012
1996
1999
1990
1995

CORPORATE PROFILE
Established in 1883, Fraser and Neave, Limited (“F&N”) is a leading Southeast Asia Consumer Group with expertise and prominent standing in the Food & Beverage and Publishing & Printing industries.
Leveraging its strengths in marketing and distribution; research and development; brands and financial management; as well as years of acquisition experience, F&N provides key resources and sets strategic directions for its subsidiary companies across both industries.
Listed on the Singapore stock exchange, F&N ranks as one of the most established and successful companies in the region with an impressive array of renowned brands that enjoy strong market leadership. F&N is present in 12 countries spanning Asia Pacific, Europe and the USA, and employs 6,813 people worldwide.
For more information visit www.fraserandneave.com
VISION
To be a stable and sustainable Food & Beverage leader in the ASEAN region.
MISSION
To be ASEAN’s leading owner and provider of quality and innovative products that consumers choose and trust. To support our mission, we are guided firmly by our commitment to great value, the community, diversity and the environment.
2 Fra s e r a n d N ea v e , L i m i t e d & S u b s i d i a r y C o m pa n i e sA n n u a l R e p o r t 2 0 1 6

STRATEGIC DIRECTIONOur goal is to be the ASEAN consumer’s trusted source of dairy and beverage products, embodying the Group’s ‘PURE ENJOYMENT. PURE GOODNESS’ philosophy. To achieve our goals, we have established several strategic pillars:
CLEARLY-TARGETED PORTFOLIO OF BRANDS AND PRODUCTS
F&N embraces a brand portfolio strategy in order to maximise consumer reach. This approach allows the Group to seize opportunities from multiple segments, providing distinct and relevant products to a wide demographic spectrum of consumers. While we continue with our brand portfolio strategy, we will also focus our investment on and drive the growth of our Power Brands.
LEADING THROUGH INNOVATION
F&N fosters a culture of creative thinking and embraces changes. The Group requires its businesses to generate new innovation each year, in product development or processes, so as to maintain sustainable leadership in the industry.
STRIVING FOR COMMERCIAL EXCELLENCE
Commercial excellence is all about strengthening the way we market, distribute and sell our products in order to deliver excellent customer experiences and forge closer relationships with consumers – and ultimately drive consumer loyalty.
We continuously identify and strengthen levers to improve operational efficiency, increase brand presence and sell-through, and streamline internal processes to accelerate decision-making and make our organisation leaner and more efficient.
INVESTMENTS FOCUSING ON RIGHT TO WIN
F&N targets leading market positions in all markets in which we compete. We prioritise our investments in markets where we have a right to win. We look at markets that offer the best medium- to long-term growth and profitability opportunities, encompassing the way we compete, our capabilities with which we will compete, and portfolio decisions. In this respect, we place considerable emphasis on expanding our activities in Southeast Asia, particularly Indonesia, Myanmar and Vietnam.
COMMITTING TO TALENT DEVELOPMENT
F&N recognises that its People are a key enabler of its strategies. Our People are at the centre of our universe. Our strategy incorporates a roadmap for attracting, developing and retaining our most valuable asset – People. The Group sets out specific, actionable steps that are either already in place, or under development, to support our businesses in becoming the best at what they do.
3Fra s e r a n d N ea v e , L i m i t e d & S u b s i d i a r y C o m pa n i e s A n n u a l R e p o r t 2 0 1 6

PERFORMANCEAT A GLANCE
FY20
06
FY20
09
FY20
12
FY20
15
FY20
16
Revenue ($m)
3,802 5,146 5,543 2,457 1,979
2,436 3,175 3,589 336 – Discont’dOperations2
Cont’dOperations
TotalOperations
10-Year CAGR +4%3
Increase from FY2006 +45%3
1,366
1,971 1,954 2,121 1,979
ttri ta e Profit Before air a e Adjustment & Exceptional Items ($m)
13 53
3863
109
FY20
06
FY20
09
FY20
12
FY20
15
FY20
16
295 462 472 115 109
282 408 434 52 –
Cont’dOperations
TotalOperations
Discont’dOperations2
10-Year CAGR +24%3
Increase from FY2006 +725%3
Profit Before Interest & Taxation ($m)
100 134
87132
179
FY20
06
FY20
09
FY20
12
FY20
15
FY20
16597 799 952 255 179
497 664 865 123 –
Cont’dOperations
TotalOperations
10-Year CAGR +6%3
Increase from FY2006 +79%3
Discont’dOperations2
Total Assets ($m)
2,510 2,150 2,485
3,143 3,773
FY20
06
FY20
09
FY20
12
FY20
15
FY20
16
9,667 13,868 14,651 3,143 3,773
7,156 11,718 12,166 – –
Cont’dOperations
TotalOperations
10-Year CAGR +4%3
Increase from FY2006 +50%3
Discont’dOperations2
4 Fra s e r a n d N ea v e , L i m i t e d & S u b s i d i a r y C o m pa n i e sA n n u a l R e p o r t 2 0 1 6

FY20
12
FY20
13
FY20
14
FY20
15
FY20
16
Distribution
Dividend (cents)Payout ratio (%)
18.0 15.57
5.06,7 5.0 4.5
54%
41%7
50%7
63% 60%
FY20
06
FY20
09
FY20
12
FY20
15
FY20
16
Market Capitalisation4 ($m)
5,231 5,408
13,3555
3,177 3,079
are of Profit Before Interest & Taxation B B siness e ment ( )
100 100TotalOperations
FY20
06
FY20
16
– 83
7343
13
24
66
-3Discont’dOperations2
Cont’dOperations
Notes:1 FY2006, FY2009, FY2012 and FY2015: As previously reported2 Upon the disposal of Asia Pacific Breweries Limited/Asia Pacific Investment Pte Ltd (‘’APB/APIPL’’) and Myanmar Brewery Limited (“MBL”),
and the distribution in-specie of Frasers Centrepoint Limited (“FCL”), the results have been classified as discontinued operations 3 Excludes discontinued operations of APB/APIPL, FCL and MBL4 Based on issued shares at close of business on the first trading day after preliminary announcement of results5 F&N distributed approximately $5.4b to shareholders via two capital reduction exercises in July 2013 ($4.7b) and April 2014 ($607m). In
January 2014, F&N relisted its property arm, FCL by undertaking a distribution in-specie of FCL shares to F&N shareholders. F&N shareholders received, without cash outlay, two FCL shares for each F&N share owned. Shares of FCL were listed by way of introduction on the Mainboard of SGX on 9 January 2014
6 In April 2014, the Group distributed $607m (or $0.42 per share) to shareholders in a capital reduction exercise7 Excludes capital distribution of $3.28 per share in FY2013 and $0.42 per share in FY2014
597 179TotalOperations
44
171920 23
42
119
-5
FY20
06
FY20
16
497 – Discont’dOperations2
Cont’dOperations
Profit Before Interest & Taxation B B siness e ment ($m)
Beverages Dairies Publishing & Printing Others
5Fra s e r a n d N ea v e , L i m i t e d & S u b s i d i a r y C o m pa n i e s A n n u a l R e p o r t 2 0 1 6

PERFORMANCE AT A GLANCE
Oct 2006 Nov 2016
Share Price Performance and Straits Times Index (”STI”)
Fraser and Neave, LimitedShare Price ($)
STI
1
22,646
$4.44
$2.13
2,820
Oct 2006 Nov 2006 Nov 2007 Nov 2008 Nov 2009 Nov 2010 Nov 2011 Nov 2012 Nov 2013 Nov 2014 Nov 2015 Nov 2016
Cumulative Total Shareholder Return (Oct 2006 - Nov 2016): 230%
230%
Notes:1 In July 2013, the Group distributed $4.7b (or $3.28 per share) to shareholders in a capital reduction exercise2 In April 2014, the Group distributed $607m (or $0.42 per share) to shareholders in a capital reduction exercise
6 Fra s e r a n d N ea v e , L i m i t e d & S u b s i d i a r y C o m pa n i e sA n n u a l R e p o r t 2 0 1 6

GROUP FINANCIAL PERFORMANCE5-Year Statistics
Year ended 30 September FY2012 FY2013 FY2014 FY2015 FY2016
Notes1, 2 Profit Statement ($ million)
Revenue 5,543 4,344 3,052 2,457 1,979Profit before taxation - before interest 952 785 453 255 179- before fair value adjustment & exceptional items 868 763 452 255 189- after fair value adjustment & exceptional items 1,239 907 354 225 188Attributable profit
3 - before fair value adjustment & exceptional items 472 545 263 115 109- after fair value adjustment & exceptional items 838 5,430 147 633 108
1 Balance Sheet ($ million)4 Net asset value 7,603 8,505 1,605 2,268 2,843
Total assets employed 14,651 14,145 2,679 3,143 3,773Long-term borrowings 2,972 2,583 119 98 125
Market Capitalisation ($ million)
at close of business on the first trading day after preliminary announcement of results 13,355 8,361
74,277
8,93,177 3,079
1,2 Financial Ratio (%)Return on average shareholders' equity- profit before fair value adjustment & exceptional items 12.0 9.5 8.9 13.2 7.4
3 - attributable profit before fair value adjustment & exceptional items 6.5 6.8 5.2 6.0 4.3
5 Gearing ratio- without non-controlling interests 29.7 17.6 (13.6) (38.1) (32.0)- with non-controlling interests 27.3 16.9 (10.9) (33.8) (28.8)
1,2 Per Share
Profit before fair value adjustment, taxation & exceptional items (cents) 61.1 52.9 31.3 17.6 13.1Attributable profit (cents) (basic) - before fair value adjustment & exceptional items 33.2 37.8 18.2 8.0 7.5- after fair value adjustment & exceptional items 59.0 376.8 10.2 43.7 7.5
4 Net asset value ($) 5.32 5.90 1.11 1.57 1.97Dividend- net (cents) 18.0 15.510 5.010 5.0 4.5
6 - cover (times) 1.8 2.4 3.6 1.6 1.7
Stock Exchange Prices ($)
Notes:1 FY2012 – FY2015: As previously reported2 Upon the disposal of Asia Pacific Breweries Limited/Asia Pacific Investment Pte Ltd (‘ ’APB/APIPL’ ’) and Myanmar Brewery Limited (“MBL”),
and the distribution in-specie of Frasers Centrepoint Limited (“FCL”), the results have been classified as discontinued operations 3 Attributable profit before fair value adjustment and exceptional items: Profit after taxation and non-controlling interests, but before
fair value adjustment and exceptional items4 Net asset value: Share capital and reserves5 Gearing ratio: Sum of bank borrowings and term loans, less fixed deposits and cash and bank balances, expressed as a percentage
of equity6 Dividend cover: Attributable profit before fair value adjustment and exceptional items per share, divided by net dividend per share7 In July 2013, the Group distributed $4.7b (or $3.28 per share) to shareholders in a capital reduction exercise8 In January 2014, the Group completed the relisting of its property arm, FCL by undertaking an in-specie distribution of FCL shares to
F&N shareholders. F&N shareholders received, without cash outlay, two FCL shares for each F&N share owned. Shares of FCL were listed by way of introduction on the Mainboard of SGX on 9 January 2014
9 In April 2014, the Group distributed $607m (or $0.42 per share) to shareholders in a capital reduction exercise10 Excludes capital distribution of $3.28 per share in FY2013 and $0.42 per share in FY2014
7Fra s e r a n d N ea v e , L i m i t e d & S u b s i d i a r y C o m pa n i e s A n n u a l R e p o r t 2 0 1 6

GLOBALPRESENCE
Legend: Beverages Manufacturing Plants Dairies Manufacturing Plants Publishing & Printing Manufacturing Plants Others Manufacturing Plants
HONG KONG
VIETNAM1
AUSTRALIA
CHILEUKUSA
SINGAPORE
INDONESIA
MYANMAR
INDIATHAILAND
CHINA
Note:1 Following the acquisition of an additional 5.4% stake in Vinamilk on
12 December 2016, our stake has been increased to 16.35%
CONTRIBUTION BY SEGMENT
Revenue
29%16%
55%
$1,979m
Total Assets11%
62%
9%
18%$3,773m
ttri ta e Profit Before air a e Adjustment & Exceptional Items
Others
Publishing & PrintingDairies
5%
47%
(6%) 54%
$109m
Others
Publishing & Printing
Dairies
Beverages
Profit Before Interest & Taxation 13%24%
(3%)
66%
$179m
Legend:
Beverages Publishing & Printing Dairies Others
VIETNAMVIETNAM
MALAYSIA
MYANMAR
8 Fra s e r a n d N ea v e , L i m i t e d & S u b s i d i a r y C o m pa n i e sA n n u a l R e p o r t 2 0 1 6

Notes:1 Other ASEAN: Myanmar, Thailand, Vietnam and Indonesia2 Outside ASEAN: China, Taiwan, India, Australia, Europe and USA
CONTRIBUTION BY GEOGRAPHY
SINGAPORE MALAYSIA OTHER ASEAN1 OUTSIDE ASEAN2
-34% from FY2015
-6%
$(11m)
+6% from FY2015
45%
$80m
+64% from FY2015
63%
$114m
+24% from FY2015
-2%
$(4m)
+57% from FY2015
-4%
$(5m)
+23% from FY2015
31%
$34m
+64% from FY2015
77%
$84m
+12% from FY2015
-4%
$(4m)
+4% from FY2015
29%
$1,105m
+5% from FY2015
23%
$857m
+50% from FY2015
44%
$1,673m
-7% from FY2015
4%
$138m
$473m
24%
Same as FY2015
$856m
43%
-13% from FY2015
29%
$564m
Same as FY2015
4%
$86m
-12% from FY2015
9Fra s e r a n d N ea v e , L i m i t e d & S u b s i d i a r y C o m pa n i e s A n n u a l R e p o r t 2 0 1 6

THE F&N INTEGRATED BUSINESS MODEL
OUR KEY RESOURCES VALUE CREATEDManaging and deploying our resources and assets efficiently and effectively to create value for our stakeholders
BRANDS• Trusted brands with
leadership positions• Intellectual property• Industry-specific knowledge
PEOPLE• Strong leadership• Team of experienced
professionals
FINANCIAL• Stable and healthy
financial position• Strong cash position• Access to capital
PROCESS• Efficient plants and warehouses• Responsible supply chains
STAKEHOLDER RELATIONSHIPS• Delivering quality and
innovative products to customers and consumers
• Regular and transparent shareholder engagement
• Supporting communities
DRIVING INNOVATION IN OUR PRODUCTS AND PROCESSES
Staying ahead of the curve through continuous innovation.
FOCUSING ON A SAFE AND CONDUCIVE WORKING ENVIRONMENT
FOCUSING ON SUSTAINABLE SHAREHOLDER RETURNS
DEPLOYING EFFICIENT AND INTEGRATED MANUFACTURING FACILITIES AND DEEPENING OUR DISTRIBUTION
SERVING OUR STAKEHOLDERS EFFECTIVELY
Our state-of-the-art, environmentally friendly facilities, including our existing plants in Rojana, Thailand and Pulau Indah, Malaysia, as well as the upcoming Soft Drinks plant in Kota Kinabalu, Malaysia, not only enhance our production capabilities and achieve cost efficiencies, but also reduce our impact on the environment.
14Food & Beverage and Printing manufacturing facilities
FIVE STRATEGIC IMPERATIVES GROWTH DIVERSITY REACH BRANDS PROFESSIONALISM
Note:1 Continuing operations
337 F&B Products and Flavours
7 product and process excellence awards
$179m36%
from FY2015 Profit Before Interest,
Taxation & Exceptional Items1
$166m101%
from FY2015 Profit After Taxation1
$908m5%
from FY2015 Net Cash
10 Fra s e r a n d N ea v e , L i m i t e d & S u b s i d i a r y C o m pa n i e sA n n u a l R e p o r t 2 0 1 6

159 distributors
610 retailers
217,979 outlets
104m consumers
in our core markets of Malaysia, Singapore and Thailand
VALUE SHARED
CONSUMERSWith the end consumer in mind, we produce a range of products that address evolving consumer preferences and a wide spectrum of lifestyles.
EMPLOYEESOur employees are our partners in shaping our success. We foster a culture of continual learning, development and reward for our employees in a healthy and safe work environment.
SHAREHOLDERSManaging our resources effectively enables us to maximise profits which benefit shareholders through sustainable shareholder returns.
PARTNERSWe partner responsible and sustainable businesses. Throughout our supply chain, we create value and support job creation beyond our business.
COMMUNITIESOur business is built in a profitable, responsible and sustainable manner. We give back to local communities through job creation, useful products and services, social responsibility programmes and minimisation of environmental impact.
FIVE STRATEGIC IMPERATIVES GROWTH DIVERSITY REACH BRANDS PROFESSIONALISM
20new products launched in FY2016
6,813 in 12employees countries
106export countries
Most Transparent Company Award at the 17th Investors’ Choice Awards, Singapore
Social causes supported include health, sports, education and the elderly
11Fra s e r a n d N ea v e , L i m i t e d & S u b s i d i a r y C o m pa n i e s A n n u a l R e p o r t 2 0 1 6

Together with our strategic partner, Thai Beverage Plc Limited (“ThaiBev”), our aim is to increase the size and scale of the F&N ThaiBev Group by harnessing each other’s strengths. Vision 2020 charts a roadmap to help us achieve our ambition of becoming a stable and sustainable leader in Southeast Asia (“SEA”). The roadmap centres on the Group building a solid platform for overseas expansion, focusing on SEA, via a two-pronged approach:
VISION 2020
STRENGTHENING MARKET POSITIONS
OVERSEAS EXPANSION
In Singapore, Malaysia and Thailand: Leveraging both F&N and ThaiBev’s portfolio of brands, as well as distribution and bottling systems, one of the largest and most extensive in SEA.
Using its operations in Singapore, Malaysia and Thailand as the platform, F&N intends to replicate its successful business models in other ASEAN countries, in particular Indonesia, Myanmar and Vietnam by 2020. The Group aims to establish itself as one of the top three food and beverage players in key markets outside of Singapore, Malaysia and Thailand.
V I S I O N
2020
The five strategic imperatives of Vision 2020
1 GROWTH
2 DIVERSITY
3 REACH
4 BRANDS
5 PROFESSIONALISM
12 Fra s e r a n d N ea v e , L i m i t e d & S u b s i d i a r y C o m pa n i e sA n n u a l R e p o r t 2 0 1 6

&B Profit Before Interest & Taxation ($m)
$142
+32% from FY2015
Profit Before Interest& Taxation ar in ( )
8.5%
+2pp from FY2015
1 GROWTH
By driving product innovation, diversifying our portfolio, leveraging distribution networks in core markets, and expanding our business in SEA, the F&N ThaiBev Group aims to be the largest and most profitable beverage company in SEA.
20New F&B products
launched in FY2016
MALAYSIA
#2 vending player following acquisition of Warburg
No. of active vending machines increased almost
3x
SINGAPORE
F&N Vietnam LLC incorporated for the distribution and trading
of non-alcoholic beverages and beer
VIETNAM
F&B Revenue ($m)
$1,671
-6% from FY2015
Over
$70minvested in capacity expansion in FY2016
13Fra s e r a n d N ea v e , L i m i t e d & S u b s i d i a r y C o m pa n i e s A n n u a l R e p o r t 2 0 1 6

Diversify revenue and earnings through geographic expansion and product diversification.
CONTRIBUTION BY GEOGRAPHY
2 DIVERSITY
87 144 105 11
Soft Drinks Dairies Ice Cream Beer
NO OF PRODUCTS AND FLAVOURS IN PORTFOLIO AS AT FY2016
4%$86m
29%$564m
24%$473m
43%$856m
Revenue ($m)
63%$114m -2%
($4m)
-6%($11m)
45%$80m
PBIT ($m)
Singapore Malaysia Other ASEAN1 Outside ASEAN2
Notes:1 Other ASEAN: Myanmar, Thailand, Vietnam and Indonesia2 Outside ASEAN: China, Taiwan, India, Australia, Europe and USA
14 Fra s e r a n d N ea v e , L i m i t e d & S u b s i d i a r y C o m pa n i e sA n n u a l R e p o r t 2 0 1 6

11F&B manufacturing plants in Singapore,
Malaysia and Thailand
79F&B export markets across 5 continents
3 REACH
Strengthen and build our route-to-market in priority markets, and to be the most trusted and preferred beverage partner.
Beverages Dairies Ice Cream
Office Office Office Manufacturing Plant Manufacturing Plant Manufacturing Plant
Note:1 Following the acquisition of an additional 5.4% stake in Vinamilk on 12 December 2016,
our stake has been increased to 16.35%
Vietnam1Thailand
Myanmar
Singapore
18 Distributors
350 Retailers
137,000 Outlets
25 Distributors
23 Retailers
4,414 Outlets
Indonesia
Malaysia
116 Distributors
237 Retailers
76,565 Outlets
15Fra s e r a n d N ea v e , L i m i t e d & S u b s i d i a r y C o m pa n i e s A n n u a l R e p o r t 2 0 1 6

To be amongst the top three players in our markets.
4 BRANDS
We are honoured that our Brands in our core and new markets are amongst the greats.
16 Fra s e r a n d N ea v e , L i m i t e d & S u b s i d i a r y C o m pa n i e sA n n u a l R e p o r t 2 0 1 6

To be the employer of choice, and to ensure a diverse and high-performance workforce.
5 PROFESSION- ALISM
Total Employees
Singapore
employees
2,07830%
Malaysia
Thailand
93314%
Others1
6,8132,72840%
1,07416%
38,647 training hours
Male Female
Employees by Gender (%)
39
61employees
6,813
Employees by Country (%)
Oth
ers1
Thai
land
Mal
aysi
a
Sing
apor
e
55
45
67
33
59
41
54
46
Note:1 Myanmar, Vietnam, China, Hong Kong, India and the USA
17Fra s e r a n d N ea v e , L i m i t e d & S u b s i d i a r y C o m pa n i e s A n n u a l R e p o r t 2 0 1 6

I AM HEARTENED TO REPORT THAT F&N CONTINUED TO EXPERIENCE STRONG GROWTH MOMENTUM IN OUR CORE MARKETS OF MALAYSIA, SINGAPORE AND THAILAND I INROADS INTO NEW MARKETS I T I
MR CHAROEN SIRIVADHANABHAKDIChairman
18 Fra s e r a n d N ea v e , L i m i t e d & S u b s i d i a r y C o m pa n i e sA n n u a l R e p o r t 2 0 1 6

MESSAGE FROMOUR CHAIRMAN
Dear Shareholders,
I am heartened to report that F&N continued to experience strong growth momentum in our core markets of Malaysia, Singapore and Thailand in FY2016. We also made inroads into new markets in the region. The strategies we undertook and results are in line with our Vision 2020 of becoming a stable and sustainable Food & Beverage leader in the ASEAN region.
RESULTS FOR FY2016The Group delivered strong results for the year under review amid challenging market conditions.
Profit after tax of our continuing operations (excluding Myanmar Brewery which was sold last year) grew strongly to $166 million, on the back of a strong dairies performance from volume growth and favourable commodity prices, partially offset by the loss of the RED BULL distribution franchise in Malaysia, higher marketing spend to support the launches of new products in existing and new markets, and a negative currency translation effect. At the end of the financial year, the Group maintained a strong financial
position through prudent balance sheet management, with net cash increasing $43 million to $908 million.
The Group has invested in future growth to strengthen our positions in our primary markets. We have installed a new filling and packaging line in Rojana which became operational during the year. We will also be building a new soft drinks plant in East Malaysia to double capacity (operational by 2021), installing a new aseptic cold-fill PET bottle line and constructing a new state-of-the-art storage facility in Shah Alam, and a new UHT line in Kuching. The new facilities in Shah Alam and Kuching will come on stream from the end of 2016 to 2018.
CORPORATE AND STRATEGIC DEVELOPMENTSIn late 2014, F&N, together with the Thai Beverage Public Company Limited (“ThaiBev”) Group initiative, launched Vision 2020, a strategic roadmap conceived to increase the size and scale of our businesses to become a stable and sustainable Food & Beverage leader in the ASEAN region. I am pleased to report that we have continued
to reap synergies with ThaiBev and strengthen our portfolio of core brands, taking them into new markets as well as innovate to introduce new products in our core markets of Malaysia, Singapore and Thailand.
Following the relaunch in Malaysia last year, OISHI has become the leading ready-to-drink green tea brand in Malaysia. Meanwhile, sales of RANGER, a new energy drink launched in Malaysia have continued to grow. Both OISHI and RANGER are brands licensed from the ThaiBev Group. We continue to build 100PLUS’ brand presence in
Strong Balance Sheet
with net cash of $908m
Key
Hig
hlig
hts
ready-to-drink green tea brand in Malaysia
#1
OISHI is the
Key
Hig
hlig
hts
Group Profit after Tax
doubled to $166m
$
Key
Hig
hlig
hts
Key
Hig
hlig
hts Doubling
capacityof East Malaysia’s soft drinks plant
(By 2021)
19Fra s e r a n d N ea v e , L i m i t e d & S u b s i d i a r y C o m pa n i e s A n n u a l R e p o r t 2 0 1 6

Thailand following its launch last year, and steps are being taken to increase trial and acceptance and improve our distribution reach.
We recognise the importance of growth markets like Vietnam and Myanmar. During the year, we expanded our operations in Vietnam through the establishment of a wholly-owned foreign-invested enterprise in Vietnam to take control and manage the import, marketing, distribution and sale of F&N products. Our regional office in Myanmar continued to grow sales via exports, with plans to eventually increase our presence and penetration in the near future. We have made good progress with 100PLUS, with the launch of 100PLUS Orange and 100PLUS Edge in the year which followed launches of F&N NUTRISOY, F&N SEASONS and TEAPOT canned milk. In Indonesia, our subsidiary, PT Yoke Food Industries continued to expand the presence of our brands in the market.
Our Malaysian subsidiary, Fraser & Neave Holdings Bhd, continued to
MESSAGE FROM OUR CHAIRMAN
make progress with its transformational Project Bluesky – a major strategic initiative to realign its soft drinks and dairies operations in Malaysia to create greater synergy and a more resilient business by leveraging the combined strengths of our people, our brands, and our wide network of business partners and distributors to achieve the ambition to be the leading total beverage company in Malaysia by 2020.
F&N Foods in Singapore acquired its vending machine partner, Warburg Group of Companies, and has successfully integrated it to operate as one vending unit, increasing the focus on performance and accountability and realising synergies.
On the Publishing & Printing front, Marshall Cavendish Education (“MCE”) continued to be in the forefront of education publishing, and expanded its footprint in new international markets, in Latin America and Spanish speaking countries. Key to this was efforts to expand our digital product offerings, developing strategic partnerships and building brand awareness to cement the position of MCE in education. Our printing operations continued to make progress following restructuring efforts last year to align our capacity with demand. As a result, a small loss was incurred. We successfully renewed several major accounts in the year, in both Singapore and Malaysia, thanks to Times Printer’s long-standing relationships and good reputation for delivering on its commitments. Times Bookstores Singapore was also rebranded to meet changing consumer needs.
Key
Hig
hlig
hts
Vietnam and Myanmar
continued to grow
Key
Hig
hlig
hts
Realised synergies through acquisition of
Warburg
20 Fra s e r a n d N ea v e , L i m i t e d & S u b s i d i a r y C o m pa n i e sA n n u a l R e p o r t 2 0 1 6

DIVIDENDSThe Board recommends a final dividend of 3 cents per share for approval of shareholders at the forthcoming Annual General Meeting. Taken with the interim dividend paid in June 2016, the total dividend for the year will be 4.5 cents per share. This represents a payout ratio of 60%, above our guide of 50% of the Group’s Attributable Profit Before Fair Value Adjustment and Exceptional
go to our stakeholders – our shareholders, customers, suppliers and other business associates for your continued support.
We are pleased to have Mr Edmond Neo and Mr Bennett Neo join us in October 2016, as Chief Executive Officer, Beer and Chief Executive Officer, Food, respectively. Edmond succeeds Mr Prapakon Thongtheppairot who will focus on his new role as Spirit Product Group CEO at ThaiBev. The extensive knowledge and operational experience in multiple leadership roles of Edmond and Bennett will build upon the Group’s strengths to bring us closer to achieving our Vision set for 2020.
I am confident that notwithstanding the headwinds and uncertainties we are likely to face in the coming year, with your support, we shall continue to grow long-term stakeholder value.
Items, and takes into account the capital position and near-term capital needs of the Group.
ACKNOWLEDGMENTSI would like to convey my gratitude to my fellow directors for their guidance and commitment in the year. I should also like to thank management and all our employees for their hard work and whole-hearted support of our Vision 2020 objectives and targets. My thanks also
Key
Hig
hlig
hts 60%
Dividend payout ratio
Key
Hig
hlig
hts
Combined soft drinks and dairies operations in Malaysia to create greater synergy
Key
Hig
hlig
hts
Marshall Cavendish Education
in the forefront of education publishing
CHAROEN SIRIVADHANABHAKDIChairman
21Fra s e r a n d N ea v e , L i m i t e d & S u b s i d i a r y C o m pa n i e s A n n u a l R e p o r t 2 0 1 6

BOARD OF DIRECTORS
MR CHAROEN SIRIVADHANABHAKDI, 72
VICE-CHAIRMAN / NON-EXECUTIVE AND NON-INDEPENDENT DIRECTORDate of first appointment as a director: 28 Feb 2013
Date of last re-election as a director: 29 Jan 2016
Length of service as a director (as at 30 Sep 2016): 3 years 07 months
KHUNYING WANNA SIRIVADHANABHAKDI, 73
CHAIRMAN / NON-EXECUTIVE AND NON-INDEPENDENT DIRECTORDate of first appointment as a director: 28 Feb 2013
Date of last re-election as a director: 29 Jan 2016
Length of service as a director (as at 30 Sep 2016): 3 years 07 months
B ITT ( )
Nil
ACADEMIC & PROFESSIONAL I I TI ( )
• Honorary Doctoral Degree in Buddhism (Social work) from Mahachulalongkornrajavidyalaya, Thailand
• Honorary Doctorate Degree in Business Administration, Sasin Graduate Institute of Business Administration of Chulalongkorn University, Thailand
• Honorary Doctoral Degree in Hospitality Industry and Tourism, Christian University of Thailand, Thailand
• Honorary Doctoral Degree in Sciences and Food Technology, Rajamangala University of Technology Lanna, Thailand
• Honorary Doctoral Degree in International Business Administration, University of the Thai Chamber of Commerce, Thailand
• Honorary Doctoral Degree in Management, Rajamangala University of Technology Suvarnabhumi, Thailand
• Honorary Doctor of Philosophy in Business Administration, Mae Fah Luang University, Thailand
• Honorary Doctoral Degree in Business Administration, Eastern Asia University, Thailand
• Honorary Doctoral Degree in Management, Huachiew Chalermprakiet University, Thailand
• Honorary Doctoral Degree in Industrial Technology, Chandrakasem Rajabhat University, Thailand
• Honorary Doctoral Degree in Agricultural Business Administration, Maejo Institute of Agricultural Technology, Thailand
PRESENT DIRECTORSHIPS(as at 30 Sep 2016) Listed companies• Berli Jucker Public Company Limited
(Chairman)• Big C Supercenter Public Company
Limited (Chairman)• Frasers Centrepoint Limited
(Chairman)• Thai Beverage Public Company
Limited (Chairman)
Others• Beer Thai (1991) Public Company
Limited (Chairman)• Red Bull Distillery Group of
Companies (Chairman)• Southeast Group Co., Ltd. (Chairman)
• TCC Corporation Limited (formerly TCC Holding Co., Ltd.) (Chairman)
• TCC Land Co., Ltd. (Chairman)
MAJOR APPOINTMENTS(ot er t an ire tors i s)Nil
PAST DIRECTORSHIPS IN LISTED COMPANIES HELD OVER THE PRECEDING THREE YEARS(from 01 Oct 2013 to 30 Sep 2016)Nil
OTHERSNil
22 Fra s e r a n d N ea v e , L i m i t e d & S u b s i d i a r y C o m pa n i e sA n n u a l R e p o r t 2 0 1 6

B ITT ( )
Nil
ACADEMIC & PROFESSIONAL I I TI ( )
• Honorary Doctoral Degree (Management), Mahidol University, Thailand
• Honorary Doctorate of Philosophy (Business Management), University of Phayao, Thailand
• Honorary Doctoral Degree from the Faculty of Business Administration and Information Technology, Rajamangala University of Technology Tawan-ok, Thailand
• Honorary Doctor of Philosophy in Social Sciences, Mae Fah Luang University, Thailand
• Honorary Doctoral Degree in Business Administration, Chiang Mai University, Thailand
• Honorary Doctoral Degree in Agricultural Business Administration, Maejo Institute of Agricultural Technology, Thailand
• Honorary Doctoral Degree in Bio-technology, Ramkhamhaeng University, Thailand
PRESENT DIRECTORSHIPS (as at 30 Sep 2016) Listed companies • Berli Jucker Public Company Limited
(Vice-Chairman)• Big C Supercenter Public Company
Limited (Vice-Chairman)• Frasers Centrepoint Limited
(Vice-Chairman)• Thai Beverage Public Company
Limited (Vice-Chairman)
Others• Beer Thip Brewery (1991) Co., Ltd.
(Chairman)• Sangsom Group of Companies
(Chairman)• TCC Corporation Limited (formerly
TCC Holding Co., Ltd.) (Vice-Chairman)
MAJOR APPOINTMENTS (ot er t an ire tors i s)Nil
PAST DIRECTORSHIPS IN LISTED COMPANIES HELD OVER THE PRECEDING THREE YEARS (from 01 Oct 2013 to 30 Sep 2016)Nil
OTHERSNil
NON-EXECUTIVE AND I P T I T
Date of first appointment as a director: 08 Jan 2014
Date of last re-election as a director: 29 Jan 2016
Length of service as a director (as at 30 Sep 2016): 2 years 08 months
TENGKU SYED BADARUDIN JAMALULLAIL, 71
B ITT ( )
• Nominating Committee (Chairman)
ACADEMIC & PROFESSIONAL I I TI ( )
• Master of Arts in Law & History, University of Cambridge, UK
PRESENT DIRECTORSHIPS (as at 30 Sep 2016)Listed companies• Fraser & Neave Holdings Bhd
(Chairman)• Hwang Capital (Malaysia) Berhad
(formerly Hwang-DBS (Malaysia) Berhad)
Others• Berkat Restu Sdn Bhd• Besar Holdings Sdn Bhd• HDM Capital Sdn Bhd• Mega SPJ Sdn Bhd• Vacaron Company Sdn Bhd
MAJOR APPOINTMENTS (ot er t an ire tors i s) Nil
PAST DIRECTORSHIPS IN LISTED COMPANIES HELD OVER THE PRECEDING THREE YEARS(from 01 Oct 2013 to 30 Sep 2016)Nil
OTHERS• Hwang Investment Management
Berhad• HwangDBS Commercial Bank Plc• HwangDBS Investment Bank Berhad• Asian Islamic Investment Management
Sdn Bhd
23Fra s e r a n d N ea v e , L i m i t e d & S u b s i d i a r y C o m pa n i e s A n n u a l R e p o r t 2 0 1 6

BOARD OF DIRECTORS
NON-EXECUTIVE AND INDEPENDENT DIRECTORDate of first appointment as a director: 08 Jan 2014
Date of last re-election as a director: 27 Jan 2014
Length of service as a director (as at 30 Sep 2016): 2 years 08 months
B ITT ( )
• Audit Committee• Remuneration Committee (Chairman)
ACADEMIC & PROFESSIONAL I I TI ( )
• Bachelor of Science cum laude, majoring in Management, Fairleigh Dickinson University, USA
PRESENT DIRECTORSHIPSListed companies• Banyan Tree Holdings Limited• Ceylon Guardian Investment
Trust PLC• Ceylon Investment PLC• Malaysia Smelting Corporation
Berhad• The Straits Trading Company Limited
NON-EXECUTIVE AND NON-INDEPENDENT DIRECTOR / ADVISER TO THE BOARDDate of first appointment as a director: 03 Apr 2013
Date of last re-election as a director: 29 Jan 2016
Length of service as a director (as at 30 Sep 2016): 3 years 05 months
B ITT ( )
• Board Executive Committee (Chairman)
• Risk Management Committee (Chairman)
ACADEMIC & PROFESSIONAL I I TI ( )
• Bachelor of Science, University of Singapore, Singapore
MR TIMOTHY CHIA CHEE MING, 66 MR KOH POH TIONG, 69
Others• Gracefield Holdings Limited
(Chairman)• Hup Soon Global Corporation Private
Limited (Chairman)• HS Global Holdings Pte Ltd• Parkesville Pte Ltd• Singapore Power Limited• United Motor Works (Siam) Public Co
Ltd (Chairman)• Vertex Venture Holdings Ltd
MAJOR APPOINTMENTS(ot er t an ire tors i s)• ASEAN Business Club (Member,
Advisory Council & Co-Chair, Singapore)
• Asian Civilisation Museum (Member, Advisory Board)
• Singapore Management University (Member, Board of Trustees)
PAST DIRECTORSHIPS IN LISTED COMPANIES HELD OVER THE PRECEDING THREE YEARS(from 01 Oct 2013 to 30 Sep 2016)• InnoTek Limited*
Others• Coutts & Co Ltd• EQT Funds Management Ltd• Guan Leng Holdings Pte Ltd• JM Financial Singapore Pte Ltd • PowerGas Limited • SP PowerAssets Limited• SPI (Australia) Assets Pty Ltd• United Motor Works (Mauritius) Ltd
* Held office from 26 Feb 2014 to 10 Mar 2014
24 Fra s e r a n d N ea v e , L i m i t e d & S u b s i d i a r y C o m pa n i e sA n n u a l R e p o r t 2 0 1 6

NON-EXECUTIVE AND INDEPENDENT DIRECTORDate of first appointment as a director: 31 May 2013
Date of last re-election as a director: 27 Jan 2014
Length of service as a director (as at 30 Sep 2016): 3 years 04 months
B ITT ( )
• Audit Committee (Chairman)• Nominating Committee• Remuneration Committee
ACADEMIC & PROFESSIONAL I I TI ( )
• Master of Business Administration, Wichita State University, Kansas, USA
• Bachelor of Arts (Commerce), Chulalongkorn University, Thailand
MRS SIRIPEN SITASUWAN, 68
PRESENT DIRECTORSHIPS(as at 30 Sep 2016)Listed companies• Delfi Limited (formerly Petra
Foods Limited)• Raffles Medical Group Ltd• SATS Ltd• United Engineers Ltd
Others• National Kidney Foundation
(Chairman)• Singapore Kindness Movement
(Chairman)• The Great Eastern Life Assurance
Company Limited• Times Publishing Limited (Chairman)• Yunnan Yulinquan Liquor Co Ltd
(Chairman)
MAJOR APPOINTMENTS (ot er t an ire tors i s)• Member, Evaluation Panel, Casino
Regulatory Authority on Integrated Resorts’ Tourism Performance, Ministry of Trade and Industry
PAST DIRECTORSHIPS IN LISTED COMPANIES HELD OVER THE PRECEDING THREE YEARS(from 01 Oct 2013 to 30 Sep 2016)• Ezra Holdings Limited (Chairman and
Senior Advisor)
OTHERS• PSA Corporation Ltd• PSA International Pte Ltd
PRESENT DIRECTORSHIPS(as at 30 Sep 2016)Listed companies• Sermsuk Public Company Limited• Thai Solar Energy Public
Company Limited• Thanachart Capital Public
Company Limited
Others• Solaris Asset Management Co., Ltd.
MAJOR APPOINTMENTS (ot er t an ire tors i s)Nil
PAST DIRECTORSHIPS IN LISTED COMPANIES HELD OVER THE PRECEDING THREE YEARS (from t to e )• Frasers Centrepoint Limited*
OTHERSNil
* Held office from 07 Jan 2014 to 10 Mar 2014
25Fra s e r a n d N ea v e , L i m i t e d & S u b s i d i a r y C o m pa n i e s A n n u a l R e p o r t 2 0 1 6

BOARD OF DIRECTORS
NON-EXECUTIVE AND NON-INDEPENDENT DIRECTORDate of first appointment as a director: 19 Feb 2013
Date of last re-election as a director: 30 Jan 2015
Length of service as a director (as at 30 Sep 2016): 3 years 07 months
B ITT ( )
Nil
ACADEMIC & PROFESSIONAL I I TI ( )
• Master of Business Administration, Finance, University of Missouri, USA
• Bachelor of Laws, Thammasat University, Thailand
PRESENT DIRECTORSHIPS(as at 30 Sep 2016)Listed companies• Big C Supercenter Public
Company Limited• Frasers Centrepoint Limited• Golden Land Property Development
Public Company Limited• Sermsuk Public Company Limited
(2nd Vice-Chairman)
NON-EXECUTIVE AND NON-INDEPENDENT DIRECTORDate of first appointment as a director: 19 Feb 2013
Date of last re-election as a director: 30 Jan 2015
Length of service as a director (as at 30 Sep 2016): 3 years 07 months
B ITT ( )
• Board Executive Committee (Vice-Chairman)
• Nominating Committee• Remuneration Committee• Risk Management Committee
ACADEMIC & PROFESSIONAL I I TI ( )
• Honorary Doctoral Degree of Business Administration in Strategic Logistic and Supply Chain Management, Suan Sunandha Rajabhat University, Thailand
• Honorary Doctoral Degree of Philosophy in General Management, Ramkhamhaeng University, Thailand
• Master of Science Administration in Financial Economics, Boston University, USA
• Bachelor of Business Administration (Finance), Boston University, USA
MR CHOTIPHAT BIJANANDA, 53MR THAPANA SIRIVADHANABHAKDI, 41
Others• Australand Investments Limited• Australand Property Limited• Frasers Property Australia Pty Limited• Frasers Property Limited• Southeast Capital Co., Ltd. (Chairman
of Executive Board) • Southeast Group Co., Ltd. (President)• Southeast Insurance Public Company
Limited (Chairman of Executive Board)• Southeast Life Insurance Public
Company Limited (Chairman of Executive Board)
• TCC Assets Limited• TCC Technology Co., Ltd.
MAJOR APPOINTMENTS (ot er t an ire tors i s)Nil
PAST DIRECTORSHIPS IN LISTED COMPANIES HELD OVER THE PRECEDING THREE YEARS(from 01 Oct 2013 to 30 Sep 2016)Nil
OTHERSNil
26 Fra s e r a n d N ea v e , L i m i t e d & S u b s i d i a r y C o m pa n i e sA n n u a l R e p o r t 2 0 1 6

PRESENT DIRECTORSHIPS(as at 30 Sep 2016)Listed companies• Berli Jucker Public Company Limited• Golden Land Property Development
Public Company Limited • Oishi Group Public Company Limited
(Vice-Chairman)• Sermsuk Public Company Limited
(3rd Vice-Chairman)• Thai Beverage Public Company
Limited• Univentures Public Company Limited
(Vice-Chairman)
Others• Berli Jucker Group of Companies• InterBev Investment Limited• International Beverage Holdings
Limited (President)• Plantheon Group of Companies• Pracharath Rak Samakkee (Thailand)
Co., Ltd.• South East Group of Companies
(Vice-Chairman)• TCC Group of Companies• Thai Beverage Group of Companies• Univentures Group of Companies
PP I T T ( T T I T IP )• Thai Beverage Public Company
Limited (President and Chief Executive Officer)
PAST DIRECTORSHIPS IN LISTED COMPANIES HELD OVER THE PRECEDING THREE YEARS(from 01 Oct 2013 to 30 Sep 2016)• Siam Food Products Public Company
Limited*
OTHERSNil
* Held office from 2007 to 11 August 2015
NON-EXECUTIVE AND NON-INDEPENDENT DIRECTORDate of first appointment as a director: 22 Feb 2013
Date of last re-election as a director: 29 Jan 2016
Length of service as a director (as at 30 Sep 2016): 3 years 07 months
B ITT ( )
• Audit Committee• Board Executive Committee• Risk Management Committee
ACADEMIC & PROFESSIONAL I I TI ( )
• Bachelor of Accountancy (First Class Honors), Thammasat University, Thailand
• Diploma in Computer Management, Chulalongkorn University, Thailand
• Certificate of the Mini MBA Leadership Management, Kasetsart University, Thailand
MR SITHICHAI CHAIKRIANGKRAI, 62
PRESENT DIRECTORSHIPS(as at 30 Sep 2016)Listed companies• Berli Jucker Public Company Limited• Big C Supercenter Public
Company Limited• Frasers Centrepoint Limited • Golden Land Property Development
Public Company Limited• Oishi Group Public Company Limited• Sermsuk Public Company Limited• Siam Food Products Public
Company Limited• Thai Beverage Public Company Limited• Univentures Public Company Limited
Others• Berli Jucker Group of Companies • InterBev Investment Limited• International Beverage Holdings
Limited• Plantheon Group of Companies• TCC Group of Companies • Thai Beverage Group of Companies• Univentures Group of Companies
MAJOR APPOINTMENTS (ot er t an ire tors i s)• Thai Beverage Public Company
Limited (Chief Financial Officer)
PAST DIRECTORSHIPS IN LISTED COMPANIES HELD OVER THE PRECEDING THREE YEARS (from t to e )Nil
OTHERSNil
27Fra s e r a n d N ea v e , L i m i t e d & S u b s i d i a r y C o m pa n i e s A n n u a l R e p o r t 2 0 1 6

BOARD OF DIRECTORS
ALTERNATE DIRECTOR TO MR SITHICHAI CHAIKRIANGKRAI Date of first appointment as an alternate director: 21 Mar 2013
Date of last re-election as an alternate director: 27 Jan 2014
Length of service as an alternate director (as at 30 Sep 2016): 3 years 06 months
B ITT ( )
• Board Executive Committee• Risk Management Committee
ACADEMIC & PROFESSIONAL I I TI ( )
• Advanced Management Programme, INSEAD, France
• Master of Science in Finance, Georgia State University, USA
• Master of Business Administration, Mercer University, USA
• Bachelor of Business Administration, Assumption University, Thailand
• Listed Company Director Programme, Singapore Institute of Directors, Singapore
MR PRAPAKON THONGTHEPPAIROT, 45
PRESENT DIRECTORSHIPS(as at 30 Sep 2016)Listed companiesNil
Others• Beer Chang International Limited• Chang International Co., Ltd. • Dhospaak Co., Ltd.• InterBev Investment Limited• International Beverage
Holdings Limited• Modern Trade Management Co., Ltd.• P.M.T. Mansion Co., Ltd. • Thai Beverage Group of Companies• Thai Drinks Co., Ltd.
MAJOR APPOINTMENTS (ot er t an ire tors i s)• Thai Beverage Public Company
Limited (Executive Vice President - Chief Executive Officer, Spirit Product Group)*
PAST DIRECTORSHIPS IN LISTED COMPANIES HELD OVER THE PRECEDING THREE YEARS(from 01 Oct 2013 to 30 Sep 2016)Nil
OTHERSHeld various senior executive positions in the TCC Group, namely Senior Vice President for Finance in Thai Beverage Public Company Limited, Director in Thai Beverage Marketing Co., Ltd., Senior Executive Vice President for Land Development and Investment Management in TCC Land Group, Senior Executive Vice President for Corporate Services in Plantheon Group and TCC Land Group, and Senior Executive Vice President for Finance in TCC Land Group
* Effective 1 Oct 2016
28 Fra s e r a n d N ea v e , L i m i t e d & S u b s i d i a r y C o m pa n i e sA n n u a l R e p o r t 2 0 1 6

GROUP MANAGEMENT
CHIEF EXECUTIVE OFFICER, NON-ALCOHOLIC BEVERAGESDate of appointment: 01 May 2015
Length of service in the F&N Group (as at 30 Sep 2016): 13 years 10 months
JOB DESCRIPTIONMr Lee is responsible for driving the growth strategies of the Group’s non-alcoholic beverages business, which has operations and investments in Singapore, Malaysia, Thailand, Myanmar, Indonesia and Vietnam.
ACADEMIC & PROFESSIONAL I I TI ( )
• Advanced Management Program, Harvard Business School, USA
• Masters in Business Administration, Imperial College, London, UK
• Bachelor of Engineering (Mechanical), National University of Singapore, Singapore
WORKING EXPERIENCE • Chief Executive Officer, Wildlife
Reserves Singapore Group• Chief Corporate Development
Officer, Food & Beverage Division, Fraser and Neave, Limited
MR LEE MENG TAT, 53
• Chief Executive Officer, China, Heineken-APB (China) Management Services Co., Ltd and Regional Director, China, Asia Pacific Breweries Ltd
• Vice President & Deputy Head, Education Services and Corporate General Manager (Projects), Times Publishing Ltd
• Vice President (E-business & Operations), Fannet Online Pte Ltd
• Senior Manager, New Ventures, Fraser and Neave, Limited
• Deputy General Manager, Sembawang Leisure Pte Ltd
• Deputy Director, Regional Tourism, Singapore Tourism Board
• Assistant Head, International Business Development, Singapore Economic Development Board
• Owner, Wokabout Pte Ltd• Assistant Treasurer, Corporate
Banking, DBS Bank Ltd
OTHERSNil
CHIEF EXECUTIVE OFFICER, BEER Date of appointment: 01 October 2016
MR EDMOND NEO, 51
Length of service in the F&N Group (as at 30 Sep 2016): 24 years 02 months
JOB DESCRIPTIONMr Neo is responsible for overseeing and driving the growth strategies of Group’s beer business.
ACADEMIC & PROFESSIONAL I I TI ( )
• Bachelor of Accountancy, National University of Singapore, Singapore
WORKING EXPERIENCE • Managing Director, Chang
International Co., Ltd• General Manager, Regional Brand
Development, F&N Interflavine Pte Ltd
• Director, Group Commerce, Asia Pacific Breweries Ltd
• Chief Executive Officer, Asia Pacific Breweries (Lanka) Ltd
• Commercial Manager, Cambodia Brewery Limited
• Assistant General Manager, Group Commerce, Asia Pacific Breweries Ltd
• Regional Marketing Manager, Philips Electronics Singapore
• Senior Marketing Manager, Asia Pacific Breweries Ltd
• Senior Brand Manager, DB Breweries Limited
• Senior Brand Manager, Asia Pacific Breweries Singapore
• Corporate Banking Officer, Overseas Union Bank
• Auditor, Price Waterhouse
OTHERSNil
29Fra s e r a n d N ea v e , L i m i t e d & S u b s i d i a r y C o m pa n i e s A n n u a l R e p o r t 2 0 1 6

GROUP MANAGEMENT
CHIEF EXECUTIVE OFFICER, TIMES PUBLISHING GROUPDate of appointment: 01 October 2014
MR SIEW PENG YIM, 48
Length of service in the F&N Group (as at 30 Sep 2016): 4 years 05 months
JOB DESCRIPTIONMr Siew has direct oversight of Times Publishing Group’s Publishing, Print, Retail and Distribution divisions.
ACADEMIC & PROFESSIONAL I I TI ( )
• Bachelor of Accountancy, National University of Singapore, Singapore
• Chartered Accountant of Singapore, Institute of Singapore Chartered Accountants, Singapore
WORKING EXPERIENCE • Chief Financial Officer and
Chief Operating Officer, Times Publishing Limited
• Chief Financial Officer, Times Publishing Limited
• Chief Financial Officer, Chief Operating Officer and Executive Director, HTL International Holdings Ltd
• Chief Financial Officer, HTL International Holdings Ltd
• Group Financial Controller, HTL International Holdings Ltd
OTHERSNil
CHIEF EXECUTIVE OFFICER, FOODDate of appointment: 01 October 2016
Length of service in the F&N Group (as at 30 Sep 2016): 8 years 10 months
JOB DESCRIPTIONMr Neo is responsible for overseeing and driving the growth strategies of the Group’s food business.
ACADEMIC & PROFESSIONAL I I TI ( )
• Bachelor of Engineering (Mechanical), Nanyang Technological University, Singapore
WORKING EXPERIENCE • Chief Executive Officer, YCH Group• Chief Executive Officer – Marine,
EMAS Offshore Services Pte Ltd• Regional Director, Asia Pacific
Breweries Ltd• General Manager, Asia Pacific
Breweries (S) Pte Ltd• Managing Director, Tiger Beer UK Ltd• Country Manager/General Manager,
ExxonMobil Unique (Vietnam) Co Ltd• Logistics Manager, ExxonMobil Asia
Pacific Pte Ltd
MR BENNETT NEO, 47
• Global Marketing Advisor, Passenger Vehicle Lubricants, ExxonMobil Asia Pacific Pte Ltd
• Business Analyst, Exxon Company International
• Lubricants Manager – South China, Guangzhou Esso Petroleum Services Company
OTHERS• Strategic Advisor, Go-Ahead Loyang
Pte Ltd • Chairman, Board of Trustees,
Migrant Workers’ Assistance Fund• Co-Chairman, Migrant Workers’ Forum• Board Member, National Kidney
Foundation• Chairman, Donor Relations Committee,
National Kidney Foundation• Council Member, Football Association
of Singapore• Chairman, Business Development
Committee, Football Association of Singapore
30 Fra s e r a n d N ea v e , L i m i t e d & S u b s i d i a r y C o m pa n i e sA n n u a l R e p o r t 2 0 1 6

GROUP COMPANY SECRETARYDate of appointment: 01 October 2002
Length of service in the F&N Group (as at 30 Sep 2016): 15 years 04 months
JOB DESCRIPTIONMr Cheong oversees the Corporate Secretariat, Group Legal, Management Services, Group Human Capital, Group Internal Audit, Risk Management and Sustainability functions.
ACADEMIC & PROFESSIONAL I I TI ( )
• Associate, The Institute of Chartered Accountants in England and Wales, UK
• Fellow, Institute of Singapore Chartered Accountants, Singapore
WORKING EXPERIENCE • Corporate General Manager,
Finance, Times Publishing Limited• Company Secretary,
CarnaudMetalbox Asia Ltd• Manager, Corporate Recovery
Services, Ernst & Young
OTHERSNil
MR ANTHONY CHEONG FOOK SENG, 62
CHIEF FINANCIAL OFFICER Date of appointment: 01 October 2012
Length of service in the F&N Group (as at 30 Sep 2016): 16 years 08 months
JOB DESCRIPTIONMr Hui is responsible for the Group Finance, Treasury, Taxation, Investor Relations and Corporate Communications, and Corporate Information Technology functions.
ACADEMIC & PROFESSIONAL I I TI ( )
• Master of Business Administration, Nanyang Technological University, Singapore
• Bachelor of Business, Curtin University of Technology, Australia
• Chartered Accountant of Singapore, Institute of Singapore Chartered Accountants, Singapore
WORKING EXPERIENCE • Group Financial Controller, Fraser
and Neave, Limited• Deputy Group Financial Controller/
General Manager, Corporate Communications, Fraser and Neave, Limited
MR HUI CHOON KIT, 52
• General Manager, Treasury and Budget, Fraser and Neave, Limited
• General Manager, Corporate Communications & Special Projects/Budget Manager, Chairman’s Office, Fraser and Neave, Limited
• Deputy General Manager, Corporate Planning & Business Development/ Budget Manager, Chairman’s Office, Fraser and Neave, Limited
• Assistant General Manager, Corporate Planning & Business Development, Fraser and Neave, Limited
• Senior Manager, New Ventures, Fraser and Neave, Limited
• Manager, Corporate Finance, Schroder International Merchant Bankers Limited
• Assistant Vice President, Investment Banking, Keppel Bank of Singapore Limited
• Executive Consultant, Ernst & Young Consultants Pte Ltd
• Audit Senior, Ernst & Young
OTHERS• Member, Finance Committee,
National Kidney Foundation
31Fra s e r a n d N ea v e , L i m i t e d & S u b s i d i a r y C o m pa n i e s A n n u a l R e p o r t 2 0 1 6

OTHERS OTHER UNLISTED COMPANIES
6 Subsidiary companies
F&N Investments Pte Ltd
F&N Services (L) Bhd
F&N Treasury Pte Ltd
Fraser & Neave (Singapore) Pte. Limited
Fraser & Neave Investments (Hong Kong) Limited
InterF&B Pte. Ltd.
FOOD & BEVERAGE
FRASER & NEAVE HOLDINGS BHD
23 Subsidiary companies
1 Associated company
Listed company
Cocoaland Holdings Berhad
1 Joint venture company
OTHER LISTED & UNLISTED COMPANIES
16 Subsidiary companies
Asia Dairies (S) Pte Ltd
F&NBev Manufacturing Pte. Ltd.
F&N Dairy Investments Pte Ltd
F&N Foods Pte Ltd
F&N Interflavine Pte Ltd
F&N Services (F&B) Sdn Bhd
F&N United Limited
F&N Vietnam Limited Liability Company
Magnolia – PDL Dairies (1993) Sdn. Bhd.
PT. F&N Indonesia
Tiger Tavern Sdn. Bhd.
Warburg Engineering Pte. Ltd.
Warburg Vending Pte Ltd
Warburg Vending Services Pte. Ltd.
F&N Creameries Group 4 Subsidiary companies
Yoke Food Industries Group 2 Subsidiary companies
FRASER AND NEAVE, LIMITED
CORPORATE STRUCTURE
PUBLISHING & PRINTING
TIMES PUBLISHING GROUP
35 Subsidiary companies
1 Joint operation
3 Associated companies
Listed company
PMP Limited
Listed on the Mainboard of the Singapore Exchange Securities Trading Limited (“SGX-ST”) Stock Code: F99
Number of Ordinary Shares Outstanding 1,445,773,703 Shares (Excluding 1,304,051 Treasury Shares)
32 Fra s e r a n d N ea v e , L i m i t e d & S u b s i d i a r y C o m pa n i e sA n n u a l R e p o r t 2 0 1 6

CORPORATE INFORMATION
BOARD OF DIRECTORS
Mr Charoen Sirivadhanabhakdi (Chairman)
Khunying Wanna Sirivadhanabhakdi (Vice-Chairman)
Tengku Syed Badarudin Jamalullail (Lead Independent Director)
Mr Timothy Chia Chee Ming
Mr Koh Poh Tiong
Mrs Siripen Sitasuwan
Mr Chotiphat Bijananda
Mr Thapana Sirivadhanabhakdi
Mr Sithichai Chaikriangkrai
Mr Prapakon Thongtheppairot (Alternate Director to Mr Sithichai Chaikriangkrai)
BOARD EXECUTIVE COMMITTEE
Mr Koh Poh Tiong (Chairman)
Mr Thapana Sirivadhanabhakdi (Vice-Chairman)
Mr Sithichai Chaikriangkrai
Mr Prapakon Thongtheppairot
RISK MANAGEMENT COMMITTEE
Mr Koh Poh Tiong (Chairman)
Mr Thapana Sirivadhanabhakdi
Mr Sithichai Chaikriangkrai
Mr Prapakon Thongtheppairot
AUDIT COMMITTEE
Mrs Siripen Sitasuwan (Chairman)
Mr Timothy Chia Chee Ming
Mr Sithichai Chaikriangkrai
NOMINATING COMMITTEE
Tengku Syed Badarudin Jamalullail (Chairman)
Mrs Siripen Sitasuwan
Mr Thapana Sirivadhanabhakdi
REMUNERATION COMMITTEE
Mr Timothy Chia Chee Ming (Chairman)
Mrs Siripen Sitasuwan
Mr Thapana Sirivadhanabhakdi
PRINCIPAL BANKERS
Crédit Agricole Corporate and Investment Bank
DBS Bank Ltd
Oversea-Chinese Banking Corporation Limited
Standard Chartered Bank
The Hongkong and Shanghai Banking Corporation Limited
GROUP MANAGEMENT
Mr Lee Meng Tat Chief Executive Officer, Non-Alcoholic Beverages
Mr Edmond Neo Chief Executive Officer, Beer
Mr Bennett Neo Chief Executive Officer, Food
Mr Siew Peng Yim Chief Executive Officer, Times Publishing Group
Mr Anthony Cheong Fook Seng Group Company Secretary
Mr Hui Choon Kit Chief Financial Officer
REGISTERED OFFICE
438 Alexandra Road #20-00 Alexandra Point Singapore 119958 Tel: (65) 6318 9393 Fax: (65) 6271 0811
SHARE REGISTRAR AND TRANSFER OFFICE
Tricor Barbinder Share Registration Services 80 Robinson Road #02-00 Singapore 068898 Tel: (65) 6236 3333 Fax: (65) 6236 3405
AUDITOR
KPMG LLP Partner-in-charge: Quek Shu Ping (with effect from financial year 2016)
33Fra s e r a n d N ea v e , L i m i t e d & S u b s i d i a r y C o m pa n i e s A n n u a l R e p o r t 2 0 1 6

CEO BUSINESS REVIEW
FOOD & BEVERAGE OVERVIEW Our Vision 2020 is to be the leading Food & Beverage (“F&B”) player in ASEAN. In pursuing this vision, F&N is continually faced with the twin challenges of performing in the near-term while making longer term transformative moves to realise future growth opportunities and sustain long-term shareholder value amid a rapidly changing market environment. Last year, we embarked on our first regionalisation plan and started to strategically invest beyond our core markets of Singapore, Malaysia and Thailand. This year, we continued on our journey of transformation. In our core markets, we stepped up investments in our power brands, capabilities and infrastructure, and solidified our leadership positions, in order to achieve the goals of Vision 2020. We focused on strategic initiatives to make our business more efficient, particularly in Malaysia where we began to align the operating structure to fully leverage the scale of our soft drinks and dairy businesses in that market. We continued to develop new pillars of growth by putting significant investment in new markets of Myanmar, Vietnam and Thailand (soft drinks). We also
I am pleased to report that despite a still-difficult macroeconomic environment, our F&B division made good progress this year.
boosted our investment in research and development (“R&D”) to build a stronger platform for future growth. We have also beefed up our management bench strength and talent pool.
I am pleased to report that despite a still-difficult macroeconomic environment, our F&B division made good progress this year.
• F&B FY2016 PBIT was up 32% to $142m, from $107m
• F&B FY2016 PBIT margin improved 2pp, from 6% to 8%
• Dairies powered F&B earnings growth; its FY2016 earnings jumped 72% to $119m
• F&N retained leadership positions in core markets
– Dairies Thailand maintained its No. 1 position in canned milk segment with market share improvement; and continued to gain market share in the ready-to-drink (“RTD”) milk segment
– Dairies Malaysia maintained its No. 1 position in canned milk segment; its market share gain
FOOD & BEVERAGE
MR LEE MENG TATChief Executive Officer, Non-Alcoholic Beverages
in liquid milk was ahead of industry growth
– Beverages Malaysia maintained leadership position with 100PLUS, the No. 1 RTD soft drinks brand in Malaysia
• We extended our product offerings and deepened our presence in new markets
– 100PLUS is now the leading isotonic drink in Myanmar; we launched additional 100PLUS variants and TEAPOT Sweetened Beverage Creamer and Evaporated Milk
– Vietnam recorded significant volume growth of 100PLUS; its growth outpaced the projected 19% market growth rate of Vietnam’s isotonic segment in 2016
• Capital expenditure amounting to about S$100m (RM300m) has been planned in Malaysia to cater to increasing demand in core markets, as well as to support our regional expansion plans
• F&N is now the No. 2 vending player in Singapore, following the acquisition of Warburg
34 Fra s e r a n d N ea v e , L i m i t e d & S u b s i d i a r y C o m pa n i e sA n n u a l R e p o r t 2 0 1 6

F&B
Overview
Beverages
Dairies
New
Market
F&B REVENUEDespite recording volume gains, F&B
revenue ell to m The all in revenue was mainly due to negative translation effect from our operations in Malaysia adverse impact rom competitive pricing and the loss of RED BULL sales. F&N, in September 2015, ceased to be the RED BULL distributor in Malaysia Excluding RED BULL and translation impact, in constant currency, F&B revenue would have grown 3%.
This year, the core brands of 100PLUS, F&N SEASONS, OISHI and F&N MAGNOLIA each recorded volume gains, on effective execution of consumer and trade marketing programmes over the festive periods and a strengthened route-to-market. In particular, 100PLUS continued to grow from strength to strength registering a increase in volume rom s a result o our ocus on e ecution we were able to
retain our leading positions for Soft Drinks in Malaysia and Singapore as well as Canned Milk in Malaysia and Thailand and Chilled uices in Singapore.
F&B PROFITDespite the fall in revenue, F&B FY2016 profit before interest and taxation (“PBIT”) jumped 32%, to $142m.
Strong growth in Dairies bolstered our full-year earnings, marking Dairies’ third consecutive year o pro it growth
Despite translation losses, Dairies PBIT umped in
constant currency) to $119m, as a result
1 In constant currency
In This SectionFood & Beverage Overview 34Beverages • Core Market • Malaysia 38Beverages • Core Market • Singapore 42Dairies • Core Market • Malaysia 46 Dairies • Core Market • Thailand 49Dairies • Core Market • Singapore 52Dairies • Ice Cream 54New Market • Myanmar 56New Market • Vietnam 58New Market • Thailand 60
Profit Before Interest & Taxation ar in ( )
FY2015 FY2016
Change from FY2015 +2pp
8.56.0
Profit Before Interest & Taxation ($m)
FY2015 FY2016
Change from FY2015 ( 1)
142107
Revenue ($m)
FY2015 FY2016
Change from FY2015 -6% (-1%1)
1,6711,779
35Fra s e r a n d N ea v e , L i m i t e d & S u b s i d i a r y C o m pa n i e s A n n u a l R e p o r t 2 0 1 6

of strong canned milk volumes across key brands, lower input costs and improved operational efficiencies. Consequently, Dairies PBIT margin improved significantly, to 11% from 6% in FY2015.
Beverages recorded a weaker performance in FY2016 compared to FY2015. Despite successful execution of consumer and trade promotions, earnings were adversely impacted by intense pricing pressures, loss of contribution from RED BULL, weaker Malaysian Ringgit, continued brand investments and operating expenses associated with new product launches and regional expansion in new markets. As a result, Beverages FY2016 PBIT declined 40% to $23m. In constant currency, earnings of Beverages would have fallen 33%.
CORPORATE DEVELOPMENTIn July 2016, the Group acquired Warburg Vending Pte Ltd, Warburg Engineering Pte. Ltd. and Warburg Vending Services Pte. Ltd. (collectively, “Warburg”) for approximately $29m in cash. Warburg is a leading vending player in Singapore with over 18 years of operational experience, and has been our partner since 2011.
The acquisition of Warburg was a strategic fit with F&N’s food and beverage business. Together with Warburg, we increased our total number of active vending machines by almost threefold. We expanded our vending network and increased our brand visibility in both public and private segments, across educational, industrial and commercial sectors in Singapore.
REACHThis year, we undertook a major restructuring exercise to integrate our soft drinks and dairies operations in Malaysia. The result was a stronger and more efficient operation. We were able to apply the combined assets, operating resources and capabilities of soft drinks and dairies to derive more efficient logistics and distribution through scale, and ultimately better satisfy customer needs. This restructuring of our operations in Malaysia will continue into FY2017. We will further integrate functions and extract synergies to reap maximum benefits for the Group.
CEO BUSINESS REVIEW
FOOD & BEVERAGE
572
6391,141
1,099
Dairies Beverages
FY2016 ($1,671m) FY2015 ($1,779m)
Revenue ($m)
23
3869
119
Dairies Beverages
FY2016 ($142m) FY2015 ($107m)
Profit Before Interest & Taxation ($m)
36 Fra s e r a n d N ea v e , L i m i t e d & S u b s i d i a r y C o m pa n i e sA n n u a l R e p o r t 2 0 1 6

F&B
Overview
Beverages
Dairies
New
Market
amongst other factors, the ever intensifying competition, ongoing pricing pressures, changing regulatory environment and rising input and operating costs.
We have clear strategies in place to continue to shape the F&B business while delivering results. We will continue to drive growth in our
INNOVATIONWe have had one of the strongest line-up of new products last year. We launched flavour extensions for 100PLUS and OISHI; rejuvenated packaging for 100PLUS and F&N Sparkling Drinks; introduced limited edition F&N Sparkling Drinks Pink Grapefruit; entered new categories with COCO LIFE and F&N MAGNOLIA Ginkgo Plus. This year, while we nurture the products that were introduced last year, we continued to delight our growing consumer base with even more launches. We rolled out close to 20 new products/flavours, including F&N ICE MOUNTAIN Sparkling Water, F&N MAGNOLIA UHT Kids, F&N NUTRIWELL Snow Fungus with Wolfberry and introduced limited edition KING’S Potong Teh Tarik and Mao Shan Wang ice cream, in Malaysia, Singapore and Thailand.
Going forward, we will intensify our R&D and marketing efforts on our portfolio of healthier products, in particular the isotonic, soya, RTD tea and milk categories, in anticipation of the increased government and consumer focus on health and wellness.
FY2017 AND BEYOND: OUR TRANSFORMATION JOURNEY CONTINUESWith good progress made and strong foundations laid, we are confident in forging ahead, fully cognizant that there will be challenges along the way. The weaker global economy and volatile financial markets may weigh on consumer confidence and demand. In addition, we are also contending with,
existing markets by leveraging our brand strength, channels of distribution and manufacturing capabilities. To ensure sustainable revenue and profit growth, the Group will continually evaluate investment opportunities while keeping our focus on deepening our presence in the new markets of Myanmar, Thailand and Vietnam.
37Fra s e r a n d N ea v e , L i m i t e d & S u b s i d i a r y C o m pa n i e s A n n u a l R e p o r t 2 0 1 6

Mar
ket
Posi
tion
BEVERAGES MALAYSIA: RESULTSDespite challenging market conditions, cautious consumer spending and the loss of contribution from RED BULL, Beverages Malaysia FY2016 volume increased 2%. The volume gains were supported by 100PLUS, F&N SEASONS, F&N ICE MOUNTAIN and F&N Sparkling Drinks, on the back of effective execution of consumer and trade marketing programmes over festive periods, a strengthened route-to-market, as well as the success of its new launches. OISHI, est COLA and RANGER – ThaiBev’s brands distributed by Beverages Malaysia – also enjoyed strong volume growth.
While Beverages Malaysia recorded volume gains in its core brands, the soft market condition in Malaysia has exerted downward pressure on pricing.
Negative translation effects and loss of contribution from RED BULL further contributed to the 16% decline in FY2016 revenue (-9% in constant currency). Lower revenue, a one-off consultancy expenses in relation to a restructuring exercise, higher tactical discounts and the loss of agency margin contribution eroded gains from favourable product mix, resulted in an overall 49% fall in its FY2016 PBIT.
This year, leading positions of core brands 100PLUS and F&N NUTRISOY were maintained as Beverages Malaysia has remained steadfast in marketing and branding initiatives, focusing on promoting active and healthy living. 100PLUS, for instance, reinforced the importance of hydration while leading active lifestyle by launching special packaging throughout the year and in conjunction with international sports events. It also continued to lend support to Malaysia’s athletes, as well as regional and national sports events.
Beverages Malaysia continued to position F&N NUTRISOY range of soya milk as a tasty and nutritious beverage alternative. To emphasise the health benefits of its low-fat-low-sugar content, it rebranded F&N NUTRISOY Less Sweet variant to F&N NUTRISOY Lite.
The Group undertook a major restructuring exercise to integrate its soft drinks and dairies operations in Malaysia this year. This exercise aims to improve operational efficiency, realise greater economies of scale and harness the full potential of its brands and distribution capabilities as a combined operation. A new commercial structure was formed, and an optimised and integrated route-to-market was rolled out on 1 October 2015. The associated one-off consultancy expenses related to this exercise was recorded in this financial year.
As testament to the Group’s confidence in the growth potential of its brands and its role in Malaysia, Beverages Malaysia announced investments of over RM300m (S$100m) on a new soft drinks plant in Kota Kinabalu, an aseptic cold-filling PET bottle line and an integrated warehouse in Shah Alam, and a new UHT line in Kuching. Aimed at optimising its manufacturing and distribution facilities to meet the growing demand for its healthier range of beverages, these investments by Beverages Malaysia are aligned with the Group’s Vision 2020 of strengthening our key market positions and supporting our regional expansion.
While the restructuring exercise to optimise its resources in Malaysia continues into the new year, Beverages Malaysia will also continue to focus its marketing and R&D efforts on maintaining its leading positions in Malaysia. It will continue to engage consumers, responsibly, to heighten brand awareness as well as to invest in the development of products that foster active, healthy living, in line with our tagline ‘PURE ENJOYMENT. PURE GOODNESS ’.
ISOTONIC: 100PLUSF&N’s flagship brand and Malaysia’s No. 1 soft drink, 100PLUS, continued to cement its position as the enabler
CEO BUSINESS REVIEW
BEVERAGES • CORE MARKET
#1
Isotonic
o me ( )
2%
e en e ( )
16% ( 9%1)
Profit Before Interest & Taxation ( ) 49% (
45%1)
Profit Before Interest & Taxation ar in ( ) 3pp
1 In constant currency
MALAYSIA
38 Fra s e r a n d N ea v e , L i m i t e d & S u b s i d i a r y C o m pa n i e sA n n u a l R e p o r t 2 0 1 6

F&B
Overview
Dairies
New
Market
Beverages • M
alaysia
of active lifestyle through its support of a series of sports-sponsorship including national athletes, major sports events and several national sports bodies. This year, 100PLUS extended its support of the national badminton team to include more of its athletes and launched a special “Thirst for Victory” gold can to garner public support for the badminton team during Olympics 2016. For 2017, 100PLUS has pledged RM3m to the 29th Southeast Asian Games and 9th ASEAN Para Games, to be held in Malaysia, as the Official Isotonic Beverage in support of the country’s sportsmen.
To generate excitement, 100PLUS rolled out several limited edition packaging throughout FY2016. Starting with its Chinese New Year gold cans packaging, 100PLUS conducted above- and below-the-line activations, including partnering the leading media and entertainment group in Malaysia to spread festive cheer in its annual carnivals held in four locations nationwide. At the carnivals, 100PLUS engaged youths and families through contests and product sampling. The successful execution of the 100PLUS festive gold cans campaign resulted in a 14% increase in volume as compared with the same period last year.
For Hari Raya, a limited edition packaging was launched for the 100PLUS 1.5L variant, in Berry and Lemon Lime flavours. To increase brand visibility and top-of-mind awareness, 100PLUS sponsored television programming and a tele-movie featuring two of Malaysia’s popular actors, in addition to conducting samplings at local bazaars and mosques.
In conjunction with 2016 UEFA Europa League, a pair of limited edition glass bottles of 100PLUS Original flavour featuring global football stars, Pelé and Oscar, who were 100PLUS ambassadors in FY2015, was launched as collectibles. It also rewarded 10 winners of its consumer contest with an all-expense paid trip to Brazil to catch the football matches live. Besides leveraging its partnership with the League’s main broadcaster to drive brand visibility on air, 100PLUS also activated nationwide roadshows and impactful in-store displays.
SOYA: F&N NUTRISOYResearch has shown that the main reason for soya milk consumption is to satiate one’s hunger pangs in between meal times. To reinforce this consumption occasion, F&N NUTRISOY, Malaysia’s No. 1 soya milk,
implemented an integrated campaign consisting of above- and below-the-line channels, consumer promotions and mobile sampling to instill the concept of drinking F&N NUTRISOY during break times for sustenance.
In line with the increasing focus on healthy beverages, F&N SEASONS NUTRISOY Less Sweet was rebranded to F&N NUTRISOY Lite, to better reflect its low-fat and low-sugar content. Its packaging was also refreshed this year to give it a more updated look. A 360-degree marketing campaign including a nationwide consumer contest was launched to promote visibility and awareness of the new look and rebranding. The consumer contest
Mar
ket
Posi
tion
Soya
#1
39Fra s e r a n d N ea v e , L i m i t e d & S u b s i d i a r y C o m pa n i e s A n n u a l R e p o r t 2 0 1 6

CEO BUSINESS REVIEW
BEVERAGES • CORE MARKET MALAYSIA
TEA: F&N SEASONS AND OISHI F&N commands Malaysia’s ready-to-drink tea segment with F&N SEASONS and OISHI leading the black tea and green tea segments, respectively.
Malaysia’s No. 1 brand of ice lemon tea, F&N SEASONS Ice Lemon Tea, continued to convey the importance of taking a break and remaining optimistic in its “Janji Chillax” campaign. Focusing its consumer engagement initiatives on digital platforms and sampling activities this year, F&N SEASONS was able to extend its reach to more consumers both on-ground and on its social media pages.
Riding on the popularity of its flavours launched since 2014, OISHI introduced the new Lychee flavour to create more excitement and variety in the RTD green tea segment. It also made available the Original, Genmai, Honey Lemon
Mar
ket
Posi
tion
Ready-To-Drink Tea
and Lychee flavours in a new 250ml tetra pack in conjunction with Chinese New Year for convenience. OISHI continued to focus its brand communications on the authenticity and quality of its 100% organic Japanese green tea leaves in its campaign.
Besides conducting sampling at retail outlets, OISHI participated in the annual Bon Odori Festival, the largest outdoor event in Malaysia, held in Shah Alam, Penang and Johor Bahru, to create more sampling opportunities. It also supported the month-long Japanese Film Festival with on-ground and online contests to reward festival-goers with OISHI products.
CARBONATED SOFT DRINKS: F&N SPARKLING DRINKS AND EST COLAF&N Sparkling Drinks continued to build relevance and brand affinity amongst
included other F&N products such as F&N SEASONS NUTRIWELL, F&N FRUIT TREE, F&N SEASONS and OISHI to encourage an increase in average basket size and purchase frequency. The hugely popular contest garnered more than 50,000 entries over a two-month period.
#1
40 Fra s e r a n d N ea v e , L i m i t e d & S u b s i d i a r y C o m pa n i e sA n n u a l R e p o r t 2 0 1 6

F&B
Overview
Dairies
New
Market
Beverages • M
alaysia
youths by collaborating with a popular local band in its integrated campaign. An original song, ‘Warnai Dunia’, was written by the band for the campaign, and embodied the brand’s essence of spreading cheer and fostering
#2
Mar
ket
Posi
tion
Asian Soft Drinks (Non-Soya)
togetherness. Leveraging the band’s strong fan base, the song’s music video generated over 1.2 million views online within two months of its launch.
As a new entrant in the local cola segment with its launch in 2015, est COLA intensified its publicity efforts this year with an on-ground activation at a popular shopping mall in Kuala Lumpur. On top of sampling est COLA, shoppers could immerse in experiential activities such as experiencing snowfall, an interactive photo booth and 3D optical illusion street art. These activities were aimed at promoting est COLA as a unique and preferred cola brand.
To create more trial opportunities, est COLA was the main beverage sponsor of the Kuala Lumpur Food Truck Parade, targeting an
estimated 25,000 people at the largest food truck gathering in Malaysia. It also conducted product sampling at the Petaling Jaya City Council’s 10th anniversary event which saw more than 12,000 participants.
Mar
ket
Posi
tion
Flavoured Carbonated Soft Drinks
#1
41Fra s e r a n d N ea v e , L i m i t e d & S u b s i d i a r y C o m pa n i e s A n n u a l R e p o r t 2 0 1 6

o me ( ) 13%
e en e ( ) 19%
Profit Before Interest & Taxation ( ) 63%
Profit Before Interest & Taxation ar in ( ) 2pp
CEO BUSINESS REVIEW
BEVERAGES SINGAPORE: RESULTS Despite a softening retail market, Beverages Singapore and Export, consisting of Soft Drinks and Beer, recorded 13% volume growth, mainly due to the successful launches of new products F&N ICE MOUNTAIN Sparkling Water, COCO LIFE, OISHI and CHANG beer. Beverages Singapore began the distribution of CHANG beer in October 2015.
Coupled with favourable product mix, effective brand building initiatives and a strong distribution network of 25 distributors, 23 retailers and 4,414 outlets, Beverages Singapore FY2016 revenue expanded 19%. Boosted by the surge in both Domestic and Export revenue, as well as lower input cost, Beverages Singapore FY2016 earnings jumped 63%.
#1
Mar
ket
Posi
tion
Pasteurised Asian Soft Drinks
Following the acquisition of Warburg, completed in July 2016, Beverages Singapore was able to harness its complementary capabilities and skill sets to strengthen its position in the vending market and scale up its infrastructure in Singapore. With a threefold increase in the number of its vending machines, Beverages Singapore successfully increased its brand visibility and product availability in both public and private segments, across educational, industrial and commercial sectors in Singapore. Through its expanded vending network, Beverages Singapore was able to offer consumers more convenience and a wider product range, from pasteurised products, to bottled and canned soft drinks, hot beverages as well as snacks, at more locations islandwide.
In addition to expanding and deepening its route-to-market, Beverages Singapore continued its emphasis on product innovation, focusing on healthier beverages. New products launched in response to the rising health and wellness trend included F&N ICE MOUNTAIN Sparkling Water and F&N NUTRIWELL Snow Fungus with Wolfberry. The latter, the latest addition to the F&N NUTRIWELL range which commands market leadership in the Pasteurised Asian Soft Drinks segment, uses natural ingredients,
contains 25% less sugar and is certified a ‘Healthier Choice’ by Singapore’s Health Promotion Board. In addition to new variants, Beverages Singapore also rolled out new 1L-pack for its healthier range of beverages such as COCO LIFE and F&N NUTRISOY UHT Reduced Sugar.
Through consistent and effective brand building programmes, this year, 100PLUS, F&N NUTRISOY and F&N ICE MOUNTAIN maintained their leading market positions in Singapore, with market share gains in the isotonic, soya and water segments, respectively.
ISOTONIC: 100PLUS As Singapore’s No.1 isotonic drink, 100PLUS remains the isotonic drink of choice for athletes and individuals in pursuit of an active lifestyle. This year, 100PLUS continued to support sports development and endorse active lifestyles through sponsorships and brand building activities.
BEVERAGES • CORE MARKET
SINGAPORE
42 Fra s e r a n d N ea v e , L i m i t e d & S u b s i d i a r y C o m pa n i e sA n n u a l R e p o r t 2 0 1 6

F&B
Overview
Dairies
New
Market
Beverages • Sin
gapore
As part of the successful “Let’s Move” campaign introduced in FY2015, 100PLUS organised the “Run for Good” event in Singapore. This event was aimed at encouraging Singaporeans to lead active lifestyles by rewarding them with a fitness tracker for clocking 1.5km in 10 minutes on a treadmill. 100PLUS also took the opportunity to raise awareness for SportCares, an organisation which works to improve the lives of underprivileged children and youth-at-risk through sports, by donating to SportCares Foundation for every kilometer covered by participants. Over the two-day event, 100PLUS highlighted the importance of exercise to the public and clocked over 1,360 km by 814 participants.
In conjunction with Rio 2016 Olympics, 100PLUS launched a set of three limited edition cans featuring table tennis, swimming and running to rally Singaporeans to support Team Singapore athletes. As Supporter of the Singapore National Olympic Council, 100PLUS provided hydration to Team Singapore athletes while they trained in the three months leading up to Rio 2016 Olympics. 100PLUS also participated in Olympic Day, an event commemorated worldwide to celebrate the Olympic ideals and encourage individuals to get active.
As a fervent advocate of active lifestyles for both national athletes and individuals, 100PLUS continued its support for several major events
including OCBC Cycle, Standard Chartered Marathon Singapore, SGX Bull Charge, The New Paper Big Walk, Sundown Marathon, The Color Run, SMBC Singapore Open, HSBC Rugby Sevens and WTA Finals Singapore.
Having achieved a record brand equity score amongst youths in Singapore, 100PLUS clinched Best Youth Marketing at the Singapore Media Awards 2016 for its “Go for Gold” SEA Games 2015 campaign. The campaign achieved close to five million online impressions based on a media strategy that focused on using celebrities and social media, online placements, and print and outdoor advertising at train stations with high footfall. Over a six-week period, about one million 100PLUS gold cans were sold.
Mar
ket
Posi
tion
Isotonic
#1
43Fra s e r a n d N ea v e , L i m i t e d & S u b s i d i a r y C o m pa n i e s A n n u a l R e p o r t 2 0 1 6

CEO BUSINESS REVIEW
BEVERAGES • CORE MARKET SINGAPORE
SOYA: F&N NUTRISOYF&N NUTRISOY, Singapore’s No. 1 soya milk, aimed to raise awareness of its low-glycemic-index attribute and educate consumers on the importance of protein for the body’s daily functions through its “Protein Goodness Your Muscles Need” campaign. On top of print and online advertisements, and placements at train stations to build top-of-mind awareness, F&N NUTRISOY also partnered with a celebrity chef to demonstrate recipes using F&N NUTRISOY to drive in-home consumption. During this period, volume of F&N NUTRISOY 1L-pack jumped 25% as compared to the previous year.
F&N NUTRISOY also launched the F&N NUTRISOY UHT Reduced Sugar in 1L-pack, in response to the increasing focus on beverages with less sugar. The 1L-pack, catered for in-home consumption, contributed to volume growth of 24% of F&N NUTRISOY ’s ambient range over a four-month period as compared to the previous year. Consequently, market share of the ambient range increased close to 2 percentage points.
WATER: F&N ICE MOUNTAINOne of F&N’s innovations of FY2016 was F&N ICE MOUNTAIN Sparkling Water,
in lemon and grapefruit flavours. These launches offer consumers a carbonated water that is both affordable and healthy, with no sugar and zero calories. The 360-degree campaign aimed at driving brand awareness included an interactive on-ground activation which helped to convey the campaign’s message of “Sparkle from Within” – a user was transformed into a mass of bubbles through a digital screen, and a custom-built mobile bubbling water bar created refreshing sampling opportunities.
Since its launch, F&N ICE MOUNTAIN Sparkling Water has contributed to the growth of the water category and has performed in line with management’s expectations.
TEA: F&N SEASONS AND OISHI F&N SEASONS continued its “Chill with Your Favourite F&N SEASONS Tea” campaign this year, supported by in-store displays and eye-catching advertisements at train stations, on print and social media. As at FY2016, F&N SEASONS maintained its No. 2 position in the RTD black tea segment.
#2
Mar
ket
Posi
tion
Ready-To-Drink Black Tea
Mar
ket
Posi
tion
WaterWater
#1
Mar
ket
Posi
tion
Soya
#1
44 Fra s e r a n d N ea v e , L i m i t e d & S u b s i d i a r y C o m pa n i e sA n n u a l R e p o r t 2 0 1 6

F&B
Overview
Dairies
New
Market
Beverages • Sin
gapore
of the festive 24-can pack was a success – volume increased 14% over the Chinese New Year period compared with the corresponding period in the previous year. The response for F&N Pineapple was another success; its volume exceeded 2015’s Hari Raya period.
BEER: CHANGSince Beverages Singapore started distributing CHANG beer in October 2015, both volume and distribution coverage have increased in the span of one year. Total volume was up 8% as at FY2016, while September’s volume jumped 37% compared to the year-ago period, before the Group took over the
FY2016 saw the launch of two additional flavours – Honey Lemon and Lychee – to add to the already popular OISHI Green Tea Original and OISHI Green Tea Genmai. To maximise brand exposure, OISHI Honey Lemon Green Tea partnered a popular local blockbuster television drama and engaged one of its lead actresses to front its television commercial aired during prime time evening. Coupled with an effective 360-degree campaign, OISHI Green Tea doubled its market share in the RTD green tea segment in December 2015. Riding on the success of OISHI Honey Lemon Green Tea, OISHI Lychee Green Tea was introduced in September 2016, also backed by a consumer promotion and integrated marketing activities to raise awareness and generate trials.
CARBONATED SOFT DRINKS: F&N SPARKLING DRINKSAs a brand synonymous with festive celebrations, F&N Sparkling Drinks rolled out a Chinese New Year-themed 24-can pack, and a limited edition flavour, F&N Pineapple in 1.5L-pack during Hari Raya. As with past Chinese New Year activations, Beverages Singapore engaged two celebrities to front its television commercial and social media advertisements. The performance
Mar
ket
Posi
tion
Flavoured Carbonated Soft Drinks
distribution. Volume growth was most significant in the modern trade and general retail channels, at 34% and 25% respectively, due to Beverages Singapore’s earnest efforts to expand coverage. The number of distribution points more than doubled as compared to September 2015, with new convenience stores and food service outlets added to its network this year.
The strong performance of CHANG beer was attributed to the successful execution of strategic trade promotions and on-ground activations. Consumer promotions, eye-catching in-store displays and outdoor sampling opportunities at large-scale events encouraged consumer trials and improved brand visibility. CHANG beer’s consumer engagement programmes that focused on football, music and Thai food and culture also extended its reach to a wider audience, effectively boosting brand awareness and consumption. In the coming year, Beverages Singapore has plans to increase both volume and distribution coverage through targeted trade and consumer promotions.
#1
45Fra s e r a n d N ea v e , L i m i t e d & S u b s i d i a r y C o m pa n i e s A n n u a l R e p o r t 2 0 1 6

CEO BUSINESS REVIEW
Volume (%) 1%
Revenue (%) 9% (
1%1)
Profit Before Interest & Taxation (%) 34% (
46%1)
Profit Before Interest & Taxation Margin (%) 5pp
1 In constant currency
DAIRIES MALAYSIA: RESULTSOn the back of effective brand building programmes, Dairies Malaysia maintained its No. 1 canned milk position with F&N, TEAPOT and CARNATION brands amid a slowdown in retail and consumer spending and rising cost of living. Impacted mainly by the depreciation of the Malaysian Ringgit against Singapore Dollar, revenue fell 9%, to $325m, on a 1% decline in volume. While domestic volume recorded marginal decline, the strong performance of its Export business cushioned the fall. In constant currency, revenue would have fallen 1%.
Aided by lower input costs and ongoing productivity improvements, Dairies Malaysia PBIT jumped 34% against the previous year, to $48m,
despite negative translation effects. In constant currency, its profit would have risen 46%. On the back of strong profit growth, PBIT margin improved 5 percentage points, to 15%.
Leveraging its strengthened distribution network – more than 63 distributors, 37 modern trade retailers and 76,560 stores nationwide – and marketing campaigns focusing on the application of its canned milk products in food and beverage, Dairies Malaysia was able to maintain its leadership positions in the condensed milk and evaporated milk segments in Malaysia.
Like its canned milk brands, Dairies Malaysia saw double-digit volume growth in its liquid milk brands, F&N MAGNOLIA and FARMHOUSE, in FY2016. FARMHOUSE, in particular, remained the leading premium pasteurised milk in Malaysia. This year, Dairies Malaysia continued to focus its efforts on growing its presence in the RTD liquid milk segment in Malaysia. Riding on the very successful launch of FARMHOUSE UHT milk and reintroduction of F&N MAGNOLIA Lo-Fat Hi-Cal pasteurised milk in FY2015, the Group started offering F&N MAGNOLIA UHT milk, in different flavours and pack sizes, to milk lovers in Malaysia.
In addition to reinforcing its market leading position in the canned milk category in Malaysia, Dairies Malaysia will also move forward with a focus on growing its presence in the RTD milk category. Building on our tagline ‘PURE ENJOYMENT. PURE GOODNESS’, Dairies Malaysia will continue with its targeted marketing activities to drive the growth of this segment in the years ahead. The Group believes that F&N MAGNOLIA and FARMHOUSE are well-positioned to leverage the Group’s in-house expertise, product offering and trusted relationships with consumers
to support the growth of Dairies Malaysia in the future.
The Group started a restructuring exercise to integrate its soft drinks and dairies operations in Malaysia. This exercise seeks to combine the strengths of both Soft Drinks Malaysia and Dairies Malaysia brands and streamline their procurement, distribution, logistics and services to better serve their customers and improve the scalability of Malaysia F&B’s operations. The integration of the Malaysian operations will continue into FY2017.
DAIRIES • CORE MARKET
MALAYSIA
46 Fra s e r a n d N ea v e , L i m i t e d & S u b s i d i a r y C o m pa n i e sA n n u a l R e p o r t 2 0 1 6

F&B
Overview
Beverages
New
Market
Dairies • M
alaysia
Mar
ket
Posi
tion
Canned Milk
easy-to-make F&N recipes, to highlight the theme of togetherness.
Another key initiative was the launch of “F&N Bake Off Challenge” campaign. The challenge saw 24 students demonstrating their ability to create amazing multi-layered mousse-based cake using F&N Full Cream Sweetened Condensed Milk and Evaporated Creamer, for the coveted title of “Entremet Maestro”.
CARNATIONCARNATION, Nestle’s brand licenced to F&N, has become the leading evaporated creamer brand in Malaysia. In collaboration with, for the second consecutive year, international recording artiste and MasterChef Soo Wincci, the “Go Gourmet” campaign introduced her signature dishes using CARNATION Evaporated Creamer, positioning the brand as a reliable cooking helpmate that allows one to create consistently delicious meals.
To further drive in-home consumption, Dairies Malaysia organised a series of live cooking demonstrations nationwide. At the demonstrations, CARNATION Evaporated Creamer was used to showcase the ease of incorporating the product into everyday dishes and beverages.
CANNED MILK: GETTING CREATIVE WITH CONDENSED AND EVAPORATED MILKF&NF&N Canned Milk reinforced its No. 1 Condensed and Evaporated Milk position by focusing its marketing campaign on the application of canned milk in food and beverage. This year, a major marketing highlight was the “Aroma Kasih Sayang” campaign – a key campaign launched with one of Malaysia’s celebrity couples aimed at strengthening bonding moments for friends and family. In addition to trade promotions, the campaign also offered eight deliciously
TEAPOTIn FY2016, TEAPOT refreshed its brand imagery and rolled out a nationwide consumer promotion, “Tradition in a TEAPOT”, to communicate its brand heritage and consistent quality. To maintain brand visibility and strengthen its brand positioning, the campaign employed above-the-line advertisements, sampling opportunities and in-store displays.
LIQUID MILK: NEW GROWTH PILLARF&N MAGNOLIAHaving established a foothold in the pasteurised and sterilised milk segments, F&N MAGNOLIA further entrenched its presence in the local
#1
47Fra s e r a n d N ea v e , L i m i t e d & S u b s i d i a r y C o m pa n i e s A n n u a l R e p o r t 2 0 1 6

CEO BUSINESS REVIEW
DAIRIES • CORE MARKET MALAYSIA
UHT milk segment – the largest in terms of market size in the RTD milk segment – with F&N MAGNOLIA UHT Milk. Available in full-cream, low-fat and chocolate milk variations, in 1L and 200ml packs, the new product offers Malaysians a wider choice and convenience when it comes to RTD milk.
As part of its integrated campaign which included television, radio and print advertisements, as well as roadshows, F&N MAGNOLIA also partnered brand ambassador Farah Ann in educating consumers about the importance of drinking milk daily for a healthy body and mind. Farah Ann is Malaysia’s national youth gymnast, a medallist and a role model for youths. To create further awareness and trials for F&N MAGNOLIA UHT Milk, product sampling was carried out in schools, retail outlets and shopping malls nationwide.
In the food service industry, or Hotels, Restaurants and Cafés (“HORECA”) segment, F&N MAGNOLIA introduced the trade to its Barista Fresh Milk. Through sponsorship and participation in barista competitions, latte art workshops and coffee expos, F&N MAGNOLIA aimed to encourage conversion of HORECA customers to its specially formulated Barista Fresh Milk.
FARMHOUSEFARMHOUSE continued to focus communication of freshness and creamy texture of its Australia-sourced milk in its above- and below-the-line advertisements for its pasteurised and UHT milk. To drive higher brand awareness and acceptance of FARMHOUSE UHT Milk, which was launched last year, samplings were conducted in stores and at offices. A cross promotion with breakfast cereals was also conducted to drive breakfast consumption, the main consumption occasion of milk.
48 Fra s e r a n d N ea v e , L i m i t e d & S u b s i d i a r y C o m pa n i e sA n n u a l R e p o r t 2 0 1 6

F&B
Overview
Beverages
New
Market
Dairies • Th
ailand
DAIRIES • CORE MARKET
THAILAND
DAIRIES THAILAND: RESULTSGrowth of the Group’s best performing operation, Dairies Thailand, continued unabated in FY2016. Volume grew 3%, despite lost sales from Nestle’s BEAR BRAND and MILO UHT milk products, due to strong demand for its RTD milk and canned milk brands. The strong demand was supported by effective consumer and trade marketing activities, contribution from new launches of F&N MAGNOLIA UHT milk products and increased distribution coverage. Revenue increased marginally year-on-year, to $539m, due to adverse foreign exchange translation effects. In constant currency, Dairies Thailand would have recorded a 2% revenue growth. In spite of flat revenue, its PBIT jumped 65% year-on-year, to $67m, mainly due to favourable input costs,
Volume (%) 3%
Revenue (%)
0% ( 2%1)
Profit Before Interest & Taxation (%) 65% (
68%1)
Profit Before Interest & Taxation Margin (%) 5pp
1 In constant currency
a testament to the strength of F&N MAGNOLIA brand and Dairies Thailand’s route-to-market abilities.
In the coming year, Dairies Thailand will continue to fortify its market leading position in the canned milk category in Thailand. It will continue with its targeted marketing activities to drive the growth of this segment in the year ahead. As a reflection of our commitment and confidence in the canned milk segment, Dairies Thailand invested in a new filling and packaging line for evaporated milk, which was ready in February 2016, following the renewal of the Nestle’s trademark licence agreement in 2015. The Nestle’s licence was renewed for 22 years, until 2037, for the manufacturing and distribution of Nestle’s products in Singapore, Thailand, Malaysia, Brunei and Laos.
In addition to canned milk, Dairies Thailand will continue to build market shares in the RTD milk segment with F&N MAGNOLIA (UHT milk segment) and BEAR BRAND (sterilised milk segment). It looks to build on its growing market positions of these brands in their respective segments to gain a leadership position in the growing RTD milk segment.
improved operational efficiencies and more cost-effective trade distribution. Consequently, PBIT margin improved 5 percentage points, to 12%.
One of Dairies Thailand’s success factors is its ability to harness its extensive distribution network, which is supported by 18 distributors, 350 retailers and 137,000 stores. In FY2016, Dairies Thailand continued to expand its distribution coverage, mainly in the convenience channel, in line with the shift in consumer buying behaviour from planned purchase to frequent and spontaneous purchase based on convenience, promotions and product range. Dairies Thailand’s effective distribution strategy has allowed it to reap positive sales growth particularly in the convenience channel.
While the canned milk market in Thailand recorded single-digit growth rate, Dairies Thailand saw a double-digit volume growth in its canned milk business, supported by TEAPOT and CARNATION brands. The strong performance was due to focused marketing campaigns and initiatives, as well as effective distribution strategy. Consequently, as at FY2016, F&N’s market share improved to retain its No. 1 total canned milk position in Thailand.
Dairies Thailand’s first functional UHT milk, F&N MAGNOLIA Ginkgo Plus, continued to perform strongly in this fiscal year. Targeted marketing investment behind the brand resulted in double-digit volume growth and a 3% market share in the UHT Milk (All Family) segment in Thailand. This year, to maintain the growth momentum and to tap the rapidly growing UHT Milk (Kids) segment, Dairies Thailand extended its offering of UHT milk products by introducing the new F&N MAGNOLIA Kids Milk for young children. Within three months of its launch, F&N MAGNOLIA Kids Milk gained credible market share,
49Fra s e r a n d N ea v e , L i m i t e d & S u b s i d i a r y C o m pa n i e s A n n u a l R e p o r t 2 0 1 6

CEO BUSINESS REVIEW
CANNED MILK: INSPIRING GOURMET CREATIONSCARNATIONCARNATION, one of Nestle’s brands licenced to F&N, maintained its No. 1 canned milk position in Thailand with double-digit volume growth by reinforcing its image as the premium and preferred choice in food and beverage applications. This year, to drive in-home consumption, Dairies Thailand rolled out a new thematic television commercial “Perfect Harmony” to promote the dual usage of CARNATION Sweetened Beverage Creamer and CARNATION Evaporated Milk to ensure a better taste in food and beverages.
Coupled with its efforts in the trade through loyalty campaigns in key channels, premium promotions and point-of-sale materials, CARNATION retained its No. 1 Premium Evaporated Milk brand with two-thirds of the market share.
TEAPOT TEAPOT launched a new campaign this year to lift its brand image and increase on-premise and in-home consumption. It worked with a celebrity chef, who is known for his simple cooking style, to use TEAPOT in his creations to demonstrate and inspire all to use TEAPOT Sweetened Beverage Creamer in their beverages and dishes.
DAIRIES • CORE MARKET THAILAND
Mar
ket
Posi
tion
Canned Milk
#1
50 Fra s e r a n d N ea v e , L i m i t e d & S u b s i d i a r y C o m pa n i e sA n n u a l R e p o r t 2 0 1 6

F&B
Overview
Beverages
New
Market
Dairies • Th
ailand
As part of Dairies Thailand’s strategy to continuously improve and innovate its products, this year, it rolled out a new packaging for TEAPOT Sweetened Beverage Creamer in the form of a squeezable tube. Introduced in all channels nationwide to cater to customers’ busy lifestyles, this portable 180ml tube packaging offers both affordability and convenience to consumers.
Besides creating consumption opportunities throughout the day in its consumer sampling activities using popular food applications, TEAPOT also strengthened its online engagement with young adults and young families. It successfully garnered 40,000 fans on its Facebook page, “TEAPOT Happy Society”, within three months of its launch.
LIQUID MILK: NEW GROWTH PILLARF&N MAGNOLIATo tap into the rapidly growing UHT Milk (Kids) segment, Dairies Thailand extended F&N MAGNOLIA’s offering of UHT milk to include a children’s range
F&N MAGNOLIA Ginkgo Plus, which was launched last year, has continued to perform well, gaining 2.8% market share in the UHT Milk (All Family) segment as at FY2016. Fortified with ginkgo extract, vitamin B12 and calcium, F&N MAGNOLIA Ginkgo Plus promotes cognitive function. In the brand’s television and online commercials, its newly appointed brand ambassador, May Ratchanok Intanon, World No. 1 in Women’s Singles and Thailand’s top badminton player, conveyed the brand’s key message of boosting one’s brain health to support the pursuit of goals. Large-scale in-store sampling carried out in convenience stores further boosted brand visibility and encouraged product trials of F&N MAGNOLIA Ginkgo Plus.
- F&N MAGNOLIA Kids Milk. The UHT Milk (Kids) segment, a fast-growing category, recorded a 10% and 13% year-on-year growth in 2016 in value and volume, respectively. Catered specifically for young children in today’s digital world, the new F&N MAGNOLIA Kids Milk is a functional beverage with goji berry and lutein added to promote eye health.
The launch of F&N MAGNOLIA Kids Milk was supported by an integrated marketing campaign that included broadcast, outdoor and online advertisements, as well as roadshows and samplings in schools and retail outlets. Three months after the launch, as at FY2016, F&N MAGNOLIA Kids Milk recorded gains in market share from positive consumer demand.
51Fra s e r a n d N ea v e , L i m i t e d & S u b s i d i a r y C o m pa n i e s A n n u a l R e p o r t 2 0 1 6

CEO BUSINESS REVIEW
DAIRIES SINGAPORE: RESULTS A rise in Dairies Singapore’s export business due to the Group’s increased distribution in newly-added markets cushioned the drop in domestic sales. As a result, Dairies Singapore FY2016 revenue fell 4%. Coupled with higher marketing spend in new markets, its FY2016 earnings fell 15%.
Aided by effective brand building activities and new product launches, Dairies Singapore maintained its No.1 and No. 2 positions in the Chilled Juices and Liquid Milk categories, respectively. New product launches of the improved F&N MAGNOLIA Plus Oats Lo-Fat Hi-Cal Milk and F&N FRUIT TREE FRESH Apple, Beetroot & Carrot (“ABC”) No Sugar Added Mixed Juice Drink, in addressing consumers’ growing demand for healthier drinks with nutritional benefits, generated positive response and lifted sales.
LIQUID MILK AND YOGHURT DRINK: F&N MAGNOLIA Started in 2014 and extended to 2015, F&N MAGNOLIA brought back its successful “Drink Milk Fresh” campaign in 2016 to continue advocating the importance of drinking milk at its freshest, within three days of opening. This is in line with the recommendation of Singapore’s Agri-Food and Veterinary Authority. F&N MAGNOLIA encouraged consumers to drink from 1L-pack, instead of 2L-pack, to enjoy milk at its freshest. Besides consumer promotion, F&N MAGNOLIA encouraged the exchange of empty 2L milk bottles for a free F&N MAGNOLIA 1L-pack, via in-store roadshows and its
Mar
ket
Posi
tion
Liquid MilkLiquid Milk
#2
o me ( ) 2%
e en e ( ) 4%
Profit Before Interest & Taxation ( ) 15%
Profit Before Interest & Taxation ar in ( ) 0pp
roving milk truck, to boost trials and consumption. The campaign, which was further supported by above-the-line advertising, resulted in a sales uplift and volume share increase within the Liquid Chilled Milk segment during the month of execution.
To generate consumer interest, F&N MAGNOLIA collaborated with a popular Hollywood animated movie in a joint promotion supported by a 360-degree campaign. The movie characters were featured on the packaging of F&N MAGNOLIA’s pasteurised and UHT milk products, as well as its yoghurt drink range. Consumer response was very positive; F&N MAGNOLIA recorded sales and
DAIRIES • CORE MARKET
SINGAPORE
52 Fra s e r a n d N ea v e , L i m i t e d & S u b s i d i a r y C o m pa n i e sA n n u a l R e p o r t 2 0 1 6

F&B
Overview
Beverages
New
Market
JUICE: F&N FRUIT TREE FRESHFor the year in review, new flavour F&N FRUIT TREE FRESH ABC No Sugar Added Mixed Juice Drink was introduced to inject excitement in Dairies Singapore’s juices portfolio. Out-of-home, print and social media advertising, product trials executed in the form of roving bicycles distributing samples, eye-catching in-store displays and in-store roadshows helped boost its sales. Within two months of its launch, F&N FRUIT TREE FRESH ABC No Sugar Added Mixed Juice Drink has become one of the most popular flavours within the F&N FRUIT TREE FRESH juice portfolio.
F&N FRUIT TREE FRESH will continue to innovate to excite consumers with healthier, more refreshing flavours of fruit juices.
Dairies • Sin
gapore
volume growth, and market share increase across the liquid milk and yoghurt drink segments.
Back by popular demand, the F&N MAGNOLIA Plus Oats Lo-Fat Hi-Cal Milk was reintroduced in Singapore this year. Reformulated with added beta glucan to boost the body’s immune system, F&N MAGNOLIA Plus Oats Lo-Fat Hi-Cal Milk is the only pasteurised milk in Singapore to be fortified with oats for more nutritional benefits. Above-the-line communications, in conjunction with in-store roadshows resulted in successful conversions to consumer purchases. The huge success of F&N MAGNOLIA Plus Oats Lo-Fat Hi-Cal Milk doubled F&N MAGNOLIA’s volume compared to the previous year and contributed to the brand’s highest volume share in three years.
Mar
ket
Posi
tion
Chilled Juices
#1
53Fra s e r a n d N ea v e , L i m i t e d & S u b s i d i a r y C o m pa n i e s A n n u a l R e p o r t 2 0 1 6

CEO BUSINESS REVIEW
DAIRIES ICE CREAM: OVERVIEWF&N’s Ice Cream division has commercial operations in about 10 countries (primarily in Malaysia, Singapore and Thailand), with well-established and trusted brands like F&N MAGNOLIA, KING’S and MEADOW GOLD. The commercial operations are supported by two manufacturing plants in Malaysia and Thailand. This year, through continuous product innovation, Dairies Ice Cream continued to excite its consumers by introducing new variants in the various markets.
MALAYSIADespite subdued consumer sentiment amid a softened economic environment in Malaysia, the ice cream market remained stable and has been forecast to grow at a steady rate in the medium term. This is due to growth in discretionary income, as well as ice cream being regarded as a treat amid consumers’ busy schedules.
This year, the Group introduced several new products in Malaysia. In particular, three new innovative flavours of KING’S Potong have seen strong consumer acceptance. KING’S Potong Teh Tarik was launched in December 2015 to offer Malaysians the convenience of enjoying their favourite local tea
beverage in an ice cream stick form. Developed based on F&N’s original recipe using F&N Sweetened Beverage Creamer, KING’S Potong Teh Tarik was also extended to Singapore in limited quantities. In April 2016, KING’S Potong Gold Mao Shan Wang, made with 100% Mao Shan Wang puree, was launched as a limited edition flavour. Also launched in April 2016, KING’S Potong Coconut used 100% fresh Thai coconut milk and coconut flesh to create a refreshing creamy treat.
As part of KING’S continuous efforts to generate excitement, it updated the look of KING’S Sundae-licious to give it a more fresh and premium look. In addition, a new flavour, KING’S Sundae-licious Mixed Berries, a vanilla ice cream topped with mixed berries swirls, was also introduced this year.
MEADOW GOLD was launched in four new flavours in October 2015 to offer Malaysia’s discerning ice cream lovers more variety in the tub ice cream segment. Roadshows were conducted to encourage trials and social media interactions with consumers helped boost awareness and consumer engagement.
In the coming years, multi-pack and take-home ice cream are expected to register the fastest growth as consumers remain price sensitive amid a rising cost of living and deem these ice cream formats as better value-for-money. Impulse, or single portion ice cream, will continue to register growth in the convenience stores and smaller independent grocers due to accessibility. F&N is poised to seize these growth opportunities as we have well established multi-packs, value tubs and single portion ice cream brands to cater to various consumer needs.
SINGAPOREThis year, F&N MAGNOLIA Gotcha, catered for children, underwent a packaging revamp, to reflect its ‘Healthier Choice Snack’ status endorsed by Singapore’s Health Promotion Board. Recognising the increasing importance Singaporeans place on their health, all newly developed ice cream products by F&N for the Singapore market in the future will go through a strict R&D process to ensure that they satisfy the criteria of a ‘Healthier Choice Snack’.
DAIRIES
ICE CREAM
54 Fra s e r a n d N ea v e , L i m i t e d & S u b s i d i a r y C o m pa n i e sA n n u a l R e p o r t 2 0 1 6

F&B
Overview
Beverages
New
Market
Dairies • Ice C
ream
KING’S Potong remains Singapore’s No. 1 Potong brand. With the purpose of extending its product offering and delighting consumers with new flavours, KING’S Potong Gold Mao Shan Wang was launched as a limited edition variant, to favourable consumer reception. Even though it was distributed exclusively through one retailer, KING’S Potong Gold Mao Shan Wang performed beyond management’s expectations and was sold out within a few weeks of its launch.
In its efforts to build brand engagement, drive trials and convey its brand essence of positivity and energy, F&N MAGNOLIA Mag-A-Cone organised a Lip Sync Battle Competition in April 2016. Supported by radio, print and social media communication, the competition generated significant buzz, both on- and offline. Extending its reach to more families and children, F&N secured the title of Exclusive Ice Cream Partner for the POSB Passion Run 2016 and supported the event with 8,000 sticks of F&N MAGNOLIA Mag-A-Cone and F&N MAGNOLIA Gotcha.
THAILANDCapitalising on consumers’ growing demand for impulse ice cream in Thailand, Ice Cream division focused its new launches this year on single portion stick ice cream. Riding on
the popularity of durian, new flavour F&N MAGNOLIA Sawasdee Durian, made with durian puree, was launched as a limited edition product during
the durian harvest season. This flavour was so well received that it sold out quickly, and the Group has plans to bring it back in 2017. Another one of Ice Cream division’s innovations was F&N MAGNOLIA Gotcha Space Captain, where jelly was added to ice confection, and was met with good response from its target audience of children aged six to nine.
Thailand’s ice cream market, projected to grow between 12% to 15% in the coming year, will continue to be driven mainly by impulse single portion ice cream. As one of the top three players in this market, F&N will continue to invest in brand building activities and product innovation to drive demand and grow market share.
55Fra s e r a n d N ea v e , L i m i t e d & S u b s i d i a r y C o m pa n i e s A n n u a l R e p o r t 2 0 1 6

CEO BUSINESS REVIEW
middle-class population will present tremendous growth opportunities for the Group.
RESULTSSince the establishment of the F&N branch office in Yangon in 2014 to conduct market research, coordinate sales and marketing efforts, and provide support to local distributors, the Group, with 100PLUS, has recorded market share gains year-on-year. Started with 100PLUS Original and 100PLUS Lemon Lime, the Group also offers 100PLUS Orange, 100PLUS Edge, F&N NUTRISOY, F&N SEASONS, OISHI and TEAPOT, and has further expanded the Group’s footprint in Myanmar, much to the delight of our consumers.
As a result of focused and consistent support behind the brand, coupled with a rapidly expanding route-to-market, 100PLUS has established itself as the leading isotonic beverage in the country. Riding on the successes of 100PLUS Original and Lemon Lime, this year, the Group extended its offering with new variants, 100PLUS Orange and 100PLUS Edge. 100PLUS Orange was launched as an additional flavour to 100PLUS ’ carbonated isotonic range in Myanmar. The launch was
1 Source: World Bank
supported by print and social media, and eye-catching displays in outlets of Myanmar’s supermarkets and hypermarts. The launch of 100PLUS Edge, 100PLUS non-carbonated variant, was supported by billboard advertisements, attractive displays in the modern trade, social media communication as well as consumer trials.
This year, one of the key marketing campaigns was the sponsorship of the Yoma Yangon International Marathon in January 2016. As one of the major running events held in Yangon, this marathon attracted over 6,000 international and local runners, making it the perfect platform for the launch of 100PLUS Edge. As the event’s Official Hydration Partner, brand visibility of both 100PLUS and 100PLUS Edge was amplified via hydration stops along the race route, successfully reaching out to local and international runners. In addition to supporting Yoma Yangon International Marathon, 100PLUS was also a keen participant of the Bagan
Projected Market Size of Isotonic Segment
Isotonic Volume Isotonic Value
Volume (’000 lits) Value (’m Kyat)18,000
CAGR Volume1
18%
CAGR Value1 16%
2021
F
2016
F
2015
1 2016F-2021F
MYANMAR: MARKET OVERVIEWAn agriculture supply shock from heavy flooding, slowdown in new foreign investment and inflationary pressures eased Myanmar’s economic growth to 7% in 2016, from an average of 8.5% in the last two years. Nevertheless, as the economy recovers from the effects of the floods, Myanmar’s prospects remain optimistic, with real GDP growth rate projected to rise to 7.8% in 2016-2017, and average 8.2% per year over the medium-term1. The increasing levels of discretionary expenditure and changes in consumption habits among a burgeoning, largely urban
Mar
ket
Posi
tion
Isotonic
NEW MARKET
MYANMAR
Available in Myanmar
#1
56 Fra s e r a n d N ea v e , L i m i t e d & S u b s i d i a r y C o m pa n i e sA n n u a l R e p o r t 2 0 1 6

F&B
Overview
Beverages
Dairies
New
Market • M
yanm
ar
Temple Marathon. Having cemented its position as a supporter of active lifestyles, 100PLUS continued its support of Myanmar Football Federation and extended its sponsorship of sports organisations to include Myanmar Golf Federation.
The Group continued to partner Citymart Holdings Ltd (“Citymart”) in its efforts to increase 100PLUS ’ brand visibility and product availability. Citymart is the No. 1 supermarket and hypermart chain operator in Myanmar. Leveraging Citymart’s wide retail presence, the Group was able to drive consumer awareness and increase visibility of its products through consumer promotions, roadshows and in-store displays. Through the jointly organised “Active Family Day Out” event, which was held for the 2nd consecutive year in 2016, F&N was able to extend its reach to more families through product sampling opportunities and widespread publicity.
Additionally, the year in review saw the launch of TEAPOT canned milk in Myanmar. Canned milk is a staple product in Myanmar and is widely used in tea shops, a ubiquitous fixture in Myanmar’s social life. To capitalise on the strong demand for canned milk, the Group expanded its products beyond soft drinks to formally
introduce TEAPOT Sweetened Beverage Creamer (“SBC”) and Evaporated Creamer (“EVAP”) . To increase awareness and consumption,
food and beverage applications using TEAPOT were introduced at the launch event attended by more than 150 business partners. A trade loyalty programme for local tea shops and sampling programmes in hospitals were also implemented. Since its launch, TEAPOT has performed well with gains in market shares for both SBC and EVAP within the canned milk segment.
Going forward, the Group expects competition in the growing isotonic and canned milk segments to intensify. Nonetheless, we will continue to build on our existing platform to step up our brand building and trade activities, so as to maintain 100PLUS ’ leading position and grow TEAPOT ’s volume shares.
57Fra s e r a n d N ea v e , L i m i t e d & S u b s i d i a r y C o m pa n i e s A n n u a l R e p o r t 2 0 1 6

CEO BUSINESS REVIEW
VIETNAM: MARKET OVERVIEWVietnam, earmarked as one of the Group’s new markets in its regional expansion plan, is one of ASEAN’s fastest-growing economies. With a projected GDP growth rate averaging 6% in the next three years, a young population, rising middle class and increasing urbanisation, Vietnam presents huge growth potential for F&N.
To this end, the Group incorporated F&N Vietnam Limited Liability Company in August 2016, effectively enabling it to extend its operations in this market beyond the functions of a representative office (set up in June 2015). F&N Vietnam distributes, markets and conducts trading of non-alcoholic beverages and beer in the country.
RESULTSSince the Group’s core brand 100PLUS was launched in 2015, its performance has been promising. On the back of intensified trade and consumer
Projected Market Size of Isotonic Segment
Isotonic VolumeIsotonic Value
Volume (m lits) Value (US$m)250 200
CAGR Volume1
15%
CAGR Value1 17%
2021
F
2016
F
2015
1 2016F-2021F
marketing programmes coupled with an expanded route-to-market, 100PLUS FY2016 volume has increased manifold, outpacing the projected 19% growth rate of the isotonic segment in 2016. This financial year, efforts to expand route-to-market resulted in more than 50% increase in each of the convenience stores, on-premise and general trade channels.
NEW MARKET
VIETNAM
To capitalise on the significance of Tet festival, 100PLUS rolled out a festive packaging to drive sales and brand awareness. Consumer trials were also carried out in on-premise and modern trade outlets, and convenience stores. Eye-catching in-store displays and social media were also used to boost awareness and visibility.
Available in Vietnam
58 Fra s e r a n d N ea v e , L i m i t e d & S u b s i d i a r y C o m pa n i e sA n n u a l R e p o r t 2 0 1 6

F&B
Overview
Beverages
Dairies
New
Market • V
ietnam
100PLUS continued to support various sports events and engaged different stakeholder groups in FY2016. It continued its sponsorship of the Ho Chi Minh City Media Futsal Tournament and the Danang International Marathon, where over 5,000 participants sampled 100PLUS as the event’s exclusive isotonic drink. Other events supported by 100PLUS as the exclusive isotonic drink included the District 4 Charity Walk & Cycling Tournament, the Under-18 National Tennis Tournament and the International Table Tennis Competition. 100PLUS also sponsored the Ho Chi Minh City Student Union
which enabled it to reach out to students in high schools and universities.
Riding on the success of 100PLUS Original, new flavours of 100PLUS –Orange, Lemon Lime and Berry – were launched in FY2016 to offer consumers more choices. In September 2016, CHANG beer was launched to encouraging response.
F&N Vietnam will continue to drive consumer engagement and brand awareness, in addition to sharpening its route-to-market to tap into the growth opportunities presented by this market.
Available in Vietnam
59Fra s e r a n d N ea v e , L i m i t e d & S u b s i d i a r y C o m pa n i e s A n n u a l R e p o r t 2 0 1 6

CEO BUSINESS REVIEW
THAILAND: MARKET OVERVIEWWith the growing health consciousness among Thai consumers and increasing demand for healthier products with reduced sugar and functional benefits, beverage manufacturers have been introducing products focused on healthier concepts. This year, to support consumers in making healthier diet choices, the Thai government introduced the ‘Healthier Choice’ label for F&B products to help consumers identify healthier food options. 100PLUS has been identified as a ‘Healthier Choice’ product and the Group has adopted the label in its packaging from September 2016. It will leverage consumers’ increasing focus on health and nutrition to reinforce its image as a healthier soft drink suitable for all occasions.
RESULTSThe Group debuted in Thailand’s soft drinks market with the launch of core brand, 100PLUS, in February 2015. Despite being a new entrant in the isotonic segment, 100PLUS has performed well to achieve a credible No. 3 position. The Group operates in the Thai soft drinks market through its licensee Thai Drinks, a subsidiary of Thai Beverage PCL, for the manufacturing, marketing and distribution of 100PLUS in Thailand.
#3
Mar
ket
Posi
tion
Isotonic
NEW MARKET
THAILAND
ai a e in T ai an ( oft rin s)
60 Fra s e r a n d N ea v e , L i m i t e d & S u b s i d i a r y C o m pa n i e sA n n u a l R e p o r t 2 0 1 6

F&B
Overview
Beverages
Dairies
New
Market • Th
ailand
continued to ride on the momentum built to extend brand visibility and strengthen its position as a functional soft drink. Tapping into the increasingly popular trend of cycling, 100PLUS ran a nationwide consumer promotion “Bike in Japan” from March to May 2016. The promotion was highlighted through an integrated marketing campaign which included television and cinema commercials, print and online advertising, in-store sampling and event sponsorship. Boosted by strong consumer interest and word of mouth, both trade and consumer off-take achieved significant increase over the three-month period. Through “Bike in Japan”, 100PLUS ’ brand image as a functional soft drink also strengthened among consumers.
Other brand building activities included a television commercial aired from May to August 2016 and strategic media placements to boost top-of-mind, as well as event sponsorships to drive trials. This year, 100PLUS supported 34 running and cycling events in Thailand, and has become the preferred beverage partner of event organisers, successfully reinforced its position as the drink of choice for those who lead active lifestyles. 100PLUS also capitalised on its growing
Positioned in Thailand as the first soft drink with functional benefits, 100PLUS offers increasingly health-conscious Thai consumers both the functional benefits of rehydration and replenishment of lost fluids and minerals in the body, as well as the refreshing sensation of a lightly carbonated soft drink. As a relatively new entrant, this year, the Group stepped up its efforts to educate consumers on its product benefits, increase brand visibility and strengthen its position as the healthier alternative to carbonated soft drinks for every day consumption.
Following FY2015’s successful launch of 100PLUS Original and 100PLUS Lemon Lime, which was supported by a nationwide campaign, 100PLUS
Projected Market Size of Isotonic Segment
Isotonic VolumeIsotonic Value
Volume (m lits) Value (TB$m)400 24,000
CAGR Volume1
6%
CAGR Value1 10%
2021
F
2016
F
2015
1 2016F-2021F
presence in fitness centres to drive consumption. It will optimise the fitness channel in the coming year to encourage even more consumption from consumers looking to rehydrate after their exercise.
In the new financial year, the Group will continue to strengthen 100PLUS ’ brand positioning of being the healthier soft drink of choice and broaden consumption opportunities beyond sports to every day occasions.
61Fra s e r a n d N ea v e , L i m i t e d & S u b s i d i a r y C o m pa n i e s A n n u a l R e p o r t 2 0 1 6

CEO BUSINESS REVIEW
PUBLISHING & PRINTING
PUBLISHING & PRINTING GROUP RESULTSFY2016 marked an exciting year for the Publishing & Printing division (“P&P”) amid continued difficult operating environment. Consequently, we saw mixed performances across our P&P division. Retail and Distribution recorded revenue gains, aided by strong sales performance in airport retail and high street stores, higher partwork sales in Hong Kong and higher contribution from magazine Distribution in Singapore. Publishing, on the other hand, recorded lower revenue as a result of a slow-down in demand for our textbooks due to the end-of-school adoption cycle. Similarly, lower print volumes in Singapore and Malaysia as well as the discontinuation of a joint venture in China caused Print revenue to fall. Accordingly, P&P FY2016 revenue declined 10%, to $308m. Despite the decline in revenue, we were able to narrow our operating losses substantially in FY2016 to $5m, from $15m in FY2015. This was mainly the result of last year’s restructuring exercise to reduce Print’s operating cost
By focusing on maintaining and developing strategic alliances with our key partners and creating greater brand awareness, we have placed Marshall Cavendish at the forefront of education.
partnerships with various international publishers and secured new catalogue printing work in Singapore, Malaysia and China.
Leveraging our leading position in the education publishing sector, P&P will be officially rolling out Times Experience and GoGuru in FY2017. Times Experience is an event organiser with events centred on ways to enhance a child’s learning experience beyond the classroom. Tapping on Marshall Cavendish Education’s expertise in education, Times Experience offers quality educational content in a relatable and contemporary approach for the modern child. Happy Sparks will be the first event managed by Times Experience in Singapore and together with GoGuru, Times Publishing Group’s e-commerce portal, it is our aim to engage our customers directly and increase consumer touch points providing a wider offering of products, services and solutions focusing on learning. In addition, P&P will also be launching Brainy Arkies – an adaptive learning app, in FY2017, giving us the opportunity to showcase our ability to create innovative solutions.
MR SIEW PENG YIMChief Executive Officer, Times Publishing Group
base and the absence of a one-off catch up of depreciation charges.
Marshall Cavendish, our publishing arm, continued its push into the international educational publishing market. This year, we added South Africa, Spain and Colombia to our global footprint of over 60 countries, while making further inroads into the UK with strong school adoptions. By focusing on maintaining and developing strategic alliances with our key partners and creating greater brand awareness, we have placed Marshall Cavendish at the forefront of education.
Our decision to rationalise our printing plants last year in anticipation of weak volume and margin pressure has helped to ensure that profitability of our Print division could be sustained. The Print division is now leaner and better able to meet the challenges in the market. This year, while Singapore and Malaysia saw a fall in print volumes, we saw recoveries in China, with encouraging resumption of book orders from overseas customers in the second half of FY2016. We have also successfully renewed business
62 Fra s e r a n d N ea v e , L i m i t e d & S u b s i d i a r y C o m pa n i e sA n n u a l R e p o r t 2 0 1 6

Amid challenging times, we will also continue to expand our influence in the field of educational retail through aggressive brand profile development over digital media and on e-commerce platforms as well as through the launch of a new lifestyle bookstore concept, while looking to further improve manufacturing efficiency and cost management in our Print division.
PUBLISHINGThe Group’s publishing business is marketed under the brand, Marshall Cavendish (“MC”). As a major international content provider, MC publishes extensively with interests spanning Education, General Interest, Business Information and Home Reference.
Publishing revenue declined primarily due to lower Education Publishing revenue. Demand for US textbooks were affected by the end-of-school adoption cycle. However, growth in non-US export markets were in line with expectations.
Publishing: EducationWhile Marshall Cavendish Education (“MCE”) continued to develop new print and digital educational content in its existing markets in Singapore, Hong Kong and the US, it also looked to push for more adoption of its content in new markets. This year, MCE successfully took its Math programme to Spain and Colombia, further strengthening its brand position in Latin America.
In Singapore, MCE has long advocated the importance of enhancing teachers’ capacity to improve student learning and development outcomes with its annual MCE Conference. For the fifth year running, this three-day event continued to enjoy strong support.
Attended by 150 international policymakers, curriculum specialists, school leaders and educators, the huge turnout to the 2016 MCE Conference bears testament to the growing recognition of Singapore’s world-class curriculum.
Also in Singapore, MCE collaborated with leading US adaptive learning technology company, Knewton, to introduce a personalised adaptive Mathematics solution MCEduworld in early 2016. Supported by Infocomm Development Authority of Singapore, nine schools in Singapore have embarked on this pilot programme.
MCE, together with its partners, won the tender for the development of Student Learning Space for the Ministry of Education, Singapore (“MOE”). The new online Teaching and Learning Application System and Digital Resource Library will provide teachers and students access to quality digital teaching and learning resources produced by MOE, teachers and those curated from other sources.
Riding on the successes of “Primary Mathematics” and “Math in Focus”, this year, MCE developed “Math On”, an online supplement that contains comprehensive assessment tools and interactive digital resources aligned to the US Common Core State Standards. This new addition to its suite of innovative digital solutions enables MCE to continue to stamp its authority in the area of Mathematics in the US.
Beyond the US, MCE also continued its efforts to promote the “Inspire Maths” series in partnership with Oxford University Press to bring its Singapore Maths programme into the UK. An extensive series of events focusing on public relations, professional development as well as online campaigns drove new adoptions.
Profit Before Interest & Taxation ($m)
FY2015 FY2016
Change from FY2015 nm
-5
-15
Revenue ($m)
FY2015 FY2016
Change from FY2015 -10%
308341
Key
Hig
hlig
hts
Over
60Export
Countries
In This SectionPublishing & Printing Group Results 62Publishing & Printing • Publishing 63Publishing & Printing • Print 65 Publishing & Printing • Retail & Distribution 65
Publish
ing &
Printin
g
63Fra s e r a n d N ea v e , L i m i t e d & S u b s i d i a r y C o m pa n i e s A n n u a l R e p o r t 2 0 1 6

CEO BUSINESS REVIEW
PUBLISHING & PRINTING
Marshall Cavendish Education Hong Kong (“MCE HK”) has also done well this year. Knowing that Hong Kong places a strong emphasis on Science, Technology, Engineering and Mathematics (“STEM”) education for their students, MCE HK, leveraging its position as a curriculum leader, integrated various subjects into Hong Kong’s STEM education and
inter-school STEM project competitions were also organised with good participation rates from schools.
Publishing: OthersGeneral and Reference (“GR”) successfully published several high profile titles in 2016. These included “It ’s Easy to Cry” (by the late criminal lawyer Subhas Anandan), “Up Close with Lee Kuan Yew” (essays from 37 close friends and colleagues of Mr Lee) and “Conversations with Tunku Abdul Rahman” (Malaysia’s first prime minister).
The late Subhas Anandan’s second book “It ’s Easy to Cry” was launched posthumously in December 2015. Subhas was Singapore’s best-known criminal lawyer with an empathy for all his clients, and a foremost champion of pro bono work. The book held its place on the Bestsellers List for a record 20 weeks.
Offices Manufacturing Plants
conceptualised many initiatives to encourage STEM amongst the youth. In addition, MCE also established the MC STEM Academy, in partnership with technology providers and an advisory board of esteemed educators. As a result, it managed to organise hands-on STEM workshops which saw overwhelming attendance for each event. In addition to workshops,
United States of America
United Kingdom
Chile
China
Hong Kong
India Thailand
Australia
MalaysiaSingapore
64 Fra s e r a n d N ea v e , L i m i t e d & S u b s i d i a r y C o m pa n i e sA n n u a l R e p o r t 2 0 1 6

GR continued its tradition of publishing biographies of influential individuals in Asia and beyond with “Up Close with Lee Kuan Yew”. This intimate collection of 37 essays by Mr Lee’s closest colleagues and friends was launched in March 2016. The book was reviewed favourably by mainstream media sources and quickly took the No. 1 spot on The Straits Times Bestsellers List.
Beyond our shores, MCIA, our GR publishing arm, had the opportunity to publish several strong Malaysian titles this year, most notably Conversations with Tunku Abdul Rahman. The book launch took place at the Tunku Abdul Rahman memorial in April 2016.
PRINTThe Printing operations in Singapore and Malaysia continued to face a challenging printing environment.
The challenges included lower print volumes and margin pressure. As a result of FY2015’s restructuring exercise to reduce its cost structure, Print division was able to narrow its losses this year, despite a drop in revenue. The restructuring efforts to realign capacity and demand as well as the absence of a one-off catch up of depreciation charges in 2015 helped improve the bottom line. The Printing operations in China, on the other hand,
recorded improved sales on the back of higher export.
RETAIL & DISTRIBUTIONRetail and Distribution division (“R&D”) experienced revenue gains due to improved scale in magazine distribution, strong partwork sales and higher contribution from new retail stores opened in high-street and airport.
This year, R&D continued to strengthen its retail positioning by catering to the varied interests and ages of consumers, especially families and children, inspiring and engaging them with more creative and interactive in-store activities. As such the ongoing rebranding efforts of Times Bookstores to encourage community building have shown encouraging results.
Publish
ing &
Printin
g
65Fra s e r a n d N ea v e , L i m i t e d & S u b s i d i a r y C o m pa n i e s A n n u a l R e p o r t 2 0 1 6

INVESTOR RELATIONS
EFFECTIVE AND OPEN COMMUNICATIONThe F&N Group is committed to promoting effective and open communication with all stakeholders, ensuring consistency and clarity of disclosure at all times. We aim to engage with our shareholders and investment community openly and regularly in order to facilitate a mutual understanding of our respective objectives, and to provide information on our corporate strategies, trends, operational performance and financial information to the investment community.
To achieve that, F&N makes every effort to disseminate information through a broad range of communication channels and do not provide information selectively. Such commitment ensures that investors have easy access to information on the Group so that they can effectively evaluate the company and make informed investment decisions.
REGULAR DIALOGUES WITH T I T T ITBesides communicating regularly with shareholders and the investment community via disclosures of material and other pertinent information through regular dialogues and announcements to SGX-ST, the Investor Relations team undertakes road shows (together with key senior management), investor seminars and conferences to keep the market and investors apprised of the F&N Group’s corporate developments and financial performance.
In our second year of regional expansion, the Investor Relations team, together with senior management, continued to actively engage and update the investment community on the activities the Group had undertaken in the marketplace.
Retail investors remain an important part of our outreach efforts. In addition to annual general meetings, the Investor
Relations team addresses the concerns of retail investors through email, telephone and online query form on F&N’s website.
AWARDSF&N was the winner of the Most Transparent Company Award – Consumer Staples category at the 17th Investors’ Choice Awards organised by the Securities Investors Association Singapore. The award recognises F&N’s outstanding efforts in upholding high levels of disclosure and transparency standards in our communication with shareholders and the public. In the same event, the Group also attained the Internal Audit Excellence Award – Runner-Up for our effective internal audit process.
DIVIDENDThe Group maintained a healthy track record of generous shareholder distributions. For the financial year ended 30 September 2016, the directors have recommended a final dividend of 3.0 cents per share, which together
with the interim dividend of 1.5 cents paid earlier brings total dividend for the year to 4.5 cents per share. In line with the Group’s dividend policy, the proposed payout represents a distribution of 60% of the Group Attributable Profit before fair value adjustment and exceptional items (from continuing operations).
FOR GENERAL ENQUIRIES ON F&N, PLEASE CONTACT:Ms Jennifer YuHead, Investor RelationsTel: (65) 6318 9393Fax: (65) 6271 7936Email: [email protected]: fraserandneave.com
SHARE REGISTRAR AND T ITricor Barbinder Share Registration Services80 Robinson Road#02-00Singapore 068898Tel: (65) 6236 3333Fax: (65) 6236 3405
FINANCIAL CALENDAR FY2017
DATE 24 January 2017 08 February 2017(after close of trading) (tentative)
08 May 2017(after close of trading) (tentative)
08 August 2017(after close of trading) (tentative)
08 November 2017(after close of trading) (tentative)
EVENT Annual General Meeting
Announcement of 1st Quarter Results
Announcement of 2nd Quarter Results
Declaration of Interim Dividend
Announcement of 3rd Quarter Results
Announcement of Full Year Results
Declaration of Final Dividend
Interim Final Payout Ratio
Dividend (Cents)
12.0
54.2%50.0%
63.0%60.0%
6.0
3.0
2.0 2.0 1.5
3.0 3.0
41.0%
3.5
12.0
FY20
12
FY20
13
FY20
14
FY20
15
FY20
16
15.5 5.018.0Total 5.0 4.5
66 Fra s e r a n d N ea v e , L i m i t e d & S u b s i d i a r y C o m pa n i e sA n n u a l R e p o r t 2 0 1 6

CAPITAL RESOURCES
The Group aims to maintain a prudent financial structure to ensure that it will be able to access adequate capital at favourable terms. The Group’s core businesses, Food & Beverage (“F&B”) and Publishing & Printing (“P&P”), are its main sources of cash flows.
Management monitors the Group’s cash flow position, debt maturity profile, cost of funds, interest rate exposures and overall liquidity position on a continual basis. To ensure that the Group has adequate overall liquidity to finance its operations and investments, the Group maintains a significant amount of available banking facilities with a large number of banks. The Group’s Medium Term Notes (“MTN”) Programmes also provide F&N continued access to the debt capital markets.
As at FY2016, the Group’s balance sheet remained strong. It has $908.5 million in cash, mainly proceeds from the disposal of Myanmar Brewery Limited. Cash generative businesses, ample funding sources and significant debt headroom put F&N in a strong position to tap growth opportunities.
Interest cost in FY2016 was $5.0 million, 21% lower than the previous year’s interest cost of $6.3 million due to lower borrowings.
SOURCE OF FUNDINGBesides cash flow from its businesses, the Group also relies on the debt capital markets, equity market and bilateral banking facilities for its funding. As at 30 September 2016, the Group has $0.7 billion in banking facilities and $2.5 billion in MTN Programmes to meet its funding requirements.
AVAILABLE BANK LINES AS AT 30 SEPTEMBER 2016The Group maintains an active relationship with a network of more than 15 banks of various nationalities, located in various countries where the Group operates. Its principal bankers are DBS Bank Ltd, Overseas-Chinese Banking Corporation, Standard Chartered Bank, The Hongkong and Shanghai Banking Corporation Limited and Crédit Agricole Corporate & Investment Bank.
The Group adopts the philosophy of engaging the banks as its core business partners. It continues to receive very strong support from its relationship banks across all
segments of the Group’s businesses. Total banking facilities (utilised and unutilised) extended to the Group as at 30 September 2016 amounted to $0.7 billion. The principal bankers of the Group provided 57% of these banking facilities. All banking relationships for the Group are maintained by Corporate Treasury in Singapore.
DEBT CAPITAL MARKETSThe Group has a S$2.0 billion debt issuance programme in Singapore and a RM1.5 billion MTN Programme in Malaysia in place to tap the debt capital markets.
MATURITY PROFILE OF GROUP DEBT (EXCLUDES FINANCE LEASES)Maturing within 1 year $11.7 millionMaturing within 1 to 2 years $49.6 millionMaturing within 2 to 5 years $74.6 millionMaturing after 5 years $0.4 million
$136.3 million
As at the date of this report, the Group has more than sufficient resources to repay these loans as and when they fall due without having to refinance these loans.
INTEREST RATE PROFILE AND DERIVATIVESThe Group manages its interest cost by maintaining a mix of fixed and floating rate borrowings. On a portfolio basis, 98% of the Group’s borrowings are in fixed rates with an average fixed rate tenor of 1.9 years as at 30 September 2016. The fixed rate borrowings consist largely of the fixed rate notes issued under F&N Capital Sdn Bhd’s MTN Programme. The remaining 2% of the Group’s borrowings are in floating rates as at 30 September 2016.
In managing the interest rate profile, the Group takes into account the interest rate outlook, expected cash flow generated from its business operations, holding period of long-term investments and any acquisition and divestment plans.
The Group makes use of interest rate derivatives for the purpose of hedging interest rate risks and managing its portfolio of fixed and floating rate borrowings from time to time. The
Group does not engage in trading of interest rate derivatives. It does not have any outstanding interest rate derivatives as at 30 September 2016.
GEARING AND NET INTEREST COVERThe Group aims to keep its net gearing ratio below 80%. As at 30 September 2016, the Group has net cash of $908.5 million. Total interest expense for the year amounted to $5.0 million. The net interest income credited to profit statement for the year was $9.8 million. The net interest cover over total interest expense was at 36.1 times.
FOREIGN CURRENCY RISKS AND DERIVATIVESThe Group has exposure to foreign currency risks as a result of transactions denominated in foreign currencies arising from operational, financing and investment activities. Where exposures are certain, it is the Group’s policy to hedge these risks. For those exposures that are less certain in their timing and extent, it is the Group’s policy to cover 50% to 90% of anticipated exposures for a maximum period of 12 months forward. The Group uses foreign exchange forward contracts and certain currency derivatives to manage these foreign currency risks.
The Group does not engage in the trading of foreign currencies and foreign currency derivatives. The Group uses foreign currency contracts and derivatives solely for hedging actual underlying foreign currency requirements in accordance with hedging limits set by the Audit and the Board Committees under the Group Treasury Policy. These policies are reviewed regularly to ensure that the Group Treasury Policy are in line with its current needs, objectives and strategy of the businesses.
The Group’s foreign currency contracts and derivatives and mark-to-market values as at 30 September 2016 are disclosed in the financial statement in Note 35.
The Group does not hedge the foreign currency risks of its investments in overseas subsidiaries, joint venture and associated companies. Such investments are long-term in nature and therefore not feasible and economical to hedge. The Group only hedges dividends payable from its overseas subsidiaries, joint ventures and associated companies.
67Fra s e r a n d N ea v e , L i m i t e d & S u b s i d i a r y C o m pa n i e s A n n u a l R e p o r t 2 0 1 6

ENTERPRISE-WIDERISK MANAGEMENT
ENTERPRISE-WIDE RISK MANAGEMENT The Board and senior management of Fraser and Neave, Limited, (“F&N” or the “Group”) promote a strong risk management culture through having sound risk management processes and operating procedures that integrate prudent risk limits with appropriate risk measurement, monitoring and reporting, and encourage open communication and escalation of concerns in a timely manner. The purpose is to safeguard the interests of shareholders and the assets of F&N.
The Risk Management Committee (“RMC”), which was established by the Board in 2012, has oversight of the Group risk management policies and implementation. It assists the Board in determining the Group’s level of risk tolerance and risk policies, providing guidance on key risks, and ensuring that Management has in place an effective risk management system for the timely identification, mitigation and management of key risks that may have a material impact on the Group. In addition, the RMC also has oversight of the Group’s Insurance and Business Continuity programmes.
RISK MANAGEMENT PROCESSF&N adopts a cohesive risk management framework to manage risks in an integrated, systematic and consistent manner. The framework provides for the identification and management of risks using a top-down and bottom-up approach.
Management (business division heads and business unit heads) has the primary responsibility for identifying, controlling and reducing risks, and reporting to the Board. Material risks, mitigating measures, Key Risk Indicators (“KRIs”) and risk ratings are reviewed by Management at least three times a year.
Specifically, the Business Heads are the risk owners, and are responsible for identifying risks, establishing sound practices, and ensuring that effective procedures and robust systems are in place to mitigate the risks.
The key risks of the various business units are consolidated for review by CEOs of the Food & Beverage (“F&B”) and Publishing & Printing (“P&P”) business divisions, and finally to F&N RMC and Board.
Each business division has a dedicated risk coordinator to conduct risk analyses with management and compile timely reports to the Division Head. Risk coordinators also conduct briefings on adopted risk policies and practices when required. The objective is to increase risk awareness amongst key staff and to involve and commit them to implement measures that have been adopted by the Group.
To facilitate the reporting and monitoring of risks, F&N uses a web-based Corporate Risk Scorecard (“CRS”) system which enables business units to report risks and risk status using a common platform. The CRS captures risks, mitigating measures, timelines for action items and risk ratings. Risk parameters, upon which the ratings are based, are reviewed annually.
The Group periodically reviews the identification and recording of risks, streamlines the use of Risk Scorecards and upgrades the CRS system.
Risk tolerance statements, which set out the nature and extent of the significant risks that the Group is willing to accept in achieving its strategic objectives, are reviewed annually.
At the end of each financial year, Management of each business division and the Company provide assurance to the Board, F&N Audit Committee and RMC on the adequacy and effectiveness of the Group’s risk management system and internal controls.
These assurances for FY2016 are disclosed on Page 79 of this report.
KEY RISKS IN FINANCIAL YEAR 2015/2016As at 30 September 2016 the key risks of the Group have been largely mitigated. The proportion of risks that were rated as “very significant” and “high” have been reduced substantially after taking account of the mitigating measures.
The key categories of risks faced by the Group are summarised as follows.
Strategic RisksThe Group closely tracks developments in the F&B and P&P industries and reviews the effectiveness of its strategies as it works towards its vision of becoming a stable and sustainable F&B leader in the ASEAN region. The key risks facing the Group include increasing awareness of possible health effects associated with high
68 Fra s e r a n d N ea v e , L i m i t e d & S u b s i d i a r y C o m pa n i e sA n n u a l R e p o r t 2 0 1 6

sugar consumption, competition from disruptive technology and the risks associated with mergers, acquisitions and industry consolidation.
Reputational – Food Safety RisksFood safety remains a key risk to the F&B business division due to the potential reputational impact on the Group. In addition to
(i) close monitoring of food safety issues worldwide,
(ii) upholding the strict requirements stipulated under the various food safety standards and certifications,
(iii) putting in place a robust process to mitigate the risk of food contamination and
(iv) close monitoring of the status of KRIs which track food safety risks,
Management also shares learnings on food quality and safety issues and best practices across business units.
Reputational – Social Media and Communications Risks With the increasing use of social media, business divisions closely monitor this medium of communication and periodically review the effectiveness of policies and procedures that are in place.
Country Risks – Currency and Operational RisksThe Group operates and procures raw materials internationally and is exposed to currency risks. The hedging of committed cash flows is in accordance with the Group Treasury policy. Such policy is reviewed on a regular basis, ensuring it reflects the current needs, objectives and strategy of the business.
Globally the increase in cybercrime, heightened political tension and threats of epidemic diseases reinforce the need for F&N to be vigilant and respond promptly to unexpected changes in its operating environment. The Group’s cyber security measures are reviewed periodically to mitigate IT-related risks such as malware infection, ransomware, distributed denial of access and unauthorised access.
The robustness of F&N’s business continuity plans (“BCPs”) are also tested and fine-tuned through annual call notifications, desktop and simulation exercises. The complexity and scale of the exercises have been stepped up to raise awareness and preparedness. This ensures critical business functions can continue to operate in times of disruption and/or crises. The Group has also put in place a crisis communication policy, incident escalation procedure and incident alert codes, to ensure prompt notification of crisis incidents to Management.
The Group demonstrates its commitment to provide a safe workplace for its employees with the attainment of bizSAFE Level 3 certification by the F&N Corporate Office at Alexandra Point. Plants are also scheduled for surveys, to identify potential fire hazards and non-compliance to fire safety standards.
The Group recognises the importance of maintaining a consistent and cohesive ERM programme across the 12 countries where it has a presence, and continues to reinforce risk and BCP awareness throughout the Group. It also builds on the close working relationships with local authorities
and business partners to keep abreast of political, regulatory and economic developments in countries where the Group operates.
The insurance programmes are also reviewed annually to take into account the changing needs of the businesses and the operating environment to better mitigate losses in the event of a claim. Plant and equipment are revalued periodically to ensure adequacy of insurance coverage.
RISK CULTURE The RMC encourages proactive and periodic benchmarking of the Group’s ERM, BCP and insurance programmes against industry best practices and standards. It takes into account recommendations from BCP consultants and insurance advisers in mitigating pandemic, epidemic and adverse climate situations, to ensure that the ERM, BCP and insurance programmes remain adequate and effective.
As every member of staff has a role to play in risk management and BCP, awareness workshops, facilitated by the business divisions and Group Risk Management, are organised for new staff and entities of the Group quarterly. Refresher sessions are organised, when required.
69Fra s e r a n d N ea v e , L i m i t e d & S u b s i d i a r y C o m pa n i e s A n n u a l R e p o r t 2 0 1 6

70 Fra s e r a n d N ea v e , L i m i t e d & S u b s i d i a r y C o m pa n i e sA n n u a l R e p o r t 2 0 1 6 A n n u a l R e p o r t 2 0 1 6 F r a s e r a n d N e a v e , L i m i t e d & S u b s i d i a r y C o m p a n i e s
CORPORATE GOVERNANCEFor the year ended 30 September 2016
7 0
Fraser and Neave, Limited (“F&N” or the “Company”) recognises the importance of strong corporate governance. To this end, F&N has in place sound corporate policies, business practices and internal controls to help F&N and its subsidiaries (the “Group”) safeguard its assets and shareholders’ interests while pursuing sustainable growth and value-enhancement strategies.
F&N is listed on the Mainboard of the Singapore Exchange Securities Trading Limited (“SGX-ST”) and is firmly committed to compliance with applicable laws, rules and regulations, including the SGX-ST Listing Manual (“Listing Manual”), and the principles and guidelines of the Code of Corporate Governance 2012 (the “Code”). The Company is guided in its corporate governance practices by the principles of the Code, and continues to strive towards maintaining high standards of corporate governance and corporate transparency.
A. BOARD MATTERS
Principle 1: The Board’s Conduct of Affairs The board of directors of the Company (the “Board”) is well-diversified and comprises highly qualified and effective members who are responsible for providing overall entrepreneurial leadership and setting objectives for the long-term success of the Group. The Board also has oversight of the business performance and affairs of the Group and sets the Company’s values and standards (including ethical standards). The Board seeks to align the interests of the Board and management with that of shareholders and to balance interests of other stakeholders.
The Board also reviews annual budgets, financial plans, major acquisitions and divestments, funding and investment proposals, monitors the financial performance of the Group and management’s performance, and ensures compliance by the Group with relevant laws and regulations. The Board meets regularly. During Board meetings, our Directors actively participate, discuss, deliberate and appraise matters requiring attention and decision. If required, time is set aside after scheduled Board meetings for discussions amongst our Directors without the presence of management, as this facilitates a more effective check on management.
As at 30 September 2016, the Board comprises nine Directors, all of whom are non-executive Directors (including two female directors in recognition of the importance and value of gender diversity). They are:
Mr Charoen Sirivadhanabhakdi ChairmanKhunying Wanna Sirivadhanabhakdi Vice-ChairmanTengku Syed Badarudin JamalullailMr Timothy Chia Chee Ming Mr Koh Poh Tiong Mrs Siripen Sitasuwan Mr Chotiphat Bijananda Mr Thapana Sirivadhanabhakdi Mr Sithichai Chaikriangkrai Mr Prapakon Thongtheppairot (Alternate Director to Mr Sithichai Chaikriangkrai)
Delegation of Authority on certain Board Matters In order for the Board to efficiently discharge its oversight function of F&N, the Board delegates specific areas of responsibilities to five board committees (the “Board Committees”) namely, the Board Executive Committee, the Audit Committee, the Nominating Committee, the Remuneration Committee and the Risk Management Committee. Each Board Committee is governed by clear terms of reference (the “Terms of Reference”) which have been approved by the Board. Minutes of all Board Committee meetings are circulated to the Board so that directors of the Company (the “Directors”) are aware of and kept updated as to the proceedings and matters discussed during such meetings.
The Company adopts a framework of delegated authorisations in its Manual of Authority (“MOA”). The MOA defines the procedures and levels of authorisation required for specified transactions. It also sets out approval limits for operating and capital expenditure as well as acquisitions and disposals of assets and investments. The MOA also contains a schedule of matters specifically reserved to the Board for approval. These include approval of annual budgets financial plans, financial statements, business strategies and material transactions, such as major acquisitions, divestments, funding and investment proposals. The MOA authorises the Board Executive Committee (“Board Exco”) to approve certain transactions up to specified limits, beyond which the approval of the Board needs to be obtained. Below the Board and Board Exco levels, there are appropriate delegation of authority and approval sub-limits at management level, to facilitate operational efficiency.
To address and manage possible conflicts of interest that may arise between Directors’ interests and those of the Group, the Company has put in place appropriate procedures including, requiring Directors to refrain from participating in meetings or discussions (or relevant segments thereof) and requiring such Directors to abstain from voting, on any matter in which they are interested or conflicted.

71Fra s e r a n d N ea v e , L i m i t e d & S u b s i d i a r y C o m pa n i e s A n n u a l R e p o r t 2 0 1 6 A n n u a l R e p o r t 2 0 1 6 F r a s e r a n d N e a v e , L i m i t e d & S u b s i d i a r y C o m p a n i e s
CORPORATE GOVERNANCEFor the year ended 30 September 2016
7 0
Fraser and Neave, Limited (“F&N” or the “Company”) recognises the importance of strong corporate governance. To this end, F&N has in place sound corporate policies, business practices and internal controls to help F&N and its subsidiaries (the “Group”) safeguard its assets and shareholders’ interests while pursuing sustainable growth and value-enhancement strategies.
F&N is listed on the Mainboard of the Singapore Exchange Securities Trading Limited (“SGX-ST”) and is firmly committed to compliance with applicable laws, rules and regulations, including the SGX-ST Listing Manual (“Listing Manual”), and the principles and guidelines of the Code of Corporate Governance 2012 (the “Code”). The Company is guided in its corporate governance practices by the principles of the Code, and continues to strive towards maintaining high standards of corporate governance and corporate transparency.
A. BOARD MATTERS
Principle 1: The Board’s Conduct of Affairs The board of directors of the Company (the “Board”) is well-diversified and comprises highly qualified and effective members who are responsible for providing overall entrepreneurial leadership and setting objectives for the long-term success of the Group. The Board also has oversight of the business performance and affairs of the Group and sets the Company’s values and standards (including ethical standards). The Board seeks to align the interests of the Board and management with that of shareholders and to balance interests of other stakeholders.
The Board also reviews annual budgets, financial plans, major acquisitions and divestments, funding and investment proposals, monitors the financial performance of the Group and management’s performance, and ensures compliance by the Group with relevant laws and regulations. The Board meets regularly. During Board meetings, our Directors actively participate, discuss, deliberate and appraise matters requiring attention and decision. If required, time is set aside after scheduled Board meetings for discussions amongst our Directors without the presence of management, as this facilitates a more effective check on management.
As at 30 September 2016, the Board comprises nine Directors, all of whom are non-executive Directors (including two female directors in recognition of the importance and value of gender diversity). They are:
Mr Charoen Sirivadhanabhakdi ChairmanKhunying Wanna Sirivadhanabhakdi Vice-ChairmanTengku Syed Badarudin JamalullailMr Timothy Chia Chee Ming Mr Koh Poh Tiong Mrs Siripen Sitasuwan Mr Chotiphat Bijananda Mr Thapana Sirivadhanabhakdi Mr Sithichai Chaikriangkrai Mr Prapakon Thongtheppairot (Alternate Director to Mr Sithichai Chaikriangkrai)
Delegation of Authority on certain Board Matters In order for the Board to efficiently discharge its oversight function of F&N, the Board delegates specific areas of responsibilities to five board committees (the “Board Committees”) namely, the Board Executive Committee, the Audit Committee, the Nominating Committee, the Remuneration Committee and the Risk Management Committee. Each Board Committee is governed by clear terms of reference (the “Terms of Reference”) which have been approved by the Board. Minutes of all Board Committee meetings are circulated to the Board so that directors of the Company (the “Directors”) are aware of and kept updated as to the proceedings and matters discussed during such meetings.
The Company adopts a framework of delegated authorisations in its Manual of Authority (“MOA”). The MOA defines the procedures and levels of authorisation required for specified transactions. It also sets out approval limits for operating and capital expenditure as well as acquisitions and disposals of assets and investments. The MOA also contains a schedule of matters specifically reserved to the Board for approval. These include approval of annual budgets financial plans, financial statements, business strategies and material transactions, such as major acquisitions, divestments, funding and investment proposals. The MOA authorises the Board Executive Committee (“Board Exco”) to approve certain transactions up to specified limits, beyond which the approval of the Board needs to be obtained. Below the Board and Board Exco levels, there are appropriate delegation of authority and approval sub-limits at management level, to facilitate operational efficiency.
To address and manage possible conflicts of interest that may arise between Directors’ interests and those of the Group, the Company has put in place appropriate procedures including, requiring Directors to refrain from participating in meetings or discussions (or relevant segments thereof) and requiring such Directors to abstain from voting, on any matter in which they are interested or conflicted.
F r a s e r a n d N e a v e , L i m i t e d & S u b s i d i a r y C o m p a n i e s
CORPORATE GOVERNANCEFor the year ended 30 September 2016
A n n u a l R e p o r t 2 0 1 6 7 1
A. BOARD MATTERS (cont’d)
Board Executive Committee (“Board Exco”) The Board Exco is made up of the following members:
Mr Koh Poh Tiong ChairmanMr Thapana Sirivadhanabhakdi Vice-ChairmanMr Sithichai Chaikriangkrai MemberMr Prapakon Thongtheppairot Member
The Board Exco assumes oversight of the business affairs of F&N, and is empowered to exercise the full powers and authority of the Board when the Board does not meet except in respect of matters that specifically require the decision of the Board or any Board Committee. The Board Exco formulates the Group’s strategic development initiatives, provides direction for new investments and material financial and non-financial matters to ensure that the Group achieves its desired performance objectives and enhances long-term shareholder value. The Board Exco also oversees the Company’s conduct of business and corporate governance structure.
The activities and responsibilities of the other Board Committees are described in the following sections of this report.
Meetings of the Board and Board Committees The Board and its various Board Committees meet regularly, and also as required by business needs or if their members deem it necessary or appropriate to do so. For the financial year ended 30 September 2016, a total of six Board meetings were held.
The Directors are also given direct access to the management team of the Group’s business divisions1 through presentations at Board and Board Committee meetings. Where required or requested by Board members, site visits and meetings with personnel from the Group’s business divisions are also arranged in order for Directors to have an intimate understanding of the key business operations of each division. The Company’s Constitution provides for Board members who are unable to attend physical meetings to participate through telephone conference, video conference or any other forms of electronic or instantaneous communication facilities.
Note: 1 The Group’s business divisions are as follows: Food & Beverage (Non-Alcoholic Beverages), Food & Beverage (Beer) and Publishing & Printing.
The number of Board meetings and Board Committee meetings held in the financial year ended 30 September 2016 and the attendance of Directors at these meetings are as follows:
Board Board Exco
Audit Committee
Risk Management Committee
Remuneration Committee
NominatingCommittee
Meetings held for the financial year ended 30 September 2016 Mr Charoen Sirivadhanabhakdi 6/6 - - - - -Khunying Wanna Sirivadhanabhakdi 6/6 - - - - -Tengku Syed Badarudin Jamalullail 6/6 - - - - 2/2Mr Timothy Chia Chee Ming 6/6 - 5/5 - 3/3 -Mr Koh Poh Tiong 6/6 4/4 - 4/4 - -Mrs Siripen Sitasuwan 6/6 - 5/5 - 3/3 2/2Mr Chotiphat Bijananda 6/6 - - - - -Mr Thapana Sirivadhanabhakdi 5/6 3/4 - 3/4 3/3 2/2Mr Sithichai Chaikriangkrai 6/6 4/4 5/5 3/4 - -Mr Prapakon Thongtheppairot (Alternate Director) 6/6 3/4 - 4/4 - -
Upon appointment, each new Director is issued a formal letter of appointment setting out his or her duties and obligations as a Director of the Company, including their responsibilities as fiduciaries and how to deal with conflicts of interest that may arise. A comprehensive orientation programme is also conducted to familiarise new appointees with the business activities, strategic directions, policies and corporate governance practices of the Group as well as their statutory and other duties and responsibilities as Directors. This programme allows new Directors to get acquainted with senior management, and also facilitates and fosters better rapport and communications with management.
Directors are regularly updated on the Group’s businesses and the regulatory and industry-specific environments in which the entities of the Group operate. Updates on good corporate governance, relevant legal, regulatory and technical developments may be in writing or disseminated by way of briefings, presentations and/or handouts. During the financial year ended 30 September 2016, the Board has been briefed and updated on recent changes to the Companies Act (Chapter 50) (the “Companies Act”) and Listing Manual. Our Directors are also encouraged to be members of the Singapore Institute of Directors (“SID”) and to receive journal updates and training from SID in order to stay abreast of relevant developments in financial, legal and regulatory requirements.

72 Fra s e r a n d N ea v e , L i m i t e d & S u b s i d i a r y C o m pa n i e sA n n u a l R e p o r t 2 0 1 6 A n n u a l R e p o r t 2 0 1 6 F r a s e r a n d N e a v e , L i m i t e d & S u b s i d i a r y C o m p a n i e s
CORPORATE GOVERNANCEFor the year ended 30 September 2016
7 2
A. BOARD MATTERS (cont’d)
Principle 2: Board Composition and Guidance As at 30 September 2016, the F&N Board comprises nine non-executive Directors, of whom three are independent. The three independent Directors help to uphold good corporate governance at the Board level and their presence facilitates the exercise of objective independent judgment on corporate affairs. Their participation and input also ensures that key issues and strategies are critically reviewed, constructively challenged, fully discussed and thoroughly examined, always taking into account the long-term interests of F&N and its shareholders. The Company is reviewing its Board composition so as to work towards complying with Principle 2.2 of the Code. As at 30 September 2016, none of the independent Directors have been on the Board for more than nine years.
The Nominating Committee (“NC”) undertakes an annual review of the size and composition of the Board to ensure alignment with the needs of the Group. The NC is of the view that the current size and composition of the F&N Board is appropriate for the scope and nature of the Group’s operations, and facilitates effective decision-making. In line with the Code, taking into account the requirements of the Group’s businesses and the need to avoid undue disruptions from changes to the Board and Board Committees, the NC is of the view that the current size of the Board is not so large as to be unwieldy or as to interfere with efficient decision-making. No individual or group dominates the Board’s decision-making process.
The Board proactively seeks to maintain an appropriate balance of expertise, skills and attributes among the Directors. This is also reflected in the diversity of backgrounds and competencies of our Directors, whose competencies range from banking, finance and accounting to relevant industry knowledge, entrepreneurial and management experience, and familiarity with regulatory requirements and risk management. This is beneficial to the Company and its management as decisions by, and discussions with, the Board are enriched by the broad range of views and perspectives and the breadth of experience of our Directors. The NC is of the view that there is an appropriate balance of expertise and skills amongst the Directors as they collectively bring with them a broad range of complementary competencies and experience.
The Directors are provided with accurate, complete and timely information and have direct and unrestricted access to management. This is to give the Board and Board Committees sufficient time to critically evaluate and consider issues relevant to the Company and its businesses and operations. This also allows our Directors to carry out their duties and discharge their oversight function more effectively.
Principle 3: Chairman and Chief Executive Officer The Chairman and the Chief Executive Officers (“CEOs”) of each of the Group’s business divisions are separate persons to ensure an appropriate balance and separation of power, increased accountability, and clear division of responsibilities. The Chairman, who is non-executive, is not related to any of the CEOs of the business divisions. There is no business relationship between him and any of these CEOs. Likewise, none of the CEOs are related to each other, and neither is there any other business relationship between or among them.
The Chairman leads the Board and ensures its effectiveness by, among other things, steering effective, productive and comprehensive discussions amongst Board members and the management team on strategic, business and other key issues pertinent to the businesses and operations of the Group. In addition, the Chairman promotes a culture of openness and debate at Board meetings and also ensures, with the support of the company secretary (the “Company Secretary”), that Directors are provided with clear, complete and timely information in order to make sound, informed decisions.
The Chairman encourages active and effective engagement, participation by and contribution from all Directors, and facilitates constructive relations among and between them and management. With the full support of the Board, the Company Secretary and management, the Chairman supports the Company in its bid to promote, attain and maintain highest standards of corporate governance and transparency. The Chairman also sees to it that there is overall effective communications to and with shareholders on the performance of the Group. In turn, the CEOs of the Group’s business divisions are responsible for executing the Group’s strategies and policies, and are accountable to the Board for the conduct and performance of the respective business operations under their charge.
Lead Independent Director Tengku Syed Badarudin Jamalullail, Chairman of the NC, was appointed as Lead Independent Director on 7 May 2015. As the Lead Independent Director, he serves in a lead capacity to coordinate the activities of the independent Directors when necessary and appropriate. The Lead Independent Director is available to address shareholder concerns which have not been resolved through normal channels such as the Chairman or the Chief Financial Officer of the Company. The Lead Independent Director also has the authority to call and lead meetings of the independent Directors when necessary and appropriate.

73Fra s e r a n d N ea v e , L i m i t e d & S u b s i d i a r y C o m pa n i e s A n n u a l R e p o r t 2 0 1 6 A n n u a l R e p o r t 2 0 1 6 F r a s e r a n d N e a v e , L i m i t e d & S u b s i d i a r y C o m p a n i e s
CORPORATE GOVERNANCEFor the year ended 30 September 2016
7 2
A. BOARD MATTERS (cont’d)
Principle 2: Board Composition and Guidance As at 30 September 2016, the F&N Board comprises nine non-executive Directors, of whom three are independent. The three independent Directors help to uphold good corporate governance at the Board level and their presence facilitates the exercise of objective independent judgment on corporate affairs. Their participation and input also ensures that key issues and strategies are critically reviewed, constructively challenged, fully discussed and thoroughly examined, always taking into account the long-term interests of F&N and its shareholders. The Company is reviewing its Board composition so as to work towards complying with Principle 2.2 of the Code. As at 30 September 2016, none of the independent Directors have been on the Board for more than nine years.
The Nominating Committee (“NC”) undertakes an annual review of the size and composition of the Board to ensure alignment with the needs of the Group. The NC is of the view that the current size and composition of the F&N Board is appropriate for the scope and nature of the Group’s operations, and facilitates effective decision-making. In line with the Code, taking into account the requirements of the Group’s businesses and the need to avoid undue disruptions from changes to the Board and Board Committees, the NC is of the view that the current size of the Board is not so large as to be unwieldy or as to interfere with efficient decision-making. No individual or group dominates the Board’s decision-making process.
The Board proactively seeks to maintain an appropriate balance of expertise, skills and attributes among the Directors. This is also reflected in the diversity of backgrounds and competencies of our Directors, whose competencies range from banking, finance and accounting to relevant industry knowledge, entrepreneurial and management experience, and familiarity with regulatory requirements and risk management. This is beneficial to the Company and its management as decisions by, and discussions with, the Board are enriched by the broad range of views and perspectives and the breadth of experience of our Directors. The NC is of the view that there is an appropriate balance of expertise and skills amongst the Directors as they collectively bring with them a broad range of complementary competencies and experience.
The Directors are provided with accurate, complete and timely information and have direct and unrestricted access to management. This is to give the Board and Board Committees sufficient time to critically evaluate and consider issues relevant to the Company and its businesses and operations. This also allows our Directors to carry out their duties and discharge their oversight function more effectively.
Principle 3: Chairman and Chief Executive Officer The Chairman and the Chief Executive Officers (“CEOs”) of each of the Group’s business divisions are separate persons to ensure an appropriate balance and separation of power, increased accountability, and clear division of responsibilities. The Chairman, who is non-executive, is not related to any of the CEOs of the business divisions. There is no business relationship between him and any of these CEOs. Likewise, none of the CEOs are related to each other, and neither is there any other business relationship between or among them.
The Chairman leads the Board and ensures its effectiveness by, among other things, steering effective, productive and comprehensive discussions amongst Board members and the management team on strategic, business and other key issues pertinent to the businesses and operations of the Group. In addition, the Chairman promotes a culture of openness and debate at Board meetings and also ensures, with the support of the company secretary (the “Company Secretary”), that Directors are provided with clear, complete and timely information in order to make sound, informed decisions.
The Chairman encourages active and effective engagement, participation by and contribution from all Directors, and facilitates constructive relations among and between them and management. With the full support of the Board, the Company Secretary and management, the Chairman supports the Company in its bid to promote, attain and maintain highest standards of corporate governance and transparency. The Chairman also sees to it that there is overall effective communications to and with shareholders on the performance of the Group. In turn, the CEOs of the Group’s business divisions are responsible for executing the Group’s strategies and policies, and are accountable to the Board for the conduct and performance of the respective business operations under their charge.
Lead Independent Director Tengku Syed Badarudin Jamalullail, Chairman of the NC, was appointed as Lead Independent Director on 7 May 2015. As the Lead Independent Director, he serves in a lead capacity to coordinate the activities of the independent Directors when necessary and appropriate. The Lead Independent Director is available to address shareholder concerns which have not been resolved through normal channels such as the Chairman or the Chief Financial Officer of the Company. The Lead Independent Director also has the authority to call and lead meetings of the independent Directors when necessary and appropriate.
F r a s e r a n d N e a v e , L i m i t e d & S u b s i d i a r y C o m p a n i e s
CORPORATE GOVERNANCEFor the year ended 30 September 2016
A n n u a l R e p o r t 2 0 1 6 7 3
A. BOARD MATTERS (cont’d)
Principle 4: Board Membership The Nominating Committee is made up of the following Directors:
Tengku Syed Badarudin Jamalullail ChairmanMrs Siripen Sitasuwan MemberMr Thapana Sirivadhanabhakdi Member
A majority of the members of this Board Committee, including its Chairman, are independent and non-executive Directors.
Note: Under the Code, an “independent” Director is one who has no relationship with the Company, its related corporations, its ten percent (10%) shareholders or its officers that could interfere, or be reasonably perceived to interfere, with the exercise of the director’s independent business judgment with a view to the best interests of the Company. Under the Code, the term “10% shareholder” refers to a person who has an interest or interests in one or more voting shares in the Company and the total votes attached to that share, or those shares, is not less than ten percent (10%) of the total votes attached to all the voting shares in the Company. “Voting shares” excludes treasury shares.
The NC is chaired by the Lead Independent Director and is guided by written Terms of Reference, which are approved by the Board. The Terms of Reference set out the duties and responsibilities of the NC. The NC reviews the structure, size and composition of the Board. The NC also identifies the balance of skills, knowledge and experience required for the Board to discharge its responsibilities effectively and nominates candidates to meet the needs and requirements of the Group.
Besides evaluating annually the independence of each Director (as set out in the penultimate paragraph of this section), the NC appraises the performance of the Board as a whole, and the contribution of each Director to the effectiveness of the Board. The NC is also required to determine whether Directors who hold multiple board representations are able to and have been devoting sufficient time to discharge their responsibilities adequately. The Code recommends that the Board should fix the maximum number of listed company board representations which any Director may hold and that this should be disclosed in the Company’s annual report. Details of other directorships and other principal commitments of each of the Directors may be found on pages 22 to 28 of this Annual Report. In determining whether each Director is able to devote sufficient time to discharge his or her duties, the NC has taken cognizance of the recommendations under the Code, but is of the view that its assessment should not be restricted to the number of board representations of each Director and their other principal commitments per se. The contributions by each Director to and during meetings of the Board and relevant Board Committees as well as their attendance at such meetings and personal capabilities are holistically assessed and taken into account by the NC. The NC has determined that all the Directors have devoted sufficient time and attention to the affairs of the Company and have adequately discharged their duties.
The Board currently has one Alternate Director, namely Mr Prapakon Thongtheppairot who is the Alternate Director to Mr Sithichai Chaikriangkrai. Mr Prapakon Thongtheppairot is appropriately qualified and is familiar with the affairs of the Company.
The NC reviews all nominations for appointments and re-appointments to the Board and to Board Committees, and submits its recommendations for approval by the Board, taking into account an appropriate mix of core competencies for the Board to fulfil its roles and responsibilities.
The NC takes the lead in identifying, evaluating and selecting suitable candidates for new directorships. In its search and selection process, the NC considers factors such as the ability of the prospective candidate to contribute to discussions, deliberations and activities of the Board and Board Committees. It also reviews the composition of the Board – including the mix of expertise, skills and attributes of existing Directors – so as to identify needed and/or desired competencies to supplement the Board’s existing attributes. Where it deems necessary or appropriate, the NC may tap on its networking contacts and/or engage external professional headhunters to assist with identifying and shortlisting candidates.
The Company’s Constitution provides that at least one-third of its Directors shall retire from office and are subject to re-election at every Annual General Meeting of the Company (“AGM”). All Directors are required to retire from office at least once every three years. The NC will assess and evaluate whether Directors retiring at each AGM are properly qualified for re-appointment by virtue of their skills, experience and contributions. Newly-appointed Directors during the year must also submit themselves for retirement and re-election at the next AGM immediately following their appointment. The shareholders approve the appointment or re-appointment of Board members at the AGM.
The NC determines the independence of each Director annually and as and when circumstances require based on the definitions and guidelines of independence set out in the Code and provides its views to the Board for the Board’s consideration.

74 Fra s e r a n d N ea v e , L i m i t e d & S u b s i d i a r y C o m pa n i e sA n n u a l R e p o r t 2 0 1 6 A n n u a l R e p o r t 2 0 1 6 F r a s e r a n d N e a v e , L i m i t e d & S u b s i d i a r y C o m p a n i e s
CORPORATE GOVERNANCEFor the year ended 30 September 2016
7 4
A. BOARD MATTERS (cont’d) For the financial year ended 30 September 2016, the NC has performed a review of the independence of the Directors as at 30 September 2016 and following its assessment, has determined the status of each Director as follows:
Mr Charoen Sirivadhanabhakdi1,2 Non-IndependentKhunying Wanna Sirivadhanabhakdi1,2 Non-IndependentTengku Syed Badarudin Jamalullail IndependentMr Timothy Chia Chee Ming IndependentMr Koh Poh Tiong3 Non-IndependentMrs Siripen Sitasuwan IndependentMr Chotiphat Bijananda2,4 Non-IndependentMr Thapana Sirivadhanabhakdi2 Non-IndependentMr Sithichai Chaikriangkrai5 Non-Independent Notes: 1 Mr Charoen Sirivadhanabhakdi and Khunying Wanna Sirivadhanabhakdi are directly or indirectly interested in not less than ten percent (10%) of
the total voting shares in the Company through their interests in TCC Assets Limited (“TCCA”) and Thai Beverage Public Company Limited (“ThaiBev”). TCCA has a direct interest of 59.35% in the Company and ThaiBev, through its indirect wholly-owned subsidiary InterBev Investment Limited, holds a 28.53% interest in the Company.
2 Mr Charoen Sirivadhanabhakdi is married to Khunying Wanna Sirivadhanabhakdi. Mr Chotiphat Bijananda is their son-in-law, and Mr Thapana Sirivadhanabhakdi is their son.
3 Mr Koh Poh Tiong is also an adviser to the Board, and has received compensation for provision of services other than Director’s fees. 4 Mr Chotiphat Bijananda is a director of TCCA. 5 Mr Sithichai Chaikriangkrai is a Director and Executive Vice President of ThaiBev.
Key Information regarding Directors Key information on the Directors is set out on pages 22 to 28 of this Annual Report.
Principle 5: Board Performance The Board has implemented a formal process for annual assessment of the effectiveness of the Board as a whole and its Board Committees and the contribution by each Director to the effectiveness of the Board.
Directors are required to assess the performance of the Board and the Board Committees. The assessment covers areas such as Board composition, information management, Board processes, shareholder management, Board priorities, managing the Company’s performance, Director development and management, risk management and effectiveness of the Board Committees. Directors can also provide input on issues which do not fall under these categories, for instance, addressing specific areas where improvements can be made. Feedback and comments received from the Directors are reviewed by the NC, in consultation with the Chairman of the Board.
Based on the NC’s review, the Board and the various Board Committees operate effectively and each Director is contributing to the overall effectiveness of the Board.
Principle 6: Access to Information Management provides the Board with detailed Board papers specifying relevant information and commercial rationale for each proposal for which Board approval is sought. Such information includes relevant financial statements which are presented quarterly, management accounts, financial forecasts, risk analyses and assessments, mitigation strategies, feasibility studies and key commercial issues for the Board’s attention and consideration. Reports on major operational matters, business development activities, financial performance, potential investment opportunities and budgets are also circulated to the Board.
A calendar of activities is scheduled for the Board a year in advance. The Company recognises that information should be supplied to the Board in a timely manner and as far as possible, Board papers and agenda items are dispatched to the Directors about a week before scheduled meetings. This is to give Directors sufficient time to review and consider the matters being tabled and/or discussed so that discussions can be more meaningful and productive. Senior management is requested to attend meetings of the Board and the Board Committees in order to provide input and insight into matters being discussed, and to respond to any queries that the Directors may have. The Board also has separate and independent access to the Company’s senior management and the Company Secretary.
The Company Secretary is responsible for, among other things, ensuring that Board procedures, the Company’s Constitution and relevant rules and regulations, including requirements of the Securities and Futures Act (Chapter 289), Companies Act and Listing Manual are complied with. The Company Secretary attends all Board meetings and provides advice and guidance on corporate governance practices and processes with a view to enhancing long-term shareholder value.
The Company Secretary also facilitates and acts as a channel of communication to ensure good information flows within the Board and its Board Committees, as well as between and with senior management. In addition, the Company Secretary solicits and consolidates Directors' feedback and evaluation from time to time, and arranges for and facilitates orientation programmes for new Directors and assists with their professional development as required. The Company Secretary is the Company's primary channel of communication with SGX-ST.
The appointment and removal of the Company Secretary is subject to the approval of the Board. Where it is necessary for the efficacious discharge of their duties, the Directors may seek and obtain independent professional advice at the Company’s expense.

75Fra s e r a n d N ea v e , L i m i t e d & S u b s i d i a r y C o m pa n i e s A n n u a l R e p o r t 2 0 1 6 A n n u a l R e p o r t 2 0 1 6 F r a s e r a n d N e a v e , L i m i t e d & S u b s i d i a r y C o m p a n i e s
CORPORATE GOVERNANCEFor the year ended 30 September 2016
7 4
A. BOARD MATTERS (cont’d) For the financial year ended 30 September 2016, the NC has performed a review of the independence of the Directors as at 30 September 2016 and following its assessment, has determined the status of each Director as follows:
Mr Charoen Sirivadhanabhakdi1,2 Non-IndependentKhunying Wanna Sirivadhanabhakdi1,2 Non-IndependentTengku Syed Badarudin Jamalullail IndependentMr Timothy Chia Chee Ming IndependentMr Koh Poh Tiong3 Non-IndependentMrs Siripen Sitasuwan IndependentMr Chotiphat Bijananda2,4 Non-IndependentMr Thapana Sirivadhanabhakdi2 Non-IndependentMr Sithichai Chaikriangkrai5 Non-Independent Notes: 1 Mr Charoen Sirivadhanabhakdi and Khunying Wanna Sirivadhanabhakdi are directly or indirectly interested in not less than ten percent (10%) of
the total voting shares in the Company through their interests in TCC Assets Limited (“TCCA”) and Thai Beverage Public Company Limited (“ThaiBev”). TCCA has a direct interest of 59.35% in the Company and ThaiBev, through its indirect wholly-owned subsidiary InterBev Investment Limited, holds a 28.53% interest in the Company.
2 Mr Charoen Sirivadhanabhakdi is married to Khunying Wanna Sirivadhanabhakdi. Mr Chotiphat Bijananda is their son-in-law, and Mr Thapana Sirivadhanabhakdi is their son.
3 Mr Koh Poh Tiong is also an adviser to the Board, and has received compensation for provision of services other than Director’s fees. 4 Mr Chotiphat Bijananda is a director of TCCA. 5 Mr Sithichai Chaikriangkrai is a Director and Executive Vice President of ThaiBev.
Key Information regarding Directors Key information on the Directors is set out on pages 22 to 28 of this Annual Report.
Principle 5: Board Performance The Board has implemented a formal process for annual assessment of the effectiveness of the Board as a whole and its Board Committees and the contribution by each Director to the effectiveness of the Board.
Directors are required to assess the performance of the Board and the Board Committees. The assessment covers areas such as Board composition, information management, Board processes, shareholder management, Board priorities, managing the Company’s performance, Director development and management, risk management and effectiveness of the Board Committees. Directors can also provide input on issues which do not fall under these categories, for instance, addressing specific areas where improvements can be made. Feedback and comments received from the Directors are reviewed by the NC, in consultation with the Chairman of the Board.
Based on the NC’s review, the Board and the various Board Committees operate effectively and each Director is contributing to the overall effectiveness of the Board.
Principle 6: Access to Information Management provides the Board with detailed Board papers specifying relevant information and commercial rationale for each proposal for which Board approval is sought. Such information includes relevant financial statements which are presented quarterly, management accounts, financial forecasts, risk analyses and assessments, mitigation strategies, feasibility studies and key commercial issues for the Board’s attention and consideration. Reports on major operational matters, business development activities, financial performance, potential investment opportunities and budgets are also circulated to the Board.
A calendar of activities is scheduled for the Board a year in advance. The Company recognises that information should be supplied to the Board in a timely manner and as far as possible, Board papers and agenda items are dispatched to the Directors about a week before scheduled meetings. This is to give Directors sufficient time to review and consider the matters being tabled and/or discussed so that discussions can be more meaningful and productive. Senior management is requested to attend meetings of the Board and the Board Committees in order to provide input and insight into matters being discussed, and to respond to any queries that the Directors may have. The Board also has separate and independent access to the Company’s senior management and the Company Secretary.
The Company Secretary is responsible for, among other things, ensuring that Board procedures, the Company’s Constitution and relevant rules and regulations, including requirements of the Securities and Futures Act (Chapter 289), Companies Act and Listing Manual are complied with. The Company Secretary attends all Board meetings and provides advice and guidance on corporate governance practices and processes with a view to enhancing long-term shareholder value.
The Company Secretary also facilitates and acts as a channel of communication to ensure good information flows within the Board and its Board Committees, as well as between and with senior management. In addition, the Company Secretary solicits and consolidates Directors' feedback and evaluation from time to time, and arranges for and facilitates orientation programmes for new Directors and assists with their professional development as required. The Company Secretary is the Company's primary channel of communication with SGX-ST.
The appointment and removal of the Company Secretary is subject to the approval of the Board. Where it is necessary for the efficacious discharge of their duties, the Directors may seek and obtain independent professional advice at the Company’s expense.
F r a s e r a n d N e a v e , L i m i t e d & S u b s i d i a r y C o m p a n i e s
CORPORATE GOVERNANCEFor the year ended 30 September 2016
A n n u a l R e p o r t 2 0 1 6 7 5
B. REMUNERATION MATTERS
Principle 7: Procedures for Developing Remuneration Policies
Remuneration Committee (“RC”) The RC is made up of non-executive Directors, the majority of whom, including its Chairman, are independent Directors. The RC comprises the following members:
Mr Timothy Chia Chee Ming ChairmanMrs Siripen Sitasuwan MemberMr Thapana Sirivadhanabhakdi Member
The RC’s main responsibility is to assist the Board in establishing a formal and transparent process for developing policies on executive remuneration and development. The RC also reviews remuneration packages and service terms of individual Directors and the CEOs of the Company’s business divisions. When carrying out its duties, the RC reviews and makes recommendations on the remuneration framework for the Board and key management personnel, for endorsement by the Board. The RC also oversees the framework for remuneration and other terms of service for other key management of the Company.
The RC reviews on an annual basis, the level and mix of remuneration and benefits policies and practices of the Company, including long-term incentives. When conducting such reviews, the RC takes into account the performance of the Company and employees. It also reviews and approves the framework for salary reviews, performance bonus and incentives for key management of the Group.
The RC also periodically conducts a review of the development and succession plans for key management and the leadership pipeline for the Company. In doing so, the RC aligns the CEOs’ leadership - through appropriate remuneration and benefits policies and long-term incentives - with the Company’s strategic objectives and key challenges. Performance targets are also set for the CEOs and their performances evaluated yearly.
The RC may from time to time, and where necessary or required, engage external consultants in framing the remuneration policy and determining the level and mix of remuneration for Directors and management. Among other things, this helps the Company to stay competitive in its remuneration packages. During the financial year ended 30 September 2016, Carrots Consulting Pte Ltd and Hay Group Pte Ltd were appointed as remuneration consultants. The Company does not have any relationship with these remuneration consultants which would affect their independence and objectivity.
Principle 8: Level and Mix of Remuneration In recommending the level and mix of remuneration, the RC seeks to build, motivate and retain Directors and key management. It ensures that competitive remuneration policies and practices are in place to draw and motivate high-performing executives so as to drive the Group’s businesses to greater growth, efficiency and profitability. In its deliberation, the RC takes into consideration industry practices and benchmarks against relevant industry players to ensure that its remuneration and employment conditions are competitive.
The Company’s compensation framework comprises fixed remuneration, annual variable bonuses and long-term incentives. Annual variable bonuses are linked to achievement of financial and non-financial key performance indicators. These indicators such as core values, competencies, key result areas, performance rating, and potential of the employees (including key management) link remuneration to corporate and individual performance. Long-term incentive plans are conditional upon pre-determined performance targets being met and the long-term incentive plans serve to motivate and reward employees and align their interests to maximise long-term shareholder value.
Long-Term Incentive Plans The RC administers the Company’s share-based remuneration incentive plans, namely, the F&N Restricted Share Plan (“RSP”) and F&N Performance Share Plan (“PSP”).
Through the RSP and PSP, the Company seeks to foster a greater ownership culture within the Group by aligning more directly the interests of key senior management and senior executives with the interest of shareholders, and for such employees to participate and share in the Group’s growth and success.
The RSP is available to a broader base of senior executives compared to the PSP. Its objectives are to increase the Company’s flexibility and effectiveness in its continuing efforts to attract, motivate and retain talented senior executives and to reward these executives for the performance of the Company and that of the individual. The PSP applies to senior management in key positions who shoulder the responsibility of the Company’s performance and who are able to drive the growth of the Company through superior performance. It serves as further motivation to key senior management in striving for excellence and delivering long-term shareholder value.
Under the RSP and PSP, the Company grants share-based awards (“Base Awards”) conditional upon pre-determined performance targets being met. These targets are set by the RC in its absolute discretion for the performance conditions to be met over the performance period. The performance period for the RSP and PSP are two and three years respectively. For the RSP, the targets set are the achievement of (i) Net Revenue; (ii) Profit Before Interest and Tax; (iii) Attributable Profit Before Fair Value Adjustment and Exceptional Items; and/or (iv) Return On Capital Employed.

76 Fra s e r a n d N ea v e , L i m i t e d & S u b s i d i a r y C o m pa n i e sA n n u a l R e p o r t 2 0 1 6 A n n u a l R e p o r t 2 0 1 6 F r a s e r a n d N e a v e , L i m i t e d & S u b s i d i a r y C o m p a n i e s
CORPORATE GOVERNANCEFor the year ended 30 September 2016
7 6
B. REMUNERATION MATTERS (cont’d) For the PSP, the pre-set targets are based on Return On Invested Capital, Total Shareholders’ Return Relative to Straits Times Index and Absolute Total Shareholders’ Return as a multiple of Cost of Equity.
The Base Awards represent the right to receive fully paid ordinary shares, their equivalent cash value or a combination thereof, free of charge, provided certain prescribed performance and service conditions are met. The final number of shares to be released will depend on the achievement of the pre-determined targets at the end of the performance period. If the pre-determined targets are exceeded, more shares than the Base Awards can be delivered, subject to a maximum percentage of the Base Awards. The first grant of Base Awards was made in December 2009.
The maximum number of Company shares which can be released, when aggregated with:
(a) the total number of new Shares allotted and issued and/or to be allotted and issued, and issued Shares (including treasury shares) delivered and/or to be delivered, pursuant to awards granted under the PSP; and
(b) the total number of new Shares allotted and issued and/or to be allotted and issued, and issued Shares (including treasury shares) delivered and/or to be delivered, pursuant to awards granted under the RSP,
shall not exceed 10% of the total number of issued shares (excluding treasury shares) on the date preceding the date of the relevant Base Award. The RC currently does not intend, in any given year, to grant awards under the RSP and PSP which would comprise more than 1% of the total number of issued ordinary shares from time to time (the “Yearly Limit”). However, if the Yearly Limit is not fully utilised in any given year, the balance of the unutilised Yearly Limit may be used by the Company to make grants of awards in subsequent years.
Senior management participants in key positions are required to hold a minimum number of the shares released to them under the RSP and PSP to maintain a beneficial ownership stake in the Company for the duration of their employment or tenure with the Company.
Principle 9: Disclosure on Remuneration
Remuneration of Directors and Key Management Personnel Information on the remuneration of Directors of the Company and top five key management personnel of the Group is set out below.
Directors of the Company as at 30 September 2016
Remuneration$
Director Fee%
Adviser Fee %
Allowances %
Total%
Mr Charoen Sirivadhanabhakdi -1 - - - -Khunying Wanna Sirivadhanabhakdi -1 - - - -Tengku Syed Badarudin Jamalullail 135,0002 100 - - 100Mr Timothy Chia Chee Ming 147,000 100 - - 100Mr Koh Poh Tiong 2,100,5933 8.2 87 4.8 100Mrs Siripen Sitasuwan 176,000 100 - - 100Mr Chotiphat Bijananda 81,000 100 - - 100Mr Thapana Sirivadhanabhakdi 199,0864 100 - - 100Mr Sithichai Chaikriangkrai 157,000 100 - - 100Mr Prapakon Thongtheppairot6 (Alternate Director) 78,5005 100 - - 100
Notes: 1 Mr Charoen Sirivadhanabhakdi and Khunying Wanna Sirivadhanabhakdi waived payment of Directors’ fees due to them. 2 Includes the payment of $20,000 being the basic fee for serving as the Lead Independent Director. 3 Includes payment of $1,828,086 being fees for services provided as adviser to the Board and $100,593 being car allowance paid pursuant to
this appointment. 4 Includes payment of $33,000 being director’s fees from Times Publishing Limited (“TPL”). 5 Includes payment of $31,500 being director’s fees from TPL. 6 In addition to being Alternate Director to Mr Sithichai Chaikriangkrai, Mr Prapakon Thongtheppairot was also CEO, Beer with effect from
19 August 2015 up until the cessation of his appointment on 30 September 2016. Mr Edmond Neo was appointed CEO, Beer with effect from 1 October 2016.

77Fra s e r a n d N ea v e , L i m i t e d & S u b s i d i a r y C o m pa n i e s A n n u a l R e p o r t 2 0 1 6 A n n u a l R e p o r t 2 0 1 6 F r a s e r a n d N e a v e , L i m i t e d & S u b s i d i a r y C o m p a n i e s
CORPORATE GOVERNANCEFor the year ended 30 September 2016
7 6
B. REMUNERATION MATTERS (cont’d) For the PSP, the pre-set targets are based on Return On Invested Capital, Total Shareholders’ Return Relative to Straits Times Index and Absolute Total Shareholders’ Return as a multiple of Cost of Equity.
The Base Awards represent the right to receive fully paid ordinary shares, their equivalent cash value or a combination thereof, free of charge, provided certain prescribed performance and service conditions are met. The final number of shares to be released will depend on the achievement of the pre-determined targets at the end of the performance period. If the pre-determined targets are exceeded, more shares than the Base Awards can be delivered, subject to a maximum percentage of the Base Awards. The first grant of Base Awards was made in December 2009.
The maximum number of Company shares which can be released, when aggregated with:
(a) the total number of new Shares allotted and issued and/or to be allotted and issued, and issued Shares (including treasury shares) delivered and/or to be delivered, pursuant to awards granted under the PSP; and
(b) the total number of new Shares allotted and issued and/or to be allotted and issued, and issued Shares (including treasury shares) delivered and/or to be delivered, pursuant to awards granted under the RSP,
shall not exceed 10% of the total number of issued shares (excluding treasury shares) on the date preceding the date of the relevant Base Award. The RC currently does not intend, in any given year, to grant awards under the RSP and PSP which would comprise more than 1% of the total number of issued ordinary shares from time to time (the “Yearly Limit”). However, if the Yearly Limit is not fully utilised in any given year, the balance of the unutilised Yearly Limit may be used by the Company to make grants of awards in subsequent years.
Senior management participants in key positions are required to hold a minimum number of the shares released to them under the RSP and PSP to maintain a beneficial ownership stake in the Company for the duration of their employment or tenure with the Company.
Principle 9: Disclosure on Remuneration
Remuneration of Directors and Key Management Personnel Information on the remuneration of Directors of the Company and top five key management personnel of the Group is set out below.
Directors of the Company as at 30 September 2016
Remuneration$
Director Fee%
Adviser Fee %
Allowances %
Total%
Mr Charoen Sirivadhanabhakdi -1 - - - -Khunying Wanna Sirivadhanabhakdi -1 - - - -Tengku Syed Badarudin Jamalullail 135,0002 100 - - 100Mr Timothy Chia Chee Ming 147,000 100 - - 100Mr Koh Poh Tiong 2,100,5933 8.2 87 4.8 100Mrs Siripen Sitasuwan 176,000 100 - - 100Mr Chotiphat Bijananda 81,000 100 - - 100Mr Thapana Sirivadhanabhakdi 199,0864 100 - - 100Mr Sithichai Chaikriangkrai 157,000 100 - - 100Mr Prapakon Thongtheppairot6 (Alternate Director) 78,5005 100 - - 100
Notes: 1 Mr Charoen Sirivadhanabhakdi and Khunying Wanna Sirivadhanabhakdi waived payment of Directors’ fees due to them. 2 Includes the payment of $20,000 being the basic fee for serving as the Lead Independent Director. 3 Includes payment of $1,828,086 being fees for services provided as adviser to the Board and $100,593 being car allowance paid pursuant to
this appointment. 4 Includes payment of $33,000 being director’s fees from Times Publishing Limited (“TPL”). 5 Includes payment of $31,500 being director’s fees from TPL. 6 In addition to being Alternate Director to Mr Sithichai Chaikriangkrai, Mr Prapakon Thongtheppairot was also CEO, Beer with effect from
19 August 2015 up until the cessation of his appointment on 30 September 2016. Mr Edmond Neo was appointed CEO, Beer with effect from 1 October 2016.
F r a s e r a n d N e a v e , L i m i t e d & S u b s i d i a r y C o m p a n i e s
CORPORATE GOVERNANCEFor the year ended 30 September 2016
A n n u a l R e p o r t 2 0 1 6 7 7
B. REMUNERATION MATTERS (cont’d) Key Management Personnel of the Group as at 30 September 2016
Remuneration $
Fee %
Salary %
Bonus %
Allowances& Benefits
% Others
%
Long-TermIncentives
% Total
% Dato’ Ng Jui Sia1 1,022,084 - 66 15 11 - 8 100Mr Anthony Cheong Fook Seng 1,066,510 - 59 23 10 - 8 100Mr Hui Choon Kit 922,365 - 54 28 6 - 12 100Mr Lee Meng Tat 1,237,332 - 57 32 4 - 7 100Mr Lim Yew Hoe 1,299,033 - 39 20 32 - 9 100
Total: 5,547,324 Note: 1 Dato’ Ng Jui Sia was appointed Adviser, Strategic Projects with effect from 1 May 2015 and retired on 30 September 2016.
No termination, retirement and post-employment benefits were granted to Directors and the above mentioned key management personnel (who are not Directors or the CEO of the Company).
There are no employees within the Group who are immediate family members of a Director, and whose remuneration exceeds $50,000 during the year.
Directors’ Fees The remuneration of non-executive Directors takes into account their level and quality of contribution and their respective responsibilities, including attendance and time spent at Board meetings and Board Committee meetings. Directors are paid a basic fee and attendance fees for attending Board meetings. Non-executive Directors who perform services through Board Committees are paid additional basic and attendance fees for such services. No Director decides his own fees. Directors’ fees are reviewed annually to benchmark such fees against the amounts paid by other major listed companies. The Company’s Board fee structure during the year is as set out below. The Board fee structure remains unchanged from that in the preceding financial year i.e. financial year ended 30 September 2015.
Basic Fee ($)
Attendance Fee($)
Board - Chairman 150,000 2,000- Member 75,000 1,000- Lead Independent Director 20,000 -Audit Committee and Board Exco - Chairman 50,000 2,000- Member 25,000 1,000NC, RC and Risk Management Committee - Chairman 30,000 2,000- Member 15,000 1,000
Shareholders’ approval will be sought at the 118th AGM of the Company on 24th January 2017, for the payment of Directors’ fees proposed for the financial year ending 30 September 2017 amounting to $2 million, the same amount for which approval was sought and obtained at the 117th AGM of the Company last year.
To better align with shareholders’ interests, Directors are encouraged to purchase the Company’s shares from the open market and to hold the equivalent of a year’s fees in such shares while they remain on the Board, subject to their compliance with applicable laws and regulations.

78 Fra s e r a n d N ea v e , L i m i t e d & S u b s i d i a r y C o m pa n i e sA n n u a l R e p o r t 2 0 1 6 A n n u a l R e p o r t 2 0 1 6 F r a s e r a n d N e a v e , L i m i t e d & S u b s i d i a r y C o m p a n i e s
CORPORATE GOVERNANCEFor the year ended 30 September 2016
7 8
C. ACCOUNTABILITY AND AUDIT
Principle 10: Accountability F&N prepares its financial statements in accordance with the Singapore Financial Reporting Standards (“SFRS”) prescribed by the Accounting Standards Council. The Board provides shareholders with quarterly and annual financial reports, and releases its quarterly and full-year financial results through announcements to the SGX-ST and, where appropriate, press releases and presentation packs. In communicating and disseminating its results, F&N aims to present a balanced and clear assessment of the Company’s performance, position and prospects.
Management provides the Board Exco with management accounts at every meeting of this Board Committee. This is in addition to such other information as the Board may require from time to time to make a balanced and informed assessment of the Company’s performance, position and prospects.
Principle 11: Risk Management and Internal Controls The Company maintains a sound system of risk management and internal controls with a view to safeguarding its assets and shareholders’ interests.
The Audit Committee (“AC”), with the assistance of internal and external auditors, reviews and reports to the Board on the adequacy of the Company’s system of controls, including financial, compliance, operational and information technology controls, established by management. In assessing the effectiveness of internal controls, the AC ensures primarily that key objectives are met, material assets are properly safeguarded, fraud or errors in the accounting records are prevented or detected, accounting records are accurate and complete, and reliable financial information is prepared in compliance with applicable internal policies, laws and regulations.
The importance and emphasis placed by the Group on internal controls is underpinned by the fact that the key performance indicators for management’s performance takes into account the findings of both internal and external auditors and the number of unresolved or outstanding issues raised in the process.
Risk Management Committee (“RMC”) The Board, through the RMC, reviews the adequacy and effectiveness of the Group’s risk management framework to ensure that robust risk management and internal controls are in place. The Company has adopted an enterprise-wide risk management (“ERM”) framework to enhance its risk management capabilities. Key risks, mitigating measures and management actions are continually identified, reviewed and monitored as part of the ERM process. Financial and operational key risk indicators are in place to track key risk exposures. Key business risks are thoroughly assessed by management and each significant transaction is comprehensively analysed so that management understands the risks involved before it is embarked upon.
The RMC oversees the risk management framework and policies of the Group. It is responsible for, among other things, reviewing the Group’s enterprise-wide risk management framework, processes and procedures for identifying, measuring, reporting and mitigating key risks in the Group’s businesses and operations. Together with the AC, the RMC helps to ensure that management maintains a sound system of risk management and internal controls to safeguard the interests of shareholders and the assets of the Group. The RMC also provides guidance to management, and renders assistance to the Board for determining the nature and extent of significant risks which the Board would be willing to take in achieving the Group’s strategic objectives. The meetings of the RMC are attended by senior management of the Company’s business divisions, and serve as a forum to review and discuss material risks and exposures of these businesses and their strategies to mitigate risks.
The RMC comprises the following members:
Mr Thapana Sirivadhanabhakdi ChairmanMr Koh Poh Tiong MemberMr Sithichai Chaikriangkrai MemberMr Prapakon Thongtheppairot Member
Periodic updates are provided to the RMC on the Group’s risk profile, and on the status of key enterprise risk management and business continuity initiatives. These updates include the assessment of the Group’s key risks by major business units, risk categories, and the status and changes in plans undertaken by management to manage key risks. Risk tolerance statements, which set out the nature and extent of significant risks which the Group is willing to take in achieving its strategic objectives, are monitored and reported to the RMC.
Using a comfort matrix of key risks, the material financial, compliance, operational and information technology risks of the Company have been documented and presented against strategies, policies, people, processes, systems, mechanisms and reporting processes that have been put in place. The management of the Company’s business divisions also carry out control self-assessments in key areas of their respective businesses and operations to evaluate the adequacy and effectiveness of their risk management measures and internal controls.

79Fra s e r a n d N ea v e , L i m i t e d & S u b s i d i a r y C o m pa n i e s A n n u a l R e p o r t 2 0 1 6 A n n u a l R e p o r t 2 0 1 6 F r a s e r a n d N e a v e , L i m i t e d & S u b s i d i a r y C o m p a n i e s
CORPORATE GOVERNANCEFor the year ended 30 September 2016
7 8
C. ACCOUNTABILITY AND AUDIT
Principle 10: Accountability F&N prepares its financial statements in accordance with the Singapore Financial Reporting Standards (“SFRS”) prescribed by the Accounting Standards Council. The Board provides shareholders with quarterly and annual financial reports, and releases its quarterly and full-year financial results through announcements to the SGX-ST and, where appropriate, press releases and presentation packs. In communicating and disseminating its results, F&N aims to present a balanced and clear assessment of the Company’s performance, position and prospects.
Management provides the Board Exco with management accounts at every meeting of this Board Committee. This is in addition to such other information as the Board may require from time to time to make a balanced and informed assessment of the Company’s performance, position and prospects.
Principle 11: Risk Management and Internal Controls The Company maintains a sound system of risk management and internal controls with a view to safeguarding its assets and shareholders’ interests.
The Audit Committee (“AC”), with the assistance of internal and external auditors, reviews and reports to the Board on the adequacy of the Company’s system of controls, including financial, compliance, operational and information technology controls, established by management. In assessing the effectiveness of internal controls, the AC ensures primarily that key objectives are met, material assets are properly safeguarded, fraud or errors in the accounting records are prevented or detected, accounting records are accurate and complete, and reliable financial information is prepared in compliance with applicable internal policies, laws and regulations.
The importance and emphasis placed by the Group on internal controls is underpinned by the fact that the key performance indicators for management’s performance takes into account the findings of both internal and external auditors and the number of unresolved or outstanding issues raised in the process.
Risk Management Committee (“RMC”) The Board, through the RMC, reviews the adequacy and effectiveness of the Group’s risk management framework to ensure that robust risk management and internal controls are in place. The Company has adopted an enterprise-wide risk management (“ERM”) framework to enhance its risk management capabilities. Key risks, mitigating measures and management actions are continually identified, reviewed and monitored as part of the ERM process. Financial and operational key risk indicators are in place to track key risk exposures. Key business risks are thoroughly assessed by management and each significant transaction is comprehensively analysed so that management understands the risks involved before it is embarked upon.
The RMC oversees the risk management framework and policies of the Group. It is responsible for, among other things, reviewing the Group’s enterprise-wide risk management framework, processes and procedures for identifying, measuring, reporting and mitigating key risks in the Group’s businesses and operations. Together with the AC, the RMC helps to ensure that management maintains a sound system of risk management and internal controls to safeguard the interests of shareholders and the assets of the Group. The RMC also provides guidance to management, and renders assistance to the Board for determining the nature and extent of significant risks which the Board would be willing to take in achieving the Group’s strategic objectives. The meetings of the RMC are attended by senior management of the Company’s business divisions, and serve as a forum to review and discuss material risks and exposures of these businesses and their strategies to mitigate risks.
The RMC comprises the following members:
Mr Thapana Sirivadhanabhakdi ChairmanMr Koh Poh Tiong MemberMr Sithichai Chaikriangkrai MemberMr Prapakon Thongtheppairot Member
Periodic updates are provided to the RMC on the Group’s risk profile, and on the status of key enterprise risk management and business continuity initiatives. These updates include the assessment of the Group’s key risks by major business units, risk categories, and the status and changes in plans undertaken by management to manage key risks. Risk tolerance statements, which set out the nature and extent of significant risks which the Group is willing to take in achieving its strategic objectives, are monitored and reported to the RMC.
Using a comfort matrix of key risks, the material financial, compliance, operational and information technology risks of the Company have been documented and presented against strategies, policies, people, processes, systems, mechanisms and reporting processes that have been put in place. The management of the Company’s business divisions also carry out control self-assessments in key areas of their respective businesses and operations to evaluate the adequacy and effectiveness of their risk management measures and internal controls.
F r a s e r a n d N e a v e , L i m i t e d & S u b s i d i a r y C o m p a n i e s
CORPORATE GOVERNANCEFor the year ended 30 September 2016
A n n u a l R e p o r t 2 0 1 6 7 9
C. ACCOUNTABILITY AND AUDIT (cont’d) The Board has received assurance:
(a) from the CEOs and the Chief Financial Officers (“CFOs”) or Financial Controllers (“FCs”) of the Food & Beverage and Publishing & Printing business divisions of the Company and the Chief Financial Officer of the Company that as at 30 September 2016 the financial records of the Group have been properly maintained and the financial statements for the year ended 30 September 2016 give a true and fair view of the Group’s operations and finances;
(b) from the CEOs and the CFOs or FCs of the Food & Beverage and Publishing & Printing business divisions of the Company and the Chief Financial Officer of the Company that as at 30 September 2016 the system of internal controls in place for the Group is adequate and effective to address financial, operational, compliance and information technology risks which the Group considers relevant and material to its operations; and
(c) from the CEOs and CFOs or FCs of the Food & Beverage and Publishing & Printing business divisions of the Company and the Company Secretary who oversees risk management that as at 30 September 2016 the risk management system in place for the Group is adequate and effective to address risks which the Group considers relevant and material to its operations.
Based on the internal controls established and maintained by the Group, work performed by internal and external auditors, reviews performed by management and various Board Committees and assurance from the CEOs, the CFOs or FCs of the Food & Beverage and Publishing & Printing business divisions of the Company and the Chief Financial Officer of the Company, the Board, with the concurrence of the AC, is of the opinion that as at 30 September 2016 the Group’s internal controls were adequate and effective to address financial, operational, compliance and information technology risks, which the Group considers relevant and material to its operations.
Based on the risk management framework established and assurance from the CEOs and the CFOs or FCs of the Food & Beverage and Publishing & Printing business divisions of the Company and the Company Secretary who oversees risk management, the Board is of the view that as at 30 September 2016 the Group’s risk management system was adequate and effective to address risks which the Group considers relevant and material to its operations.
The Board notes that the system of internal controls and risk management provides reasonable, but not absolute, assurance that the Group will not be adversely affected by any event that could be reasonably foreseen as it works to achieve its business objectives.
In this regard, the Board also notes that no system of internal controls and risk management can provide absolute assurance against the occurrence of material errors, poor judgment in decision making, human error, losses, fraud or other irregularities.
An outline of the Group’s ERM framework and progress report is set out on pages 68 and 69 of this Annual Report.
Principle 12: Audit Committee The AC, on behalf of the Board, undertakes the monitoring and review of the system of internal controls. Its main responsibilities are to assist the Board in the discharge of its oversight responsibilities in the areas of internal controls, financial and accounting practices, operational and compliance controls. Significant findings are reported to the Board.
The AC is guided by written Terms of Reference endorsed by the Board and which set out its duties and responsibilities. It is duly authorised to investigate any matter within such Terms of Reference, and has full access to and the co-operation of management, as well as the full discretion to invite any Director or executive officer to attend its meetings. Under the Terms of Reference of the AC, a former partner or director of the Company's existing auditing firm or auditing corporation shall not act as a member of the AC (a) within a period of 12 months commencing on the date of his ceasing to be a partner of the auditing firm or director of the auditing corporation; and in any case (b) for so long as he has any financial interest in the auditing firm or auditing corporation.
The AC comprises the following three members:
Mrs Siripen Sitasuwan ChairmanMr Timothy Chia Chee Ming MemberMr Sithichai Chaikriangkrai Member
The AC is made up of non-executive Directors, the majority of whom, including its Chairman, are independent Directors. The members of the AC are appropriately qualified. Their collective wealth of experience and expertise in accounting and financial management enables them to discharge their responsibilities competently. The AC has reasonable resources to enable it to discharge its functions effectively. None of the members of the AC were previous partners or directors of the Company's previous auditor Ernst & Young LLP or its incumbent auditor KPMG LLP (“KPMG”) and none of the members of the AC hold any financial interest in KPMG.

80 Fra s e r a n d N ea v e , L i m i t e d & S u b s i d i a r y C o m pa n i e sA n n u a l R e p o r t 2 0 1 6 A n n u a l R e p o r t 2 0 1 6 F r a s e r a n d N e a v e , L i m i t e d & S u b s i d i a r y C o m p a n i e s
CORPORATE GOVERNANCEFor the year ended 30 September 2016
8 0
C. ACCOUNTABILITY AND AUDIT (cont’d) During the year, the key activities of the AC included the following:
• Reviewing quarterly and full-year financial statements and related SGX-ST announcements, including the independent auditors’ report for the full-year and significant financial reporting issues and assessments, to safeguard the integrity in financial reporting, and to ensure compliance with the requirements of the SFRS
• Reviewing and approving the internal and external audit plans to ensure the adequacy of the audit scope
• Recommending, for the approval of the Board, the half-year and annual financial results and related SGX-ST announcements
• Reviewing the adequacy and effectiveness of the Group’s internal audit function, including the adequacy of internal audit resources and its appropriate standing within the Group
• Reviewing with internal and external auditors, the audit report and their recommendations, and monitoring the timely and proper implementation of any required corrective or improvement measures
• Reviewing and evaluating with internal and external auditors, and reporting to the Board at least annually on the adequacy and effectiveness of internal control systems, including financial, operational and compliance and information technology controls
• Reviewing whistle-blowing investigations within the Group and ensuring appropriate follow-up actions, if required
The AC also meets with internal audit and KPMG in each case, without the presence of management at least once a year to obtain feedback on the competency and adequacy of the finance function, to review the assistance given by the Company’s management to internal and external auditors and to ascertain if there are any material weaknesses or control deficiencies in the Group’s financial reporting and operational systems. In addition, updates on changes in accounting standards and treatment are prepared by KPMG and circulated to members of the AC periodically.
The AC reviews and approves the remuneration and terms of engagement of KPMG. The AC also makes recommendations to the Board regarding the appointment, re-appointment and removal of the Company’s independent auditor. Upon the Board’s approval, the relevant recommendations are tabled for approval by shareholders.
During the year, the AC conducted a review of the scope and results of audit by KPMG, and their cost effectiveness, as well as the independence and objectivity of KPMG. It also reviewed all non-audit services provided by KPMG, and the aggregate amount of audit fees paid to them. For details of fees payable to KPMG in respect of audit and non-audit services, please refer to Note 4 of the Notes to the Financial Statements on page 119. The AC is satisfied that neither their independence nor their objectivity was put at risk, and that they were able to meet the audit requirements and statutory obligations of the Company. The AC is also satisfied with the aggregate amount of audit fees paid to KPMG. Accordingly, the AC has recommended the re-appointment of KPMG at the AGM of the Company. In recommending the re-appointment of the auditors, the AC considered and evaluated a variety of factors including, the audit engagement partner to be assigned to the audit, the number and experience of supervisory and professional staff to be assigned to the audit and the size and complexity of the Group, its business and operations.
The Company has complied with Rule 712 of the Listing Manual which requires, amongst others, that a suitable auditing firm be appointed by the Company, having regard to the factors set out therein. The Company has also complied with Rule 715 of the Listing Manual which requires that the same auditing firm of the Company audits its Singapore-incorporated subsidiaries and significant associated companies, and that a suitable auditing firm be engaged for its significant foreign-incorporated subsidiaries and associated companies.
Whistle-Blowing Policy The Group has in place a Whistle-Blowing Policy (“Policy”). This Policy provides an independent feedback channel through which matters of concern about possible improprieties in matters of financial reporting or other matters may be raised by staff and any other person in confidence and in good faith, without fear of reprisal. Details of this Policy have been disseminated and made available to all employees. This Policy is also available on the Company’s website. All matters which are raised are then independently investigated and appropriate actions taken. The AC ensures that independent investigations and any appropriate follow-up actions are carried out.

81Fra s e r a n d N ea v e , L i m i t e d & S u b s i d i a r y C o m pa n i e s A n n u a l R e p o r t 2 0 1 6 A n n u a l R e p o r t 2 0 1 6 F r a s e r a n d N e a v e , L i m i t e d & S u b s i d i a r y C o m p a n i e s
CORPORATE GOVERNANCEFor the year ended 30 September 2016
8 0
C. ACCOUNTABILITY AND AUDIT (cont’d) During the year, the key activities of the AC included the following:
• Reviewing quarterly and full-year financial statements and related SGX-ST announcements, including the independent auditors’ report for the full-year and significant financial reporting issues and assessments, to safeguard the integrity in financial reporting, and to ensure compliance with the requirements of the SFRS
• Reviewing and approving the internal and external audit plans to ensure the adequacy of the audit scope
• Recommending, for the approval of the Board, the half-year and annual financial results and related SGX-ST announcements
• Reviewing the adequacy and effectiveness of the Group’s internal audit function, including the adequacy of internal audit resources and its appropriate standing within the Group
• Reviewing with internal and external auditors, the audit report and their recommendations, and monitoring the timely and proper implementation of any required corrective or improvement measures
• Reviewing and evaluating with internal and external auditors, and reporting to the Board at least annually on the adequacy and effectiveness of internal control systems, including financial, operational and compliance and information technology controls
• Reviewing whistle-blowing investigations within the Group and ensuring appropriate follow-up actions, if required
The AC also meets with internal audit and KPMG in each case, without the presence of management at least once a year to obtain feedback on the competency and adequacy of the finance function, to review the assistance given by the Company’s management to internal and external auditors and to ascertain if there are any material weaknesses or control deficiencies in the Group’s financial reporting and operational systems. In addition, updates on changes in accounting standards and treatment are prepared by KPMG and circulated to members of the AC periodically.
The AC reviews and approves the remuneration and terms of engagement of KPMG. The AC also makes recommendations to the Board regarding the appointment, re-appointment and removal of the Company’s independent auditor. Upon the Board’s approval, the relevant recommendations are tabled for approval by shareholders.
During the year, the AC conducted a review of the scope and results of audit by KPMG, and their cost effectiveness, as well as the independence and objectivity of KPMG. It also reviewed all non-audit services provided by KPMG, and the aggregate amount of audit fees paid to them. For details of fees payable to KPMG in respect of audit and non-audit services, please refer to Note 4 of the Notes to the Financial Statements on page 119. The AC is satisfied that neither their independence nor their objectivity was put at risk, and that they were able to meet the audit requirements and statutory obligations of the Company. The AC is also satisfied with the aggregate amount of audit fees paid to KPMG. Accordingly, the AC has recommended the re-appointment of KPMG at the AGM of the Company. In recommending the re-appointment of the auditors, the AC considered and evaluated a variety of factors including, the audit engagement partner to be assigned to the audit, the number and experience of supervisory and professional staff to be assigned to the audit and the size and complexity of the Group, its business and operations.
The Company has complied with Rule 712 of the Listing Manual which requires, amongst others, that a suitable auditing firm be appointed by the Company, having regard to the factors set out therein. The Company has also complied with Rule 715 of the Listing Manual which requires that the same auditing firm of the Company audits its Singapore-incorporated subsidiaries and significant associated companies, and that a suitable auditing firm be engaged for its significant foreign-incorporated subsidiaries and associated companies.
Whistle-Blowing Policy The Group has in place a Whistle-Blowing Policy (“Policy”). This Policy provides an independent feedback channel through which matters of concern about possible improprieties in matters of financial reporting or other matters may be raised by staff and any other person in confidence and in good faith, without fear of reprisal. Details of this Policy have been disseminated and made available to all employees. This Policy is also available on the Company’s website. All matters which are raised are then independently investigated and appropriate actions taken. The AC ensures that independent investigations and any appropriate follow-up actions are carried out.
F r a s e r a n d N e a v e , L i m i t e d & S u b s i d i a r y C o m p a n i e s
CORPORATE GOVERNANCEFor the year ended 30 September 2016
A n n u a l R e p o r t 2 0 1 6 8 1
C. ACCOUNTABILITY AND AUDIT (cont’d)
Principle 13: Internal Audit The Internal Audit (“IA”) Department is an independent function within the Company. It conducts objective and independent assessments on the adequacy and quality of the Group’s system of internal controls. The Head of IA, who is a Chartered Accountant of Singapore, reports directly to the Chairman of the AC and administratively, to the Company Secretary.
The Head of IA and most of the internal audit staff are members of the Institute of Internal Auditors, Singapore and the department has adopted and complied with the Standards for the Professional Practice of Internal Auditing set by the Institute of Internal Auditors. To ensure that the internal audits are effectively performed, it recruits and employs suitably qualified staff with the requisite skills and experience. Such staff are also given relevant training and development opportunities to update their technical knowledge and auditing skills. Key staff members of the IA Department also receive relevant technical training and seminars organised by the Institute of Internal Auditors, Singapore and other professional bodies.
The IA Department operates within the framework stated in its Terms of Reference, which is approved by the AC. Under the Terms of Reference of the AC, the AC has the authority to approve the hiring, removal, evaluation and compensation of the head of internal audit function. The IA Department has unfettered access to all the Company's documents, records, properties and personnel including access to the AC. The IA Department adopts a risk-based audit methodology to develop its audit plans, and its activities are aligned to key risks of the Group. Based on risk assessments performed, greater focus and appropriate review intervals are set for higher risk activities, and material internal controls, including compliance with the Company’s policies, procedures and regulatory responsibilities.
During the year, the IA Department conducted its audit reviews based on the internal audit plan approved by the AC. All audit reports detailing audit findings and recommendations are provided to management who would respond on the actions to be taken. Each quarter, the IA Department would submit to the AC a report on the status of the audit plan and on audit findings and actions taken by management on such findings. Key findings are highlighted at AC meetings for discussion and follow-up action. The AC monitors the timely and proper implementation of required corrective, preventive or improvement measures undertaken by management.
The AC is satisfied that that the IA Department has adequate resources and appropriate standing within the Company to perform its function effectively.
D. SHAREHOLDER RIGHTS AND RESPONSIBILITIES
Principle 14: Shareholder Rights F&N believes in treating all shareholders fairly and equitably. It is committed to keeping all its shareholders and other stakeholders in Singapore and beyond informed, in a timely and consistent manner, of its corporate activities, including changes (if any) in the Company or its businesses which are likely to materially affect the price or value of its shares.
Shareholders are also given the opportunity to participate effectively and vote at general meetings of the Company, where relevant rules and procedures governing such meetings (for instance, how to vote) are clearly communicated.
Principle 15: Communication with Shareholders The Company prides itself on its high standards of disclosure and corporate transparency. At the Securities Investors Association (Singapore) 17th Investors’ Choice Awards, F&N was the winner of the Most Transparent Company Award (Consumer Staples) and runner-up for the Internal Audit Excellence Award. F&N is committed to providing fair, relevant, comprehensive and timely information regarding the Group’s performance and progress to shareholders and the investment community to enable them to make informed investment decisions. The Group’s dedicated Investor Relations (“IR”) team is tasked with and focuses on facilitating communications between the Company and its shareholders, as well as with the investment community.
The IR team communicates regularly with shareholders and the investment community, with timely disclosures of material and other pertinent information, through regular dialogues and announcements to SGX-ST. The team conducts roadshows (together with senior management), and participates in investor seminars and conferences to keep the market and investors apprised of the Group’s corporate developments and financial performance. During the year, the IR team, together with senior management, engaged with Singapore and foreign investors at investor conferences as well as one-on-one and group meetings. The aim of such engagements is to provide shareholders and investors with prompt disclosure of relevant information, to enable them to have a better understanding of the Company’s businesses and performance. The Company makes available all its briefing materials to analysts and the media. Such information, financial information, annual reports and all announcements of the Company are made available to the SGX-ST and on the Company’s website at www.fraserandneave.com, with contact details for investors to channel their comments and queries.
Further details on IR’s activities and responsibilities during the year can be found in the Investor Relations section of this Annual Report on page 66.
The Company has a policy on the payment of dividends, which is to endeavour, barring unforeseen circumstances, to pay up to fifty percent (50%) of Group Attributable Profit Before Fair Value Adjustment and Exceptional Items.

82 Fra s e r a n d N ea v e , L i m i t e d & S u b s i d i a r y C o m pa n i e sA n n u a l R e p o r t 2 0 1 6 A n n u a l R e p o r t 2 0 1 6 F r a s e r a n d N e a v e , L i m i t e d & S u b s i d i a r y C o m p a n i e s
CORPORATE GOVERNANCEFor the year ended 30 September 2016
8 2
D. SHAREHOLDER RIGHTS AND RESPONSIBILITIES (cont’d)
Principle 16: Conduct of Shareholder Meetings The Board supports and encourages active shareholder participation at AGMs. It believes that general meetings serve as an opportune forum for shareholders to meet the Board and senior management, and to interact with them.
The Company’s Constitution allows (a) each shareholder who is not a relevant intermediary (as defined in the Companies Act) the right to appoint up to two proxies and (b) each shareholder who is a relevant intermediary to appoint more than two proxies to attend and vote on their behalf in shareholders’ meetings. A copy of each of the Annual Report and Notice of AGM are sent to all shareholders. At general meetings, the Company sets out separate resolutions on each substantially separate issue and shareholders are given the opportunity to raise questions and clarify any issues that they may have relating to the resolutions to be passed.
Board members and senior management are present at each shareholders’ meeting to respond to any questions from shareholders. The Company’s independent auditor is also present to address queries about the conduct of audit and the preparation and content of the independent auditor’s report.
For greater transparency, F&N has implemented electronic poll voting since its 2010 AGM. This entails shareholders being invited to vote on each of the resolutions by poll, using an electronic voting system (instead of voting by hand), thereby allowing all shareholders present or represented at the meeting to vote on a one share, one vote basis. The voting results of all votes cast for, or against, each resolution are then screened at the meeting and announced to the SGX-ST after the meeting. The Company will continue to use the electronic poll voting system at the forthcoming AGM. As the authentication of shareholder identity and other related security and integrity of the information still remain a concern, the Company has decided for the time being, not to implement voting in absentia by mail, e-mail or fax.
Code of Business Conduct F&N has in place a Code of Business Conduct which sets out the business practices, standards and ethical conduct expected of all employees in the course of their employment with the Group. The Code of Business Conduct is disseminated and distributed to all employees for compliance, and covers such aspects of the business operations of the Group as conflicts of interest and dealings with government officials, government employees, and suppliers and customers of the Company. In addition, Directors, officers and employees are required to observe and maintain high standards of integrity in carrying out their roles and responsibilities, and to comply with relevant and applicable laws and regulations, as well as with Company policies.
Listing Rule 1207 sub-Rule (19) on Dealings in Securities In compliance with Listing Rule 1207 sub-Rule (19) of the Listing Manual, the Group issues quarterly reminders to its Directors, officers and relevant employees on the restrictions in dealings in listed securities of the Group during the period commencing (i) two weeks prior to the announcement of financial results of each of the first three quarters of the financial year, and (ii) one month before the announcement of full-year results, and ending on the date of such announcements. Directors, officers and relevant employees are also reminded not to trade in listed securities of the Group at any time while in possession of unpublished price sensitive information and to refrain from dealing in the Group’s securities on short-term considerations.

83Fra s e r a n d N ea v e , L i m i t e d & S u b s i d i a r y C o m pa n i e s A n n u a l R e p o r t 2 0 1 6 A n n u a l R e p o r t 2 0 1 6 F r a s e r a n d N e a v e , L i m i t e d & S u b s i d i a r y C o m p a n i e s
CORPORATE GOVERNANCEFor the year ended 30 September 2016
8 2
D. SHAREHOLDER RIGHTS AND RESPONSIBILITIES (cont’d)
Principle 16: Conduct of Shareholder Meetings The Board supports and encourages active shareholder participation at AGMs. It believes that general meetings serve as an opportune forum for shareholders to meet the Board and senior management, and to interact with them.
The Company’s Constitution allows (a) each shareholder who is not a relevant intermediary (as defined in the Companies Act) the right to appoint up to two proxies and (b) each shareholder who is a relevant intermediary to appoint more than two proxies to attend and vote on their behalf in shareholders’ meetings. A copy of each of the Annual Report and Notice of AGM are sent to all shareholders. At general meetings, the Company sets out separate resolutions on each substantially separate issue and shareholders are given the opportunity to raise questions and clarify any issues that they may have relating to the resolutions to be passed.
Board members and senior management are present at each shareholders’ meeting to respond to any questions from shareholders. The Company’s independent auditor is also present to address queries about the conduct of audit and the preparation and content of the independent auditor’s report.
For greater transparency, F&N has implemented electronic poll voting since its 2010 AGM. This entails shareholders being invited to vote on each of the resolutions by poll, using an electronic voting system (instead of voting by hand), thereby allowing all shareholders present or represented at the meeting to vote on a one share, one vote basis. The voting results of all votes cast for, or against, each resolution are then screened at the meeting and announced to the SGX-ST after the meeting. The Company will continue to use the electronic poll voting system at the forthcoming AGM. As the authentication of shareholder identity and other related security and integrity of the information still remain a concern, the Company has decided for the time being, not to implement voting in absentia by mail, e-mail or fax.
Code of Business Conduct F&N has in place a Code of Business Conduct which sets out the business practices, standards and ethical conduct expected of all employees in the course of their employment with the Group. The Code of Business Conduct is disseminated and distributed to all employees for compliance, and covers such aspects of the business operations of the Group as conflicts of interest and dealings with government officials, government employees, and suppliers and customers of the Company. In addition, Directors, officers and employees are required to observe and maintain high standards of integrity in carrying out their roles and responsibilities, and to comply with relevant and applicable laws and regulations, as well as with Company policies.
Listing Rule 1207 sub-Rule (19) on Dealings in Securities In compliance with Listing Rule 1207 sub-Rule (19) of the Listing Manual, the Group issues quarterly reminders to its Directors, officers and relevant employees on the restrictions in dealings in listed securities of the Group during the period commencing (i) two weeks prior to the announcement of financial results of each of the first three quarters of the financial year, and (ii) one month before the announcement of full-year results, and ending on the date of such announcements. Directors, officers and relevant employees are also reminded not to trade in listed securities of the Group at any time while in possession of unpublished price sensitive information and to refrain from dealing in the Group’s securities on short-term considerations.
F r a s e r a n d N e a v e , L i m i t e d & S u b s i d i a r y C o m p a n i e s
CORPORATE GOVERNANCEFor the year ended 30 September 2016
A n n u a l R e p o r t 2 0 1 6 8 3
CODE OF CORPORATE GOVERNANCE 2012
Guidelines for Disclosure Guideline Questions How has the company complied?
General (a) Has the Company complied with all the principles and guidelines of the Code? If not, please state the specific deviations and the alternative corporate governance practices adopted by the Company in lieu of the recommendations in the Code.
(a) F&N has complied in all material respects with the principles and guidelines set out in the Code.
(b) In what respect do these alternative corporate governance practices achieve the objectives of the principles and conform to the guidelines in the Code?
(b) Please see above.
Board Responsibility Guideline 1.5
What are the types of material transactions which require approval from the Board?
The Company has a Manual of Authority (“MOA”) which contains a schedule of matters specifically reserved to the Board for approval. In addition to matters such as annual budgets, financial plans and business strategies, Board approval is required for material transactions, such as major acquisitions, divestments, funding and investment proposals. The MOA authorises the Board Executive Committee to approve certain transactions up to specified limits beyond which the approval of the Board needs to be obtained.
Members of the Board Guideline 2.6
(a) What is the Board’s policy with regard to diversity in identifying director nominees?
(a) The Board proactively seeks to maintain an appropriate balance of expertise, skills and attributes among Directors. This is reflected in the diversity of backgrounds and competencies of our Directors.
(b) Please state whether the current composition of the Board provides diversity on each of the following – skills, experience, gender and knowledge of the Company, and elaborate with numerical data where appropriate.
(b) The current competencies of the Board range from banking, finance and accounting to relevant industry knowledge including entrepreneurial and management experience and familiarity with regulatory requirements and risk management. The Board also includes two female directors in recognition of the importance and value of gender diversity. The profiles of the directors can be found on pages 22 to 28 of this Annual Report (“this Report”).
(c) What steps has the Board taken to achieve the balance and diversity necessary to maximize its effectiveness?
(c) The Board has delegated the Nominating Committee (the “NC”) to annually review the size and composition of the Board with a view to maintaining an appropriate balance of expertise, skills and attributes taking into account the needs of the F&N and its subsidiaries (the “Group”). Please also refer to Guideline 4.6 below on the process for Board succession planning.

84 Fra s e r a n d N ea v e , L i m i t e d & S u b s i d i a r y C o m pa n i e sA n n u a l R e p o r t 2 0 1 6 A n n u a l R e p o r t 2 0 1 6 F r a s e r a n d N e a v e , L i m i t e d & S u b s i d i a r y C o m p a n i e s
CORPORATE GOVERNANCEFor the year ended 30 September 2016
8 4
CODE OF CORPORATE GOVERNANCE 2012
Guidelines for Disclosure
Guideline Questions How has the company complied?
Guideline 4.6 Please describe the board nomination process for the Company in the last financial year for:
(i) selecting and appointing new directors; and (i) The NC takes the lead in identifying, evaluating and selecting suitable candidates, factoring in the ability of the prospective candidate to contribute to the Board, as well as taking into account the existing mix of expertise, skills and attributes of the Directors to identify needed and/or desired competencies.
(ii) re-electing incumbent directors. (ii) The NC will assess whether Directors are properly qualified for re-appointment by virtue of their skills, experience and contributions.
Guideline 1.6 (a) Are new directors given formal training? If not, please explain why.
(a) Yes.
(b) What are the types of information and training provided to:
(i) new directors; and (b)(i) New Directors are given a letter of appointment setting out, among other things, a Director’s duties and obligations including their responsibilities as fiduciaries and, how to deal with conflicts of interest that may arise. A comprehensive orientation programme is also conducted to familiarise new appointees with the business activities, strategic directions, policies and corporate governance practices of the Group.
(ii) existing directors to keep them up-to-date?
(b)(ii) Directors are regularly updated on the Group’s businesses and the regulatory and industry-specific environments in which the entities of the Group operate. Updates on good corporate governance, relevant legal, regulatory and technical developments may be in writing or disseminated by way of briefings, presentations and/or handouts. Directors are also encouraged to be members of the Singapore Institute of Directors (“SID”) and to receive journal updates and training from SID in order to stay abreast of relevant developments in financial, legal and regulatory requirements.

85Fra s e r a n d N ea v e , L i m i t e d & S u b s i d i a r y C o m pa n i e s A n n u a l R e p o r t 2 0 1 6 A n n u a l R e p o r t 2 0 1 6 F r a s e r a n d N e a v e , L i m i t e d & S u b s i d i a r y C o m p a n i e s
CORPORATE GOVERNANCEFor the year ended 30 September 2016
8 4
CODE OF CORPORATE GOVERNANCE 2012
Guidelines for Disclosure
Guideline Questions How has the company complied?
Guideline 4.6 Please describe the board nomination process for the Company in the last financial year for:
(i) selecting and appointing new directors; and (i) The NC takes the lead in identifying, evaluating and selecting suitable candidates, factoring in the ability of the prospective candidate to contribute to the Board, as well as taking into account the existing mix of expertise, skills and attributes of the Directors to identify needed and/or desired competencies.
(ii) re-electing incumbent directors. (ii) The NC will assess whether Directors are properly qualified for re-appointment by virtue of their skills, experience and contributions.
Guideline 1.6 (a) Are new directors given formal training? If not, please explain why.
(a) Yes.
(b) What are the types of information and training provided to:
(i) new directors; and (b)(i) New Directors are given a letter of appointment setting out, among other things, a Director’s duties and obligations including their responsibilities as fiduciaries and, how to deal with conflicts of interest that may arise. A comprehensive orientation programme is also conducted to familiarise new appointees with the business activities, strategic directions, policies and corporate governance practices of the Group.
(ii) existing directors to keep them up-to-date?
(b)(ii) Directors are regularly updated on the Group’s businesses and the regulatory and industry-specific environments in which the entities of the Group operate. Updates on good corporate governance, relevant legal, regulatory and technical developments may be in writing or disseminated by way of briefings, presentations and/or handouts. Directors are also encouraged to be members of the Singapore Institute of Directors (“SID”) and to receive journal updates and training from SID in order to stay abreast of relevant developments in financial, legal and regulatory requirements.
F r a s e r a n d N e a v e , L i m i t e d & S u b s i d i a r y C o m p a n i e s
CORPORATE GOVERNANCEFor the year ended 30 September 2016
A n n u a l R e p o r t 2 0 1 6 8 5
CODE OF CORPORATE GOVERNANCE 2012
Guidelines for Disclosure
Guideline Questions How has the company complied?
Guideline 4.4 (a) What is the maximum number of listed company board representations that the Company has prescribed for its directors?
(a) The Company has not prescribed a maximum number of listed company board representations that a Director may hold.
(b) If a maximum number has not been determined, what are the reasons?
(b) The NC is tasked with determining whether each Director is able to adequately devote sufficient time to discharging their responsibilities to the Company. The NC has taken cognizance of the recommendations of the Code but is of the view that its assessment of a Director’s ability to devote sufficient time to the discharge of his or her duties should not entail a restriction on the number of other board commitments or their other principal commitments.
(c) What are the specific considerations in deciding on the capacity of directors?
(c) The contributions by Directors to and during meetings of the Board and relevant Board Committees as well as their attendance at such meetings and personal capabilities are holistically assessed and taken into account by the NC.
Board Evaluation Guideline 5.1
(a) What was the process upon which the Board reached the conclusion on its performance for the financial year?
(a) Directors are required to assess the performance of the Board and the Board Committees. The assessment covers areas such as Board composition, information management, Board processes, shareholder management, Board priorities, managing the Company’s performance, Director development and management, risk management and effectiveness of the Board Committees. Feedback and comments received from the Directors are reviewed by the NC in consultation with the Chairman of the Board.
(b) Has the Board met its performance objectives?
(b) Based on the NC’s review, the Board and the various Board Committees operate effectively and each Director is contributing to the overall effectiveness of the Board.
Independence of Directors Guideline 2.1
Does the Company comply with the guideline on the proportion of independent directors on the Board? If not, please state the reasons for the deviation and the remedial action taken by the Company.
Yes. The current F&N Board comprises nine non-executive Directors of whom three are independent. Independent Directors thus comprise one-third of the Board.

86 Fra s e r a n d N ea v e , L i m i t e d & S u b s i d i a r y C o m pa n i e sA n n u a l R e p o r t 2 0 1 6 A n n u a l R e p o r t 2 0 1 6 F r a s e r a n d N e a v e , L i m i t e d & S u b s i d i a r y C o m p a n i e s
CORPORATE GOVERNANCEFor the year ended 30 September 2016
8 6
CODE OF CORPORATE GOVERNANCE 2012
Guidelines for Disclosure
Guideline Questions How has the company complied?
Guideline 2.3 (a) Is there any director who is deemed to be independent by the Board, notwithstanding the existence of a relationship as stated in the Code that would otherwise deem him not to be independent? If so, please identify the director and specify the nature of such relationship.
(a) No.
(b) What are the Board’s reasons for considering him independent? Please provide a detailed explanation.
(b) Not applicable.
Guideline 2.4 Has any independent director served on the Board for more than nine years from the date of his first appointment? If so, please identify the director and set out the Board’s reasons for considering him independent.
No.
Disclosure on Remuneration Guideline 9.2
Has the Company disclosed each director’s and the CEO’s remuneration as well as a breakdown (in percentage or dollar terms) into base/fixed salary, variable or performance-related income/bonuses, benefits in kind, stock options granted, share-based incentives and awards, and other long-term incentives? If not, what are the reasons for not disclosing so?
Yes.
Guideline 9.3 (a) Has the Company disclosed each key management personnel’s remuneration, in bands of S$250,000 or in more detail, as well as a breakdown (in percentage or dollar terms) into base/fixed salary, variable or performance-related income/ bonuses, benefits in kind, stock options granted, share-based incentives and awards, and other long-term incentives? If not, what are the reasons for not disclosing so?
(a) Yes.
(b) Please disclose the aggregate remuneration paid to the top five key management personnel (who are not directors or the CEO).
(b) The Company has disclosed the aggregate remuneration paid to the top five key management personnel on page 77 of this Report. The aggregate remuneration paid to the top five key management personnel is S$5,547,324.

87Fra s e r a n d N ea v e , L i m i t e d & S u b s i d i a r y C o m pa n i e s A n n u a l R e p o r t 2 0 1 6 A n n u a l R e p o r t 2 0 1 6 F r a s e r a n d N e a v e , L i m i t e d & S u b s i d i a r y C o m p a n i e s
CORPORATE GOVERNANCEFor the year ended 30 September 2016
8 6
CODE OF CORPORATE GOVERNANCE 2012
Guidelines for Disclosure
Guideline Questions How has the company complied?
Guideline 2.3 (a) Is there any director who is deemed to be independent by the Board, notwithstanding the existence of a relationship as stated in the Code that would otherwise deem him not to be independent? If so, please identify the director and specify the nature of such relationship.
(a) No.
(b) What are the Board’s reasons for considering him independent? Please provide a detailed explanation.
(b) Not applicable.
Guideline 2.4 Has any independent director served on the Board for more than nine years from the date of his first appointment? If so, please identify the director and set out the Board’s reasons for considering him independent.
No.
Disclosure on Remuneration Guideline 9.2
Has the Company disclosed each director’s and the CEO’s remuneration as well as a breakdown (in percentage or dollar terms) into base/fixed salary, variable or performance-related income/bonuses, benefits in kind, stock options granted, share-based incentives and awards, and other long-term incentives? If not, what are the reasons for not disclosing so?
Yes.
Guideline 9.3 (a) Has the Company disclosed each key management personnel’s remuneration, in bands of S$250,000 or in more detail, as well as a breakdown (in percentage or dollar terms) into base/fixed salary, variable or performance-related income/ bonuses, benefits in kind, stock options granted, share-based incentives and awards, and other long-term incentives? If not, what are the reasons for not disclosing so?
(a) Yes.
(b) Please disclose the aggregate remuneration paid to the top five key management personnel (who are not directors or the CEO).
(b) The Company has disclosed the aggregate remuneration paid to the top five key management personnel on page 77 of this Report. The aggregate remuneration paid to the top five key management personnel is S$5,547,324.
F r a s e r a n d N e a v e , L i m i t e d & S u b s i d i a r y C o m p a n i e s
CORPORATE GOVERNANCEFor the year ended 30 September 2016
A n n u a l R e p o r t 2 0 1 6 8 7
CODE OF CORPORATE GOVERNANCE 2012
Guidelines for Disclosure
Guideline Questions How has the company complied?
Guideline 9.4 Is there any employee who is an immediate family member of a director or the CEO, and whose remuneration exceeds $50,000 during the year? If so, please identify the employee and specify the relationship with the relevant director or the CEO.
No.
Guideline 9.6 (a) Please describe how the remuneration received by executive directors and key management personnel has been determined by the performance criteria.
(a) Executive Directors Not applicable as there are no executive
directors on the F&N Board.
Key Management Personnel The Remuneration Committee (the “RC”)
periodically reviews the level and mix of remuneration policies and practices of the Company, including long-term incentives. When conducting such reviews, the RC takes into account the performance of the Company and that of individual employees. The Company’s compensation framework comprises fixed remuneration, annual variable bonuses and long-term incentives. Annual variable bonuses are linked to achievement of financial and non-financial key performance indicators. These indicators such as core values, competencies, key result areas, performance rating, and potential of the employees (including key management) link remuneration to corporate and individual performance. Long-term incentive plans are conditional upon pre-determined performance targets being met and the long-term incentive plans serve to motivate and reward employees and align their interests to maximise long-term shareholder value.
(b) What were the performance conditions used to determine their entitlement under the short-term and long-term incentive schemes?
(b) The Company subscribes to linking executive remuneration to corporate and individual performance, based on an annual appraisal of employees and using indicators such as core values, competencies, key result areas, performance rating and potential of the employees. The Company has also put in place long-term share-based incentive schemes which are based on the achievement of certain pre-determined targets.
(c) Were all of these performance conditions met? If not, what were the reasons?
(c) Yes.

88 Fra s e r a n d N ea v e , L i m i t e d & S u b s i d i a r y C o m pa n i e sA n n u a l R e p o r t 2 0 1 6 A n n u a l R e p o r t 2 0 1 6 F r a s e r a n d N e a v e , L i m i t e d & S u b s i d i a r y C o m p a n i e s
CORPORATE GOVERNANCEFor the year ended 30 September 2016
8 8
CODE OF CORPORATE GOVERNANCE 2012
Guidelines for Disclosure
Guideline Questions How has the company complied?
Risk Management and Internal Controls Guideline 6.1
What types of information does the Company provide to independent directors to enable them to understand its business, the business and financial environment as well as the risks faced by the Company? How frequently is the information provided?
Management provides the Board with detailed Board papers specifying relevant information and commercial rationale for each proposal for which Board approval is sought. Such information includes relevant financial forecasts, risk analyses, mitigation strategies, feasibility studies and key commercial issues for the Board’s attention and consideration. Reports on major operational matters, business development activities, financial performance, potential investment opportunities and budgets are also circulated to the Board. Board papers and agenda items are dispatched to the Directors about a week before scheduled meetings. This is to give Directors sufficient time to review and consider the matters being tabled and/or discussed.
On a quarterly basis, financial statements are presented at Board meetings.
Risk-related reports are submitted to the Risk Management Committee (“RMC”) four times a year. The RMC, comprising selected board members assists the board in overseeing risk management for the Group.
Guideline 13.1 Does the Company have an internal audit function? If not, please explain why.
Yes.
Guideline 11.3 (a) In relation to the major risks faced by the Company, including financial, operational, compliance, information technology and sustainability, please state the bases for the Board’s view on the adequacy and effectiveness of the Company’s internal controls and risk management systems.
(a) The Board’s view on the adequacy and effectiveness of the Company’s internal control and risk management systems is based on reviews and reports from the Audit Committee (“AC”) and RMC.
With the assistance of internal and external auditors, the AC reviews and reports to the Board on the adequacy of the Company’s system of controls including financial, compliance operational and information technology controls, established by management. In assessing the effectiveness of internal controls, the AC ensures primarily that key objectives are met, material assets are properly safeguarded, fraud or errors in the accounting records are prevented or detected, accounting records are accurate and complete, and reliable financial information is prepared in compliance with applicable internal policies, laws and regulations.
The RMC is responsible for among other things, reviewing the Group’s enterprise-wide risk management framework, processes and procedures for identifying, measuring, reporting and mitigating key risks in the Group’s business and operations.

89Fra s e r a n d N ea v e , L i m i t e d & S u b s i d i a r y C o m pa n i e s A n n u a l R e p o r t 2 0 1 6 A n n u a l R e p o r t 2 0 1 6 F r a s e r a n d N e a v e , L i m i t e d & S u b s i d i a r y C o m p a n i e s
CORPORATE GOVERNANCEFor the year ended 30 September 2016
8 8
CODE OF CORPORATE GOVERNANCE 2012
Guidelines for Disclosure
Guideline Questions How has the company complied?
Risk Management and Internal Controls Guideline 6.1
What types of information does the Company provide to independent directors to enable them to understand its business, the business and financial environment as well as the risks faced by the Company? How frequently is the information provided?
Management provides the Board with detailed Board papers specifying relevant information and commercial rationale for each proposal for which Board approval is sought. Such information includes relevant financial forecasts, risk analyses, mitigation strategies, feasibility studies and key commercial issues for the Board’s attention and consideration. Reports on major operational matters, business development activities, financial performance, potential investment opportunities and budgets are also circulated to the Board. Board papers and agenda items are dispatched to the Directors about a week before scheduled meetings. This is to give Directors sufficient time to review and consider the matters being tabled and/or discussed.
On a quarterly basis, financial statements are presented at Board meetings.
Risk-related reports are submitted to the Risk Management Committee (“RMC”) four times a year. The RMC, comprising selected board members assists the board in overseeing risk management for the Group.
Guideline 13.1 Does the Company have an internal audit function? If not, please explain why.
Yes.
Guideline 11.3 (a) In relation to the major risks faced by the Company, including financial, operational, compliance, information technology and sustainability, please state the bases for the Board’s view on the adequacy and effectiveness of the Company’s internal controls and risk management systems.
(a) The Board’s view on the adequacy and effectiveness of the Company’s internal control and risk management systems is based on reviews and reports from the Audit Committee (“AC”) and RMC.
With the assistance of internal and external auditors, the AC reviews and reports to the Board on the adequacy of the Company’s system of controls including financial, compliance operational and information technology controls, established by management. In assessing the effectiveness of internal controls, the AC ensures primarily that key objectives are met, material assets are properly safeguarded, fraud or errors in the accounting records are prevented or detected, accounting records are accurate and complete, and reliable financial information is prepared in compliance with applicable internal policies, laws and regulations.
The RMC is responsible for among other things, reviewing the Group’s enterprise-wide risk management framework, processes and procedures for identifying, measuring, reporting and mitigating key risks in the Group’s business and operations.
F r a s e r a n d N e a v e , L i m i t e d & S u b s i d i a r y C o m p a n i e s
CORPORATE GOVERNANCEFor the year ended 30 September 2016
A n n u a l R e p o r t 2 0 1 6 8 9
CODE OF CORPORATE GOVERNANCE 2012
Guidelines for Disclosure
Guideline Questions How has the company complied?
Guideline 11.3 (b) In respect of the past 12 months, has the Board received assurance from the CEO and the CFO as well as the internal auditor that:
(i) the financial records have been properly maintained and the financial statements give true and fair view of the Company’s operations and finances; and
(b)(i) The Board has received assurance that the financial records of the Group have been properly maintained and the financial statements for the year ended 30 September 2016 give a true and fair view of the Group’s operations and finances, from the CEOs and the Chief Financial Officers (“CFOs”) or Financial Controllers (“FCs”) of the Food & Beverage and Publishing & Printing business divisions of the Company and from the Chief Financial Officer of the Company.
(ii) the Company’s risk management and internal control systems are effective? If not, how does the Board assure itself of points (i) and (ii) above?
(b)(ii) The Board has received assurance that the risk management systems in place for the Group is adequate and effective to address risks which the Group considers relevant and material to its operations, from the CEOs and the CFOs or FCs of the Food & Beverage and Publishing & Printing business divisions of the Company and from the Company Secretary who oversees risk management.
The Board has received assurance that the system of internal controls in place for the Group is adequate and effective to address financial, operational, compliance and information technology risks which the Group considers relevant and material to its operations, from the CEOs and the CFOs or FCs of the Food & Beverage and Publishing & Printing business divisions of the Company and from the Chief Financial Officer of the Company.

90 Fra s e r a n d N ea v e , L i m i t e d & S u b s i d i a r y C o m pa n i e sA n n u a l R e p o r t 2 0 1 6 A n n u a l R e p o r t 2 0 1 6 F r a s e r a n d N e a v e , L i m i t e d & S u b s i d i a r y C o m p a n i e s
CORPORATE GOVERNANCEFor the year ended 30 September 2016
9 0
CODE OF CORPORATE GOVERNANCE 2012
Guidelines for Disclosure
Guideline Questions How has the company complied?
Guideline 12.6 (a) Please provide a breakdown of the fees paid in total to the external auditors for audit and non-audit services for the financial year.
(a) As disclosed in Note 4(c) to the Notes to the Financial Statements, the fees paid/payable to external auditors for audit and non-audit services for the financial year ended 30 September 2016 are:
$’000
Audit fees paid / payable - Auditor of the Company 611 - Member firms of the Auditor
of the Company 615 1,226
Non-audit fees paid / payable - Auditor of the Company 6 - Member firms of the Auditor
of the Company 80 86
(b) If the external auditors have supplied a
substantial volume of non-audit services to the Company, please state the bases for the Audit Committee’s view on the independence of the external auditors.
(b) Non-audit fees amount to 7% of the total fees paid/payable to the auditor of the Company, and are not substantial.
Communication with Shareholders Guideline 15.4
(a) Does the Company regularly communicate with shareholders and attend to their questions? How often does the Company meet with institutional and retail investors?
(a) The Company, through its Investor Relations (the “IR”) team communicates regularly with shareholders and the investment community, with timely disclosures of material and other pertinent information, through regular dialogues and announcements to SGX-ST.
(b) Is this done by a dedicated investor relations team (or equivalent)? If not, who performs this role?
(b) Yes. Please refer to page 81 of this Report.
(c) How does the Company keep shareholders informed of corporate developments, apart from SGXNET announcements and the annual report?
(c) The IR team together with senior management participates in investor seminars, conferences, one-on-one and group meetings.
Guideline 15.5 If the Company is not paying any dividends for the financial year, please explain why.
Not applicable.

INDEX TO FINANCIAL REPORT
92 Directors’ Statement 97 Independent Auditors’ Report98 Profit Statement99 Statement of Comprehensive Income100 Balance Sheet 101 Statement of Changes in Equity104 Cash Flow Statement106 Notes to Financial Statements169 Particulars of Group Properties172 Shareholding Statistics173 Interested Person Transactions

A n n u a l R e p o r t 2 0 1 6
DIRECTORS’ STATEMENT
F r a s e r a n d N e a v e , L i m i t e d & S u b s i d i a r y C o m p a n i e s9 2
The directors have pleasure in presenting this statement to the shareholders together with the audited financial statements of Fraser and Neave, Limited (the “Company”) and its subsidiaries (the “Group”) for the financial year ended 30 September 2016.
1. DIRECTORS The directors of the Company in office at the date of this statement are:
Mr Charoen Sirivadhanabhakdi (Chairman)Khunying Wanna Sirivadhanabhakdi (Vice Chairman)Tengku Syed Badarudin Jamalullail Mr Timothy Chia Chee MingMr Koh Poh Tiong Mrs Siripen Sitasuwan Mr Chotiphat Bijananda Mr Thapana Sirivadhanabhakdi Mr Sithichai Chaikriangkrai Mr Prapakon Thongtheppairot (Alternate Director to Mr Sithichai Chaikriangkrai)
2. ARRANGEMENTS TO ENABLE DIRECTORS TO ACQUIRE SHARES AND DEBENTURES Neither at the end of, nor at any time during, the financial year was the Company a party to any arrangement whose object was to enable the directors of the Company to acquire benefits by means of an acquisition of shares in, or debentures of, the Company or any other body corporate, other than as disclosed in this statement.
3. DIRECTORS’ INTERESTS IN SHARES OR DEBENTURES (a) The following directors who held office at the end of the financial year had, according to the register required to be kept
under Section 164 of the Companies Act (Chapter 50 of Singapore), interest in the shares in, or debentures of, the Company and its related corporations (other than wholly-owned subsidiaries) as stated below:
Direct Interest Deemed Interest
Name of Director As at
1 Oct 2015As at
30 Sep 2016As at
1 Oct 2015 As at
30 Sep 2016 Charoen SirivadhanabhakdiFraser and Neave, Limited
• Ordinary Shares - - 1,270,503,884(1) 1,270,503,884(1)
Frasers Centrepoint Limited • Ordinary Shares - - 2,541,007,768(1) 2,541,007,768(1)
FCL Treasury Pte. Ltd. • S$600,000,000 4.88%
Subordinated Perpetual Securities (Series 3) - - S$250,000,000 S$250,000,000
• S$700,000,000 5.00% Subordinated Perpetual Securities (Series 5) - - S$300,000,000 S$300,000,000
Fraser & Neave Holdings Bhd • Ordinary Shares - - 203,470,910 203,470,910
TCC Assets Limited • Ordinary Shares 25,000 25,000 - -
Khunying Wanna Sirivadhanabhakdi Fraser and Neave, Limited
• Ordinary Shares - - 1,270,503,884(1) 1,270,503,884(1)
Frasers Centrepoint Limited • Ordinary Shares - - 2,541,007,768(1) 2,541,007,768(1)
FCL Treasury Pte. Ltd. • S$600,000,000 4.88%
Subordinated Perpetual Securities (Series 3) - - S$250,000,000 S$250,000,000
• S$700,000,000 5.00% Subordinated Perpetual Securities (Series 5) - - S$300,000,000 S$300,000,000
92 Fra s e r a n d N ea v e , L i m i t e d & S u b s i d i a r y C o m pa n i e sA n n u a l R e p o r t 2 0 1 6

F r a s e r a n d N e a v e , L i m i t e d & S u b s i d i a r y C o m p a n i e s
DIRECTORS’ STATEMENT
A n n u a l R e p o r t 2 0 1 6 9 3
3. DIRECTORS’ INTERESTS IN SHARES OR DEBENTURES (cont’d)
Direct Interest Deemed Interest
Name of Director As at
1 Oct 2015As at
30 Sep 2016As at
1 Oct 2015 As at
30 Sep 2016 Khunying Wanna Sirivadhanabhakdi (cont’d) Fraser & Neave Holdings Bhd
• Ordinary Shares - - 203,470,910 203,470,910TCC Assets Limited
• Ordinary Shares 25,000 25,000 - - Tengku Syed Badarudin Jamalullail Fraser & Neave Holdings Bhd
• Ordinary Shares 2,062,000 2,062,000 - - Koh Poh Tiong Fraser and Neave, Limited
• Ordinary Shares 251,315 251,315 - -Frasers Centrepoint Limited
• Ordinary Shares 385,660 385,660 - -FCL Treasury Pte. Ltd.
• S$700,000,000 5.00% Subordinated Perpetual Securities (Series 5) S$250,000 S$250,000 - -
(1) Each of Charoen Sirivadhanabhakdi and his spouse, Khunying Wanna Sirivadhanabhakdi, owns 50% of the issued share capital of TCC
Assets Limited (“TCCA”), and is therefore deemed to be interested in all of the shares in the Company in which TCCA has an interest. Both the Company and Frasers Centrepoint Limited (“FCL”) are direct subsidiaries of TCCA. Charoen Sirivadhanabhakdi and Khunying Wanna Sirivadhanabhakdi also jointly hold a 51% direct interest in Siriwana Company Limited, which in turn holds an approximate 45.27% direct interest in Thai Beverage Public Company Limited (“ThaiBev”). Further, Charoen Sirivadhanabhakdi and Khunying Wanna Sirivadhanabhakdi jointly hold a 100% direct interest in MM Group Limited (“MM Group”). MM Group holds a 100% direct interest in each of Maxtop Management Corp. (“Maxtop”), Risen Mark Enterprise Ltd. (“RM”) and Golden Capital (Singapore) Limited (“GC”). Maxtop holds a 17.23% direct interest in ThaiBev; RM holds a 3.32% direct interest in ThaiBev; and GC holds a 0.06% direct interest in ThaiBev. ThaiBev holds a 100% direct interest in International Beverage Holdings Limited, which in turns holds a 100% direct interest in InterBev Investment Limited (“IBIL”). Each of Charoen Sirivadhanabhakdi and Khunying Wanna Sirivadhanabhakdi is therefore deemed to be interested in all the shares in the Company in which IBIL has an interest.
(b) There was no change in any of the above-mentioned interests in the Company between the end of the financial year and 21 October 2016.
(c) By virtue of Section 4 of the Securities and Futures Act (Chapter 289 of Singapore), each of Charoen Sirivadhanabhakdi and Khunying Wanna Sirivadhanabhakdi is deemed to have interests in the shares of the subsidiaries held by the Company and in the shares of the subsidiaries held by FCL.
(d) Except as disclosed in this statement, no director who held office at the end of the financial year had any interest in shares in, or debentures of, the Company, or its related corporations, either at the beginning of the financial year, or date of appointment if later, or at the end of the financial year.
4. SHARE OPTIONS AND SHARE PLANS
(a) F&N Restricted Share Plan (“RSP”) and F&N Performance Share Plan (“PSP”) The Company has in place the RSP and PSP (collectively, the “Share Plans”). The Share Plans were approved by the shareholders of the Company at the Extraordinary General Meeting held on 22 January 2009.
The Remuneration Committee administers the Share Plans. During the financial year, the Remuneration Committee comprised the following non-executive directors:
Mr Timothy Chia Chee Ming (Chairman) Mrs Siripen Sitasuwan Mr Thapana Sirivadhanabhakdi
93Fra s e r a n d N ea v e , L i m i t e d & S u b s i d i a r y C o m pa n i e s A n n u a l R e p o r t 2 0 1 6

A n n u a l R e p o r t 2 0 1 6
F r a s e r a n d N e a v e , L i m i t e d & S u b s i d i a r y C o m p a n i e s
DIRECTORS’ STATEMENT9 4
4. SHARE OPTIONS AND SHARE PLANS (cont’d)
(a) F&N Restricted Share Plan (“RSP”) and F&N Performance Share Plan (“PSP”) (cont’d)
Share Grants under RSP and PSP Under the RSP and PSP, the Company grants a base number of conditional share awards (the “Base Award”) to eligible participants annually. The Base Award represents the right to receive fully paid ordinary shares of the Company, their equivalent cash value or combinations thereof, free of charge, provided that certain prescribed performance conditions are met. The Remuneration Committee, as the administrator of the Share Plans, has absolute discretion in granting the Base Awards.
Depending on the level of achievement of the pre-determined targets over a two-year performance period for the RSP and three-year performance period for the PSP, an achievement factor will be applied to the relevant Base Award to determine the actual number of RSP shares and PSP shares to be awarded at the end of the respective performance periods. The achievement factor ranges from 0% to 150% for the RSP and 0% to 200% for the PSP. Accordingly, the actual number of RSP shares to be awarded pursuant to the RSP will range from 0% to 150% and the actual number of PSP shares to be awarded pursuant to the PSP will range from 0% to 200% of the relevant Base Award (the “Final Award”).
At the end of the two-year performance period, 50% of the number of shares under the RSP Final Award will be released to the participants upon vesting. The balance will be released equally over the subsequent two years upon fulfilment of service requirements. All the shares under the PSP Final Award will be released to the participants at the end of the three-year performance period upon vesting.
Senior management participants are required to hold a minimum number of shares that are released to them under the RSP and PSP for the duration of their employment or tenure with the Company.
No awards have been granted to controlling shareholders or their associates, or parent group directors or employees under the Share Plans.
No awards have been granted to directors of the Company.
No participant has received 5% or more of the total number of shares available/delivered pursuant to grants under the RSP and PSP.
The first grant of the RSP and PSP was made in December 2009 for the Financial Year 2009/10. The details of the shares awarded under the RSP and PSP in aggregate are as follows:
(i) RSP
Shares Grant Date
Balance as at1.10.2015 or Grant
Date if later Cancelled Achievement
Factor Vested
Balance as at
30.9.2016 Year 3 14.12.2011 510,974 - - (510,974) -Year 4 14.12.2012 817,250 (6,275) - (408,625) 402,350Year 5 01.10.2014 1,013,675 (11,500) 100,825 (557,250) 545,750Year 6 06.05.2015 1,055,300 (70,500) - - 984,800Year 7 26.02.2016 1,255,976 (25,500) - - 1,230,476 4,653,175^ (113,775)* 100,825 (1,476,849) 3,163,376 ^ This takes into account the adjustments made on 7 October 2014 following F&N’s distribution to its shareholders by way of dividend
in specie and a capital reduction undertaken by F&N during the financial year ended 30 September 2014. * Cancelled due to resignations.
(ii) PSP
Shares Grant Date
Balance as at1.10.2015
or Grant
Date if later Cancelled Achievement
Factor Vested
Balanceas at
30.9.2016 Year 4 14.12.2012 68,158 - (20,358) (47,800) -Year 5 01.10.2014 32,546 - - - 32,546Year 6 06.05.2015 40,500 (10,000) - - 30,500Year 7 26.02.2016 84,383 - - - 84,383 225,587^ (10,000)* (20,358) (47,800) 147,429 ^ This takes into account the adjustments made on 7 October 2014 following F&N’s distribution to its shareholders by way of dividend
in specie and a capital reduction undertaken by F&N during the financial year ended 30 September 2014. * Cancelled due to resignations.
94 Fra s e r a n d N ea v e , L i m i t e d & S u b s i d i a r y C o m pa n i e sA n n u a l R e p o r t 2 0 1 6

A n n u a l R e p o r t 2 0 1 6
F r a s e r a n d N e a v e , L i m i t e d & S u b s i d i a r y C o m p a n i e s
DIRECTORS’ STATEMENT9 4
4. SHARE OPTIONS AND SHARE PLANS (cont’d)
(a) F&N Restricted Share Plan (“RSP”) and F&N Performance Share Plan (“PSP”) (cont’d)
Share Grants under RSP and PSP Under the RSP and PSP, the Company grants a base number of conditional share awards (the “Base Award”) to eligible participants annually. The Base Award represents the right to receive fully paid ordinary shares of the Company, their equivalent cash value or combinations thereof, free of charge, provided that certain prescribed performance conditions are met. The Remuneration Committee, as the administrator of the Share Plans, has absolute discretion in granting the Base Awards.
Depending on the level of achievement of the pre-determined targets over a two-year performance period for the RSP and three-year performance period for the PSP, an achievement factor will be applied to the relevant Base Award to determine the actual number of RSP shares and PSP shares to be awarded at the end of the respective performance periods. The achievement factor ranges from 0% to 150% for the RSP and 0% to 200% for the PSP. Accordingly, the actual number of RSP shares to be awarded pursuant to the RSP will range from 0% to 150% and the actual number of PSP shares to be awarded pursuant to the PSP will range from 0% to 200% of the relevant Base Award (the “Final Award”).
At the end of the two-year performance period, 50% of the number of shares under the RSP Final Award will be released to the participants upon vesting. The balance will be released equally over the subsequent two years upon fulfilment of service requirements. All the shares under the PSP Final Award will be released to the participants at the end of the three-year performance period upon vesting.
Senior management participants are required to hold a minimum number of shares that are released to them under the RSP and PSP for the duration of their employment or tenure with the Company.
No awards have been granted to controlling shareholders or their associates, or parent group directors or employees under the Share Plans.
No awards have been granted to directors of the Company.
No participant has received 5% or more of the total number of shares available/delivered pursuant to grants under the RSP and PSP.
The first grant of the RSP and PSP was made in December 2009 for the Financial Year 2009/10. The details of the shares awarded under the RSP and PSP in aggregate are as follows:
(i) RSP
Shares Grant Date
Balance as at1.10.2015 or Grant
Date if later Cancelled Achievement
Factor Vested
Balance as at
30.9.2016 Year 3 14.12.2011 510,974 - - (510,974) -Year 4 14.12.2012 817,250 (6,275) - (408,625) 402,350Year 5 01.10.2014 1,013,675 (11,500) 100,825 (557,250) 545,750Year 6 06.05.2015 1,055,300 (70,500) - - 984,800Year 7 26.02.2016 1,255,976 (25,500) - - 1,230,476 4,653,175^ (113,775)* 100,825 (1,476,849) 3,163,376 ^ This takes into account the adjustments made on 7 October 2014 following F&N’s distribution to its shareholders by way of dividend
in specie and a capital reduction undertaken by F&N during the financial year ended 30 September 2014. * Cancelled due to resignations.
(ii) PSP
Shares Grant Date
Balance as at1.10.2015
or Grant
Date if later Cancelled Achievement
Factor Vested
Balanceas at
30.9.2016 Year 4 14.12.2012 68,158 - (20,358) (47,800) -Year 5 01.10.2014 32,546 - - - 32,546Year 6 06.05.2015 40,500 (10,000) - - 30,500Year 7 26.02.2016 84,383 - - - 84,383 225,587^ (10,000)* (20,358) (47,800) 147,429 ^ This takes into account the adjustments made on 7 October 2014 following F&N’s distribution to its shareholders by way of dividend
in specie and a capital reduction undertaken by F&N during the financial year ended 30 September 2014. * Cancelled due to resignations.
F r a s e r a n d N e a v e , L i m i t e d & S u b s i d i a r y C o m p a n i e s
DIRECTORS’ STATEMENT
A n n u a l R e p o r t 2 0 1 6 9 5
4. SHARE OPTIONS AND SHARE PLANS (cont’d)
(b) Share Options pursuant to the Fraser & Neave Holdings Bhd (“F&NHB”) Executives’ Share Option Scheme (“F&NHB 2007 Scheme”) The F&NHB 2007 Scheme was approved by the shareholders of F&NHB at its Extraordinary General Meeting held on 5 April 2007. At the end of the financial year, no options were outstanding under the F&NHB 2007 Scheme.
Details of the options granted to executives to subscribe for ordinary shares of RM1.00 each in F&NHB pursuant to the F&NHB 2007 Scheme are as follows:
Options Offer Date
Balance as at
1.10.2015Options
Exercised
Balance as at
30.9.2016
Exercise Price
per share Exercise Period 2011 22.11.2010 131,700 (131,700) - RM14.52 22.08.2013 to 21.10.2015
No options were granted under the F&NHB 2007 Scheme since 2012 following the adoption of the F&NHB RSP (as defined below) and F&NHB PSP (as defined below).
The option price shall be the five-day weighted average market price of F&NHB’s shares as quoted on Bursa Malaysia Securities Berhad immediately preceding the date of the offer, or the par value of the shares of F&NHB, whichever is higher.
The options may be exercised in full or in part by giving notice in writing to F&NHB in the prescribed form during the exercise period, accompanied by the remittance of the amount of the exercise price.
(c) F&NHB Restricted Share Plan (“F&NHB RSP”) and F&NHB Performance Share Plan (“F&NHB PSP”) (collectively, the “Share Grant Plan”) The Share Grant Plan was approved by Bursa Malaysia Securities Berhad on 20 December 2011 and subsequently approved by the shareholders of F&NHB at its Extraordinary General Meeting held on 13 January 2012.
Under the F&NHB RSP and F&NHB PSP, F&NHB grants a base number of conditional share awards (the “F&NHB Base Award”) to eligible participants annually. The F&NHB Base Award represents the right to receive fully paid shares of F&NHB, their equivalent cash value or combinations thereof, free of charge, provided that certain prescribed performance conditions are met. The Remuneration Committee of F&NHB, as administrator of the Share Grant Plan, has absolute discretion in the granting of shares under the F&NHB RSP and F&NHB PSP.
Depending on the achievement of pre-determined targets over a two-year performance period for the F&NHB RSP and three-year performance period for the F&NHB PSP, the final number of F&NHB RSP shares and F&NHB PSP shares to be awarded could range between 0% to 150% of the initial grant of the F&NHB RSP Base Award and 0% to 200% of the initial grant of F&NHB PSP Base Award, respectively (the “F&NHB Final Award”).
At the end of the two-year performance period, 50% of the F&NHB RSP shares under the F&NHB Final Award will be released to the participants upon vesting. The balance will be released equally over the subsequent two years upon fulfilment of service requirements.
All of the F&NHB PSP shares under the F&NHB Final Award will be released to the participants at the end of the three-year performance period upon vesting.
Senior management participants are required to hold a minimum number of the shares released to them under the F&NHB RSP and F&NHB PSP to maintain a beneficial ownership stake in F&NHB for the duration of their employment or tenure with F&NHB.
No awards have been granted to the directors of F&NHB.
The first grant of the F&NHB RSP was made in March 2012. There were no grants made under the F&NHB PSP as at 30 September 2016. The details of the shares awarded under the F&NHB RSP are as follows:
Shares Grant Date
Balance as at 1.10.2015 or Grant
Date if later Cancelled Achievement
Factor Vested
Balance as at
30.9.2016 Year 1 15.03.2012 43,225 - - (43,225) -Year 2 07.02.2013 170,750 (675) - (85,800) 84,275Year 3 12.08.2014 574,200 (2,900) 31,000 (302,600) 299,700Year 4 15.01.2015 546,700 (29,100) - - 517,600Year 5 05.01.2016 596,500 - - - 596,500
1,931,375 (32,675)* 31,000 (431,625) 1,498,075
* Cancelled due to resignations.
95Fra s e r a n d N ea v e , L i m i t e d & S u b s i d i a r y C o m pa n i e s A n n u a l R e p o r t 2 0 1 6

A n n u a l R e p o r t 2 0 1 6
F r a s e r a n d N e a v e , L i m i t e d & S u b s i d i a r y C o m p a n i e s
DIRECTORS’ STATEMENT9 6
4. SHARE OPTIONS AND SHARE PLANS (cont’d) (d) Other than those disclosed in this paragraph 4, no shares of the Company or any corporation in the Group were issued during
the financial year by virtue of the exercise of options to take up unissued shares of the Company or any corporation in the Group, whether granted before or during that financial year.
(e) Other than those reported in this paragraph 4, there were no unissued shares of the Company or any corporation in the Group under options as at the end of the financial year to which this statement relates.
5. AUDIT COMMITTEE The Audit Committee carried out its functions in accordance with Section 201B(5) of the Companies Act (Chapter 50 of Singapore), which include, inter alia, the following:
(a) reviewing quarterly and full-year financial statements of the Company and of the Group for the financial year and the independent auditors’ report for the full-year prior to approval by the Board;
(b) reviewing and approving the internal and external audit plans to ensure the adequacy of the audit scope;
(c) reviewing the adequacy and effectiveness of the Group’s internal controls;
(d) reviewing with internal and external auditors, the audit report and their recommendations, and monitoring the timely and proper implementation of any required corrective or improvement measures;
(e) reviewing the adequacy and effectiveness of the Group’s internal audit function, including the adequacy of internal audit resources and its appropriate standing within the Group;
(f) meeting with the external and internal auditors, in each case without the presence of the Company’s management to review various audit matters as well as the assistance given by the Company's management to the external and internal auditors; and
(g) recommending to the Board regarding the appointment, re-appointment and removal of the external auditor, and reviewing and approving the remuneration and terms of engagement of the external auditor.
Further details regarding the Audit Committee are disclosed in the Corporate Governance Report.
The Audit Committee has nominated KPMG LLP for re-appointment by the shareholders as independent auditor at the forthcoming Annual General Meeting.
6. INDEPENDENT AUDITOR The independent auditor, KPMG LLP, has expressed its willingness to accept re-appointment.
7. OPINION OF THE DIRECTORS In the opinion of the directors,
(a) the consolidated financial statements of the Group and the balance sheet and statement of changes in equity of the Company are drawn up so as to give a true and fair view of the financial position of the Group and of the Company as at 30 September 2016 and the financial performance, changes in equity and cash flows of the Group and the changes in equity of the Company for the financial year ended 30 September 2016; and
(b) at the date of this statement, there are reasonable grounds to believe that the Company will be able to pay its debts as and when they fall due.
On behalf of the Board
SIRIPEN SITASUWAN Director
SITHICHAI CHAIKRIANGKRAI Director
7 November 2016
96 Fra s e r a n d N ea v e , L i m i t e d & S u b s i d i a r y C o m pa n i e sA n n u a l R e p o r t 2 0 1 6

A n n u a l R e p o r t 2 0 1 6
F r a s e r a n d N e a v e , L i m i t e d & S u b s i d i a r y C o m p a n i e s
DIRECTORS’ STATEMENT9 6
4. SHARE OPTIONS AND SHARE PLANS (cont’d) (d) Other than those disclosed in this paragraph 4, no shares of the Company or any corporation in the Group were issued during
the financial year by virtue of the exercise of options to take up unissued shares of the Company or any corporation in the Group, whether granted before or during that financial year.
(e) Other than those reported in this paragraph 4, there were no unissued shares of the Company or any corporation in the Group under options as at the end of the financial year to which this statement relates.
5. AUDIT COMMITTEE The Audit Committee carried out its functions in accordance with Section 201B(5) of the Companies Act (Chapter 50 of Singapore), which include, inter alia, the following:
(a) reviewing quarterly and full-year financial statements of the Company and of the Group for the financial year and the independent auditors’ report for the full-year prior to approval by the Board;
(b) reviewing and approving the internal and external audit plans to ensure the adequacy of the audit scope;
(c) reviewing the adequacy and effectiveness of the Group’s internal controls;
(d) reviewing with internal and external auditors, the audit report and their recommendations, and monitoring the timely and proper implementation of any required corrective or improvement measures;
(e) reviewing the adequacy and effectiveness of the Group’s internal audit function, including the adequacy of internal audit resources and its appropriate standing within the Group;
(f) meeting with the external and internal auditors, in each case without the presence of the Company’s management to review various audit matters as well as the assistance given by the Company's management to the external and internal auditors; and
(g) recommending to the Board regarding the appointment, re-appointment and removal of the external auditor, and reviewing and approving the remuneration and terms of engagement of the external auditor.
Further details regarding the Audit Committee are disclosed in the Corporate Governance Report.
The Audit Committee has nominated KPMG LLP for re-appointment by the shareholders as independent auditor at the forthcoming Annual General Meeting.
6. INDEPENDENT AUDITOR The independent auditor, KPMG LLP, has expressed its willingness to accept re-appointment.
7. OPINION OF THE DIRECTORS In the opinion of the directors,
(a) the consolidated financial statements of the Group and the balance sheet and statement of changes in equity of the Company are drawn up so as to give a true and fair view of the financial position of the Group and of the Company as at 30 September 2016 and the financial performance, changes in equity and cash flows of the Group and the changes in equity of the Company for the financial year ended 30 September 2016; and
(b) at the date of this statement, there are reasonable grounds to believe that the Company will be able to pay its debts as and when they fall due.
On behalf of the Board
SIRIPEN SITASUWAN Director
SITHICHAI CHAIKRIANGKRAI Director
7 November 2016
F r a s e r a n d N e a v e , L i m i t e d & S u b s i d i a r y C o m p a n i e s
INDEPENDENT AUDITORS’ REPORT To the members of Fraser and Neave, Limited
A n n u a l R e p o r t 2 0 1 6 9 7
Report on the Financial Statements We have audited the accompanying financial statements of Fraser and Neave, Limited (“the Company”) and its subsidiaries (collectively, “the Group”) which comprise the balance sheets of the Group and the Company as at 30 September 2016, the statements of changes in equity of the Group and the Company and the profit statement, statement of comprehensive income and cash flow statement of the Group for the year then ended, and a summary of significant accounting policies and other explanatory information as set out on pages 98 to 168.
Management’s responsibility for the financial statements Management is responsible for the preparation of financial statements that give a true and fair view in accordance with the provisions of the Singapore Companies Act, Chapter 50 (the “Act”) and Singapore Financial Reporting Standards, and for devising and maintaining a system of internal accounting controls sufficient to provide a reasonable assurance that assets are safeguarded against loss from unauthorised use or disposition; and transactions are properly authorised and that they are recorded as necessary to permit the preparation of true and fair financial statements and to maintain accountability of assets.
Auditor’s responsibility Our responsibility is to express an opinion on these financial statements based on our audit. We conducted our audit in accordance with Singapore Standards on Auditing. Those standards require that we comply with ethical requirements and plan and perform the audit to obtain reasonable assurance about whether the financial statements are free from material misstatement.
An audit involves performing procedures to obtain audit evidence about the amounts and disclosures in the financial statements. The procedures selected depend on the auditor’s judgment, including the assessment of the risks of material misstatement of the financial statements, whether due to fraud or error. In making those risk assessments, the auditor considers internal control relevant to the entity’s preparation of the financial statements that give a true and fair view in order to design audit procedures that are appropriate in the circumstances, but not for the purpose of expressing an opinion on the effectiveness of the entity’s internal control. An audit also includes evaluating the appropriateness of accounting policies used and the reasonableness of accounting estimates made by management, as well as evaluating the overall presentation of the financial statements.
We believe that the audit evidence we have obtained is sufficient and appropriate to provide a basis for our audit opinion.
Opinion In our opinion, the consolidated financial statements of the Group and the balance sheet and statement of changes in equity of the Company are properly drawn up in accordance with the provisions of the Act and Singapore Financial Reporting Standards so as to give a true and fair view of the financial position of the Group and of the Company as at 30 September 2016 and the financial performance, changes in equity and cash flows of the Group and the changes in equity of the Company for the year ended on that date.
Other matter The financial statements for the year ended 30 September 2015 were audited by another auditor who expressed an unmodified opinion on those financial statements on 6 November 2015.
Report on Other Legal and Regulatory Requirements In our opinion, the accounting and other records required by the Act to be kept by the Company and by those subsidiary corporations incorporated in Singapore of which we are the auditors have been properly kept in accordance with the provisions of the Act.
KPMG LLP Public Accountants and Chartered Accountants Singapore 7 November 2016
97Fra s e r a n d N ea v e , L i m i t e d & S u b s i d i a r y C o m pa n i e s A n n u a l R e p o r t 2 0 1 6

PROFIT STATEMENTFor the year ended 30 September 2016
The Notes on pages 106 to 168 form an integral part of the Financial Statements.
A n n u a l R e p o r t 2 0 1 6
F r a s e r a n d N e a v e , L i m i t e d & S u b s i d i a r y C o m p a n i e s9 8
THE GROUP
Notes 2016
($'000) 2015
($'000) Continuing operations
REVENUE 3 1,978,622 2,121,110Cost of sales (1,250,256) (1,425,111)Gross profit 728,366 695,999Other income (net) 4(a) 12,917 12,749 Operating expenses - Distribution (176,754) (174,867)- Marketing (299,640) (295,748)- Administration (136,950) (150,962) (613,344) (621,577)TRADING PROFIT 127,939 87,171Share of joint venture company's loss (540) (1,229)Share of associated companies' profit 3,186 3,930Gross income from investments 6 48,566 41,691PROFIT BEFORE INTEREST AND TAXATION ("PBIT") 179,151 131,563 Finance income 14,779 6,479Finance cost (4,969) (6,300)Net finance income 4(b) 9,810 179PROFIT BEFORE FAIR VALUE ADJUSTMENT, TAXATION AND EXCEPTIONAL ITEMS 188,961 131,742Fair value adjustment of investment properties (1,532) (2,311)PROFIT BEFORE TAXATION AND EXCEPTIONAL ITEMS 4(c) 187,429 129,431Exceptional items 7 735 (27,706)PROFIT BEFORE TAXATION 188,164 101,725Taxation 8 (22,506) (19,316)PROFIT FROM CONTINUING OPERATIONS AFTER TAXATION 165,658 82,409 Discontinued operations PROFIT FROM DISCONTINUED OPERATIONS, NET OF TAXATION 26(a) - 95,289Gain on disposal of discontinued operations 26(a) - 541,531PROFIT AFTER TAXATION 165,658 719,229 ATTRIBUTABLE PROFIT TO: Shareholders of the Company - Before fair value adjustment and exceptional items Continuing operations 108,963 63,034 Discontinued operations - 52,409 108,963 115,443- Fair value adjustment of investment properties from continuing operations (1,548) (964)- Gain on disposal of discontinued operations - 541,531- Exceptional items from continuing operations 681 (23,394) 108,096 632,616Non-controlling interests Continuing operations 57,562 43,733 Discontinued operations - 42,880 57,562 86,613 165,658 719,229 Earnings per share attributable to the shareholders of the Company 10 Basic - before gain on disposal of discontinued operations,
fair value adjustment and exceptional items 7.5 cts 8.0 cts - after gain on disposal of discontinued operations,
fair value adjustment and exceptional items 7.5 cts 43.7 cts Fully diluted - before gain on disposal of discontinued operations,
fair value adjustment and exceptional items 7.5 cts 7.9 cts
- after gain on disposal of discontinued operations,
fair value adjustment and exceptional items 7.4 cts 43.6 cts Earnings per share from continuing operations attributable to the
shareholders of the Company 10 Basic - before fair value adjustment and exceptional items 7.5 cts 4.4 cts - after fair value adjustment and exceptional items 7.5 cts 2.7 ctsFully diluted - before fair value adjustment and exceptional items 7.5 cts 4.3 cts - after fair value adjustment and exceptional items 7.4 cts 2.6 cts
98 Fra s e r a n d N ea v e , L i m i t e d & S u b s i d i a r y C o m pa n i e sA n n u a l R e p o r t 2 0 1 6

F r a s e r a n d N e a v e , L i m i t e d & S u b s i d i a r y C o m p a n i e s
STATEMENT OF COMPREHENSIVE INCOMEFor the year ended 30 September 2016
A n n u a l R e p o r t 2 0 1 6 9 9
The Notes on pages 106 to 168 form an integral part of the Financial Statements.
THE GROUP
2016
($'000) 2015
($'000) Profit after taxation 165,658 719,229 Other comprehensive income: Items that are or may be reclassified subsequently to profit statement Share of other comprehensive income of associated companies (762) 231Realisation of fair value gains on disposal of available-for-sale financial asset (152) -Realisation of reserve on settlement of a net investment (10,915) -Realisation of reserves on liquidation/disposal of subsidiary and joint venture companies (621) 32,096Net fair value changes on available-for-sale financial assets 524,301 143,055Currency translation difference 8,548 (128,450) 520,399 46,932Items that will not be reclassified to profit statement Remeasurement of defined benefit obligations (2,656) (1,283)Revaluation of fixed assets 9,292 - 6,636 (1,283)Other comprehensive income for the year, net of taxation 527,035 45,649Total comprehensive income for the year 692,693 764,878 Total comprehensive income attributable to: Shareholders of the Company Continuing operations 636,841 130,370 Discontinued operations - 607,023 636,841 737,393Non-controlling interests 55,852 27,485 692,693 764,878
99Fra s e r a n d N ea v e , L i m i t e d & S u b s i d i a r y C o m pa n i e s A n n u a l R e p o r t 2 0 1 6

The Notes on pages 106 to 168 form an integral part of the Financial Statements.
A n n u a l R e p o r t 2 0 1 6
F r a s e r a n d N e a v e , L i m i t e d & S u b s i d i a r y C o m p a n i e s
BALANCE SHEET As at 30 September 2016
1 0 0
THE GROUP THE COMPANY
Notes2016
($'000)2015
($'000)2016
($'000) 2015
($'000) SHARE CAPITAL AND RESERVES Share capital 11 849,301 849,301 849,301 849,301Treasury shares 11 (2,655) (5,759) (2,655) (5,759)Reserves 11 1,996,438 1,424,507 876,012 786,756 2,843,084 2,268,049 1,722,658 1,630,298NON-CONTROLLING INTERESTS 309,460 288,028 - - 3,152,544 2,556,077 1,722,658 1,630,298Represented by: NON-CURRENT ASSETS Fixed assets 12 490,886 464,388 393 -Investment properties 13 42,863 35,018 - -Properties held for development 14 18,232 17,848 - -Subsidiary companies 15 - - 1,123,027 1,056,969Joint venture company 16 46,011 43,736 - -Associated companies 17 43,003 41,860 18,100 18,100Intangible assets 18 96,764 78,750 187 -Brands 22 27,892 27,481 212 212Other investments 20 1,363,389 844,780 185,240 120,129Other receivables 24 1,131 1,580 - -Deferred tax assets 30 13,267 18,156 - -Bank fixed deposits 21 2,900 3,874 - - 2,146,338 1,577,471 1,327,159 1,195,410 CURRENT ASSETS Inventories 23 247,332 253,918 - -Trade receivables 24 267,178 278,792 - -Other receivables 24 53,894 53,670 1,074 1,387Related parties 24 4,565 1,742 6 -Subsidiary companies 15 - - 13,905 5,647Joint venture companies 16 558 756 - -Associated companies 17 3 3,403 - -Bank fixed deposits 21 563,282 446,462 231,018 276,978Cash and bank balances 21 479,347 515,243 270,726 261,494 1,616,159 1,553,986 516,729 545,506Assets held for sale 26 10,375 11,412 - - 1,626,534 1,565,398 516,729 545,506 Deduct: CURRENT LIABILITIES Trade payables 27 180,548 201,113 - -Other payables 27 210,973 192,845 7,423 10,312Related parties 27 12,650 14,523 21 -Subsidiary companies 15 - - 6,470 692Associated companies 17 1,565 1,843 - -Borrowings 28 12,223 2,551 - -Provision for taxation 30,851 31,712 3,972 3,138 448,810 444,587 17,886 14,142Liabilities held for sale 26 2,339 1,802 - - 451,149 446,389 17,886 14,142
NET CURRENT ASSETS 1,175,385 1,119,009 498,843 531,364
Deduct: NON-CURRENT LIABILITIES Other payables 27 2,900 3,874 - -Related parties 27 1,265 1,265 1,265 1,265Subsidiary companies 15 - - 101,894 95,097Borrowings 28 124,825 97,924 - -Provision for employee benefits 29 20,671 18,201 - -Deferred tax liabilities 30 19,518 19,139 185 114 169,179 140,403 103,344 96,476
3,152,544 2,556,077 1,722,658 1,630,298
100 Fra s e r a n d N ea v e , L i m i t e d & S u b s i d i a r y C o m pa n i e sA n n u a l R e p o r t 2 0 1 6

F r a s e r a n d N e a v e , L i m i t e d & S u b s i d i a r y C o m p a n i e s
STATEMENT OF CHANGES IN EQUITY A n n u a l R e p o r t 2 0 1 6 1 0 1
The Notes on pages 106 to 168 form an integral part of the Financial Statements.
THE GROUP
Notes
Share Capital ($'000)
Treasury Shares ($'000)
CapitalReserve
($'000)
RevenueReserve
($'000)
Exchange Reserve
($'000)
Fair Value Adjustment
Reserve ($'000)
Hedging Reserve
($'000)
Share-based
Payment Reserve
($'000)
Dividend Reserve
($'000) Total
($'000)
Non-controlling
Interests($'000)
Total Equity($'000)
YEAR ENDED 30 SEPTEMBER 2016 Balance at 1 October 2015 849,301 (5,759) 8,751 849,404 (141,090) 653,441 (273) 10,947 43,327 2,268,049 288,028 2,556,077 Comprehensive income Share of other comprehensive
income of associated companies - - - (827) 244 - (152) (27) - (762) - (762)
Realisation of reserve on liquidation of a subsidiary company - - - - (621) - - - - (621) - (621)
Realisation of fair value gains on disposal of available- for-sale financial asset - - - - - (152) - - - (152) - (152)
Realisation of reserve on settlement of a net investment - - - - (6,061) - - - - (6,061) (4,854) (10,915)
Revaluation of fixed assets - - 9,292 - - - - - - 9,292 - 9,292Net fair value changes on
available-for-sale financial asset - - - - - 524,301 - - - 524,301 - 524,301
Remeasurement of defined benefit obligations - - - (2,434) - - - - - (2,434) (222) (2,656)
Currency translation difference - - - - 5,182 - - - - 5,182 3,366 8,548Other comprehensive
income for the year - - 9,292 (3,261) (1,256) 524,149 (152) (27) - 528,745 (1,710) 527,035Profit for the year - - - 108,096 - - - - - 108,096 57,562 165,658Total comprehensive
income for the year - - 9,292 104,835 (1,256) 524,149 (152) (27) - 636,841 55,852 692,693 Contributions by and
distributions to owners Employee share-based expense - - - - - - - 4,654 - 4,654 1,403 6,057Treasury shares reissued
pursuant to share plans 11 - 3,104 814 - - - - (3,918) - - - -Purchase of shares by a
subsidiary company - - - (2,209) - - - - - (2,209) (1,769) (3,978)Shares of a subsidiary company
reissued pursuant to its share plans - - (111) 1,418 - - - (1,307) - - - -
Contribution of capital by non-controlling interests - - - - - - - - - - 630 630
Dividends: 9 Dividends paid - - - (21,733) - - - - (43,327) (65,060) (33,875) (98,935)Dividends proposed - - - (43,373) - - - - 43,373 - - -Total contributions by and
distributions to owners - 3,104 703 (65,897) - - - (571) 46 (62,615) (33,611) (96,226) Changes in ownership interests Change of interests in a
subsidiary company - - - 809 - - - - - 809 (809) -Total changes in ownership
interests - - - 809 - - - - - 809 (809) -Total transactions with owners
in their capacity as owners - 3,104 703 (65,088) - - - (571) 46 (61,806) (34,420) (96,226)Balance at 30 September 2016 849,301 (2,655) 18,746 889,151 (142,346) 1,177,590 (425) 10,349 43,373 2,843,084 309,460 3,152,544
101Fra s e r a n d N ea v e , L i m i t e d & S u b s i d i a r y C o m pa n i e s A n n u a l R e p o r t 2 0 1 6

The Notes on pages 106 to 168 form an integral part of the Financial Statements.
A n n u a l R e p o r t 2 0 1 6
F r a s e r a n d N e a v e , L i m i t e d & S u b s i d i a r y C o m p a n i e s
STATEMENT OF CHANGES IN EQUITY 1 0 2
THE GROUP
Notes
Share Capital ($'000)
Treasury Shares ($'000)
Capital Reserve
($'000)
Revenue Reserve
($'000)
Exchange Reserve
($'000)
Fair Value Adjustment
Reserve ($'000)
Hedging Reserve
($'000)
Share-based
Payment Reserve
($'000)
Dividend Reserve
($'000) Total
($'000)
Non-controlling
Interests($'000)
Total Equity($'000)
YEAR ENDED 30 SEPTEMBER 2015 Balance at 1 October 2014 844,585 (23) 8,785 290,828 (103,797) 510,386 (605) 11,322 43,347 1,604,828 397,549 2,002,377Effects of adopting FRS 111 - - - 2 - - - - - 2 2 4Balance at 1 October 2014, restated 844,585 (23) 8,785 290,830 (103,797) 510,386 (605) 11,322 43,347 1,604,830 397,551 2,002,381 Comprehensive income Share of other comprehensive
income of associated companies - - - 18 (174) - 332 55 - 231 - 231
Realisation of reserves on disposal/liquidation of subsidiary and joint venture companies - - - - 32,096 - - - - 32,096 - 32,096
Net fair value changes on available-for-sale financial assets - - - - - 143,055 - - - 143,055 - 143,055
Remeasurement of defined benefit obligations - - - (1,390) - - - - - (1,390) 107 (1,283)
Currency translation difference - - - - (69,215) - - - - (69,215) (59,235) (128,450)Other comprehensive
income for the year - - - (1,372) (37,293) 143,055 332 55 - 104,777 (59,128) 45,649Profit for the year - - - 632,616 - - - - - 632,616 86,613 719,229Total comprehensive
income for the year - - - 631,244 (37,293) 143,055 332 55 - 737,393 27,485 764,878 Contributions by and
distributions to owners Employee share-based expense - - - - - - - 5,006 - 5,006 1,481 6,487Issue of shares in the Company
upon vesting of shares awarded 11 4,716 - - - - - - (4,716) - - - -
Purchase of treasury shares 11 - (5,736) - - - - - - - (5,736) - (5,736)Purchase of shares by a
subsidiary company - - - (2,142) - - - - - (2,142) (1,709) (3,851)Shares of a subsidiary company
reissued pursuant to its share plans - - (34) 754 - - - (720) - - - -
Contribution of capital by non-controlling interests - - - - - - - - - - 2,870 2,870
Dividends: 9 Dividends paid - - - (29,006) - - - - (43,347) (72,353) (29,213) (101,566)Dividends proposed - - - (43,327) - - - - 43,327 - - -Total contributions by and
distributions to owners 4,716 (5,736) (34) (73,721) - - - (430) (20) (75,225) (26,571) (101,796) Changes in ownership interests Change of interests in a
subsidiary company - - - 1,051 - - - - - 1,051 (1,051) -Disposal of a subsidiary
company - - - - - - - - - - (109,386) (109,386)Total changes in ownership
interests - - - 1,051 - - - - - 1,051 (110,437) (109,386)Total transactions with owners
in their capacity as owners 4,716 (5,736) (34) (72,670) - - - (430) (20) (74,174) (137,008) (211,182)Balance at 30 September 2015 849,301 (5,759) 8,751 849,404 (141,090) 653,441 (273) 10,947 43,327 2,268,049 288,028 2,556,077
102 Fra s e r a n d N ea v e , L i m i t e d & S u b s i d i a r y C o m pa n i e sA n n u a l R e p o r t 2 0 1 6

F r a s e r a n d N e a v e , L i m i t e d & S u b s i d i a r y C o m p a n i e s
STATEMENT OF CHANGES IN EQUITY A n n u a l R e p o r t 2 0 1 6 1 0 3
THE COMPANY
Notes
Share Capital ($'000)
Treasury Shares ($'000)
Capital Reserve
($'000)
Revenue Reserve
($'000)
Fair Value Adjustment
Reserve ($'000)
Share-based
Payment Reserve
($'000)
Dividend Reserve
($'000)
Total Equity ($'000)
YEAR ENDED 30 SEPTEMBER 2016 Balance at 1 October 2015 849,301 (5,759) (2,814) 735,604 3,936 6,703 43,327 1,630,298 Comprehensive income Net fair value changes on
available-for-sale financial asset - - - - 71,230 - - 71,230 Realisation of fair value gains on
disposal of available-for-sale financial asset - - - - (152) - - (152)
Other comprehensive income for the year - - - - 71,078 - - 71,078
Profit for the year - - - 83,440 - - - 83,440Total comprehensive income
for the year - - - 83,440 71,078 - - 154,518 Contributions by and distributions
to owners Employee share-based expense - - - - - 2,902 - 2,902Treasury shares reissued pursuant
to share plans 11 - 3,104 814 - - (3,918) - - Dividends: 9 Dividends paid - - - (21,733) - - (43,327) (65,060)Dividends proposed - - - (43,373) - - 43,373 -Total transactions with owners in
their capacity as owners - 3,104 814 (65,106) - (1,016) 46 (62,158)Balance at 30 September 2016 849,301 (2,655) (2,000) 753,938 75,014 5,687 43,373 1,722,658
YEAR ENDED 30 SEPTEMBER 2015 Balance at 1 October 2014 844,585 (23) (2,814) 33,138 (15,394) 8,270 43,347 911,109 Comprehensive income Net fair value changes on
available-for-sale financial assets - - - - 19,330 - - 19,330 Other comprehensive income
for the year - - - - 19,330 - - 19,330 Profit for the year - - - 774,799 - - - 774,799Total comprehensive income
for the year - - - 774,799 19,330 - - 794,129 Contributions by and distributions
to owners Employee share-based expense - - - - - 3,149 - 3,149Issue of shares in the Company
upon vesting of shares awarded 11 4,716 - - - - (4,716) - - Purchase of treasury shares 11 - (5,736) - - - - - (5,736) Dividends: 9 Dividends paid - - - (29,006) - - (43,347) (72,353)Dividends proposed - - - (43,327) - - 43,327 -Total transactions with owners in
their capacity as owners 4,716 (5,736) - (72,333) - (1,567) (20) (74,940)Balance at 30 September 2015 849,301 (5,759) (2,814) 735,604 3,936 6,703 43,327 1,630,298
The Notes on pages 106 to 168 form an integral part of the Financial Statements.
103Fra s e r a n d N ea v e , L i m i t e d & S u b s i d i a r y C o m pa n i e s A n n u a l R e p o r t 2 0 1 6

The Notes on pages 106 to 168 form an integral part of the Financial Statements.
A n n u a l R e p o r t 2 0 1 6
F r a s e r a n d N e a v e , L i m i t e d & S u b s i d i a r y C o m p a n i e s
CASH FLOW STATEMENT For the year ended 30 September 2016
1 0 4
THE GROUP 2016
($'000) 2015
($'000) CASH FLOWS FROM OPERATING ACTIVITIES Profit before taxation and exceptional items from continuing operations 187,429 129,431Profit before taxation and exceptional items from discontinued operations - 123,526Profit before taxation and exceptional items 187,429 252,957Adjustments for:
Depreciation of fixed assets 46,804 75,431Impairment of fixed assets, brands and intangible assets 1,052 17,682Reversal of impairment of fixed assets (464) (1,039)Impairment of other investments 25 32Fixed assets and intangible assets written off 430 638Provision for employee benefits 1,526 1,498Write back of provision for employee benefits (140) (342)Loss on disposal of fixed assets and intangible assets 309 389Amortisation of brands and intangible assets 14,943 16,445Interest income (14,779) (6,479)Interest expenses 4,969 6,300Share of joint venture company's loss 540 1,229Share of associated companies' profit (3,186) (3,930)Investment income (48,566) (41,691)Employee share-based expense 6,057 6,935Fair value adjustment of financial instruments (422) (2,425)Fair value adjustment of investment properties 1,532 2,311Loss on disposal of financial instruments 2,124 698
Operating cash before working capital changes 200,183 326,639Change in inventories 7,066 (4,700)Change in receivables 20,263 (13,213)Change in related parties' and joint venture and associated companies' balances (6,722) 13,290Change in payables (9,063) (15,027)Development expenditure on properties held for development (8) (206)Currency realignment (11,012) (46,033)Cash generated from operations 200,707 260,750Interest income received 14,300 6,306Interest expenses paid (4,864) (6,383)Income taxes paid (24,417) (34,230)Payment of employee benefits (1,059) (1,603)Net cash from operating activities 184,667 224,840 CASH FLOWS FROM INVESTING ACTIVITIES Dividends from associated companies 5,779 1,129Investment income 48,566 41,691Proceeds from sale of fixed assets 414 728Proceeds from redemption of other investments 6,069 -Net cash outflow on acquisition of subsidiary companies (24,921) -Net cash inflow from disposal of a subsidiary company - 558,747Purchase of fixed assets and investment properties (65,471) (56,075)Payment for intangible assets (10,887) (11,768)Loan to a joint venture company - (2,163)Net cash (used in)/from investing activities (40,451) 532,289
F r a s e r a n d N e a v e , L i m i t e d & S u b s i d i a r y C o m p a n i e s
CASH FLOW STATEMENT For the year ended 30 September 2016
A n n u a l R e p o r t 2 0 1 6 1 0 5
THE GROUP 2016
($'000) 2015
($'000) CASH FLOWS FROM FINANCING ACTIVITIES Proceeds from/(Repayment of) term loans and bank borrowings 32,594 (17,235)Purchase of treasury shares - (5,736)Purchase of shares by a subsidiary company (3,978) (3,851)Proceeds from issue of shares by subsidiary companies to non-controlling interests 630 2,870Payment of dividends: - by subsidiary companies to non-controlling interests (33,875) (29,213)- by the Company to shareholders (65,060) (72,353)Net cash used in financing activities (69,689) (125,518) Net increase in cash and cash equivalents 74,527 631,611Cash and cash equivalents at beginning of year 961,036 354,326Reclassified to assets held for sale - (101)Effects of exchange rate changes on cash and cash equivalents 2,308 (24,800)Cash and cash equivalents at end of year 1,037,871 961,036 Cash and cash equivalents at end of year comprise:
Cash and bank deposits (Note 21) 1,045,529 965,579Bank overdrafts (Note 28) (802) (669)
1,044,727 964,910Less: Fixed deposits relating to consideration for acquisition of subsidiary companies (Note 21) (6,856) (3,874)
1,037,871 961,036 Analysis of acquisition and disposal of subsidiary companies Net assets acquired:
Fixed assets 5,438 -Current assets 1,224 -Bank borrowings (1,758) -Other current liabilities (2,034) -Other non-current liabilities (260) -Cash and cash equivalents 4,079 -
6,689 -Provisional goodwill on acquisition 22,311 -Consideration paid 29,000 -Less: Cash and cash equivalents of subsidiary companies acquired (4,079) -Net cash outflow on acquisition of subsidiary companies 24,921 -
Net assets disposed:
Non-current assets - (77,659)Current assets - (60,810)Non-current liabilities - 10,867Current liabilities - 33,801Non-controlling interests - 109,386Cash and cash equivalents - (149,279)
- (133,694)Realisation of reserve - (32,801)Gain on disposal of a subsidiary company - (541,531)Consideration received - (708,026)Less: Cash and cash equivalents of a subsidiary company disposed - 149,279Net cash inflow on disposal of a subsidiary company - (558,747)
The Notes on pages 106 to 168 form an integral part of the Financial Statements.
104 Fra s e r a n d N ea v e , L i m i t e d & S u b s i d i a r y C o m pa n i e sA n n u a l R e p o r t 2 0 1 6

F r a s e r a n d N e a v e , L i m i t e d & S u b s i d i a r y C o m p a n i e s
CASH FLOW STATEMENT For the year ended 30 September 2016
A n n u a l R e p o r t 2 0 1 6 1 0 5
THE GROUP 2016
($'000) 2015
($'000) CASH FLOWS FROM FINANCING ACTIVITIES Proceeds from/(Repayment of) term loans and bank borrowings 32,594 (17,235)Purchase of treasury shares - (5,736)Purchase of shares by a subsidiary company (3,978) (3,851)Proceeds from issue of shares by subsidiary companies to non-controlling interests 630 2,870Payment of dividends: - by subsidiary companies to non-controlling interests (33,875) (29,213)- by the Company to shareholders (65,060) (72,353)Net cash used in financing activities (69,689) (125,518) Net increase in cash and cash equivalents 74,527 631,611Cash and cash equivalents at beginning of year 961,036 354,326Reclassified to assets held for sale - (101)Effects of exchange rate changes on cash and cash equivalents 2,308 (24,800)Cash and cash equivalents at end of year 1,037,871 961,036 Cash and cash equivalents at end of year comprise:
Cash and bank deposits (Note 21) 1,045,529 965,579Bank overdrafts (Note 28) (802) (669)
1,044,727 964,910Less: Fixed deposits relating to consideration for acquisition of subsidiary companies (Note 21) (6,856) (3,874)
1,037,871 961,036 Analysis of acquisition and disposal of subsidiary companies Net assets acquired:
Fixed assets 5,438 -Current assets 1,224 -Bank borrowings (1,758) -Other current liabilities (2,034) -Other non-current liabilities (260) -Cash and cash equivalents 4,079 -
6,689 -Provisional goodwill on acquisition 22,311 -Consideration paid 29,000 -Less: Cash and cash equivalents of subsidiary companies acquired (4,079) -Net cash outflow on acquisition of subsidiary companies 24,921 -
Net assets disposed:
Non-current assets - (77,659)Current assets - (60,810)Non-current liabilities - 10,867Current liabilities - 33,801Non-controlling interests - 109,386Cash and cash equivalents - (149,279)
- (133,694)Realisation of reserve - (32,801)Gain on disposal of a subsidiary company - (541,531)Consideration received - (708,026)Less: Cash and cash equivalents of a subsidiary company disposed - 149,279Net cash inflow on disposal of a subsidiary company - (558,747)
The Notes on pages 106 to 168 form an integral part of the Financial Statements.
105Fra s e r a n d N ea v e , L i m i t e d & S u b s i d i a r y C o m pa n i e s A n n u a l R e p o r t 2 0 1 6

A n n u a l R e p o r t 2 0 1 6
F r a s e r a n d N e a v e , L i m i t e d & S u b s i d i a r y C o m p a n i e s
NOTES TO THE FINANCIAL STATEMENTSFor the year ended 30 September 2016
1 0 6
The following Notes form an integral part of the Financial Statements on pages 98 to 105.
The financial statements were authorised for issue in accordance with a resolution of the Directors on 7 November 2016.
1. GENERAL Fraser and Neave, Limited (the "Company") is a limited liability company incorporated and domiciled in Singapore and is listed on the Singapore Exchange Securities Trading Limited. The registered office of the Company is located at 438 Alexandra Road, #20-00 Alexandra Point, Singapore 119958. TCC Assets Limited incorporated in the British Virgin Islands is the immediate and ultimate holding company.
The principal activities of the Group are: (a) production and sale of beverages and dairy products; and (b) printing and publishing. These activities are carried out through the Company's subsidiary, joint venture and associated companies to which the Company provides management and administrative services.
The Company's operation is managed through a wholly-owned subsidiary company.
The financial statements of the Group as at and for the year ended 30 September 2016 comprise the Company and its subsidiary companies (together referred to as the “Group”).
2. ACCOUNTING POLICIES
2.1 Basis of Preparation The financial statements are prepared in accordance with Singapore Financial Reporting Standards (“FRS”) as required by the Companies Act (Chapter 50 of Singapore). The financial statements are prepared on a historical cost basis except as disclosed in the accounting policies below.
The financial statements are presented in Singapore Dollar and all values are rounded to the nearest thousand ($’000) unless otherwise stated.
The Group and the Company have applied the same accounting policies and methods of computation in the preparation of the financial statements for the current financial year and are consistent with those used in the previous financial year.
2.2 Basis of Consolidation and Business Combinations Subsidiary companies are those companies controlled by the Group. Subsidiary companies are consolidated from the date of acquisition, being the date on which the Group obtains control, and continue to be consolidated until the date that such control ceases. The financial year of the Company and all its subsidiary companies ends on 30 September unless otherwise stated. The consolidated financial statements of the Group incorporate the financial statements of the Company and all its subsidiary companies made up to 30 September. The financial statements of subsidiary companies are prepared using consistent accounting policies.
Acquisitions of subsidiary companies are accounted for using the acquisition method. The consideration transferred for the acquisition of a subsidiary company comprises the fair value of the assets transferred, liabilities incurred, equity interest issued by the Group and any contingent consideration arrangement. Identifiable assets acquired and liabilities and contingent liabilities assumed in a business combination are measured initially at their fair values at the acquisition date. Any change in the contingent consideration to be paid will be recognised in the profit statement. Acquisition-related costs are expensed as incurred.
All intra group transactions, balances and unrealised gains are eliminated on consolidation. Unrealised gains resulting from transactions with associated and joint venture companies are eliminated to the extent of the Group’s interest in them. Unrealised losses are also eliminated but only to the extent that there is no evidence of impairment.
Losses within a subsidiary company are attributed to the non-controlling interest even if that results in a deficit balance.
Non-controlling interests in the acquiree is recognised on the acquisition date at the non-controlling interests’ proportionate share of the acquiree’s net identifiable assets.
In business combinations achieved in stages, previously held equity interests in the acquiree are re-measured to fair value at the acquisition date and any corresponding gain or loss is recognised in the profit statement.
When a change in the Company’s ownership interest in a subsidiary company results in a loss of control over the subsidiary company, the assets and liabilities of the subsidiary company including any goodwill are derecognised. Any retained interest in the entity is re-measured at fair value. The difference between the carrying amount of the retained interest and its fair value is recognised in the profit statement.
The accounting policy on goodwill on acquisition of subsidiary companies is included in Note 2.12(b).
106 Fra s e r a n d N ea v e , L i m i t e d & S u b s i d i a r y C o m pa n i e sA n n u a l R e p o r t 2 0 1 6

F r a s e r a n d N e a v e , L i m i t e d & S u b s i d i a r y C o m p a n i e s
NOTES TO THE FINANCIAL STATEMENTSFor the year ended 30 September 2016
A n n u a l R e p o r t 2 0 1 6 1 0 7
2. ACCOUNTING POLICIES (cont’d)
2.2 Basis of Consolidation and Business Combinations (cont’d)
Business combinations prior to 1 October 2010 Business combinations were accounted for using the purchase method. Transaction costs directly attributable to the acquisition formed part of the acquisition costs.
Business combinations achieved in stages were accounted for as separate steps. Adjustments to those fair values relating to previously held interests were treated as a revaluation and recognised in equity. Any additional acquired interest did not affect previously recognised goodwill.
Contingent consideration was recognised if, and only if, the Group had a present obligation, the economic outflow was more likely than not and a reliable estimate was determinable. Subsequent measurements to the contingent consideration affected goodwill.
Transactions with non-controlling interests Non-controlling interests represent the equity in subsidiary companies not attributable, directly or indirectly, to owners of the Company, and are presented separately in the consolidated statement of comprehensive income, statement of changes in equity and within equity in the consolidated balance sheet, separately from equity attributable to owners of the Company.
A change in ownership interest in subsidiary companies that do not result in a change of control is accounted for as equity transactions. The carrying amounts of the controlling and non-controlling interests will be adjusted to reflect the changes in their relative interests in the subsidiary company. Any difference between the amount by which the non-controlling interests are adjusted and the fair value of the consideration paid or received will be recognised directly in equity and attributed to owners of the parent company.
In the Company's separate financial statements, investments in subsidiary companies are stated at cost less accumulated impairment losses.
A list of significant subsidiary companies is shown in Note 39.
2.3 Joint Arrangements A joint arrangement is a contractual arrangement whereby two or more parties have joint control. Joint control is the contractually agreed sharing of control of an arrangement, which exists only when decisions about the relevant activities require the unanimous consent of the parties sharing control.
A joint arrangement is classified either as joint operation or joint venture, based on the rights and obligations of the parties to the arrangement.
(a) Joint operations A joint operation is an arrangement which provides the Group with the rights to the assets and obligations for the liabilities relating to the arrangement.
The Group accounts for each of its assets, liabilities and transactions, including its share of those held or incurred jointly, in relation to the joint operation. The Group combines its share of each of the assets, liabilities, income and expenses of the joint operations with the similar items, line by line, in its consolidated financial statements.
(b) Joint venture companies A joint venture is an arrangement in which the Group has joint control, whereby the Group has rights to the net assets of the arrangement, rather than rights to its assets and obligations for its liabilities.
The Group recognises its interest in joint venture companies using equity method. The Group's investments in joint venture companies are recorded at cost and adjusted to recognise the Group's share of post-acquisition reserves of the joint venture companies and less accumulated impairment losses, if any.
Investments in joint venture companies include goodwill. When the Group’s share of losses in a joint venture company equals or exceeds its interest in the joint venture company, the Group does not recognise further losses, unless it has incurred obligations or made payments on behalf of the joint venture company.
The Group's share of the operating results and exceptional items of joint venture companies are shown separately in the profit statement. The Group’s share of other comprehensive income is recognised in other comprehensive income. Net assets of the joint venture companies are included in the consolidated financial statements under the equity method based on their latest audited financial statements except where their financial periods do not end on 30 September, then management accounts to 30 September are used.
The joint venture is equity accounted for until the date on which the Group ceases to have joint control over the joint venture.
In the Company’s separate financial statements, investments in joint venture companies are carried at cost less accumulated impairment losses.
A list of significant joint arrangements is shown in Note 39.
107Fra s e r a n d N ea v e , L i m i t e d & S u b s i d i a r y C o m pa n i e s A n n u a l R e p o r t 2 0 1 6

A n n u a l R e p o r t 2 0 1 6
F r a s e r a n d N e a v e , L i m i t e d & S u b s i d i a r y C o m p a n i e s
NOTES TO THE FINANCIAL STATEMENTSFor the year ended 30 September 2016
1 0 8
2. ACCOUNTING POLICIES (cont’d)
2.4 Associated Companies An associated company (not being a subsidiary company or joint venture company) is a company in which the Group exercises significant influence over the financial and operating policy decisions.
The Group's investments in associated companies are carried at cost and adjusted to recognise the Group's share of post-acquisition reserves of the associated companies, and less accumulated impairment losses, if any. Investments in associated companies include goodwill.
When the Group’s share of losses in an associated company equals or exceeds its interest in the associated company, the Group does not recognise further losses, unless it has incurred obligations or made payments on behalf of the associated company.
The Group's share of the operating results, exceptional items and fair value adjustment of investment properties of associated companies are shown separately in the profit statement. The Group’s share of other comprehensive income is recognised in other comprehensive income. Net assets of the associated companies are included in the consolidated financial statements under the equity method based on their latest audited financial statements except where their financial periods do not end on 30 September, then management accounts to 30 September are used.
An associated company is equity accounted for from the date the Group obtains significant influence until the date the Group ceases to have significant influence over the associated company. Upon loss of significant influence over the associated company, the Group measures the retained interest at fair value. Any difference between the fair value of the aggregate of the retained interest and proceeds from disposal and the carrying amount of the investment at the date the equity method was discontinued is recognised in the profit statement.
In the Company’s separate financial statements, investments in associated companies are carried at cost less accumulated impairment losses.
A list of significant associated companies is shown in Note 39.
2.5 Revenue Recognition
Sale of Goods Revenue from sale of goods is recognised upon the transfer of significant risk and rewards of ownership of the goods to the customer, which generally coincides with delivery and acceptance of the goods sold.
Revenue from sale of goods represents the invoiced value of net sales (including excise duties and net of trade discounts).
Sale of Services Service income is recognised upon rendering of services.
Others Rental income is recognised on a straight line basis over the lease term commencing on the date from which the lessee is entitled to exercise its right to use the leased asset.
Interest income is taken up on an accrual basis (using the effective interest method).
Dividend income is recognised when the Group’s right to receive payment is established.
Other categories of revenue are taken up on an accrual basis.
2.6 Provisions Provisions are recognised when the Group has a present obligation (legal or constructive) where, as a result of a past event, it is probable that an outflow of economic benefits will be required to settle the obligation and the amount of the obligation can be estimated reliably. Provisions are reviewed at each balance sheet date and adjusted to reflect the current best estimate. Where the effect of time value of money is material, the amount of the provision is the present value of the expenditure expected to be required to settle the obligation.
2.7 Taxation Tax on the profit or loss for the year comprises current and deferred tax. Tax is recognised in the profit statement except to the extent it relates to items recognised directly in equity, in which case it is recognised in equity or in other comprehensive income.
(a) Current tax Current tax assets and liabilities for the current and prior periods are measured at the amount expected to be recovered from or paid to the taxation authorities. The tax rates and tax laws used to compute the amount are those that are enacted or substantively enacted by the balance sheet date.
F r a s e r a n d N e a v e , L i m i t e d & S u b s i d i a r y C o m p a n i e s
NOTES TO THE FINANCIAL STATEMENTSFor the year ended 30 September 2016
A n n u a l R e p o r t 2 0 1 6 1 0 9
2. ACCOUNTING POLICIES (cont’d)
2.7 Taxation (cont’d)
(b) Deferred tax Deferred tax is recognised in respect of temporary differences arising between the tax bases of assets and liabilities and their carrying amounts in the financial statements. Temporary differences are not recognised for goodwill, the initial recognition of assets or liabilities that affects neither accounting nor taxable profit, and differences relating to investments in subsidiary, joint venture and associated companies to the extent that the timing of the reversal of the temporary difference can be controlled and it is probable that the temporary difference will not reverse in the foreseeable future.
Deferred tax assets are recognised for all deductible temporary differences to the extent that it is probable that future taxable profits will be available against which the deductible temporary differences can be utilised. The carrying amount of deferred tax assets is reviewed at each balance sheet date and reduced by the extent that it is no longer probable that sufficient taxable profits will be available to allow all or part of the deferred tax assets to be recovered.
Deferred tax assets and liabilities are measured at the tax rates that are expected to apply to the period when the asset is realised or the liability is settled, based on tax rates (and tax laws) that have been enacted at or substantively enacted at the balance sheet date.
Deferred tax assets and deferred tax liabilities are offset, if a legally enforceable right exists to set off current tax assets against current tax liabilities and the deferred taxes relate to the same taxable entity and the same taxation authority.
(c) Sales tax Revenues, expenses and assets are recognised net of the amount of sales tax except:
(i) Where the sales tax incurred on a purchase of assets or services is not recoverable from the taxation authority, in which case the sales tax is recognised as part of the cost of acquisition of the asset or as part of the expense item as applicable; and
(ii) Receivables and payables that are stated with the amount of sales tax included.
The net amount of sales tax recoverable from, or payable to, the taxation authority is included as part of receivables or payables in the balance sheet.
2.8 Fixed Assets Fixed assets are carried at cost less accumulated depreciation and accumulated impairment loss. The cost of an asset comprises its purchase price and any directly attributable costs of bringing the asset to working condition for its intended use. Dismantlement, removal or restoration costs are included as part of the cost of fixed assets if the obligation for dismantlement, removal or restoration is incurred as a consequence of acquiring or using the asset. Expenditure for additions, improvements and replacements are capitalised and expenditure for maintenance and repairs are charged to the profit statement. Subsequent expenditure relating to fixed assets that has already been recognised is added to the carrying amount of the asset when it is probable that future economic benefits in excess of standard of performance of the asset before the expenditure was made, will flow to the Group and the cost can be reliably measured, otherwise it is recognised as an expense during the financial year in which it is incurred. The carrying amount of the replaced parts is derecognised.
An asset is derecognised upon sale or retirement and any gain or loss on derecognition of the asset is included in the profit statement. Any amount in revaluation reserve relating to that asset is transferred to revenue reserve.
Depreciation is calculated on the straight-line method to write off the cost or valuation of fixed assets less residual value over their estimated useful lives. No depreciation is charged for freehold land and capital work-in-progress. The residual values, depreciation method and useful lives are reviewed and adjusted as appropriate at each balance sheet date. The annual depreciation rates applied to write down the fixed assets over their estimated useful lives are as follows:
Leasehold land - Lease term (ranging from 10 to 99 years) Building - Lease term (ranging from 10 to 60 years) Plant, machinery and equipment - 6.7% to 33% Motor vehicle and forklift - 10% to 20% Postmix and vending machine - 10% to 20% Furniture and fitting, computer equipment and beer cooler - 10% to 50%
Capital Work-in-Progress includes fixed assets under construction and advance payments and progress payments made for fixed assets and are not depreciated until each stage of development is completed and becomes operational.
The carrying amounts of fixed assets are reviewed for impairment when events or circumstances indicate that the carrying value may not be recoverable.
108 Fra s e r a n d N ea v e , L i m i t e d & S u b s i d i a r y C o m pa n i e sA n n u a l R e p o r t 2 0 1 6

F r a s e r a n d N e a v e , L i m i t e d & S u b s i d i a r y C o m p a n i e s
NOTES TO THE FINANCIAL STATEMENTSFor the year ended 30 September 2016
A n n u a l R e p o r t 2 0 1 6 1 0 9
2. ACCOUNTING POLICIES (cont’d)
2.7 Taxation (cont’d)
(b) Deferred tax Deferred tax is recognised in respect of temporary differences arising between the tax bases of assets and liabilities and their carrying amounts in the financial statements. Temporary differences are not recognised for goodwill, the initial recognition of assets or liabilities that affects neither accounting nor taxable profit, and differences relating to investments in subsidiary, joint venture and associated companies to the extent that the timing of the reversal of the temporary difference can be controlled and it is probable that the temporary difference will not reverse in the foreseeable future.
Deferred tax assets are recognised for all deductible temporary differences to the extent that it is probable that future taxable profits will be available against which the deductible temporary differences can be utilised. The carrying amount of deferred tax assets is reviewed at each balance sheet date and reduced by the extent that it is no longer probable that sufficient taxable profits will be available to allow all or part of the deferred tax assets to be recovered.
Deferred tax assets and liabilities are measured at the tax rates that are expected to apply to the period when the asset is realised or the liability is settled, based on tax rates (and tax laws) that have been enacted at or substantively enacted at the balance sheet date.
Deferred tax assets and deferred tax liabilities are offset, if a legally enforceable right exists to set off current tax assets against current tax liabilities and the deferred taxes relate to the same taxable entity and the same taxation authority.
(c) Sales tax Revenues, expenses and assets are recognised net of the amount of sales tax except:
(i) Where the sales tax incurred on a purchase of assets or services is not recoverable from the taxation authority, in which case the sales tax is recognised as part of the cost of acquisition of the asset or as part of the expense item as applicable; and
(ii) Receivables and payables that are stated with the amount of sales tax included.
The net amount of sales tax recoverable from, or payable to, the taxation authority is included as part of receivables or payables in the balance sheet.
2.8 Fixed Assets Fixed assets are carried at cost less accumulated depreciation and accumulated impairment loss. The cost of an asset comprises its purchase price and any directly attributable costs of bringing the asset to working condition for its intended use. Dismantlement, removal or restoration costs are included as part of the cost of fixed assets if the obligation for dismantlement, removal or restoration is incurred as a consequence of acquiring or using the asset. Expenditure for additions, improvements and replacements are capitalised and expenditure for maintenance and repairs are charged to the profit statement. Subsequent expenditure relating to fixed assets that has already been recognised is added to the carrying amount of the asset when it is probable that future economic benefits in excess of standard of performance of the asset before the expenditure was made, will flow to the Group and the cost can be reliably measured, otherwise it is recognised as an expense during the financial year in which it is incurred. The carrying amount of the replaced parts is derecognised.
An asset is derecognised upon sale or retirement and any gain or loss on derecognition of the asset is included in the profit statement. Any amount in revaluation reserve relating to that asset is transferred to revenue reserve.
Depreciation is calculated on the straight-line method to write off the cost or valuation of fixed assets less residual value over their estimated useful lives. No depreciation is charged for freehold land and capital work-in-progress. The residual values, depreciation method and useful lives are reviewed and adjusted as appropriate at each balance sheet date. The annual depreciation rates applied to write down the fixed assets over their estimated useful lives are as follows:
Leasehold land - Lease term (ranging from 10 to 99 years) Building - Lease term (ranging from 10 to 60 years) Plant, machinery and equipment - 6.7% to 33% Motor vehicle and forklift - 10% to 20% Postmix and vending machine - 10% to 20% Furniture and fitting, computer equipment and beer cooler - 10% to 50%
Capital Work-in-Progress includes fixed assets under construction and advance payments and progress payments made for fixed assets and are not depreciated until each stage of development is completed and becomes operational.
The carrying amounts of fixed assets are reviewed for impairment when events or circumstances indicate that the carrying value may not be recoverable.
109Fra s e r a n d N ea v e , L i m i t e d & S u b s i d i a r y C o m pa n i e s A n n u a l R e p o r t 2 0 1 6

A n n u a l R e p o r t 2 0 1 6
F r a s e r a n d N e a v e , L i m i t e d & S u b s i d i a r y C o m p a n i e s
NOTES TO THE FINANCIAL STATEMENTSFor the year ended 30 September 2016
1 1 0
2. ACCOUNTING POLICIES (cont’d)
2.9 Investment Properties Investment properties are properties that are held for long term rental yields and/or capital appreciation. Completed investment properties are initially recognised at cost, including transaction cost and subsequently measured at fair value, determined annually by independent professional valuers on balance sheet date. Changes in fair values are recognised in the profit statement in the year in which they arise.
Transfers are made to or from completed investment properties only when there is a change in use. For a transfer from completed investment property to owner-occupied property, the deemed cost for subsequent accounting is the fair value at the date of change in use. For a transfer from owner-occupied property to completed investment property, the property is accounted for in accordance with the accounting policy for fixed assets up to the date of change in use.
On disposal of a completed investment property, the difference between the disposal proceeds and the carrying amount is recognised in the profit statement.
2.10 Properties Held for Development Properties held for development are stated at cost less provision for foreseeable losses. The cost of properties held for development includes cost of land where no development activities have been carried out or where development activities are not expected to be completed within the normal operating cycle.
Allowance for foreseeable losses of properties held for development is made when it is anticipated that the net realisable value has fallen below cost.
Properties held for development are reclassified as property development costs at the point where the development activities have commenced and where it can be demonstrated that the development activities can be completed within the normal operating cycle.
2.11 Borrowing Costs Borrowing costs are generally expensed as incurred. However, borrowing costs that are directly attributable to acquisition and construction are capitalised as part of the cost of fixed assets and development properties. Capitalisation of borrowing costs commences when activities to prepare the assets are in progress until the asset is ready for its intended use. Borrowing costs capitalised in development properties are determined after netting off interest income earned from progress billings received and placed on fixed deposits.
2.12 Intangible Assets Intangible assets acquired separately are capitalised at cost. Intangible assets from a business acquisition are capitalised at fair value as at the date of acquisition. After initial recognition, an intangible asset is carried at cost less any accumulated amortisation and any accumulated impairment loss.
The useful lives of these intangible assets are assessed to be either finite or indefinite. Amortisation charged on finite intangible assets is taken to the profit statement as amortisation expense. Intangible assets with indefinite useful lives are subjected to impairment test annually or more frequently if events or changes in circumstances indicate that the carrying value might be impaired.
Internally generated goodwill and internally generated intangible assets arising from research are not capitalised and the expenditure is charged to the profit statement when it is incurred. Deferred development costs arising from deferred expenditure are recognised when the Group can demonstrate the technical feasibility of completing the intangible asset so that it will be available for use or sale, its intention to complete and its ability to use or sell the asset, how the asset will generate future economic benefits, the availability of resources to complete and the ability to measure reliably the expenditure during the development.
Intangible assets are tested for impairment annually or more frequently if events or changes in circumstances indicate that the carrying value might be impaired. Useful lives are also examined on an annual basis and adjustments, where applicable, are made on a prospective basis.
110 Fra s e r a n d N ea v e , L i m i t e d & S u b s i d i a r y C o m pa n i e sA n n u a l R e p o r t 2 0 1 6
F r a s e r a n d N e a v e , L i m i t e d & S u b s i d i a r y C o m p a n i e s
NOTES TO THE FINANCIAL STATEMENTSFor the year ended 30 September 2016
A n n u a l R e p o r t 2 0 1 6 1 1 1
2. ACCOUNTING POLICIES (cont’d)
2.12 Intangible Assets (cont’d) (a) Development costs of published products are expensed as incurred, except for development costs which can reasonably
be expected to be recovered from related future revenues.
The development costs are then amortised in accordance with their estimated economic useful lives, upon completion of published products as follows:
Directories Education General Reference 1st year 100% 33% 50% 33%2nd year - 33% 30% 27%3rd year - 34% 20% 20%4th year - - - 13%5th year - - - 7%
At each balance sheet date, the Group assesses whether there is any indication of impairment. If any such indication exists, the recoverable amount is estimated.
(b) Goodwill on acquisition is identified as being the excess of the sum of the fair value of the consideration transferred in the business combination, the amount of non-controlling interests in the acquiree, and the fair value of the Group’s previously held equity interest in the acquiree, over the net fair value of the acquiree’s identifiable assets and liabilities. In instances where the latter amount exceeds the former, the excess is recognised as a gain in the profit statement on the acquisition date.
Positive goodwill is carried at cost less any accumulated impairment loss. Goodwill is subjected to impairment test annually or more frequently if events or changes in circumstances indicate that the carrying value might be impaired.
Internally generated goodwill is not capitalised.
(c) Other intangible assets are amortised on a straight-line basis in accordance with their estimated economic useful lives as follows:
Intangibles assets Useful lives Imprints 20.0 yearsCo-publishing rights 4.6 yearsNon-contractual customers 10.0 yearsCustomer relationships 5.0 to 15.0 yearsPublishing rights 8.0 yearsLicensing rights 10.0 yearsSoftware 3.0 to 8.0 years
2.13 Brands Brands with finite lives are stated at cost less accumulated amortisation and accumulated impairment losses. They are assessed for impairment annually or whenever there is an indication of impairment. The useful life is also examined on an annual basis and an adjustment, where applicable, is made on a prospective basis. Amortisation is calculated to write off their cost over their estimated useful lives of up to 14 years on a straight-line method to the profit statement.
Brands with indefinite lives are stated at cost less any impairment loss. The useful life of the brand is estimated to be indefinite because based on the current market share of the brand, management believes there is no foreseeable limit to the period over which the brand is expected to generate net cash flows to the Group. The indefinite useful life is reviewed annually to determine whether it continues to be supportable. The brand is tested for impairment annually or more frequently when indicators of impairment are identified.
Internally generated brands are not capitalised and the expenditure is charged against profit in the year in which the expenditure is incurred.
2.14 Inventories All inventories are stated at the lower of cost and net realisable value. The net realisable value is the estimated selling price in the ordinary course of business, less the cost of completion and selling expenses.
Cost in respect of raw materials, consumable stores and goods purchased for resale is stated based on first-in-first-out, weighted average or standard cost (which approximates average actual cost). Cost in respect of manufactured inventories and work-in-progress includes attributable production overheads. Engineering spares and other inventories are valued on the weighted average cost basis less appropriate allowances for obsolete items.
111Fra s e r a n d N ea v e , L i m i t e d & S u b s i d i a r y C o m pa n i e s A n n u a l R e p o r t 2 0 1 6

A n n u a l R e p o r t 2 0 1 6
F r a s e r a n d N e a v e , L i m i t e d & S u b s i d i a r y C o m p a n i e s
NOTES TO THE FINANCIAL STATEMENTSFor the year ended 30 September 2016
1 1 2
2. ACCOUNTING POLICIES (cont’d)
2.15 Financial Assets
(a) Classification The classification of financial assets is determined at initial recognition. The Group classifies its investments in financial assets in the following categories:
(i) Financial assets at fair value through profit or loss Derivative financial instruments whose fair value is positive are classified as financial assets at fair value through profit or loss. The accounting policy for derivative financial instruments is included in Note 2.17.
(ii) Loans and receivables Loans and receivables are non-derivative financial assets with fixed or determinable payments that are not quoted in an active market. Loans and receivables comprise trade receivables, other receivables, cash and cash equivalents, amount due from related parties, subsidiary, joint venture and associated companies.
Cash and cash equivalents include cash on hand and in bank, deposits with financial institutions and bank overdrafts that are readily convertible to known amount of cash and which are subject to an insignificant risk of changes in value. For the purpose of the cash flow statement, pledged deposits (including fixed deposits held as profit guarantee) are excluded whilst bank overdrafts that are repayable on demand and that form an integral part of the Group’s cash management are included in cash and cash equivalents.
(iii) Available-for-sale financial assets Available-for-sale financial assets are non-derivatives that are either designated in this category or not classified in any of the other categories. They are included in non-current assets unless there is intention to dispose of the assets within 12 months after the balance sheet date. Available-for-sale financial assets comprise equity securities.
(b) Recognition and derecognition Financial assets are recognised on the balance sheet when, and only when, the Group becomes a party to the contractual provisions of the financial instrument.
Purchases and sales of investments are recognised on trade-date, the date on which the Group commits to purchase or sell the asset.
Financial assets are derecognised when the rights to receive cash flows from the financial assets have expired or when all risks and rewards of ownership have been substantially transferred. On derecognition of a financial asset in its entirety, the difference between the carrying amount and the sum of (a) the consideration received and (b) any cumulative gain or loss recognised directly in equity is recognised in the profit statement.
(c) Initial measurement Financial assets are initially recognised at fair value plus transaction costs except for financial assets at fair value through profit or loss, which are recognised at fair value.
(d) Subsequent measurement Available-for-sale financial assets and financial assets at fair value through profit or loss are subsequently carried at fair value. Loans and receivables are carried at amortised cost using the effective interest method, less any impairment losses.
Realised and unrealised gains and losses arising from changes in the fair value of the financial assets at fair value through profit or loss are included in the profit statement in the period in which they arise. Unrealised gains and losses arising from changes in the fair value of available-for-sale financial assets are recognised in other comprehensive income and accumulated under fair value adjustment reserve within equity.
When available-for-sale financial assets are sold or impaired, the accumulated fair value adjustments in the fair value adjustment reserve within equity will be released through the profit statement.
(e) Determination of fair value The fair value of quoted financial assets are based on current market prices. Unquoted investments that do not have quoted market prices in an active market nor methods of reasonably estimating the fair value, are carried at cost.
(f) Impairment
(i) Assets carried at amortised cost If there is objective evidence that an impairment loss on loans and receivables carried at amortised cost has been incurred, the amount of the loss is measured as the difference between the asset’s carrying amount and the present value of the estimated future cash flows discounted at the financial asset’s original effective interest rate. The carrying amount of the asset is reduced through the use of an allowance account and the amount of the loss is recognised in the profit statement.
112 Fra s e r a n d N ea v e , L i m i t e d & S u b s i d i a r y C o m pa n i e sA n n u a l R e p o r t 2 0 1 6

F r a s e r a n d N e a v e , L i m i t e d & S u b s i d i a r y C o m p a n i e s
NOTES TO THE FINANCIAL STATEMENTSFor the year ended 30 September 2016
A n n u a l R e p o r t 2 0 1 6 1 1 3
2. ACCOUNTING POLICIES (cont’d)
2.15 Financial Assets (cont’d)
(f) Impairment (cont’d)
(i) Assets carried at amortised cost (cont’d) When the asset becomes uncollectible, the carrying amount of impaired financial asset is reduced directly or if an amount was charged to the allowance account, the amounts charged to the allowance account are written off against the carrying value of the financial asset.
If, in a subsequent period, the amount of the impairment loss decreases and the decrease can be objectively related to an event occurring after the impairment was recognised, the previously recognised impairment loss is reversed. Any subsequent reversal of an impairment loss is recognised in the profit statement, to the extent that the carrying value of the asset does not exceed its amortised cost at the reversal date.
(ii) Assets carried at cost If there is objective evidence that an impairment loss on an unquoted equity instrument that is not carried at fair value because its fair value cannot be reliably measured, the amount of the loss is measured as the difference between the asset’s carrying amount and the present value of the estimated future cash flows discounted at the current market rate of return for a similar financial asset. Such impairment loss is not reversed in subsequent periods.
(iii) Available-for-sale financial assets The Group assesses at each balance sheet date whether there is objective evidence that a financial asset or a group of financial assets is impaired. In the case of equity investments classified as available-for-sale, a significant or prolonged decline in the fair value of the investment below its cost is considered in determining whether the investments are impaired. If any such evidence exists for available-for-sale financial assets, the cumulative loss, measured as the difference between the acquisition cost and the current fair value, less any impairment loss on that financial asset previously recognised in the profit statement is removed from the fair value adjustment reserve within equity and recognised in the profit statement. Impairment losses recognised in the profit statement on equity investments are not reversed through the profit statement, until the equity investments are disposed of.
(g) Offsetting of financial assets and financial liabilities Financial assets and financial liabilities are offset and the net amount is presented in the balance sheets, when and only when, there is a currently enforceable legal right to set off the recognised amounts and there is an intention to settle on a net basis, or to realise the assets and settle the liabilities simultaneously.
2.16 Financial Liabilities Financial liabilities are recognised on the balance sheet when, and only when, the Group becomes a party to the contractual provisions of the financial instrument. Financial liabilities are initially recognised at fair value of consideration received less directly attributable transaction costs and subsequently measured at amortised cost using the effective interest method.
Gains and losses are recognised in the profit statement when the liabilities are derecognised as well as through the amortisation process. A financial liability is derecognised when the obligation under the liability is discharged or cancelled or expires.
The Group classifies non-derivative financial liabilities into the other financial liabilities category. Other financial liabilities comprise trade payables, other payables, amounts due to subsidiary, joint venture, associated companies and related parties, borrowings and bank overdrafts.
2.17 Derivative Financial Instruments The Company and the Group use derivative financial instruments to hedge against risks associated with foreign currency and interest rate fluctuations. Foreign exchange forward contracts are used to hedge its risks associated primarily with foreign currency fluctuations. Interest rate swap contracts are used to hedge its risks associated with interest rate fluctuations. It is the Group’s policy not to trade in derivative financial instruments.
Derivatives are initially recognised at fair value on the date a derivative contract is entered into and are subsequently re-measured at their fair value. The changes in fair value of any derivative instrument that do not qualify for hedge accounting are recognised directly in the profit statement.
The fair value of forward foreign currency contracts is calculated by reference to current forward foreign exchange rates for contracts with similar maturity profiles. The fair value of interest rate swap contracts is determined by reference to market values for similar instruments.
Derivative instruments that qualify for hedge accounting are classified either as cash flow hedge or fair value hedge.
113Fra s e r a n d N ea v e , L i m i t e d & S u b s i d i a r y C o m pa n i e s A n n u a l R e p o r t 2 0 1 6

A n n u a l R e p o r t 2 0 1 6
F r a s e r a n d N e a v e , L i m i t e d & S u b s i d i a r y C o m p a n i e s
NOTES TO THE FINANCIAL STATEMENTSFor the year ended 30 September 2016
1 1 4
2. ACCOUNTING POLICIES (cont’d)
2.17 Derivative Financial Instruments (cont’d) At the inception of a hedge relationship, the Group formally designates and documents the hedge relationship to which the Group wishes to apply hedge accounting and the risk management objective and strategy for undertaking the hedge. The documentation includes identification of the hedging instrument, the hedge item or transaction, the nature of the risk being hedged and how the entity will assess the hedging instrument’s effectiveness in offsetting the exposure to changes in the hedged item’s fair value or cash flows attributable to the hedged risk. Such hedges are assessed on an ongoing basis to determine that they actually have been highly effective throughout the financial reporting periods for which they were designated.
Hedges which meet the criteria for hedge accounting are accounted for as cash flow hedges.
Cash flow hedges are hedges of the exposure to the variability of cash flow that is attributable to a particular risk associated with a recognised asset or liability that could affect the profit statement.
For cash flow hedges, the effective portion of the gain or loss on the hedging instrument is recognised directly in hedging reserve within equity, while the ineffective portion is recognised in the profit statement.
Amounts taken to hedging reserve are transferred to the profit statement when the hedged transaction affects the profit statement, such as when the hedged financial income or financial expense is recognised or when a forecast sale or purchase occurs. When the hedged item is the cost of a non-financial asset or liability, the amounts taken to hedging reserve are transferred to the initial carrying amount of the non-financial asset or liability.
If the forecast transaction is no longer expected to occur, amounts previously recognised in hedging reserve are transferred to the profit statement. If the hedging instrument expires or is sold, terminated, or exercised without replacement or rollover, or if its designation as a hedge is revoked, amounts previously recognised in hedging reserve remain in hedging reserve until the forecast transaction occurs. If the related transaction is not expected to occur, the amount is taken to the profit statement.
2.18 Impairment of Non-Financial Assets The carrying amounts of the Group's assets are reviewed at each reporting date or when annual impairment testing is required, to determine whether there is any indication of impairment. For the purpose of impairment testing, the recoverable amount (i.e. the higher of the fair value less cost of disposal and the value-in-use) is determined on an individual asset basis unless the asset does not generate cash flows that are largely independent of those from other assets. If this is the case, the recoverable amount is determined for the cash generating units (“CGU”) to which the asset belongs. In assessing value-in-use, the estimated future cash flows are discounted to their present value using a pre-tax discount rate that reflects current market assessments of the time value of money and the risks specific to the asset. An impairment loss is recognised whenever the carrying amount of an asset or CGU exceeds its recoverable amount. In determining fair value less costs of disposal, recent market transactions are taken into account, if available. If no such transactions can be identified, an appropriate valuation model is used.
Reversal of impairment losses previously recognised is recorded when the decrease in impairment loss can be objectively related to an event occurring after the write down. The carrying amount is increased to its revised recoverable amount, provided that this amount does not exceed the carrying amount that would have been determined (net of any accumulated amortisation or depreciation) had no impairment loss been recognised for the asset in prior years.
A reversal of impairment loss is recognised in the profit statement. Impairment loss on goodwill is not reversed in a subsequent period.
2.19 Discontinued Operations and Assets and Liabilities Held for Sale A component of the Group is classified as a discontinued operation when the criteria to be classified as held-for-sale have been met or it has been disposed of and such a component represents a separate major line of business or geographical area of operations, is part of a single co-ordinated major line of business or geographical area of operations. A component is deemed to be held for sale if its carrying amount will be recovered principally through a sale transaction rather than through continuing use. This condition is regarded as met only when the sale is highly probable and the asset or component is available for immediate sale in its present condition.
Immediately before the initial classification of the asset (or disposal group) as held for sale, the carrying amounts of the assets (or all the assets and liabilities in the group) are measured in accordance with the applicable FRSs. Upon classification as held for sale, non-current assets and disposal groups are not depreciated and are measured at the lower of carrying amount and fair value less costs to sell. Any differences are recognised in the profit statement.
Any impairment loss on initial classification and subsequent measurement is recognised as expense. Any subsequent increase in fair value less costs to sell (not exceeding the accumulated impairment loss that has been previously recognised) is recognised in the profit statement.
In the profit statement of the current reporting period, and of the comparative period, all income and expenses from discontinued operations are reported separately from income and expenses from continuing activities.
114 Fra s e r a n d N ea v e , L i m i t e d & S u b s i d i a r y C o m pa n i e sA n n u a l R e p o r t 2 0 1 6

F r a s e r a n d N e a v e , L i m i t e d & S u b s i d i a r y C o m p a n i e s
NOTES TO THE FINANCIAL STATEMENTSFor the year ended 30 September 2016
A n n u a l R e p o r t 2 0 1 6 1 1 5
2. ACCOUNTING POLICIES (cont’d)
2.20 Treasury Shares The Group’s own equity instruments, which are reacquired (treasury shares) are recognised at cost and deducted from equity. No gain or loss is recognised in profit statement on the purchase, sale, issue or cancellation of the Group’s own equity instruments. Any difference between the carrying amount of treasury shares and the consideration received, if reissued, is recognised directly in equity. Voting rights related to treasury shares are nullified for the Group and no dividends are allocated to them respectively.
2.21 Employee Benefits
(a) Retirement Benefits Provision for retirement benefits is made in accordance with:
(i) the terms of agreements concluded with various categories of employees, or
(ii) pension and retirement benefit schemes, or
(iii) defined contribution plans under statutory regulations in the country, where applicable.
Retirement Benefits in accordance with agreements The provisions represent the present value of the amounts likely to become payable in respect of services already rendered. An independent actuarial calculation of the provision is made every three years. Internal calculation of the provision is made each intervening year on the same basis as those used for the independent actuarial calculation.
Pension and Retirement Benefit Schemes The cost of providing benefits under the defined benefits plans are determined by the project unit credit method. The liability recognised in the balance sheet is the present value of the defined benefit obligation at the reporting date less the fair value of plan assets, together with adjustments for unrecognised past-service costs. The present value of the defined benefit obligation is determined by discounting the estimated future cash outflows using market yields of high quality bonds that are denominated in the currency in which the benefits will be paid and have tenures approximating that of the related post-employment benefit obligations. Actuarial gains and losses arising from experience adjustments and changes in actuarial assumptions are charged or credited to equity in other comprehensive income in the period when they arise.
Past service costs are recognised immediately in the profit statement.
Defined contribution plans under statutory regulations Obligations for contributions to defined contribution plans are recognised as an expense in the profit statement as incurred.
(b) Equity Compensation Plans Employees of the Group receive remuneration in the form of share options and share awards as consideration for services rendered.
Equity-settled transactions The fair value of the employee services received in exchange for the grant of the options or awards is recognised as an expense in the profit statement with a corresponding increase in the employee share-based payment reserve over the vesting period. The total amount to be recognised over the vesting period is determined by reference to the fair value of the options or awards on the date of grant. Non-market vesting conditions are included in assumptions about the number of options that are expected to become exercisable on vesting date. At each balance sheet date, the entity revises its estimates of the number of options that are expected to become exercisable on the vesting date. It recognises the impact of the revision of original estimates, if any, in the profit statement, and a corresponding adjustment to equity over the remaining vesting period.
When the options are exercised and new ordinary shares issued, the proceeds received (net of any directly attributable transaction costs) and the corresponding share-based payment reserve is credited to share capital. For certain listed subsidiary companies which have treasury shares, the proceeds received (net of any directly attributable transaction costs) and the corresponding share option reserve is credited to the ‘treasury share’ account when treasury shares purchased are re-issued to the employees.
(c) Accrued Annual Leave Employee entitlements to annual leave are recognised when they accrue to employees. A provision is made for the estimated liability for employee entitlements to annual leave as a result of services rendered by employees up to the balance sheet date.
115Fra s e r a n d N ea v e , L i m i t e d & S u b s i d i a r y C o m pa n i e s A n n u a l R e p o r t 2 0 1 6

A n n u a l R e p o r t 2 0 1 6
F r a s e r a n d N e a v e , L i m i t e d & S u b s i d i a r y C o m p a n i e s
NOTES TO THE FINANCIAL STATEMENTS For the year ended 30 September 2016
1 1 6
2. ACCOUNTING POLICIES (cont’d)
2.22 Leases
(a) Lessee A finance lease which effectively transfers to the Group substantially all the risks and benefits incidental to ownership of the leased item is capitalised at the lower of the fair value of the leased item and the present value of the minimum lease payments at the inception of the lease term and disclosed as fixed asset. Lease payments are apportioned between the finance charges and reduction of the lease liability so as to achieve a constant rate of interest on the remaining balance of the liability. Finance charges are charged directly to the profit statement. Contingent rents, if any, are expensed in the periods in which they are incurred.
A lease where the lessor effectively retains substantially all the risks and benefits of ownership of the leased item is classified as an operating lease. Operating lease payments are recognised as an expense in the profit statement on a straight-line basis over the lease term.
(b) Lessor A lease whereby the lessor effectively retains substantially all the risks and benefits of ownership of the leased item is classified as an operating lease. Properties leased out under operating leases are included in investment properties and are stated at revalued amounts and not depreciated. Rental income (net of any incentives given to lessees) is recognised on a straight-line basis over the lease term. Contingent rents, if any, are recorded as income in the periods in which they are earned.
2.23 Government Grants Government grants are recognised at their fair value where there is reasonable assurance that the grant will be received and all attaching conditions will be complied with. When the grant relates to an expense item, it is recognised in the profit statement over the period necessary to match them on a systematic basis to the costs that it is intended to compensate. Where the grant relates to an asset, the fair value is recognised as deferred capital grant and is amortised to the profit statement over the expected useful life of the relevant asset by equal annual installments.
2.24 Exceptional Items Exceptional items are items of income and expense of such size, nature or incidence that their disclosure is relevant to explain the performance of the Group for the year.
2.25 Contingencies A contingent liability is:
(a) a possible obligation that arises from past events and whose existence will be confirmed only by the occurrence or non-occurrence of one or more uncertain future events not wholly within the control of the Group and the Company; or
(b) a present obligation that arises from past events but is not recognised because it is not probable that an outflow of resources embodying economic benefits will be required to settle the obligation or the amount of obligation cannot be measured with sufficient reliability.
Contingent liabilities are not recognised on the balance sheet of the Group and the Company, except for contingent liabilities assumed in a business combination that are present obligations and which the fair values can be reliably determined.
2.26 Functional and Foreign Currencies
(a) Functional currency The currency of the primary economic environment in which the Company operates (“the functional currency”) is Singapore Dollar. The consolidated financial statements are presented in Singapore Dollar, which is the Company’s functional and presentation currency.
(b) Foreign currency transactions Foreign currency transactions are recorded in the functional currencies of the Company and the respective subsidiary companies at rates of exchange approximating those ruling at transaction date. Foreign currency monetary assets and liabilities at the balance sheet date are translated at the rates ruling at that date. Exchange differences are dealt with in the profit statement except where exchange differences arise on foreign currency monetary items that in substance form part of the Group's net investment in the foreign entity. These exchange differences are taken to exchange reserve as a separate component of the shareholders' funds until the disposal of the net investment at which time they are recognised in the profit statement.
116 Fra s e r a n d N ea v e , L i m i t e d & S u b s i d i a r y C o m pa n i e sA n n u a l R e p o r t 2 0 1 6

F r a s e r a n d N e a v e , L i m i t e d & S u b s i d i a r y C o m p a n i e s
NOTES TO THE FINANCIAL STATEMENTSFor the year ended 30 September 2016
A n n u a l R e p o r t 2 0 1 6 1 1 7
2. ACCOUNTING POLICIES (cont’d)
2.26 Functional and Foreign Currencies (cont’d)
(b) Foreign currency transactions (cont’d) Non-monetary items that are measured in terms of historical cost in a foreign currency are translated using the exchange rates as at the dates of initial transactions. Non-monetary items measured at fair value in a foreign currency are translated using exchange rates at the date when the fair value was determined. Currency translation differences on equity investments held at fair value through profit or loss, are reported as part of the fair value gain or loss. Currency translation differences on equity investments classified as available-for-sale financial assets, are included in the fair value adjustment reserve within equity.
Currency translation differences arising from events which are treated as exceptional are dealt with as exceptional items in the profit statement.
(c) Foreign currency translations The results and financial position of all the Group entities that have a functional currency different from the presentation currency are translated into the presentation currency as follows:
(i) profit statement items are translated into presentation currency at exchange rates ruling at the dates of the transactions;
(ii) assets and liabilities are translated into presentation currency at exchange rates ruling at the balance sheet date; and
(iii) exchange differences arising from translation of foreign subsidiary, joint venture and associated companies are recognised in other comprehensive income under exchange reserve as a separate component of the shareholders' funds.
On disposal of a foreign operation, the cumulative amount of exchange differences deferred in shareholders’ funds relating to that foreign operation is recognised in the profit statement as a component of the gain or loss on disposal.
In the case of a partial disposal without loss of control of a subsidiary company that includes a foreign operation, the proportionate share of the cumulative amount of the exchange differences are re-attributed to non-controlling interest and are not recognised in profit statement. For partial disposals of associated or joint venture companies that are foreign operations, the proportionate share of the accumulated exchange differences is reclassified to profit statement.
2.27 Significant Accounting Estimates and Judgements Estimates and assumptions concerning the future are made in the preparation of the financial statements. They affect the application of the Group’s accounting policies, reported amounts of assets, liabilities, income and expenses, and disclosures made. They are assessed on an ongoing basis and are based on experience and relevant factors, including expectations of future events that are believed to be reasonable under the circumstances.
(a) Key sources of estimation uncertainty The key assumptions concerning the future and other key sources of estimation uncertainty at the balance sheet date are discussed below.
(i) Impairment of non-financial and financial assets
Goodwill and brands Goodwill and brands are tested for impairment at least on an annual basis. This requires an estimation of the value-in-use of the cash-generating units to which the goodwill and brands are allocated. Estimating the value-in-use requires the Group to make an estimate of the expected future cash flows from the cash-generating unit and also to choose a suitable discount rate in order to calculate the present value of those cash flows. The carrying amount of the goodwill and brands at balance sheet date is disclosed in Note 18 and Note 22.
Investment in joint venture and associated companies The Group assesses at each reporting date whether there is any objective evidence that investment in joint venture and associated companies are impaired. Where there is objective evidence of impairment, the recoverable amount is estimated based on the higher of the value-in-use and the fair value less costs to sell. Estimating the value-in-use requires the Group to make an estimate of the expected future cash flows to be generated by the joint venture and associated companies and also to choose a suitable discount rate in order to calculate the present value of those cash flows which reflects the risk profile of the investee and economic assumptions regarding the industry and geographical jurisdiction in which the investee operates. Changes in assumptions about these factors could affect the recoverable amount of the investee. The carrying amount of the investment in joint venture and associated companies at balance sheet date have been disclosed in the balance sheet.
117Fra s e r a n d N ea v e , L i m i t e d & S u b s i d i a r y C o m pa n i e s A n n u a l R e p o r t 2 0 1 6

A n n u a l R e p o r t 2 0 1 6
F r a s e r a n d N e a v e , L i m i t e d & S u b s i d i a r y C o m p a n i e s
NOTES TO THE FINANCIAL STATEMENTS For the year ended 30 September 2016
1 1 8
2. ACCOUNTING POLICIES (cont’d)
2.27 Significant Accounting Estimates and Judgements (cont’d)
(a) Key sources of estimation uncertainty (cont’d)
(i) Impairment of non-financial and financial assets (cont’d)
Investment in available-for-sale financial assets The Group assesses at each balance sheet date whether there is any objective evidence that any available-for-sale financial asset is impaired. To determine whether there is objective evidence of impairment, the Group considers factors such as the market condition and whether there is a significant or prolonged decline in the values of these financial assets.
Where there is objective evidence of impairment for quoted available-for-sale financial assets, the difference between the cost and current fair value is recognised as impairment loss. Where there is objective evidence of impairment for unquoted available-for-sale financial assets, the recoverable value is estimated based on the amount and timing of the future cash flows. The carrying amount of the investment in available-for-sale financial assets at balance sheet date is disclosed in Note 20.
Loans and receivables The Group assesses at each balance sheet date whether there is any objective evidence that a loan or receivable is impaired. To determine whether there is objective evidence of impairment, the Group considers factors such as the probability of insolvency or significant financial difficulties of the debtor and default or significant delay in payments.
Where there is objective evidence of impairment, the amount and timing of future cash flows are estimated based on historical loss experience for assets with similar credit risk characteristics. The carrying amount of the loans and receivables at balance sheet date is disclosed in Note 35(g).
(ii) Taxes The Group has exposure to taxes in numerous jurisdictions. Significant judgment is involved in determining the provision for taxes. There are certain transactions and computations for which the ultimate tax determination is uncertain during the ordinary course of business. The Group recognises liabilities for expected tax issues based on estimates of whether additional taxes will be due. Where the final tax outcome of these matters is different from the amounts that were initially recognised, such differences will impact the tax and deferred tax provisions in the period in which such determination is made. The carrying amounts of taxation and deferred taxation at balance sheet date are disclosed in the balance sheet.
(iii) Depreciation of fixed assets Fixed assets are depreciated on a straight-line basis over their estimated useful lives. Management estimates the useful lives of these fixed assets to be within 2 to 99 years. Changes in the expected level of usage and technological developments could impact the economic useful lives and the residual values of these assets, therefore future depreciation charges could be revised. The carrying amount of the fixed assets at balance sheet date is disclosed in the balance sheet.
(b) Critical judgements made in applying accounting policies Management is of the opinion that the instances of application of judgement are not expected to have a significant effect on the amounts recognised in the financial statements, apart from those involving estimates.
3. REVENUE
THE GROUP 2016
($'000) 2015
($'000) Sale of goods 1,857,353 1,968,340Sale of services 109,995 138,064Others 11,274 14,706Total revenue 1,978,622 2,121,110
F r a s e r a n d N e a v e , L i m i t e d & S u b s i d i a r y C o m p a n i e s
NOTES TO THE FINANCIAL STATEMENTSFor the year ended 30 September 2016
A n n u a l R e p o r t 2 0 1 6 1 1 9
4. PROFIT BEFORE TAXATION AND EXCEPTIONAL ITEMS
THE GROUP
2016 ($'000)
2015 ($'000)
8B(a) Included in other income (net):
Exchange gain 5,087 4,308Management fee income from a related party - 1,245Loss on disposal of fixed assets (239) (462)(Loss)/Gain on disposal of derivatives (2,231) 13Fair value gain on derivatives 299 2,425Recovery of withholding tax 2,805 -
9B(b) Net finance income:
Finance income Interest income from bank and other deposits 12,859 4,434Others 1,920 2,045
14,779 6,479Finance expense
Interest expense from bank and other borrowings (4,912) (6,183)Others (57) (117)
(4,969) (6,300) 9,810 179 10B(c) Profit before taxation and exceptional items have been arrived
at after charging: Depreciation of fixed assets 46,804 67,246Impairment of fixed assets 890 11,140Impairment of other investments 25 32Impairment of brands - 2,182Impairment of intangible assets 162 4,360Amortisation of brands 135 135Amortisation of intangible assets 14,808 16,310Intangible assets written off 6 -Fixed assets written off 424 638Bad debts written off 147 20Allowance for bad and doubtful trade debts 1,200 2,953Allowance for inventory obsolescence 11,280 10,408Directors of the Company:
Fee 651 645Remuneration of members of Board committees 495 593Adviser fees and allowances 1,929 1,856
Key executive officers: Remuneration 5,532 6,030Provident Fund contribution 86 89Employee share-based expense 621 855
Staff costs (exclude directors and key executives) 250,609 248,872Employee share-based expense (exclude directors and key executives) 5,436 6,080Defined contribution plans (exclude directors and key executives) 22,190 23,473Defined benefit plans 1,526 1,498Auditors' remuneration:
Auditor of the Company 611 859Member firms of the Auditor of the Company 615 841Other auditors 14 104
Professional fees paid to: Auditor of the Company 6 71Member firms of the Auditor of the Company 80 235Other auditors 192 78
and crediting: Write back of defined benefit plans 140 342Write back of allowance for bad and doubtful trade debts 937 494Write back of allowance for inventory obsolescence 2,076 1,191Reversal of impairment of fixed assets 464 1,039
118 Fra s e r a n d N ea v e , L i m i t e d & S u b s i d i a r y C o m pa n i e sA n n u a l R e p o r t 2 0 1 6

A n n u a l R e p o r t 2 0 1 6
F r a s e r a n d N e a v e , L i m i t e d & S u b s i d i a r y C o m p a n i e s
NOTES TO THE FINANCIAL STATEMENTS For the year ended 30 September 2016
1 1 8
2. ACCOUNTING POLICIES (cont’d)
2.27 Significant Accounting Estimates and Judgements (cont’d)
(a) Key sources of estimation uncertainty (cont’d)
(i) Impairment of non-financial and financial assets (cont’d)
Investment in available-for-sale financial assets The Group assesses at each balance sheet date whether there is any objective evidence that any available-for-sale financial asset is impaired. To determine whether there is objective evidence of impairment, the Group considers factors such as the market condition and whether there is a significant or prolonged decline in the values of these financial assets.
Where there is objective evidence of impairment for quoted available-for-sale financial assets, the difference between the cost and current fair value is recognised as impairment loss. Where there is objective evidence of impairment for unquoted available-for-sale financial assets, the recoverable value is estimated based on the amount and timing of the future cash flows. The carrying amount of the investment in available-for-sale financial assets at balance sheet date is disclosed in Note 20.
Loans and receivables The Group assesses at each balance sheet date whether there is any objective evidence that a loan or receivable is impaired. To determine whether there is objective evidence of impairment, the Group considers factors such as the probability of insolvency or significant financial difficulties of the debtor and default or significant delay in payments.
Where there is objective evidence of impairment, the amount and timing of future cash flows are estimated based on historical loss experience for assets with similar credit risk characteristics. The carrying amount of the loans and receivables at balance sheet date is disclosed in Note 35(g).
(ii) Taxes The Group has exposure to taxes in numerous jurisdictions. Significant judgment is involved in determining the provision for taxes. There are certain transactions and computations for which the ultimate tax determination is uncertain during the ordinary course of business. The Group recognises liabilities for expected tax issues based on estimates of whether additional taxes will be due. Where the final tax outcome of these matters is different from the amounts that were initially recognised, such differences will impact the tax and deferred tax provisions in the period in which such determination is made. The carrying amounts of taxation and deferred taxation at balance sheet date are disclosed in the balance sheet.
(iii) Depreciation of fixed assets Fixed assets are depreciated on a straight-line basis over their estimated useful lives. Management estimates the useful lives of these fixed assets to be within 2 to 99 years. Changes in the expected level of usage and technological developments could impact the economic useful lives and the residual values of these assets, therefore future depreciation charges could be revised. The carrying amount of the fixed assets at balance sheet date is disclosed in the balance sheet.
(b) Critical judgements made in applying accounting policies Management is of the opinion that the instances of application of judgement are not expected to have a significant effect on the amounts recognised in the financial statements, apart from those involving estimates.
3. REVENUE
THE GROUP 2016
($'000) 2015
($'000) Sale of goods 1,857,353 1,968,340Sale of services 109,995 138,064Others 11,274 14,706Total revenue 1,978,622 2,121,110
F r a s e r a n d N e a v e , L i m i t e d & S u b s i d i a r y C o m p a n i e s
NOTES TO THE FINANCIAL STATEMENTSFor the year ended 30 September 2016
A n n u a l R e p o r t 2 0 1 6 1 1 9
4. PROFIT BEFORE TAXATION AND EXCEPTIONAL ITEMS
THE GROUP
2016 ($'000)
2015 ($'000)
8B(a) Included in other income (net):
Exchange gain 5,087 4,308Management fee income from a related party - 1,245Loss on disposal of fixed assets (239) (462)(Loss)/Gain on disposal of derivatives (2,231) 13Fair value gain on derivatives 299 2,425Recovery of withholding tax 2,805 -
9B(b) Net finance income:
Finance income Interest income from bank and other deposits 12,859 4,434Others 1,920 2,045
14,779 6,479Finance expense
Interest expense from bank and other borrowings (4,912) (6,183)Others (57) (117)
(4,969) (6,300) 9,810 179 10B(c) Profit before taxation and exceptional items have been arrived
at after charging: Depreciation of fixed assets 46,804 67,246Impairment of fixed assets 890 11,140Impairment of other investments 25 32Impairment of brands - 2,182Impairment of intangible assets 162 4,360Amortisation of brands 135 135Amortisation of intangible assets 14,808 16,310Intangible assets written off 6 -Fixed assets written off 424 638Bad debts written off 147 20Allowance for bad and doubtful trade debts 1,200 2,953Allowance for inventory obsolescence 11,280 10,408Directors of the Company:
Fee 651 645Remuneration of members of Board committees 495 593Adviser fees and allowances 1,929 1,856
Key executive officers: Remuneration 5,532 6,030Provident Fund contribution 86 89Employee share-based expense 621 855
Staff costs (exclude directors and key executives) 250,609 248,872Employee share-based expense (exclude directors and key executives) 5,436 6,080Defined contribution plans (exclude directors and key executives) 22,190 23,473Defined benefit plans 1,526 1,498Auditors' remuneration:
Auditor of the Company 611 859Member firms of the Auditor of the Company 615 841Other auditors 14 104
Professional fees paid to: Auditor of the Company 6 71Member firms of the Auditor of the Company 80 235Other auditors 192 78
and crediting: Write back of defined benefit plans 140 342Write back of allowance for bad and doubtful trade debts 937 494Write back of allowance for inventory obsolescence 2,076 1,191Reversal of impairment of fixed assets 464 1,039
119Fra s e r a n d N ea v e , L i m i t e d & S u b s i d i a r y C o m pa n i e s A n n u a l R e p o r t 2 0 1 6

A n n u a l R e p o r t 2 0 1 6
F r a s e r a n d N e a v e , L i m i t e d & S u b s i d i a r y C o m p a n i e s
NOTES TO THE FINANCIAL STATEMENTS For the year ended 30 September 2016
1 2 0
5. SEGMENT INFORMATION The Group's operating businesses are organised and managed separately according to the nature of activities. The Group's operating segments are namely beverages, dairies, printing and publishing and others. The Group operates in the following key geographical areas, namely Singapore, Malaysia, Other ASEAN, North/South Asia and certain countries outside Asia.
Year ended 30 September 2016
The following table presents financial information regarding operating segments:
Operating Segment Beverages
($'000)Dairies($'000)
Printing &Publishing
($'000)Others ($'000)
Elimination ($'000)
PerConsolidated
Financial Statements
($'000) Revenue - external 571,697 1,098,960 307,592 373 - 1,978,622Revenue - inter-segment 32,660 16,656 95 141,144 (190,555) -Total revenue 604,357 1,115,616 307,687 141,517 (190,555) 1,978,622
Subsidiary companies 22,967 118,678 (5,127) 39,987 - 176,505Joint venture and associated companies - - (76) 2,722 - 2,646PBIT 22,967 118,678 (5,203) 42,709 - 179,151
Finance income 14,779Finance cost (4,969)Profit before fair value adjustment,
taxation and exceptional items 188,961Fair value adjustment of investment properties (1,532)Exceptional items 735Profit before taxation 188,164Taxation (22,506)Profit after taxation 165,658Non-controlling interests (57,562)Attributable profit 108,096
Assets 366,585 525,387 276,054 1,457,036 - 2,625,062Investments in joint venture and associated companies - - 17,054 71,960 - 89,014Tax assets 13,267Bank deposits & cash balances 1,045,529Total assets 3,772,872
Liabilities 101,274 184,295 86,617 60,725 432,911Tax liabilities 50,369Borrowings 137,048Total liabilities 620,328
Other segment information: Capital expenditure 34,747 20,269 18,277 3,065 - 76,358Depreciation and amortisation 18,415 20,081 20,320 2,931 - 61,747Impairment losses 342 548 187 - - 1,077Reversal of impairment losses (188) (276) - - - (464)Attributable profit/(loss) before fair value adjustment
and exceptional items 5,384 59,159 (6,033) 50,453 - 108,963Fair value adjustment of investment properties - - (1,568) 20 - (1,548)Exceptional items 388 (66) (144) 503 - 681Attributable profit/(loss) 5,772 59,093 (7,745) 50,976 - 108,096
The following information are based on the geographical location of the Group's customers, which are essentially in the same location as the business operation and are as follows:
Geographical Information Singapore
($'000)Malaysia
($'000)
OtherASEAN($'000)
North/ South
Asia ($'000)
Outside Asia
($'000)
PerConsolidated
FinancialStatements
($'000) Total revenue 473,075 855,812 563,732 79,888 6,115 1,978,622PBIT (10,993) 80,440 113,778 (1,820) (2,254) 179,151Non-current assets 122,294 390,321 1,468,464 55,502 4,576 2,041,157Investments in joint venture and associated companies - 71,960 - - 17,054 89,014Current assets 170,511 245,147 126,737 39,359 2,151 583,905Capital expenditure 18,337 37,037 15,858 5,098 28 76,358
Other ASEAN: Myanmar, Thailand, Vietnam and Indonesia North/South Asia: China and India Outside Asia: Australia, Europe and USA
120 Fra s e r a n d N ea v e , L i m i t e d & S u b s i d i a r y C o m pa n i e sA n n u a l R e p o r t 2 0 1 6

A n n u a l R e p o r t 2 0 1 6
F r a s e r a n d N e a v e , L i m i t e d & S u b s i d i a r y C o m p a n i e s
NOTES TO THE FINANCIAL STATEMENTS For the year ended 30 September 2016
1 2 0
5. SEGMENT INFORMATION The Group's operating businesses are organised and managed separately according to the nature of activities. The Group's operating segments are namely beverages, dairies, printing and publishing and others. The Group operates in the following key geographical areas, namely Singapore, Malaysia, Other ASEAN, North/South Asia and certain countries outside Asia.
Year ended 30 September 2016
The following table presents financial information regarding operating segments:
Operating Segment Beverages
($'000)Dairies($'000)
Printing &Publishing
($'000)Others ($'000)
Elimination ($'000)
PerConsolidated
Financial Statements
($'000) Revenue - external 571,697 1,098,960 307,592 373 - 1,978,622Revenue - inter-segment 32,660 16,656 95 141,144 (190,555) -Total revenue 604,357 1,115,616 307,687 141,517 (190,555) 1,978,622
Subsidiary companies 22,967 118,678 (5,127) 39,987 - 176,505Joint venture and associated companies - - (76) 2,722 - 2,646PBIT 22,967 118,678 (5,203) 42,709 - 179,151
Finance income 14,779Finance cost (4,969)Profit before fair value adjustment,
taxation and exceptional items 188,961Fair value adjustment of investment properties (1,532)Exceptional items 735Profit before taxation 188,164Taxation (22,506)Profit after taxation 165,658Non-controlling interests (57,562)Attributable profit 108,096
Assets 366,585 525,387 276,054 1,457,036 - 2,625,062Investments in joint venture and associated companies - - 17,054 71,960 - 89,014Tax assets 13,267Bank deposits & cash balances 1,045,529Total assets 3,772,872
Liabilities 101,274 184,295 86,617 60,725 432,911Tax liabilities 50,369Borrowings 137,048Total liabilities 620,328
Other segment information: Capital expenditure 34,747 20,269 18,277 3,065 - 76,358Depreciation and amortisation 18,415 20,081 20,320 2,931 - 61,747Impairment losses 342 548 187 - - 1,077Reversal of impairment losses (188) (276) - - - (464)Attributable profit/(loss) before fair value adjustment
and exceptional items 5,384 59,159 (6,033) 50,453 - 108,963Fair value adjustment of investment properties - - (1,568) 20 - (1,548)Exceptional items 388 (66) (144) 503 - 681Attributable profit/(loss) 5,772 59,093 (7,745) 50,976 - 108,096
The following information are based on the geographical location of the Group's customers, which are essentially in the same location as the business operation and are as follows:
Geographical Information Singapore
($'000)Malaysia
($'000)
OtherASEAN($'000)
North/ South
Asia ($'000)
Outside Asia
($'000)
PerConsolidated
FinancialStatements
($'000) Total revenue 473,075 855,812 563,732 79,888 6,115 1,978,622PBIT (10,993) 80,440 113,778 (1,820) (2,254) 179,151Non-current assets 122,294 390,321 1,468,464 55,502 4,576 2,041,157Investments in joint venture and associated companies - 71,960 - - 17,054 89,014Current assets 170,511 245,147 126,737 39,359 2,151 583,905Capital expenditure 18,337 37,037 15,858 5,098 28 76,358
Other ASEAN: Myanmar, Thailand, Vietnam and Indonesia North/South Asia: China and India Outside Asia: Australia, Europe and USA
F r a s e r a n d N e a v e , L i m i t e d & S u b s i d i a r y C o m p a n i e s
NOTES TO THE FINANCIAL STATEMENTSFor the year ended 30 September 2016
A n n u a l R e p o r t 2 0 1 6 1 2 1
5. SEGMENT INFORMATION (cont’d) Year ended 30 September 2015
The following table presents financial information regarding operating segments:
Operating Segment Beverages
($'000)Dairies($'000)
Printing &Publishing
($'000)Others ($'000)
Adjustment &
Elimination ($'000)
PerConsolidated
FinancialStatements
($'000) Revenue - external 638,595 1,140,854 340,945 716 - 2,121,110Revenue - inter-segment 25,915 - 127 136,269 (162,311) -Total revenue 664,510 1,140,854 341,072 136,985 (162,311) 2,121,110
Subsidiary companies 38,171 68,800 (16,251) 38,142 - 128,862Joint venture and associated companies - - 985 1,716 - 2,701PBIT 38,171 68,800 (15,266) 39,858 - 131,563Finance income 6,479Finance cost (6,300)Profit before fair value adjustment,
taxation and exceptional items 131,742Fair value adjustment of investment properties (2,311)Exceptional items (27,706)Profit before taxation 101,725Taxation (19,316)Profit from continuing operations after taxation 82,409Profit from discontinued operations after taxation 636,820Profit after taxation 719,229Non-controlling interests (86,613)Attributable profit 632,616
Assets 294,976 552,842 287,534 938,186 - 2,073,538Investments in joint venture and associated companies - - 18,486 67,110 - 85,596Tax assets 18,156Bank deposits & cash balances 965,579Total assets 3,142,869 Liabilities 93,138 191,675 89,982 60,671 - 435,466Tax liabilities 50,851Borrowings 100,475Total liabilities 586,792
Other segment information: Capital expenditure 19,383 13,320 16,979 1,673 16,488* 67,843Depreciation and amortisation 20,341 23,664 36,190 3,496 - 83,691Impairment losses 3,187 10,405 29,970 - - 43,562Reversal of impairment losses (700) (339) - - - (1,039)Attributable profit/(loss) from continuing operations
before fair value adjustment and exceptional items 9,445 27,216 (16,877) 43,250 - 63,034Fair value adjustment of investment properties - - - (964) - (964)Exceptional items (36) - (23,358) - - (23,394)Attributable profit/(loss) from continuing operations 9,409 27,216 (40,235) 42,286 - 38,676Attributable profit from discontinued operations 593,940Total attributable profit 632,616
The following information are based on the geographical location of the Group's customers, which are essentially in the same location as the business operation and are as follows:
Geographical Information Singapore
($'000)Malaysia
($'000)
OtherASEAN($'000)
North/South
Asia ($'000)
Outside Asia
($'000)
Adjustment &
Elimination ($'000)
PerConsolidated
FinancialStatements
($'000) Total revenue 473,497 986,965 562,978 89,283 8,387 - 2,121,110PBIT (8,192) 75,700 69,423 (6,572) 1,204 - 131,563Non-current assets 101,986 374,378 937,948 50,758 4,775 - 1,469,845Investments in joint venture and associated companies - 67,110 - - 18,486 - 85,596Current assets 170,863 254,388 128,406 46,766 3,270 - 603,693Capital expenditure 15,935 24,516 4,716 6,061 127 16,488* 67,843
Other ASEAN: Myanmar, Thailand, Vietnam and Indonesia North/South Asia: China, Taiwan and India Outside Asia: Australia, Europe and USA * Adjustments relates to the sale of MBL as detailed in Note 26(a).
121Fra s e r a n d N ea v e , L i m i t e d & S u b s i d i a r y C o m pa n i e s A n n u a l R e p o r t 2 0 1 6

A n n u a l R e p o r t 2 0 1 6
F r a s e r a n d N e a v e , L i m i t e d & S u b s i d i a r y C o m p a n i e s
NOTES TO THE FINANCIAL STATEMENTS For the year ended 30 September 2016
1 2 2
THE GROUP
2016
($'000) 2015
($'000) 0B6. 1BGROSS INCOME FROM INVESTMENTS Interest income 128 255
Dividend income 48,438 41,436
48,566 41,691
2B7. 3BEXCEPTIONAL ITEMS Insurance claim relating to flood 1,263 -
Effects of change of interest in an associated company 756 -
Gain on redemption of other investments 30 -
Provision for restructuring and re-organisation cost of operations (1,170) (2,019)
(Loss)/Gain on liquidation/disposal of subsidiary and joint venture companies (net) (144) 161
Impairment loss on fixed assets relating to restructuring of operations - (25,761)
Impairment loss on fixed assets relating to flood - (87)
735 (27,706)
4B8. 5BTAXATION Based on profit for the year: Singapore tax 6,296 6,710
Overseas tax - current year 15,537 16,728
- withholding tax 2,728 3,620
Deferred tax - current year 5,640 (2,875)
- adjustment of tax rate 7 216
30,208 24,399
(Over)/Under provision in preceding years - current income tax (7,300) (4,430)
- withholding tax - (1,337)
- deferred tax (402) 684
Tax expense attributable to continuing operations 22,506 19,316
Tax expense attributable to discontinued operations (Note 26(a)) - 28,237
22,506 47,553
THE GROUP
2016
(%) 2015
(%)
A reconciliation of the statutory tax rate to the Group's effective tax rate which includes the tax effect of the capital gain tax applicable to profit for the year is as follows: Singapore statutory rate 17.0 17.0Effect of different tax rates of other jurisdictions 4.6 4.7Effect of tax losses of subsidiary and joint venture companies not available for set-off
against profits of other companies within the group 0.2 -Income not subject to tax (tax incentive/exemption) (15.5) (8.7)Expenses not deductible for tax purposes 5.5 1.7Utilisation of previously unrecognised tax losses (0.1) (0.2)Over provision in prior years (4.1) (0.9)Deferred tax benefits not recognised 3.2 0.8Withholding tax 1.5 0.4Others (0.3) (0.1) 12.0 14.7
122 Fra s e r a n d N ea v e , L i m i t e d & S u b s i d i a r y C o m pa n i e sA n n u a l R e p o r t 2 0 1 6

F r a s e r a n d N e a v e , L i m i t e d & S u b s i d i a r y C o m p a n i e s
NOTES TO THE FINANCIAL STATEMENTSFor the year ended 30 September 2016
A n n u a l R e p o r t 2 0 1 6 1 2 3
8. TAXATION (cont’d)
THE GROUP
2016
(%) 2015
(%)A reconciliation of the statutory tax rate to the Group's effective tax rate applicable to profit from continuing operations for the year is as follows: Singapore statutory rate 17.0 17.0Effect of different tax rates of other jurisdictions 4.6 4.5Effect of tax losses of subsidiary and joint venture companies not available for set-off
against profits of other companies within the group 0.2 0.2Income not subject to tax (tax incentive/exemption) (15.5) (19.3)Expenses not deductible for tax purposes 5.5 13.7Utilisation of previously unrecognised tax losses (0.1) (1.4)Over provision in prior years (4.1) (5.0)Adjustment due to change in tax rate - 0.2Deferred tax benefits not recognised 3.2 6.4Withholding tax 1.5 3.6Others (0.3) (0.9) 12.0 19.0
As at 30 September 2016, certain Singapore subsidiary companies have unutilised tax losses carried forward of approximately $22,682,000 (2015: $22,682,000) and unabsorbed capital allowances of $199,000 (2015: $199,000) available for set off against future profits. In addition, certain overseas subsidiary companies have unutilised tax losses carried forward of approximately $117,563,000 (2015: $122,239,000), unutilised investment allowances of approximately $94,231,000 (2015: $112,728,000) and unabsorbed capital allowances of $13,684,000 (2015: $14,803,000). The availability of these losses and capital allowances to set off against future profits is subject to the meeting of certain statutory requirements by those subsidiary companies in their countries of tax residence. The deferred tax benefits of these losses recognised in the financial statements are disclosed in Note 30.
For the year of assessment ("YA") 2016 certain subsidiary companies have transferred loss items of $8,976,000 (YA 2015: $6,079,000) to offset against the taxable income of other companies in the Group. Tax benefits of $911,000 (YA 2015: $40,000) were recognised on the tax losses utilised under the group relief system. Tax benefits of $1,881,000 (2015: $2,213,000) arising from the utilisation of group relief are not recognised as they are subject to compliance with the relevant tax legislation governing group relief and agreement of the Inland Revenue Authority of Singapore.
9. DIVIDENDS
THE GROUP &THE COMPANY
2016
($'000) 2015
($'000) Interim paid of 1.5 cents per share (2015: 2.0 cents per share) 21,733 29,006Final proposed of 3.0 cents per share (2015: 3.0 cents per share) 43,373 43,327 65,106 72,333
The final dividend is proposed by the Directors after the balance sheet date and subject to the approval of shareholders at the next annual general meeting of the Company.
123Fra s e r a n d N ea v e , L i m i t e d & S u b s i d i a r y C o m pa n i e s A n n u a l R e p o r t 2 0 1 6

A n n u a l R e p o r t 2 0 1 6
F r a s e r a n d N e a v e , L i m i t e d & S u b s i d i a r y C o m p a n i e s
NOTES TO THE FINANCIAL STATEMENTS For the year ended 30 September 2016
1 2 4
10. EARNINGS PER SHARE
(a) Basic Earnings Per Share Basic earnings per share is computed by dividing the Group attributable profit to shareholders of the Company by the weighted average number of ordinary shares in issue during the year.
THE GROUP
ContinuingOperations
DiscontinuedOperations Total
2016 ($'000)
2015 ($'000)
2016 ($'000)
2015 ($'000)
2016 ($'000)
2015 ($'000)
Group attributable profit
to shareholders of the Company
- before gain on disposal of discontinued operations, fair value adjustment and exceptional items 108,963 63,034 - 52,409 108,963 115,443
- after gain on disposal of discontinued operations, fair value adjustment and exceptional items 108,096 38,676 - 593,940 108,096 632,616
-- No. of shares --Weighted average number of
ordinary shares in issue 1,445,519,595 1,446,296,429 1,445,519,595 1,446,296,429 1,445,519,595 1,446,296,429
Earnings Per Share (Basic) - before gain on disposal
of discontinued operations, fair value adjustment and exceptional items 7.5 cts 4.4 cts - cts 3.6 cts 7.5 cts 8.0 cts
- after gain on disposal of discontinued operations, fair value adjustment and exceptional items 7.5 cts 2.7 cts - cts 41.0 cts 7.5 cts 43.7 cts
(b) Diluted Earnings Per Share Diluted earnings per share is computed by dividing the Group adjusted attributable profit to shareholders of the Company by the adjusted weighted average number of ordinary shares in issue during the year.
For diluted earnings per share, the Group attributable profit to shareholders of the Company is adjusted for changes in subsidiary companies attributable profit resulting from exercise of all dilutive share options and potential dilutive shares under share plans of a subsidiary company. The reconciliation of the Group adjusted attributable profit to shareholders of the Company used to compute diluted earnings per share is as follows:
Group attributable profit to shareholders of the Company before gain on disposal of discontinued operations, fair value adjustment and exceptional items 108,963 63,034 - 52,409 108,963 115,443
Change in attributable profit
due to dilutive share options and potential dilutive shares under share plans of a subsidiary company (297) (208) - - (297) (208)
Group adjusted attributable
profit to shareholders of the Company before gain on disposal of discontinued operations, fair value adjustment and exceptional items 108,666 62,826 - 52,409 108,666 115,235
124 Fra s e r a n d N ea v e , L i m i t e d & S u b s i d i a r y C o m pa n i e sA n n u a l R e p o r t 2 0 1 6

F r a s e r a n d N e a v e , L i m i t e d & S u b s i d i a r y C o m p a n i e s
NOTES TO THE FINANCIAL STATEMENTSFor the year ended 30 September 2016
A n n u a l R e p o r t 2 0 1 6 1 2 5
10. EARNINGS PER SHARE (cont’d)
(b) Diluted Earnings Per Share (cont’d) THE GROUP
ContinuingOperations
DiscontinuedOperations Total
2016 ($'000)
2015 ($'000)
2016 ($'000)
2015 ($'000)
2016 ($'000)
2015 ($'000)
Group attributable profit
to shareholders of the Company after gain on disposal of discontinued operations, fair value adjustment and exceptional items 108,096 38,676 - 593,940 108,096 632,616
Change in attributable profit
due to dilutive share options and potential dilutive shares under share plans of a subsidiary company (297) (205) - - (297) (205)
Group adjusted attributable
profit to shareholders of the Company after gain on disposal of discontinued operations, fair value adjustment and exceptional items 107,799 38,471 - 593,940 107,799 632,411
The weighted average number of ordinary shares is adjusted to assume exercise of all potential dilutive shares under share plans of the Company. The reconciliation of the weighted average number of ordinary shares used to compute diluted earnings per share is as follows:
-- No. of shares --Weighted average number of
ordinary shares used to compute basic earnings per share 1,445,519,595 1,446,296,429 1,445,519,595 1,446,296,429 1,445,519,595 1,446,296,429
Adjustment for potential
dilutive shares under share plans of the Company 3,310,805 3,538,403 3,310,805 3,538,403 3,310,805 3,538,403
Weighted average number of
ordinary shares used to compute diluted earnings per share 1,448,830,400 1,449,834,832 1,448,830,400 1,449,834,832 1,448,830,400 1,449,834,832
Earnings Per Share
(Fully diluted) - before gain on disposal
of discontinued operations, fair value adjustment and exceptional items 7.5 cts 4.3 cts - cts 3.6 cts 7.5 cts 7.9 cts
- after gain on disposal of discontinued operations, fair value adjustment and exceptional items 7.4 cts 2.6 cts - cts 41.0 cts 7.4 cts 43.6 cts
125Fra s e r a n d N ea v e , L i m i t e d & S u b s i d i a r y C o m pa n i e s A n n u a l R e p o r t 2 0 1 6

A n n u a l R e p o r t 2 0 1 6
F r a s e r a n d N e a v e , L i m i t e d & S u b s i d i a r y C o m p a n i e s
NOTES TO THE FINANCIAL STATEMENTS For the year ended 30 September 2016
1 2 6
11. SHARE CAPITAL, TREASURY SHARES AND RESERVES
(a) Share capital THE GROUP & THE COMPANY
2016 2015No. of shares ($'000) No. of shares ($'000)
Ordinary shares issued and fully paid up Balance at beginning of year 1,447,077,754 849,301 1,444,910,386 844,585
Issued during the year - pursuant to the vesting of shares awarded
under Share Plans - - 2,167,368 4,716Balance at end of year 1,447,077,754 849,301 1,447,077,754 849,301
The holders of ordinary shares (except for treasury shares) are entitled to receive dividends as and when declared by the Company. All ordinary shares carry one vote per share without restriction. The ordinary shares have no par value.
The Company has the following employee share plans under which share awards conditional on the achievement of pre-determined targets have been granted.
(i) Fraser and Neave Limited Restricted Share Plan (ii) Fraser and Neave Limited Performance Share Plan
(b) Treasury shares THE GROUP & THE COMPANY
2016 2015No. of shares ($'000) No. of shares ($'000)
Balance at beginning of year (2,828,700) (5,759) (4,100) (23)Purchased during the year - - (2,824,600) (5,736)Reissued during the year: - Reissued pursuant to share plans 1,524,649 - - -- Transferred from share-based
payment reserve - 3,918 - -- Gain on reissuance of treasury shares - (814) - - 1,524,649 3,104 - -Balance at end of year (1,304,051) (2,655) (2,828,700) (5,759)
Treasury shares relate to ordinary shares of the Company that is held by the Company.
The Company acquired Nil shares (2015: 2,824,600 shares) in the Company through purchases on the Singapore Exchange during the financial year. The total amount paid to acquire the shares was $Nil (2015: $5,736,000) and this was presented as a component within shareholders' equity.
The Company reissued 1,524,649 (2015: Nil) treasury shares pursuant to its share plans at a weighted average price of $2.04 (2015: $Nil) in this financial year.
(c) Reserves THE GROUP THE COMPANY
2016 ($'000)
2015 ($'000)
2016 ($'000)
2015 ($'000)
The reserves comprise the following: Capital Reserve 18,746 8,751 (2,000) (2,814)Fair Value Adjustment Reserve 1,177,590 653,441 75,014 3,936Hedging Reserve (425) (273) - -Share-based Payment Reserve 10,349 10,947 5,687 6,703Revenue Reserve 889,151 849,404 753,938 735,604Dividend Reserve (Note 9) 43,373 43,327 43,373 43,327Exchange Reserve (142,346) (141,090) - -Total reserves 1,996,438 1,424,507 876,012 786,756
Capital reserve of the Company comprises the net loss on reissuance of treasury shares. The capital reserve of the Group comprises statutory reserve, asset revaluation reserve of subsidiary companies and the net loss on reissuance of treasury shares.
F r a s e r a n d N e a v e , L i m i t e d & S u b s i d i a r y C o m p a n i e s
NOTES TO THE FINANCIAL STATEMENTSFor the year ended 30 September 2016
A n n u a l R e p o r t 2 0 1 6 1 2 7
11. SHARE CAPITAL, TREASURY SHARES AND RESERVES (cont’d)
(c) Reserves (cont’d) Fair value adjustment reserve comprises the cumulative fair value changes, net of tax, of available-for-sale financial assets until they are disposed or impaired.
Hedging reserve comprises the effective portion of the cumulative net change in the fair value of hedging instruments related to hedged transactions that have not yet occurred.
Movement of hedging instruments designated as cash flow hedges are as follows:
THE GROUP
2016
($'000) 2015
($'000) Balance at beginning of year (273) (605)Share of associated company's hedging reserve (152) 332Balance at end of year (425) (273)
Share-based payment reserve represents the equity-settled options and share plans granted to employees and is made up of the cumulative value of services received from employees recorded over the vesting period commencing from the grant date of equity-settled share options and share plans, and is reduced by the expiry or exercise of the share options and shares awarded.
Dividend reserve relates to proposed final dividend of 3.0 cents (2015: 3.0 cents) per share.
Exchange reserve comprises the exchange differences arising from the translation of the financial statements of foreign operations whose functional currencies are different from that of the Group's presentation currency.
12. FIXED ASSETS
THE GROUP
Freehold Land ($'000)
Leasehold Land ($'000)
Building ($'000)
Plant & Machinery
($'000)
Capital Work-in- Progress
($'000)
Other Assets
($'000)Total
($'000) For the year ended 30 September 2016 At cost Balance at beginning of year 40,707 38,415 275,680 555,517 11,190 204,460 1,125,969Currency realignment 468 (145) 994 1,817 398 1,811 5,343Additions - - 275 7,192 42,109 15,793 65,369Acquisition of subsidiary companies - 1,802 - 386 - 3,250 5,438Disposals - (101) (16) (2,878) - (9,894) (12,889)Write off - - - (673) - (7,973) (8,646)Revaluation - - 9,292 - - - 9,292Reclassification (458) - 2,179 8,869 (11,269) 679 -Reclassified to intangible assets - - - - (113) - (113)Reclassified from investment properties - - 523 - - - 523Reclassified to investment properties - - (10,915) - - - (10,915)Balance at end of year 40,717 39,971 278,012 570,230 42,315 208,126 1,179,371 Accumulated depreciation and
impairment Balance at beginning of year 760 11,035 84,419 421,427 - 143,940 661,581Currency realignment 15 (26) 8 628 - 912 1,537Depreciation charge - 610 5,664 23,963 - 16,567 46,804Impairment charge - - 4 735 - 151 890Impairment reversal - - - (387) - (77) (464)Disposals - (101) (7) (2,661) - (9,467) (12,236)Write off - - - (637) - (7,585) (8,222)Reclassification - - - (4) - 4 -Reclassified to investment properties - - (1,405) - - - (1,405)Balance at end of year 775 11,518 88,683 443,064 - 144,445 688,485 Net book value at end of year 39,942 28,453 189,329 127,166 42,315 63,681 490,886
126 Fra s e r a n d N ea v e , L i m i t e d & S u b s i d i a r y C o m pa n i e sA n n u a l R e p o r t 2 0 1 6

A n n u a l R e p o r t 2 0 1 6
F r a s e r a n d N e a v e , L i m i t e d & S u b s i d i a r y C o m p a n i e s
NOTES TO THE FINANCIAL STATEMENTS For the year ended 30 September 2016
1 2 6
11. SHARE CAPITAL, TREASURY SHARES AND RESERVES
(a) Share capital THE GROUP & THE COMPANY
2016 2015No. of shares ($'000) No. of shares ($'000)
Ordinary shares issued and fully paid up Balance at beginning of year 1,447,077,754 849,301 1,444,910,386 844,585
Issued during the year - pursuant to the vesting of shares awarded
under Share Plans - - 2,167,368 4,716Balance at end of year 1,447,077,754 849,301 1,447,077,754 849,301
The holders of ordinary shares (except for treasury shares) are entitled to receive dividends as and when declared by the Company. All ordinary shares carry one vote per share without restriction. The ordinary shares have no par value.
The Company has the following employee share plans under which share awards conditional on the achievement of pre-determined targets have been granted.
(i) Fraser and Neave Limited Restricted Share Plan (ii) Fraser and Neave Limited Performance Share Plan
(b) Treasury shares THE GROUP & THE COMPANY
2016 2015No. of shares ($'000) No. of shares ($'000)
Balance at beginning of year (2,828,700) (5,759) (4,100) (23)Purchased during the year - - (2,824,600) (5,736)Reissued during the year: - Reissued pursuant to share plans 1,524,649 - - -- Transferred from share-based
payment reserve - 3,918 - -- Gain on reissuance of treasury shares - (814) - - 1,524,649 3,104 - -Balance at end of year (1,304,051) (2,655) (2,828,700) (5,759)
Treasury shares relate to ordinary shares of the Company that is held by the Company.
The Company acquired Nil shares (2015: 2,824,600 shares) in the Company through purchases on the Singapore Exchange during the financial year. The total amount paid to acquire the shares was $Nil (2015: $5,736,000) and this was presented as a component within shareholders' equity.
The Company reissued 1,524,649 (2015: Nil) treasury shares pursuant to its share plans at a weighted average price of $2.04 (2015: $Nil) in this financial year.
(c) Reserves THE GROUP THE COMPANY
2016 ($'000)
2015 ($'000)
2016 ($'000)
2015 ($'000)
The reserves comprise the following: Capital Reserve 18,746 8,751 (2,000) (2,814)Fair Value Adjustment Reserve 1,177,590 653,441 75,014 3,936Hedging Reserve (425) (273) - -Share-based Payment Reserve 10,349 10,947 5,687 6,703Revenue Reserve 889,151 849,404 753,938 735,604Dividend Reserve (Note 9) 43,373 43,327 43,373 43,327Exchange Reserve (142,346) (141,090) - -Total reserves 1,996,438 1,424,507 876,012 786,756
Capital reserve of the Company comprises the net loss on reissuance of treasury shares. The capital reserve of the Group comprises statutory reserve, asset revaluation reserve of subsidiary companies and the net loss on reissuance of treasury shares.
F r a s e r a n d N e a v e , L i m i t e d & S u b s i d i a r y C o m p a n i e s
NOTES TO THE FINANCIAL STATEMENTSFor the year ended 30 September 2016
A n n u a l R e p o r t 2 0 1 6 1 2 7
11. SHARE CAPITAL, TREASURY SHARES AND RESERVES (cont’d)
(c) Reserves (cont’d) Fair value adjustment reserve comprises the cumulative fair value changes, net of tax, of available-for-sale financial assets until they are disposed or impaired.
Hedging reserve comprises the effective portion of the cumulative net change in the fair value of hedging instruments related to hedged transactions that have not yet occurred.
Movement of hedging instruments designated as cash flow hedges are as follows:
THE GROUP
2016
($'000) 2015
($'000) Balance at beginning of year (273) (605)Share of associated company's hedging reserve (152) 332Balance at end of year (425) (273)
Share-based payment reserve represents the equity-settled options and share plans granted to employees and is made up of the cumulative value of services received from employees recorded over the vesting period commencing from the grant date of equity-settled share options and share plans, and is reduced by the expiry or exercise of the share options and shares awarded.
Dividend reserve relates to proposed final dividend of 3.0 cents (2015: 3.0 cents) per share.
Exchange reserve comprises the exchange differences arising from the translation of the financial statements of foreign operations whose functional currencies are different from that of the Group's presentation currency.
12. FIXED ASSETS
THE GROUP
Freehold Land ($'000)
Leasehold Land ($'000)
Building ($'000)
Plant & Machinery
($'000)
Capital Work-in- Progress
($'000)
Other Assets
($'000)Total
($'000) For the year ended 30 September 2016 At cost Balance at beginning of year 40,707 38,415 275,680 555,517 11,190 204,460 1,125,969Currency realignment 468 (145) 994 1,817 398 1,811 5,343Additions - - 275 7,192 42,109 15,793 65,369Acquisition of subsidiary companies - 1,802 - 386 - 3,250 5,438Disposals - (101) (16) (2,878) - (9,894) (12,889)Write off - - - (673) - (7,973) (8,646)Revaluation - - 9,292 - - - 9,292Reclassification (458) - 2,179 8,869 (11,269) 679 -Reclassified to intangible assets - - - - (113) - (113)Reclassified from investment properties - - 523 - - - 523Reclassified to investment properties - - (10,915) - - - (10,915)Balance at end of year 40,717 39,971 278,012 570,230 42,315 208,126 1,179,371 Accumulated depreciation and
impairment Balance at beginning of year 760 11,035 84,419 421,427 - 143,940 661,581Currency realignment 15 (26) 8 628 - 912 1,537Depreciation charge - 610 5,664 23,963 - 16,567 46,804Impairment charge - - 4 735 - 151 890Impairment reversal - - - (387) - (77) (464)Disposals - (101) (7) (2,661) - (9,467) (12,236)Write off - - - (637) - (7,585) (8,222)Reclassification - - - (4) - 4 -Reclassified to investment properties - - (1,405) - - - (1,405)Balance at end of year 775 11,518 88,683 443,064 - 144,445 688,485 Net book value at end of year 39,942 28,453 189,329 127,166 42,315 63,681 490,886
127Fra s e r a n d N ea v e , L i m i t e d & S u b s i d i a r y C o m pa n i e s A n n u a l R e p o r t 2 0 1 6

A n n u a l R e p o r t 2 0 1 6
F r a s e r a n d N e a v e , L i m i t e d & S u b s i d i a r y C o m p a n i e s
NOTES TO THE FINANCIAL STATEMENTS For the year ended 30 September 2016
1 2 8
12. FIXED ASSETS (cont’d) THE GROUP
Freehold Land ($'000)
Leasehold Land ($'000)
Building ($'000)
Plant & Machinery
($'000)
Capital Work-in- Progress
($'000)
Other Assets ($'000)
Total ($'000)
For the year ended 30 September 2015 At cost Balance at beginning of year 45,972 43,218 313,550 661,789 29,928 266,901 1,361,358Effects of adopting FRS 111 - - - - - (2) (2)Balance at beginning of year, restated 45,972 43,218 313,550 661,789 29,928 266,899 1,361,356Currency realignment (5,265) (2,929) (23,382) (48,245) (4,077) (26,251) (110,149)Additions - - 179 8,557 24,213 23,126 56,075Disposal of subsidiary companies - (1,874) (11,123) (78,582) (14,563) (40,999) (147,141)Disposals - - (18) (2,515) - (13,753) (16,286)Write off - - (36) (768) - (4,462) (5,266)Reclassification - - 304 23,235 (23,707) 168 -Reclassified to intangible assets - - - - (604) - (604)Reclassified to assets held for sale - - (3,794) (7,954) - (268) (12,016)Balance at end of year 40,707 38,415 275,680 555,517 11,190 204,460 1,125,969 Accumulated depreciation and
impairment Balance at beginning of year 907 11,956 85,464 420,727 - 178,352 697,406Currency realignment (147) (715) (4,152) (29,682) - (17,599) (52,295)Depreciation charge - Continuing operations - 706 7,025 43,977 - 15,538 67,246- Discontinued operations - - - - - 8,185 8,185Impairment charge - 317 3,033 31,739 - 1,899 36,988Impairment reversal - - - (205) - (834) (1,039)Disposal of subsidiary companies - (1,229) (5,855) (37,689) - (24,746) (69,519)Disposals - - (8) (2,402) - (12,787) (15,197)Write off - - (7) (764) - (3,857) (4,628)Reclassification - - (13) 1 - 12 -Reclassified to assets held for sale - - (1,068) (4,275) - (223) (5,566)Balance at end of year 760 11,035 84,419 421,427 - 143,940 661,581 Net book value at end of year 39,947 27,380 191,261 134,090 11,190 60,520 464,388
THE COMPANY
Other Assets and Total
($'000) For the year ended 30 September 2016 At cost Additions 440 Accumulated depreciation and impairment Depreciation charge (47)Net book value at end of year 393
128 Fra s e r a n d N ea v e , L i m i t e d & S u b s i d i a r y C o m pa n i e sA n n u a l R e p o r t 2 0 1 6

A n n u a l R e p o r t 2 0 1 6
F r a s e r a n d N e a v e , L i m i t e d & S u b s i d i a r y C o m p a n i e s
NOTES TO THE FINANCIAL STATEMENTS For the year ended 30 September 2016
1 2 8
12. FIXED ASSETS (cont’d) THE GROUP
Freehold Land ($'000)
Leasehold Land ($'000)
Building ($'000)
Plant & Machinery
($'000)
Capital Work-in- Progress
($'000)
Other Assets ($'000)
Total ($'000)
For the year ended 30 September 2015 At cost Balance at beginning of year 45,972 43,218 313,550 661,789 29,928 266,901 1,361,358Effects of adopting FRS 111 - - - - - (2) (2)Balance at beginning of year, restated 45,972 43,218 313,550 661,789 29,928 266,899 1,361,356Currency realignment (5,265) (2,929) (23,382) (48,245) (4,077) (26,251) (110,149)Additions - - 179 8,557 24,213 23,126 56,075Disposal of subsidiary companies - (1,874) (11,123) (78,582) (14,563) (40,999) (147,141)Disposals - - (18) (2,515) - (13,753) (16,286)Write off - - (36) (768) - (4,462) (5,266)Reclassification - - 304 23,235 (23,707) 168 -Reclassified to intangible assets - - - - (604) - (604)Reclassified to assets held for sale - - (3,794) (7,954) - (268) (12,016)Balance at end of year 40,707 38,415 275,680 555,517 11,190 204,460 1,125,969 Accumulated depreciation and
impairment Balance at beginning of year 907 11,956 85,464 420,727 - 178,352 697,406Currency realignment (147) (715) (4,152) (29,682) - (17,599) (52,295)Depreciation charge - Continuing operations - 706 7,025 43,977 - 15,538 67,246- Discontinued operations - - - - - 8,185 8,185Impairment charge - 317 3,033 31,739 - 1,899 36,988Impairment reversal - - - (205) - (834) (1,039)Disposal of subsidiary companies - (1,229) (5,855) (37,689) - (24,746) (69,519)Disposals - - (8) (2,402) - (12,787) (15,197)Write off - - (7) (764) - (3,857) (4,628)Reclassification - - (13) 1 - 12 -Reclassified to assets held for sale - - (1,068) (4,275) - (223) (5,566)Balance at end of year 760 11,035 84,419 421,427 - 143,940 661,581 Net book value at end of year 39,947 27,380 191,261 134,090 11,190 60,520 464,388
THE COMPANY
Other Assets and Total
($'000) For the year ended 30 September 2016 At cost Additions 440 Accumulated depreciation and impairment Depreciation charge (47)Net book value at end of year 393
F r a s e r a n d N e a v e , L i m i t e d & S u b s i d i a r y C o m p a n i e s
NOTES TO THE FINANCIAL STATEMENTSFor the year ended 30 September 2016
A n n u a l R e p o r t 2 0 1 6 1 2 9
12. FIXED ASSETS (cont’d)
(a) Other assets comprise motor vehicles and forklift, postmix and vending machines, beer coolers, fixture and fittings and computer equipment.
(b) The Group's carrying amount of assets held under finance leases at 30 September 2016 amounted to $1,900,000 (2015: $18,000).
(c) The net book value of fixed assets pledged to financial institutions as security for borrowings are as follows:
THE GROUP
2016
($'000) 2015
($'000) Leasehold Land 1,789 - Building - 237 Plant and machinery - 1,516
(d) During the financial year, a change in use led to a building being transferred to investment property. Immediately before the transfer, the Group remeasured the property to its fair value and recognised a gain of $9,292,000 in other comprehensive income. The valuation techniques and significant unobservable inputs used in measuring the fair value of the building at the date of transfer were the same as those applied to investment property at the reporting date.
(e) In the previous financial year, the Group's subsidiary company, Times Publishing Limited ("TPL"), carried out a review of the recoverable amount on its plant and machinery. An impairment loss of $25,761,000, representing the write-down of these equipment to the recoverable amount was recognised in "Exceptional Items" as disclosed in Note 7. The recoverable amount of the printing equipment was determined based on its fair value less cost to sell.
(f) In the previous financial year, TPL conducted a technological review on its plant and machinery. The estimated useful lives of some machinery had been revised from 15 to 10 years. The revision in estimate had been applied on a prospective basis from 1 July 2015 with a corresponding increase in depreciation expense of $7,484,000.
13. INVESTMENT PROPERTIES THE GROUP
2016
($'000) 2015
($'000) (a) Completed Investment Properties Balance at beginning of year 35,018 40,702 Currency realignment 288 (3,373) Additions 102 - Reclassified from fixed assets 9,510 - Reclassified to fixed assets (523) - Net fair value loss recognised in the profit statement (1,532) (2,311) Balance at end of year 42,863 35,018 (b) Completed investment properties comprise commercial properties that are leased mainly to third parties under operating
leases (Note 32). The following amounts are recognised in the profit statement: Rental income from investment properties: - Minimum lease payments 1,392 1,207 Direct operating expenses arising from rental generating properties 432 422
129Fra s e r a n d N ea v e , L i m i t e d & S u b s i d i a r y C o m pa n i e s A n n u a l R e p o r t 2 0 1 6

A n n u a l R e p o r t 2 0 1 6
F r a s e r a n d N e a v e , L i m i t e d & S u b s i d i a r y C o m p a n i e s
NOTES TO THE FINANCIAL STATEMENTS For the year ended 30 September 2016
1 3 0
13. INVESTMENT PROPERTIES (cont’d) (c) As at 30 September 2016, investment properties amounting to $9,544,000 have been pledged to financial institutions
as security for bank facilities.
Completed investment properties are stated at fair value which has been determined based on valuations performed at balance sheet date. Valuations are performed by accredited independent valuers with recognised and relevant professional qualification and with recent experience in the location and category of the properties being valued.
The valuations are based on open market values on the as-is basis and were prepared primarily using the Investment and Comparison Method. In relying on the valuation reports, management has exercised its judgement and is satisfied that the valuation methods and estimates are reflective of current market conditions.
Independent professional valuations were carried out by the following valuers:
Valuers Country CBRE Pte Ltd SingaporeRoma Appraisals Ltd Hong KongHenry Butcher Malaysia Sdn Bhd Malaysia
14. PROPERTIES HELD FOR DEVELOPMENT
THE GROUP
2016
($'000) 2015
($'000) Balance at beginning of year 17,848 21,276Currency realignment 376 (3,634)Cost incurred 8 206Balance at end of year 18,232 17,848 Properties held for development comprise: Freehold land 16,408 16,070Development costs 1,824 1,778 18,232 17,848
15. SUBSIDIARY COMPANIES
THE COMPANY
2016
($'000) 2015
($'000) Quoted shares at cost 256,353 256,353Unquoted shares at cost 861,366 861,366Allowance for impairment (210,929) (210,929) 906,790 906,790Amounts owing by subsidiary companies (unsecured) 216,237 150,179 1,123,027 1,056,969MARKET VALUE Quoted shares 1,613,560 1,201,951
The amounts owing by subsidiary companies are unsecured, not repayable within the next 12 months and are interest free except for amounts of $187,085,000 (2015: $150,044,000) which bear an interest rate of 1.12% (2015: 1.57%) per annum. The amounts owing to subsidiary companies disclosed under non-current liabilities are unsecured, non-trade in nature, interest free, not repayable within the next 12 months and to be settled in cash. The amounts owing from and to subsidiary companies disclosed under current assets and current liabilities are unsecured, non-trade in nature, interest free, have no fixed repayment term and are to be settled in cash.
The carrying amounts of the amounts owing from and to subsidiary companies are largely denominated in Singapore Dollar, Malaysia Ringgit and Thai Baht.
Details of significant subsidiary companies are included in Note 39.
130 Fra s e r a n d N ea v e , L i m i t e d & S u b s i d i a r y C o m pa n i e sA n n u a l R e p o r t 2 0 1 6

A n n u a l R e p o r t 2 0 1 6
F r a s e r a n d N e a v e , L i m i t e d & S u b s i d i a r y C o m p a n i e s
NOTES TO THE FINANCIAL STATEMENTS For the year ended 30 September 2016
1 3 0
13. INVESTMENT PROPERTIES (cont’d) (c) As at 30 September 2016, investment properties amounting to $9,544,000 have been pledged to financial institutions
as security for bank facilities.
Completed investment properties are stated at fair value which has been determined based on valuations performed at balance sheet date. Valuations are performed by accredited independent valuers with recognised and relevant professional qualification and with recent experience in the location and category of the properties being valued.
The valuations are based on open market values on the as-is basis and were prepared primarily using the Investment and Comparison Method. In relying on the valuation reports, management has exercised its judgement and is satisfied that the valuation methods and estimates are reflective of current market conditions.
Independent professional valuations were carried out by the following valuers:
Valuers Country CBRE Pte Ltd SingaporeRoma Appraisals Ltd Hong KongHenry Butcher Malaysia Sdn Bhd Malaysia
14. PROPERTIES HELD FOR DEVELOPMENT
THE GROUP
2016
($'000) 2015
($'000) Balance at beginning of year 17,848 21,276Currency realignment 376 (3,634)Cost incurred 8 206Balance at end of year 18,232 17,848 Properties held for development comprise: Freehold land 16,408 16,070Development costs 1,824 1,778 18,232 17,848
15. SUBSIDIARY COMPANIES
THE COMPANY
2016
($'000) 2015
($'000) Quoted shares at cost 256,353 256,353Unquoted shares at cost 861,366 861,366Allowance for impairment (210,929) (210,929) 906,790 906,790Amounts owing by subsidiary companies (unsecured) 216,237 150,179 1,123,027 1,056,969MARKET VALUE Quoted shares 1,613,560 1,201,951
The amounts owing by subsidiary companies are unsecured, not repayable within the next 12 months and are interest free except for amounts of $187,085,000 (2015: $150,044,000) which bear an interest rate of 1.12% (2015: 1.57%) per annum. The amounts owing to subsidiary companies disclosed under non-current liabilities are unsecured, non-trade in nature, interest free, not repayable within the next 12 months and to be settled in cash. The amounts owing from and to subsidiary companies disclosed under current assets and current liabilities are unsecured, non-trade in nature, interest free, have no fixed repayment term and are to be settled in cash.
The carrying amounts of the amounts owing from and to subsidiary companies are largely denominated in Singapore Dollar, Malaysia Ringgit and Thai Baht.
Details of significant subsidiary companies are included in Note 39.
F r a s e r a n d N e a v e , L i m i t e d & S u b s i d i a r y C o m p a n i e s
NOTES TO THE FINANCIAL STATEMENTSFor the year ended 30 September 2016
A n n u a l R e p o r t 2 0 1 6 1 3 1
15. SUBSIDIARY COMPANIES (cont’d)
(a) Acquisition of subsidiary companies
Soft Drinks On 1 July 2016, the Group through F&N Foods Pte Ltd, a wholly-owned subsidiary company, completed the acquisition of 100% shareholding interest in Warburg Vending Pte Ltd (“WV”), Warburg Engineering Pte. Ltd. (“WE”) and Warburg Vending Services Pte. Ltd. (“WVS”) and obtained control. Upon acquisition, WV, WE and WVS became subsidiary companies of the Group. A provisional goodwill of $22,311,000 was recognised on the acquisition based on the difference between the consideration and the provisional fair value of the identifiable assets and liabilities at the date of the acquisition subject to completion of the Purchase Price Allocation exercise ("PPA"). The consideration was arrived at on a “willing-buyer-willing-seller” basis, taking into consideration, inter alia, the net asset value and earnings of WV, WE and WVS.
The fair value of the identifiable assets and liabilities of WV, WE and WVS as at the acquisition date were as follows:
Fair Valueat Date of
Acquisition($'000)
Fixed assets 5,438Current assets 1,224Bank borrowings (1,758)Other current liabilities (2,034)Other non-current liabilities (260)Cash and cash equivalents 4,079Total identifiable net assets at fair value 6,689Provisional goodwill arising from acquisition 22,311Consideration paid 29,000Less: Cash and cash equivalents in subsidiary companies acquired (4,079)Net cash outflow on acquisition of subsidiary companies 24,921
Impact of the acquisition on profit statement If the business combination has taken place at the beginning of the year, the contribution to the Group's revenue would have been $17,885,000 and the contribution to the Group's profit after tax would have been $2,644,000.
Transaction costs Transaction costs related to the acquisition of $306,000 have been recognised under "Administration expenses" in the Group's profit statement for the year ended 30 September 2016.
(b) Disposal of a subsidiary company On 19 August 2015, the Company completed the disposal of its 55% interest in Myanmar Brewery Limited ("MBL") for a total consideration of US$560 million (approximately S$777 million). In accordance with FRS 105, Non-current Assets Held for Sale and Discontinued Operations, the results of MBL were presented separately on the Group Profit Statement as Discontinued Operations.
The effects of the disposal are disclosed in Note 26(a) Discontinued Operations.
(c) Liquidation of a subsidiary company During the financial year, the Group liquidated Pansing IMM Pty Limited, a wholly owned dormant subsidiary company of Times Publishing Limited.
131Fra s e r a n d N ea v e , L i m i t e d & S u b s i d i a r y C o m pa n i e s A n n u a l R e p o r t 2 0 1 6

A n n u a l R e p o r t 2 0 1 6
F r a s e r a n d N e a v e , L i m i t e d & S u b s i d i a r y C o m p a n i e s
NOTES TO THE FINANCIAL STATEMENTS For the year ended 30 September 2016
1 3 2
15. SUBSIDIARY COMPANIES (cont’d)
(d) Subsidiary company with material non-controlling interest ("NCI") The Group’s subsidiary company that has material NCI is as follows:
Fraser & Neave Holdings Bhd
2016
($'000) 2015
($'000) NCI percentage of ownership and voting interest 44.5% 44.5%Carrying amount of NCI 291,136 269,479Profit after taxation allocated to NCI 57,394 45,443Dividends paid to NCI 33,578 28,849 Summarised financial information before inter-group elimination Non-current assets 506,771 485,480Current assets 549,885 490,205Non-current liabilities (148,085) (119,636)Current liabilities (252,943) (250,151)Net assets 655,628 605,898 Revenue 1,395,718 1,501,741 Profit for the year 129,060 102,394Other comprehensive income (16,394) 21,003Total comprehensive income 112,666 123,397 Net cash from operating activities 160,979 109,026Net cash flows used in investing activities (41,556) (22,632)Net cash flows used in financing activities (48,867) (87,376)Net increase/(decrease) in cash and cash equivalents 70,556 (982)
16. JOINT VENTURE COMPANIES
THE GROUP
2016
($'000) 2015
($'000) (a) Unquoted investment, at cost 165 161 Share of post acquisition reserves, net (2,227) (1,660) (2,062) (1,499) Shareholder's loan 48,073 45,235 46,011 43,736
Shareholder's loan On 11 November 2011, the Group had through its non-wholly owned subsidiary, Fraser & Neave Holdings Bhd
("F&NHB"), entered into a conditional subscription cum shareholders' agreement ("SSA") with FCL Centrepoint Pte Ltd ("FCLC") to form a joint venture, Vacaron Company Sdn Bhd ("VCSB") for the purpose of carrying out a proposed mixed development on the land held under PN 3679 for Lot No. 35 and PN 3681 for Lot No. 37, Seksyen 13, Bandar Petaling Jaya, Daerah Petaling, Selangor.
The Group and FCLC had both granted shareholder's loans to VCSB pursuant to the SSA. The loans are unsecured, bear interest at KLIBOR + 1.25% (2015: KLIBOR + 1.25%) per annum, not repayable within the next 12 months and are denominated in Malaysia Ringgit.
132 Fra s e r a n d N ea v e , L i m i t e d & S u b s i d i a r y C o m pa n i e sA n n u a l R e p o r t 2 0 1 6

A n n u a l R e p o r t 2 0 1 6
F r a s e r a n d N e a v e , L i m i t e d & S u b s i d i a r y C o m p a n i e s
NOTES TO THE FINANCIAL STATEMENTS For the year ended 30 September 2016
1 3 2
15. SUBSIDIARY COMPANIES (cont’d)
(d) Subsidiary company with material non-controlling interest ("NCI") The Group’s subsidiary company that has material NCI is as follows:
Fraser & Neave Holdings Bhd
2016
($'000) 2015
($'000) NCI percentage of ownership and voting interest 44.5% 44.5%Carrying amount of NCI 291,136 269,479Profit after taxation allocated to NCI 57,394 45,443Dividends paid to NCI 33,578 28,849 Summarised financial information before inter-group elimination Non-current assets 506,771 485,480Current assets 549,885 490,205Non-current liabilities (148,085) (119,636)Current liabilities (252,943) (250,151)Net assets 655,628 605,898 Revenue 1,395,718 1,501,741 Profit for the year 129,060 102,394Other comprehensive income (16,394) 21,003Total comprehensive income 112,666 123,397 Net cash from operating activities 160,979 109,026Net cash flows used in investing activities (41,556) (22,632)Net cash flows used in financing activities (48,867) (87,376)Net increase/(decrease) in cash and cash equivalents 70,556 (982)
16. JOINT VENTURE COMPANIES
THE GROUP
2016
($'000) 2015
($'000) (a) Unquoted investment, at cost 165 161 Share of post acquisition reserves, net (2,227) (1,660) (2,062) (1,499) Shareholder's loan 48,073 45,235 46,011 43,736
Shareholder's loan On 11 November 2011, the Group had through its non-wholly owned subsidiary, Fraser & Neave Holdings Bhd
("F&NHB"), entered into a conditional subscription cum shareholders' agreement ("SSA") with FCL Centrepoint Pte Ltd ("FCLC") to form a joint venture, Vacaron Company Sdn Bhd ("VCSB") for the purpose of carrying out a proposed mixed development on the land held under PN 3679 for Lot No. 35 and PN 3681 for Lot No. 37, Seksyen 13, Bandar Petaling Jaya, Daerah Petaling, Selangor.
The Group and FCLC had both granted shareholder's loans to VCSB pursuant to the SSA. The loans are unsecured, bear interest at KLIBOR + 1.25% (2015: KLIBOR + 1.25%) per annum, not repayable within the next 12 months and are denominated in Malaysia Ringgit.
F r a s e r a n d N e a v e , L i m i t e d & S u b s i d i a r y C o m p a n i e s
NOTES TO THE FINANCIAL STATEMENTSFor the year ended 30 September 2016
A n n u a l R e p o r t 2 0 1 6 1 3 3
16. JOINT VENTURE COMPANIES (cont’d) (b) The summarised financial information of the joint venture company held by the Group is as follows:
THE GROUP
2016
($'000) 2015
($'000) Expenses (790) (3,178)Loss before taxation (790) (3,178)Taxation (290) 720Loss after taxation (1,080) (2,458) Non-current assets 760 1,031Cash and bank balances 102 2,040Other current assets 91,639 85,246Other current liabilities (96,632) (91,321)Net liabilities (4,131) (3,004) Proportion of F&NHB's ownership 50% 50%Group's share of net liabilities (2,065) (1,502)Goodwill 3 3Shareholder's loan 48,073 45,235Carrying amount of the investment 46,011 43,736
(c) The share of the results as stated in paragraph (b) above are based on the accounts of the joint venture company for the financial year ended 30 September.
(d) The amounts owing from joint venture companies classified under current assets are unsecured, trade and non-trade in nature, interest free, repayable on demand, to be settled in cash and are denominated mostly in Singapore Dollar.
(e) The Group's share of capital commitments of the joint venture company as at 30 September 2016 is $Nil (2015: $37,956,000).
Details of significant joint venture company is included in Note 39.
17. ASSOCIATED COMPANIES
THE GROUP THE COMPANY
2016
($'000)2015
($'000) 2016
($'000) 2015
($'000) Quoted investments, at cost 113,380 112,913 93,783 93,783Share of post acquisition reserves, net (6,914) (7,590) - -Allowance for impairment (63,463) (63,463) (75,683) (75,683) 43,003 41,860 18,100 18,100 MARKET VALUE Quoted shares 65,793 57,902 26,014 21,001
(a) The amounts due from/to associated companies classified under current assets and current liabilities are unsecured, trade and non-trade in nature, interest free, repayable on demand, to be settled in cash and are denominated mostly in Malaysia Ringgit and Chinese Renminbi.
(b) The summarised information of the associated companies held by the Group that are not individually material are as follows:
THE GROUP
2016
($'000) 2015
($'000) Carrying amount of interest 43,003 41,860 Share of profit before taxation 4,554 5,483Share of taxation (1,368) (1,553)Share of profit after taxation 3,186 3,930Share of other comprehensive income (762) 231Share of total comprehensive income 2,424 4,161
(c) The Group's share of contingent liabilities of the associated companies as at 30 September 2016 is $276,000 (2015: $147,000).
Details of significant associated companies are included in Note 39.
133Fra s e r a n d N ea v e , L i m i t e d & S u b s i d i a r y C o m pa n i e s A n n u a l R e p o r t 2 0 1 6

A n n u a l R e p o r t 2 0 1 6
F r a s e r a n d N e a v e , L i m i t e d & S u b s i d i a r y C o m p a n i e s
NOTES TO THE FINANCIAL STATEMENTS For the year ended 30 September 2016
1 3 4
18. INTANGIBLE ASSETS THE GROUP
Goodwill
($'000)
DeferredDevelopment
Costs($'000)
Other Intangible
Assets ($'000)
Total($'000)
For the year ended 30 September 2016 At cost Balance at beginning of year 59,972 72,687 40,274 172,933Currency realignment (177) (1,976) 321 (1,832)Additional expenditure - 10,140 747 10,887Acquisition of subsidiary companies 22,311 - - 22,311Reclassified from fixed assets - - 113 113Disposal for the year - - (100) (100)Write off - (834) (176) (1,010)Balance at end of year 82,106 80,017 41,179 203,302 Accumulated amortisation and impairment Balance at beginning of year 5,943 56,921 31,319 94,183Currency realignment 36 (1,830) 183 (1,611)Amortisation charge - 11,974 2,834 14,808Impairment charge - 162 - 162Write off - (834) (170) (1,004)Balance at end of year 5,979 66,393 34,166 106,538 Net book value 76,127 13,624 7,013 96,764 For the year ended 30 September 2015 At cost Balance at beginning of year 66,545 65,872 41,933 174,350Currency realignment (2,308) 4,730 (2,946) (524)Additional expenditure - 10,932 836 11,768Reclassified from fixed assets - - 604 604Write off (4,265) (8,847) (153) (13,265)Balance at end of year 59,972 72,687 40,274 172,933 Accumulated amortisation and impairment Balance at beginning of year 9,662 47,144 27,857 84,663Currency realignment (359) 4,401 (1,927) 2,115Amortisation charge - 12,970 3,340 16,310Impairment charge 905 1,253 2,202 4,360Write off (4,265) (8,847) (153) (13,265)Balance at end of year 5,943 56,921 31,319 94,183 Net book value 54,029 15,766 8,955 78,750 THE COMPANY
Other Intangible
Assets and Total
($'000) For the year ended 30 September 2016 At cost Additional expenditure 200 Accumulated amortisation and impairment Amortisation charge 13 Net book value 187 All intangible assets, other than goodwill, have finite useful lives of not more than 20 years.
134 Fra s e r a n d N ea v e , L i m i t e d & S u b s i d i a r y C o m pa n i e sA n n u a l R e p o r t 2 0 1 6

A n n u a l R e p o r t 2 0 1 6
F r a s e r a n d N e a v e , L i m i t e d & S u b s i d i a r y C o m p a n i e s
NOTES TO THE FINANCIAL STATEMENTS For the year ended 30 September 2016
1 3 4
18. INTANGIBLE ASSETS THE GROUP
Goodwill
($'000)
DeferredDevelopment
Costs($'000)
Other Intangible
Assets ($'000)
Total($'000)
For the year ended 30 September 2016 At cost Balance at beginning of year 59,972 72,687 40,274 172,933Currency realignment (177) (1,976) 321 (1,832)Additional expenditure - 10,140 747 10,887Acquisition of subsidiary companies 22,311 - - 22,311Reclassified from fixed assets - - 113 113Disposal for the year - - (100) (100)Write off - (834) (176) (1,010)Balance at end of year 82,106 80,017 41,179 203,302 Accumulated amortisation and impairment Balance at beginning of year 5,943 56,921 31,319 94,183Currency realignment 36 (1,830) 183 (1,611)Amortisation charge - 11,974 2,834 14,808Impairment charge - 162 - 162Write off - (834) (170) (1,004)Balance at end of year 5,979 66,393 34,166 106,538 Net book value 76,127 13,624 7,013 96,764 For the year ended 30 September 2015 At cost Balance at beginning of year 66,545 65,872 41,933 174,350Currency realignment (2,308) 4,730 (2,946) (524)Additional expenditure - 10,932 836 11,768Reclassified from fixed assets - - 604 604Write off (4,265) (8,847) (153) (13,265)Balance at end of year 59,972 72,687 40,274 172,933 Accumulated amortisation and impairment Balance at beginning of year 9,662 47,144 27,857 84,663Currency realignment (359) 4,401 (1,927) 2,115Amortisation charge - 12,970 3,340 16,310Impairment charge 905 1,253 2,202 4,360Write off (4,265) (8,847) (153) (13,265)Balance at end of year 5,943 56,921 31,319 94,183 Net book value 54,029 15,766 8,955 78,750 THE COMPANY
Other Intangible
Assets and Total
($'000) For the year ended 30 September 2016 At cost Additional expenditure 200 Accumulated amortisation and impairment Amortisation charge 13 Net book value 187 All intangible assets, other than goodwill, have finite useful lives of not more than 20 years.
F r a s e r a n d N e a v e , L i m i t e d & S u b s i d i a r y C o m p a n i e s
NOTES TO THE FINANCIAL STATEMENTSFor the year ended 30 September 2016
A n n u a l R e p o r t 2 0 1 6 1 3 5
19. IMPAIRMENT TESTS FOR INTANGIBLE ASSETS
(a) Goodwill The carrying value of the Group's goodwill arising from acquisitions of subsidiary companies was assessed for impairment during the financial year.
($'000)
Basis on which recoverable values are
determined
Terminal growth
rate
Pre-taxDiscount
rate Carrying value of capitalised goodwill
based on cash generating units As at 30 September 2016 Subsidiary companies: Printing and Publishing Group 15,401 Value-in-use
and Fair value less cost to sell
0% 7.4%
Dairies Group 330 Value-in-use 0% 10.5%Beverages Group 60,396 Value-in-use
and Fair value less cost to sell
0% - 2.0% 7.3% - 10.5%
76,127 As at 30 September 2015 Subsidiary companies: Printing and Publishing Group 15,966 Value-in-use
and Fair value less cost to sell
0% 7.0% -7.5%
Dairies Group 323 Value-in-use 1.0% 10.2%Beverages Group 37,740 Value-in-use
and Fair value less cost to sell
0% - 1.0% 10.2%
54,029
Goodwill is allocated for impairment testing purposes to the individual entity which is also the cash generating unit. The value-in-use calculations apply a discounted cash flow model using cash flow projections based on financial budgets and forecasts approved by management covering 3 to 5 year period. Cash flows beyond these periods are extrapolated using the estimated growth rates stated in the table above. The fair value less cost to sell calculations are based on quoted market prices obtained from active markets or using the net carrying amount adjusted for the unrecognised fair value changes to the properties.
The terminal growth rate used does not exceed the long term average growth rate of the respective industry and country in which the entity operates.
The discount rates applied to the cash flow projections reflect management's estimates of the risks specific to the respective cash generating units at the date of assessment.
During the financial year, no impairment loss was recognised in the profit statement. In the previous financial year, an impairment loss of $905,000 was recognised in the profit statement. The recoverable amount of the goodwill has been determined based on value-in-use. The value-in-use calculations were determined using 5 year cash flow projections approved by management. The pre-tax discount rate applied to the cash flow projections was 7.0% and the terminal growth rate was 0%.
(b) Deferred development costs The carrying value of deferred development costs was assessed for impairment during the financial year.
An impairment loss of $162,000 (2015: $1,253,000) was recognised in the profit statement as the carrying value was assessed to be in excess of its recoverable value due to shift in market demand for certain products.
The recoverable amount of the deferred development costs has been determined based on value-in-use calculations using 5 year cash flow projection approved by management. The pre-tax discount rate applied to the cash flow projections is 7.4% (2015: 7.0% - 7.5%) and the terminal growth rate is 0% (2015: 0%).
135Fra s e r a n d N ea v e , L i m i t e d & S u b s i d i a r y C o m pa n i e s A n n u a l R e p o r t 2 0 1 6

A n n u a l R e p o r t 2 0 1 6
F r a s e r a n d N e a v e , L i m i t e d & S u b s i d i a r y C o m p a n i e s
NOTES TO THE FINANCIAL STATEMENTS For the year ended 30 September 2016
1 3 6
19. IMPAIRMENT TESTS FOR INTANGIBLE ASSETS (cont’d)
(c) Other Intangible Assets The carrying value of other intangible assets was assessed for impairment during the financial year.
During the financial year, no impairment loss was recognised in the profit statement. In the previous financial year, an impairment loss of $2,202,000 was recognised in the profit statement. The recoverable amount of the other intangible assets has been determined based on value-in-use. The value-in-use calculations were determined using 5 - 10 year cash flow projections approved by management. The pre-tax discount rate applied to the cash flow projections was 7.5% - 9.4% and the terminal growth rate was 0% - 2.0%.
A reasonable change to the assumptions used by the management to determine the impairment required, particularly the discount rate and terminal growth rate, would not significantly affect the results.
20. OTHER INVESTMENTS
THE GROUP THE COMPANY
2016
($'000)2015
($'000) 2016
($'000) 2015
($'000) Quoted available-for-sale financial assets Equity investments
At fair value 1,363,375 844,741 185,226 120,115 Unquoted available-for-sale financial assets Equity investments
At cost (less impairment loss) 14 39 14 14 Total 1,363,389 844,780 185,240 120,129
(a) Market value of quoted investments are determined by reference to stock exchange quoted prices.
(b) Certain unquoted investments do not have quoted market prices in an active market nor are other methods of reasonably estimating the fair values readily available. Hence it is not practicable to determine their fair value with sufficient reliability without incurring excessive costs.
21. CASH AND BANK DEPOSITS THE GROUP THE COMPANY
2016
($'000)2015
($'000) 2016
($'000) 2015
($'000) Non-Current Bank fixed deposits 2,900 3,874 - - Current Bank fixed deposits 563,282 446,462 231,018 276,978Cash and bank balances 479,347 515,243 270,726 261,494 1,042,629 961,705 501,744 538,472 1,045,529 965,579 501,744 538,472 The weighted average effective interest rate for non-current fixed deposits is 1.00% (2015: 3.90%) and current bank fixed deposits is 1.38% (2015: 1.57%).
The Group's non-current bank fixed deposits of $2,900,000 (2015: $3,874,000) and current bank deposit of $3,956,000 (2015: $Nil) relates to the portion of consideration for acquisition of subsidiary companies held as profit guarantee. The profit guarantee will be released upon the achievement of pre-defined targets as set out in the sale and purchase agreement. These fixed deposits are excluded from the Group Cash Flow Statement.
As at 30 September 2016, cash and bank deposits held by the Group are in the following major currencies: Malaysia Ringgit -11.8% (2015: 10.2%), Thai Baht - 7.1% (2015: 4.9%) and United States Dollar - 5.1% (2015: 5.1%).
136 Fra s e r a n d N ea v e , L i m i t e d & S u b s i d i a r y C o m pa n i e sA n n u a l R e p o r t 2 0 1 6

A n n u a l R e p o r t 2 0 1 6
F r a s e r a n d N e a v e , L i m i t e d & S u b s i d i a r y C o m p a n i e s
NOTES TO THE FINANCIAL STATEMENTS For the year ended 30 September 2016
1 3 6
19. IMPAIRMENT TESTS FOR INTANGIBLE ASSETS (cont’d)
(c) Other Intangible Assets The carrying value of other intangible assets was assessed for impairment during the financial year.
During the financial year, no impairment loss was recognised in the profit statement. In the previous financial year, an impairment loss of $2,202,000 was recognised in the profit statement. The recoverable amount of the other intangible assets has been determined based on value-in-use. The value-in-use calculations were determined using 5 - 10 year cash flow projections approved by management. The pre-tax discount rate applied to the cash flow projections was 7.5% - 9.4% and the terminal growth rate was 0% - 2.0%.
A reasonable change to the assumptions used by the management to determine the impairment required, particularly the discount rate and terminal growth rate, would not significantly affect the results.
20. OTHER INVESTMENTS
THE GROUP THE COMPANY
2016
($'000)2015
($'000) 2016
($'000) 2015
($'000) Quoted available-for-sale financial assets Equity investments
At fair value 1,363,375 844,741 185,226 120,115 Unquoted available-for-sale financial assets Equity investments
At cost (less impairment loss) 14 39 14 14 Total 1,363,389 844,780 185,240 120,129
(a) Market value of quoted investments are determined by reference to stock exchange quoted prices.
(b) Certain unquoted investments do not have quoted market prices in an active market nor are other methods of reasonably estimating the fair values readily available. Hence it is not practicable to determine their fair value with sufficient reliability without incurring excessive costs.
21. CASH AND BANK DEPOSITS THE GROUP THE COMPANY
2016
($'000)2015
($'000) 2016
($'000) 2015
($'000) Non-Current Bank fixed deposits 2,900 3,874 - - Current Bank fixed deposits 563,282 446,462 231,018 276,978Cash and bank balances 479,347 515,243 270,726 261,494 1,042,629 961,705 501,744 538,472 1,045,529 965,579 501,744 538,472 The weighted average effective interest rate for non-current fixed deposits is 1.00% (2015: 3.90%) and current bank fixed deposits is 1.38% (2015: 1.57%).
The Group's non-current bank fixed deposits of $2,900,000 (2015: $3,874,000) and current bank deposit of $3,956,000 (2015: $Nil) relates to the portion of consideration for acquisition of subsidiary companies held as profit guarantee. The profit guarantee will be released upon the achievement of pre-defined targets as set out in the sale and purchase agreement. These fixed deposits are excluded from the Group Cash Flow Statement.
As at 30 September 2016, cash and bank deposits held by the Group are in the following major currencies: Malaysia Ringgit -11.8% (2015: 10.2%), Thai Baht - 7.1% (2015: 4.9%) and United States Dollar - 5.1% (2015: 5.1%).
A n n u a l R e p o r t 2 0 1 6
F r a s e r a n d N e a v e , L i m i t e d & S u b s i d i a r y C o m p a n i e s
NOTES TO THE FINANCIAL STATEMENTS For the year ended 30 September 2016
1 3 7
22. BRANDS THE GROUP THE COMPANY
2016
($'000)2015
($'000) 2016
($'000) 2015
($'000) At cost Balance at beginning of year 40,747 46,595 8,647 8,647Currency realignment 612 (5,848) - -Balance at end of year 41,359 40,747 8,647 8,647 Accumulated amortisation and impairment Balance at beginning of year 13,266 11,315 8,435 8,435Currency realignment 66 (366) - -Amortisation charge 135 135 - -Impairment charge - 2,182 - -Balance at end of year 13,467 13,266 8,435 8,435 Net book value 27,892 27,481 212 212
Included in the Group's brands are brands with indefinite useful life of carrying amount of $26,683,000 (2015: $26,136,000).
The recoverable amount of the brands have been determined based on value-in-use calculations using 3 to 10 year cash flow projections approved by management.
The terminal growth rate used does not exceed the long term average growth rate of the respective industry and country in which the cash generating unit operates.
The discount rate applied to the cash flow projections reflect managements' estimates of the risks specific to the respective cash generating units at the date of assessment.
The pre-tax discount rates applied to the cash flow projections were 10.5% (2015: 10.2% - 13.4%) and terminal growth rates applied were 1.0% - 2.0% (2015: 1.0% - 5.0%).
23. INVENTORIES
THE GROUP
2016
($'000) 2015
($'000) Raw materials 102,836 123,316Manufactured inventories 101,476 88,239Engineering spares, work-in-progress and other inventories 9,493 7,973Packaging materials 10,760 10,927Goods purchased for resale 22,767 23,463 247,332 253,918
The cost of inventories recognised as an expense in cost of sales for continuing operations during the year was $1,160,336,000 (2015: $1,303,164,000).
137Fra s e r a n d N ea v e , L i m i t e d & S u b s i d i a r y C o m pa n i e s A n n u a l R e p o r t 2 0 1 6

A n n u a l R e p o r t 2 0 1 6
F r a s e r a n d N e a v e , L i m i t e d & S u b s i d i a r y C o m p a n i e s
NOTES TO THE FINANCIAL STATEMENTS For the year ended 30 September 2016
1 3 8
24. TRADE RECEIVABLES, OTHER RECEIVABLES AND RELATED PARTIES THE GROUP THE COMPANY
2016
($'000)2015
($'000) 2016
($'000) 2015
($'000) Trade receivables 267,178 278,792 - - Other receivables: Current Accrued income 2,783 2,358 34 20Prepayments 5,043 4,570 120 160Deposits paid 4,853 7,465 - -Tax recoverable 15,105 12,435 78 358Staff loans 3,541 3,315 - -Derivative financial instruments (Note 25) 549 2,533 22 295Sundry debtors 5,986 3,955 - -Other receivables 16,034 17,039 820 554 53,894 53,670 1,074 1,387Related parties 4,565 1,742 6 - 325,637 334,204 1,080 1,387Non-current Advance project cost paid - 828 - -Staff loans 615 377 - -Tax recoverable 149 - - -Deposits paid 367 375 - - 1,131 1,580 - - 326,768 335,784 1,080 1,387
(a) As at 30 September 2016, trade receivables, other receivables and related parties held by the Group are in the following major currencies: Malaysia Ringgit - 37.6% (2015: 36.7%), Thai Baht - 15.8% (2015: 16.5%), United States Dollar - 8.4% (2015: 9.2%) and Chinese Renminbi - 4.7% (2015: 4.6%).
(b) Current amounts due from related parties are trade and non-trade related, unsecured, interest free, repayable upon demand and to be settled in cash.
Trade receivables that are past due but not impaired The Group has trade receivables amounting to $58,938,000 (2015: $66,129,000) that are past due at balance sheet date but not impaired. These receivables are unsecured and the ageing analysis at the balance sheet date is as follows:
THE GROUP
2016
($'000) 2015
($'000) Trade receivables past due: 1 to 30 days 41,013 44,06631 to 60 days 8,123 10,65261 to 90 days 3,210 5,53191 to 120 days 1,192 1,578more than 120 days 5,400 4,302 58,938 66,129
138 Fra s e r a n d N ea v e , L i m i t e d & S u b s i d i a r y C o m pa n i e sA n n u a l R e p o r t 2 0 1 6

A n n u a l R e p o r t 2 0 1 6
F r a s e r a n d N e a v e , L i m i t e d & S u b s i d i a r y C o m p a n i e s
NOTES TO THE FINANCIAL STATEMENTS For the year ended 30 September 2016
1 3 8
24. TRADE RECEIVABLES, OTHER RECEIVABLES AND RELATED PARTIES THE GROUP THE COMPANY
2016
($'000)2015
($'000) 2016
($'000) 2015
($'000) Trade receivables 267,178 278,792 - - Other receivables: Current Accrued income 2,783 2,358 34 20Prepayments 5,043 4,570 120 160Deposits paid 4,853 7,465 - -Tax recoverable 15,105 12,435 78 358Staff loans 3,541 3,315 - -Derivative financial instruments (Note 25) 549 2,533 22 295Sundry debtors 5,986 3,955 - -Other receivables 16,034 17,039 820 554 53,894 53,670 1,074 1,387Related parties 4,565 1,742 6 - 325,637 334,204 1,080 1,387Non-current Advance project cost paid - 828 - -Staff loans 615 377 - -Tax recoverable 149 - - -Deposits paid 367 375 - - 1,131 1,580 - - 326,768 335,784 1,080 1,387
(a) As at 30 September 2016, trade receivables, other receivables and related parties held by the Group are in the following major currencies: Malaysia Ringgit - 37.6% (2015: 36.7%), Thai Baht - 15.8% (2015: 16.5%), United States Dollar - 8.4% (2015: 9.2%) and Chinese Renminbi - 4.7% (2015: 4.6%).
(b) Current amounts due from related parties are trade and non-trade related, unsecured, interest free, repayable upon demand and to be settled in cash.
Trade receivables that are past due but not impaired The Group has trade receivables amounting to $58,938,000 (2015: $66,129,000) that are past due at balance sheet date but not impaired. These receivables are unsecured and the ageing analysis at the balance sheet date is as follows:
THE GROUP
2016
($'000) 2015
($'000) Trade receivables past due: 1 to 30 days 41,013 44,06631 to 60 days 8,123 10,65261 to 90 days 3,210 5,53191 to 120 days 1,192 1,578more than 120 days 5,400 4,302 58,938 66,129
F r a s e r a n d N e a v e , L i m i t e d & S u b s i d i a r y C o m p a n i e s
NOTES TO THE FINANCIAL STATEMENTSFor the year ended 30 September 2016
A n n u a l R e p o r t 2 0 1 6 1 3 9
24. TRADE RECEIVABLES, OTHER RECEIVABLES AND RELATED PARTIES (cont’d)
Trade receivables that are impaired The Group's trade receivables that are impaired at the balance sheet date and the movement of the allowance accounts used to record the impairment are as follows:
THE GROUP Collectively impaired Individually impaired
2016
($'000)2015
($'000) 2016
($'000) 2015
($'000) Trade receivables - nominal amounts 136 141 7,267 9,064Less: Allowance for impairment (136) (141) (4,107) (5,108) - - 3,160 3,956 Movement in allowance accounts: Balance at beginning of year 141 266 5,108 5,701Impairment charge 155 78 1,045 2,875Write back - Continuing operations (149) (116) (788) (378)- Discontinued operations - - - (11)Disposal of a subsidiary company - - - (399)Write off (16) (68) (1,238) (2,211)Currency realignment 5 (19) (20) (469)Balance at end of year 136 141 4,107 5,108
Receivables that are individually determined to be impaired at the balance sheet date relate to debtors that are in significant financial difficulties and have defaulted on payments. These receivables are not secured by any collateral or credit enhancement.
25. DERIVATIVE FINANCIAL INSTRUMENTS
THE GROUP THE COMPANY
2016
($'000)2015
($'000) 2016
($'000) 2015
($'000) Assets Current Forward currency contracts 549 2,533 22 295 Liabilities Current Forward currency contracts 242 338 20 -Net position 307 2,195 2 295
139Fra s e r a n d N ea v e , L i m i t e d & S u b s i d i a r y C o m pa n i e s A n n u a l R e p o r t 2 0 1 6

A n n u a l R e p o r t 2 0 1 6
F r a s e r a n d N e a v e , L i m i t e d & S u b s i d i a r y C o m p a n i e s
NOTES TO THE FINANCIAL STATEMENTS For the year ended 30 September 2016
1 4 0
26. DISCONTINUED OPERATIONS AND ASSETS AND LIABILITIES HELD FOR SALE
(a) Discontinued operations
Beverages - Breweries On 29 August 2013 and 10 September 2013, the Company announced Myanma Economic Holdings Limited (“MEHL”)’s intention to commence arbitration proceedings and subsequently, the receipt of notice of arbitration from MEHL, in relation to the Company’s shares in Myanmar Brewery Limited (“MBL”). MEHL had sought to compel the Company to sell its 55% stake in MBL (“MBL Stake”) to MEHL at US$246 million (approximately $313 million) under the terms of the joint venture agreement between the parties. On 31 October 2014, the Company announced that it had received the decision on its arbitration with MEHL. The arbitral tribunal has ruled that MEHL’s valuation of US$246 million does not represent a fair value of the Company’s stake in MBL and that the sale should take place at a price to be determined by an independent valuer.
On 22 July 2015, the Company received the valuation report of MBL from the independent valuer. The valuer had determined that the estimated fair value of the MBL Stake is Myanmar Kyat (“MMK”) 500 billion. On 7 August 2015, the Company announced the sale of its 55% stake in MBL to MEHL for US$560 million.
Upon completion of the sale of MBL on 19 August 2015, the Group realised a net divestment gain of $542 million after deducting the cost of investment and relevant taxes. In accordance with FRS 105, Non-current Assets Held for Sale and Discontinued Operations, the results of MBL has been presented separately on the Group Profit Statement as Discontinued Operations.
Profit statement disclosures The results of the discontinued operations for the year ended 30 September are as follows:
THE GROUP
2016
($'000) 2015
($'000) Revenue - 335,516Expenses - (212,309)Profit before interest and taxation - 123,207 Interest income - 319 Profit from discontinued operations before taxation - 123,526 Taxation - (28,237)Profit from discontinued operations after taxation - 95,289 Gain on disposal of discontinued operations - 541,531 Profit after taxation - 636,820
Cash flow statement disclosures The cash flows attributable to the discontinued operations for the year ended 30 September are as follows:
Operating cash inflows - 70,044 Investing cash outflows - (16,422)Net cash inflows - 53,622
Earnings per share disclosures Earnings per share from discontinued operations attributable to the shareholders of the company:
-- cents per share -- - Basic - before gain on disposal of discontinued operations Nil cts 3.6 cts - after gain on disposal of discontinued operations Nil cts 41.0 cts - Diluted - before gain on disposal of discontinued operations Nil cts 3.6 cts - after gain on disposal of discontinued operations Nil cts 41.0 cts
140 Fra s e r a n d N ea v e , L i m i t e d & S u b s i d i a r y C o m pa n i e sA n n u a l R e p o r t 2 0 1 6
A n n u a l R e p o r t 2 0 1 6
F r a s e r a n d N e a v e , L i m i t e d & S u b s i d i a r y C o m p a n i e s
NOTES TO THE FINANCIAL STATEMENTS For the year ended 30 September 2016
1 4 0
26. DISCONTINUED OPERATIONS AND ASSETS AND LIABILITIES HELD FOR SALE
(a) Discontinued operations
Beverages - Breweries On 29 August 2013 and 10 September 2013, the Company announced Myanma Economic Holdings Limited (“MEHL”)’s intention to commence arbitration proceedings and subsequently, the receipt of notice of arbitration from MEHL, in relation to the Company’s shares in Myanmar Brewery Limited (“MBL”). MEHL had sought to compel the Company to sell its 55% stake in MBL (“MBL Stake”) to MEHL at US$246 million (approximately $313 million) under the terms of the joint venture agreement between the parties. On 31 October 2014, the Company announced that it had received the decision on its arbitration with MEHL. The arbitral tribunal has ruled that MEHL’s valuation of US$246 million does not represent a fair value of the Company’s stake in MBL and that the sale should take place at a price to be determined by an independent valuer.
On 22 July 2015, the Company received the valuation report of MBL from the independent valuer. The valuer had determined that the estimated fair value of the MBL Stake is Myanmar Kyat (“MMK”) 500 billion. On 7 August 2015, the Company announced the sale of its 55% stake in MBL to MEHL for US$560 million.
Upon completion of the sale of MBL on 19 August 2015, the Group realised a net divestment gain of $542 million after deducting the cost of investment and relevant taxes. In accordance with FRS 105, Non-current Assets Held for Sale and Discontinued Operations, the results of MBL has been presented separately on the Group Profit Statement as Discontinued Operations.
Profit statement disclosures The results of the discontinued operations for the year ended 30 September are as follows:
THE GROUP
2016
($'000) 2015
($'000) Revenue - 335,516Expenses - (212,309)Profit before interest and taxation - 123,207 Interest income - 319 Profit from discontinued operations before taxation - 123,526 Taxation - (28,237)Profit from discontinued operations after taxation - 95,289 Gain on disposal of discontinued operations - 541,531 Profit after taxation - 636,820
Cash flow statement disclosures The cash flows attributable to the discontinued operations for the year ended 30 September are as follows:
Operating cash inflows - 70,044 Investing cash outflows - (16,422)Net cash inflows - 53,622
Earnings per share disclosures Earnings per share from discontinued operations attributable to the shareholders of the company:
-- cents per share -- - Basic - before gain on disposal of discontinued operations Nil cts 3.6 cts - after gain on disposal of discontinued operations Nil cts 41.0 cts - Diluted - before gain on disposal of discontinued operations Nil cts 3.6 cts - after gain on disposal of discontinued operations Nil cts 41.0 cts
F r a s e r a n d N e a v e , L i m i t e d & S u b s i d i a r y C o m p a n i e s
NOTES TO THE FINANCIAL STATEMENTSFor the year ended 30 September 2016
A n n u a l R e p o r t 2 0 1 6 1 4 1
26. DISCONTINUED OPERATIONS AND ASSETS AND LIABILITIES HELD FOR SALE (cont’d)
(b) Assets and liabilities held for sale The assets and liabilities of a subsidiary company, Shanxi Xinhua Times Packaging Printing Co., Ltd ("SXTP") is presented as held for sale following the commitment of the Group's management on 20 August 2015 to a plan to sell the subsidiary company. As at the date of this report, the sale has not been completed.
THE GROUP
2016
($'000) 2015
($'000) Assets Fixed assets 5,476 6,450Inventories 1,227 1,362Trade and other receivables 3,575 3,499Cash and bank balances 97 101 10,375 11,412Liabilities Trade and other payables 2,339 1,802
27. TRADE PAYABLES, OTHER PAYABLES AND RELATED PARTIES
THE GROUP THE COMPANY
2016
($'000)2015
($'000) 2016
($'000) 2015
($'000) Current Trade payables 180,548 201,113 - - Other payables Accrued operating expenses 76,836 66,859 59 71Sundry accruals 38,189 43,111 270 1,689Sundry deposits 6,150 5,493 - -Staff costs payable 44,913 42,547 - -Accrual for unconsumed annual leave 3,674 4,197 - -Deferred income 655 460 - -Derivative financial instruments (Note 25) 242 338 20 -Interest payable 1,412 1,307 - -Other payables 38,902 28,533 7,074 8,552 210,973 192,845 7,423 10,312Related parties 12,650 14,523 21 - 404,171 408,481 7,444 10,312Non-current Other payables 2,900 3,874 - -Related parties 1,265 1,265 1,265 1,265 4,165 5,139 1,265 1,265 408,336 413,620 8,709 11,577
(a) As at 30 September 2016, the trade payables, other payables and related parties held by the Group are in the following major currencies: Malaysia Ringgit - 39.7% (2015: 40.7%), Thai Baht - 22.3% (2015: 21.7%), United States Dollar - 3.7% (2015: 4.7%) and Sterling Pound - 2.0% (2015: 1.9%).
(b) Current amounts due to related parties are trade and non-trade related, unsecured, interest free, repayable upon demand and to be settled in cash.
(c) Non-current amounts due to related parties are non-trade related, unsecured, interest free, have no fixed term of repayment and to be settled in cash.
141Fra s e r a n d N ea v e , L i m i t e d & S u b s i d i a r y C o m pa n i e s A n n u a l R e p o r t 2 0 1 6

A n n u a l R e p o r t 2 0 1 6
F r a s e r a n d N e a v e , L i m i t e d & S u b s i d i a r y C o m p a n i e s
NOTES TO THE FINANCIAL STATEMENTS For the year ended 30 September 2016
1 4 2
28. BORROWINGS
Weighted
average effective THE GROUP
interest rate
% Notes 2016
($'000) 2015
($'000) Repayable within one year: Unsecured
Bank loans 2.48% 10,432 591Bank overdrafts 7.68% 802 669 11,234 1,260Term loans 4.90% (a) 79 531
Secured
Bank loans 2.50% (b) 291 748Term loans 6.50% (b) 84 -Finance leases 535 12
12,223 2,551 Repayable after one year: Unsecured
Bank loans 2.35% 24,625 -Term loans 4.31% (a) 99,309 97,899
Secured
Term loans 6.50% (b) 691 -Finance leases 200 25
(d) 124,825 97,924 Total 137,048 100,475 Fair value (c) 132,308 99,115
Notes
(a) As at 30 September 2016 and 2015, term loans include medium term notes issued by certain subsidiary companies.
(b) The secured bank loans and term loans are secured by way of pledge over certain subsidiary companies' fixed assets (Note 12) and investment properties (Note 13).
(c) The carrying amounts of bank borrowings and finance leases approximate fair value as they bear interest at rates which approximate the current incremental borrowing rate for similar types of lending and borrowing arrangements except for bank loans and term loans of $133,355,000 (2015: $96,840,000) which have a fair value of $128,615,000 (2015: $95,480,000).
The aggregate fair value of bank loans and term loans are determined by using present value calculations.
(d) Maturity of non-current borrowings is as follows:
Between 1 and 2 years 49,786 524Between 2 and 5 years 74,668 97,232After 5 years 371 168 124,825 97,924
(e) As at 30 September 2016, the borrowings held by the Group are in the following major currencies: Malaysia Ringgit - 73.5% (2015: 99.2%) and Thai Baht - 25.2% (2015: Nil%).
142 Fra s e r a n d N ea v e , L i m i t e d & S u b s i d i a r y C o m pa n i e sA n n u a l R e p o r t 2 0 1 6

A n n u a l R e p o r t 2 0 1 6
F r a s e r a n d N e a v e , L i m i t e d & S u b s i d i a r y C o m p a n i e s
NOTES TO THE FINANCIAL STATEMENTS For the year ended 30 September 2016
1 4 2
28. BORROWINGS
Weighted
average effective THE GROUP
interest rate
% Notes 2016
($'000) 2015
($'000) Repayable within one year: Unsecured
Bank loans 2.48% 10,432 591Bank overdrafts 7.68% 802 669 11,234 1,260Term loans 4.90% (a) 79 531
Secured
Bank loans 2.50% (b) 291 748Term loans 6.50% (b) 84 -Finance leases 535 12
12,223 2,551 Repayable after one year: Unsecured
Bank loans 2.35% 24,625 -Term loans 4.31% (a) 99,309 97,899
Secured
Term loans 6.50% (b) 691 -Finance leases 200 25
(d) 124,825 97,924 Total 137,048 100,475 Fair value (c) 132,308 99,115
Notes
(a) As at 30 September 2016 and 2015, term loans include medium term notes issued by certain subsidiary companies.
(b) The secured bank loans and term loans are secured by way of pledge over certain subsidiary companies' fixed assets (Note 12) and investment properties (Note 13).
(c) The carrying amounts of bank borrowings and finance leases approximate fair value as they bear interest at rates which approximate the current incremental borrowing rate for similar types of lending and borrowing arrangements except for bank loans and term loans of $133,355,000 (2015: $96,840,000) which have a fair value of $128,615,000 (2015: $95,480,000).
The aggregate fair value of bank loans and term loans are determined by using present value calculations.
(d) Maturity of non-current borrowings is as follows:
Between 1 and 2 years 49,786 524Between 2 and 5 years 74,668 97,232After 5 years 371 168 124,825 97,924
(e) As at 30 September 2016, the borrowings held by the Group are in the following major currencies: Malaysia Ringgit - 73.5% (2015: 99.2%) and Thai Baht - 25.2% (2015: Nil%).
F r a s e r a n d N e a v e , L i m i t e d & S u b s i d i a r y C o m p a n i e s
NOTES TO THE FINANCIAL STATEMENTSFor the year ended 30 September 2016
A n n u a l R e p o r t 2 0 1 6 1 4 3
29. PROVISION FOR EMPLOYEE BENEFITS THE GROUP
2016
($'000) 2015
($'000) Defined benefit plan 20,601 18,131Long service leave/severance allowance/gratuity 70 70 20,671 18,201
(a) Defined Contribution Plan The Group makes contributions to several post employment benefit plans. Most of these plans are defined contribution plans whereby contributions are made to approved provident and superannuation funds in Singapore, Malaysia, Hong Kong and Australia.
Accruals for defined contribution plans are included in Other Payables under Note 27.
(b) Defined Benefit Plan The defined benefit plan in the United Kingdom is a funded, defined benefit pension plan where the assets are held in a separate trustee-administrated fund. The defined benefit plans in Malaysia, Thailand and Indonesia do not have separately funded assets. They provide lump sum benefit at normal retirement age.
The following tables summarise the components of net benefit expense and benefit liability:
2016
($'000) 2015
($'000) Net benefit expense Current service cost 605 868Net interest cost on benefit obligation 781 289Net benefit expense 1,386 1,157 Actual return on plan assets 2,393 470 Benefit liability Present value of funded benefit obligation 26,332 27,660Fair value of plan assets (20,222) (22,291)Deficit of funded plans 6,110 5,369Present value of unfunded benefit obligation 14,491 12,762 20,601 18,131
The weighted average duration of the defined benefit obligation as at 30 September 2016 was 13.8 years (2015: 14.3 years).
The Group expects to contribute $673,000 to the defined benefit plans in the financial year ended 30 September 2017.
Changes in present value of defined benefit plan are as follows: Balance at beginning of year 40,422 41,238Interest cost 1,560 1,693Current service cost 605 868Benefits paid (1,461) (2,551)Remeasurements: - actuarial gain and losses arising from change in demographic assumptions (1,996) -- actuarial gain and losses arising from change in financial assumptions 6,548 752- experience adjustments (8) (465)Currency realignment (4,847) (1,113)Balance at end of year 40,823 40,422
143Fra s e r a n d N ea v e , L i m i t e d & S u b s i d i a r y C o m pa n i e s A n n u a l R e p o r t 2 0 1 6

A n n u a l R e p o r t 2 0 1 6
F r a s e r a n d N e a v e , L i m i t e d & S u b s i d i a r y C o m p a n i e s
NOTES TO THE FINANCIAL STATEMENTS For the year ended 30 September 2016
1 4 4
29. PROVISION FOR EMPLOYEE BENEFITS (cont’d)
(b) Defined Benefit Plan (cont’d) THE GROUP
2016
($'000) 2015
($'000) Changes in fair value of plan assets are as follows: Balance at beginning of year 22,291 21,814Interest income 779 1,404Contributions by employer 618 755Benefits paid (1,020) (1,703)Remeasurements on return on plan assets (excluding interest income) 1,614 (934)Currency realignment (4,060) 955Balance at end of year 20,222 22,291 The proportion of fair value of plan assets at the end of the year is analysed as follows: Equity instruments 9,099 12,908Debt instruments 8,086 9,323Other assets 3,037 60 20,222 22,291 The major assumptions used by the qualified independent actuaries were: Rate of increase in salaries 4.0% to 7.0% 4.0% to 7.0% Inflation rate 3.3% 3.5%Discount rate 2.3% to 7.5% 2.7% to 5.5%
Sensitivity Analysis The sensitivity analysis below has been determined based on reasonably possible changes of each significant assumption on the defined benefit obligation as of the end of the reporting period, assuming if all other assumptions were held constant:
Increase/(Decrease) in
defined benefit obligation
Change in assumption
Increase in assumption
($'000)
Decrease in assumption
($'000) The Group Year Ended 30 September 2016 Rate of increase in salaries 1% 1,615 (1,421)Inflation rate 1% 903 (1,013)Discount rate 1% (5,174) 6,444 Year Ended 30 September 2015 Rate of increase in salaries 1% 1,142 (1,007)Inflation rate 1% 558 (718)Discount rate 1% (4,771) 5,932
(c) Long Service Leave/Severance Allowances/Gratuity Long service leave, severance allowances and gratuity are provided based on the number of years of service the employees have rendered at the end of each financial year as required by local legislation.
144 Fra s e r a n d N ea v e , L i m i t e d & S u b s i d i a r y C o m pa n i e sA n n u a l R e p o r t 2 0 1 6

A n n u a l R e p o r t 2 0 1 6
F r a s e r a n d N e a v e , L i m i t e d & S u b s i d i a r y C o m p a n i e s
NOTES TO THE FINANCIAL STATEMENTS For the year ended 30 September 2016
1 4 4
29. PROVISION FOR EMPLOYEE BENEFITS (cont’d)
(b) Defined Benefit Plan (cont’d) THE GROUP
2016
($'000) 2015
($'000) Changes in fair value of plan assets are as follows: Balance at beginning of year 22,291 21,814Interest income 779 1,404Contributions by employer 618 755Benefits paid (1,020) (1,703)Remeasurements on return on plan assets (excluding interest income) 1,614 (934)Currency realignment (4,060) 955Balance at end of year 20,222 22,291 The proportion of fair value of plan assets at the end of the year is analysed as follows: Equity instruments 9,099 12,908Debt instruments 8,086 9,323Other assets 3,037 60 20,222 22,291 The major assumptions used by the qualified independent actuaries were: Rate of increase in salaries 4.0% to 7.0% 4.0% to 7.0% Inflation rate 3.3% 3.5%Discount rate 2.3% to 7.5% 2.7% to 5.5%
Sensitivity Analysis The sensitivity analysis below has been determined based on reasonably possible changes of each significant assumption on the defined benefit obligation as of the end of the reporting period, assuming if all other assumptions were held constant:
Increase/(Decrease) in
defined benefit obligation
Change in assumption
Increase in assumption
($'000)
Decrease in assumption
($'000) The Group Year Ended 30 September 2016 Rate of increase in salaries 1% 1,615 (1,421)Inflation rate 1% 903 (1,013)Discount rate 1% (5,174) 6,444 Year Ended 30 September 2015 Rate of increase in salaries 1% 1,142 (1,007)Inflation rate 1% 558 (718)Discount rate 1% (4,771) 5,932
(c) Long Service Leave/Severance Allowances/Gratuity Long service leave, severance allowances and gratuity are provided based on the number of years of service the employees have rendered at the end of each financial year as required by local legislation.
F r a s e r a n d N e a v e , L i m i t e d & S u b s i d i a r y C o m p a n i e s
NOTES TO THE FINANCIAL STATEMENTSFor the year ended 30 September 2016
A n n u a l R e p o r t 2 0 1 6 1 4 5
29. PROVISION FOR EMPLOYEE BENEFITS (cont’d)
(d) Share Options The equity-based equity-settled share option scheme of the Group is:
Approval by Shareholders Fraser & Neave Holdings Bhd Executives' Share Option Scheme ("F&NHB 2007 Scheme") 5 April 2007 The options granted under the above scheme are for a term of no longer than 10 years from date of grant.
Information regarding F&NHB 2007 Scheme (i) The maximum number of new ordinary shares of RM1.00 each in F&NHB which may be issued on the exercise of
the options granted under the F&NHB 2007 Scheme shall not exceed 10% of the issued and paid-up share capital of F&NHB at any point of time throughout the duration of the F&NHB 2007 Scheme.
(ii) Eligible full-time executives of the group and executive directors of the company with at least one year service shall be eligible to participate in the F&NHB 2007 Scheme.
(iii) The allotment of an eligible executive shall not exceed the maximum limits for any specific job grade in any one financial year and 1,000,000 new shares of F&NHB during the tenure of the F&NHB 2007 Scheme, subject to the limits below:
(1) not more than 50% of the new shares of F&NHB available under the F&NHB 2007 Scheme shall be allocated, in aggregate, to the directors and senior management of F&NHB group; and
(2) not more than 10% of the new shares of F&NHB available under the F&NHB 2007 Scheme shall be allocated to any individual eligible executive who, either singly or collectively through persons connected to that eligible executive, holds 20% or more of the issued and paid-up share capital of F&NHB.
(iv) The option price shall be the five-day weighted average market price of F&NHB’s shares as quoted on Bursa Malaysia Securities Berhad immediately preceding the date of the offer, or the par value of the shares of F&NHB, whichever is higher.
(v) The F&NHB 2007 Scheme shall be in force for a period of 10 years from the effective date of the implementation of the F&NHB 2007 Scheme.
(vi) Following approval by F&NHB shareholders on 13 January 2012, F&NHB adopted the F&NHB Restricted Share Plan ("F&NHB RSP") and F&NHB Performance Share Plan ("F&NHB PSP"). No further options have been granted under the F&NHB 2007 Scheme.
Information with respect to the number of options granted under the share option scheme is as follows:
Options Offer Date
Balanceas at
1.10.2015Options
Exercised
Balanceas at
30.9.2016Exercise
Price Exercise Period 2011 22.11.2010 131,700 (131,700) - RM14.52 22.08.2013 - 21.10.2015
No options were granted during the year. The weighted average share price for options exercised during the year was RM21.48 (2015: RM17.75).
(e) Share Plans
Fraser and Neave Limited Restricted Share Plan ("RSP") The RSP is a share-based incentive plan for senior executives and key senior management, which was approved by shareholders of the Company at an Extraordinary General Meeting held on 22 January 2009.
Information regarding the RSP (i) Depending on the level of achievement of pre-determined targets over a two-year performance period for the
RSP, the final number of RSP shares to be awarded could range between 0% to 150% of the initial grant of the RSP shares.
(ii) Based on meeting stated performance conditions over a two-year performance period, 50% of the RSP share awards will vest. The balance will vest equally over the subsequent two years upon fulfillment of service requirements.
145Fra s e r a n d N ea v e , L i m i t e d & S u b s i d i a r y C o m pa n i e s A n n u a l R e p o r t 2 0 1 6

A n n u a l R e p o r t 2 0 1 6
F r a s e r a n d N e a v e , L i m i t e d & S u b s i d i a r y C o m p a n i e s
NOTES TO THE FINANCIAL STATEMENTS For the year ended 30 September 2016
1 4 6
29. PROVISION FOR EMPLOYEE BENEFITS (cont’d)
(e) Share Plans (cont’d)
Fraser and Neave Limited Restricted Share Plan ("RSP") (cont’d) Information with respect to the number of shares granted under the RSP is as follows:
Shares Grant Date
Balance as at1.10.2015 or Grant
Date if later Cancelled Achievement
Factor Vested Balance as at
30.9.2016 Year 3 14.12.2011 510,974 - - (510,974) -Year 4 14.12.2012 817,250 (6,275) - (408,625) 402,350Year 5 01.10.2014 1,013,675 (11,500) 100,825 (557,250) 545,750Year 6 06.05.2015 1,055,300 (70,500) - - 984,800Year 7 26.02.2016 1,255,976 (25,500) - - 1,230,476
4,653,175^ (113,775)* 100,825 (1,476,849) 3,163,376
^ This takes into account the adjustments made on 7 October 2014 following F&N’s distribution to its shareholders by way of dividend in specie and a capital reduction undertaken by F&N during the financial year ended 30 September 2014.
* Cancelled due to resignations.
The expense recognised in profit statement granted under the RSP during the financial year is $2,815,000 (2015: $2,916,000).
The estimated fair value of shares granted during the year ranges from $1.79 to $1.87 (2015: $2.56 to $2.69). The fair value of equity-settled contingent award of shares are determined using Monte Carlo Valuation Model, which involves projection of future outcomes using statistical distributions of key random variables including share price and volatility of returns. The inputs to the model used are as follows:
2016 2015 Dividend yield (%) 2.5 2.3Expected volatility (%) 21.0 21.3Risk-free interest rate (%) 1.1 to 1.5 1.1 to 1.5Expected life (years) 1.9 to 3.9 1.7 to 3.7Share price at date of grant ($) 1.97 2.79
Fraser and Neave Limited Performance Share Plan ("PSP") The PSP is a share-based incentive plan for senior executives and key senior management, which were approved by shareholders of the Company at an Extraordinary General Meeting held on 22 January 2009.
Information regarding the PSP (i) Depending on the level of achievement of pre-determined targets over a three-year performance period, the final
number of PSP shares awarded could range between 0% to 200% of the initial grant of the PSP shares.
(ii) PSP share awards will vest based on meeting stated performance conditions over a three-year performance period.
Information with respect to the number of shares granted under the PSP is as follows:
Shares Grant Date
Balance as at1.10.2015 or Grant
Date if later Cancelled Achievement
Factor Vested Balance as at
30.9.2016 Year 4 14.12.2012 68,158 - (20,358) (47,800) -Year 5 01.10.2014 32,546 - - - 32,546Year 6 06.05.2015 40,500 (10,000) - - 30,500Year 7 26.02.2016 84,383 - - - 84,383
225,587^ (10,000)* (20,358) (47,800) 147,429
^ This takes into account the adjustments made on 7 October 2014 following F&N’s distribution to its shareholders by way of dividend in specie and a capital reduction undertaken by F&N during the financial year ended 30 September 2014.
* Cancelled due to resignations.
The expense recognised in profit statement granted under the PSP during the financial year is $87,000 (2015: $234,000).
146 Fra s e r a n d N ea v e , L i m i t e d & S u b s i d i a r y C o m pa n i e sA n n u a l R e p o r t 2 0 1 6

A n n u a l R e p o r t 2 0 1 6
F r a s e r a n d N e a v e , L i m i t e d & S u b s i d i a r y C o m p a n i e s
NOTES TO THE FINANCIAL STATEMENTS For the year ended 30 September 2016
1 4 6
29. PROVISION FOR EMPLOYEE BENEFITS (cont’d)
(e) Share Plans (cont’d)
Fraser and Neave Limited Restricted Share Plan ("RSP") (cont’d) Information with respect to the number of shares granted under the RSP is as follows:
Shares Grant Date
Balance as at1.10.2015 or Grant
Date if later Cancelled Achievement
Factor Vested Balance as at
30.9.2016 Year 3 14.12.2011 510,974 - - (510,974) -Year 4 14.12.2012 817,250 (6,275) - (408,625) 402,350Year 5 01.10.2014 1,013,675 (11,500) 100,825 (557,250) 545,750Year 6 06.05.2015 1,055,300 (70,500) - - 984,800Year 7 26.02.2016 1,255,976 (25,500) - - 1,230,476
4,653,175^ (113,775)* 100,825 (1,476,849) 3,163,376
^ This takes into account the adjustments made on 7 October 2014 following F&N’s distribution to its shareholders by way of dividend in specie and a capital reduction undertaken by F&N during the financial year ended 30 September 2014.
* Cancelled due to resignations.
The expense recognised in profit statement granted under the RSP during the financial year is $2,815,000 (2015: $2,916,000).
The estimated fair value of shares granted during the year ranges from $1.79 to $1.87 (2015: $2.56 to $2.69). The fair value of equity-settled contingent award of shares are determined using Monte Carlo Valuation Model, which involves projection of future outcomes using statistical distributions of key random variables including share price and volatility of returns. The inputs to the model used are as follows:
2016 2015 Dividend yield (%) 2.5 2.3Expected volatility (%) 21.0 21.3Risk-free interest rate (%) 1.1 to 1.5 1.1 to 1.5Expected life (years) 1.9 to 3.9 1.7 to 3.7Share price at date of grant ($) 1.97 2.79
Fraser and Neave Limited Performance Share Plan ("PSP") The PSP is a share-based incentive plan for senior executives and key senior management, which were approved by shareholders of the Company at an Extraordinary General Meeting held on 22 January 2009.
Information regarding the PSP (i) Depending on the level of achievement of pre-determined targets over a three-year performance period, the final
number of PSP shares awarded could range between 0% to 200% of the initial grant of the PSP shares.
(ii) PSP share awards will vest based on meeting stated performance conditions over a three-year performance period.
Information with respect to the number of shares granted under the PSP is as follows:
Shares Grant Date
Balance as at1.10.2015 or Grant
Date if later Cancelled Achievement
Factor Vested Balance as at
30.9.2016 Year 4 14.12.2012 68,158 - (20,358) (47,800) -Year 5 01.10.2014 32,546 - - - 32,546Year 6 06.05.2015 40,500 (10,000) - - 30,500Year 7 26.02.2016 84,383 - - - 84,383
225,587^ (10,000)* (20,358) (47,800) 147,429
^ This takes into account the adjustments made on 7 October 2014 following F&N’s distribution to its shareholders by way of dividend in specie and a capital reduction undertaken by F&N during the financial year ended 30 September 2014.
* Cancelled due to resignations.
The expense recognised in profit statement granted under the PSP during the financial year is $87,000 (2015: $234,000).
F r a s e r a n d N e a v e , L i m i t e d & S u b s i d i a r y C o m p a n i e s
NOTES TO THE FINANCIAL STATEMENTSFor the year ended 30 September 2016
A n n u a l R e p o r t 2 0 1 6 1 4 7
29. PROVISION FOR EMPLOYEE BENEFITS (cont’d)
(e) Share Plans (cont’d)
Fraser and Neave Limited Performance Share Plan ("PSP") (cont’d) The estimated fair value of shares granted during the year ranges from $1.50 to $1.95 (2015: $1.32 to $2.63). The fair value of equity-settled contingent award of shares are determined using Monte Carlo Valuation Model, which involves projection of future outcomes using statistical distributions of key random variables including share price and volatility of returns. The inputs to the model used are as follows:
2016 2015 Dividend yield (%) 2.5 2.3Expected volatility (%) 21.0 21.3Cost of equity (%) 9.9 7.9Risk-free interest rate (%) 1.2 1.3Expected life (years) 2.8 2.7Share price at date of grant ($) 1.97 2.79
F&NHB Restricted Share Plan ("F&NHB RSP") The F&NHB RSP is a share-based incentive plan for senior executives and key senior management, which was approved by shareholders of F&NHB at an Extraordinary General Meeting held on 13 January 2012.
Information regarding the F&NHB RSP (i) Depending on the achievement of pre-determined targets over a two-year performance period, the final number
of RSP shares awarded could range between 0% to 150% of the initial grant of the RSP shares.
(ii) Based on meeting stated performance conditions over a two-year performance period, 50% of the F&NHB RSP awards will vest. The balance will vest equally over the subsequent two years with fulfillment of service requirements.
Information with respect to the number of shares granted under the F&NHB RSP is as follows:
Shares Grant Date
Balance as at 1.10.2015or Grant
Date if later Cancelled Achievement
Factor Vested Balance as at
30.9.2016 Year 1 15.03.2012 43,225 - - (43,225) -Year 2 07.02.2013 170,750 (675) - (85,800) 84,275Year 3 12.08.2014 574,200 (2,900) 31,000 (302,600) 299,700Year 4 15.01.2015 546,700 (29,100) - - 517,600Year 5 05.01.2016 596,500 - - - 596,500
1,931,375 (32,675)* 31,000 (431,625) 1,498,075
* Cancelled due to resignations.
The estimated fair value of shares granted during the year ranges from RM15.36 to RM16.80 (2015: RM16.01 to RM16.80). The fair value of equity-settled contingent award of shares are determined using Monte Carlo Valuation Model, which involves projection of future outcomes using statistical distributions of key random variables including share price and volatility of returns. The inputs to the model used are as follows:
2016 2015 Dividend yield (%) 3.6 4.0Expected volatility (%) 8.4 19.2Risk-free interest rate (%) 3.0 to 3.5 2.9 to 3.3Expected life (years) 2.0 to 4.0 1.8 to 3.8Share price at date of grant (RM) 18.50 18.06
147Fra s e r a n d N ea v e , L i m i t e d & S u b s i d i a r y C o m pa n i e s A n n u a l R e p o r t 2 0 1 6
A n n u a l R e p o r t 2 0 1 6
F r a s e r a n d N e a v e , L i m i t e d & S u b s i d i a r y C o m p a n i e s
NOTES TO THE FINANCIAL STATEMENTS For the year ended 30 September 2016
1 4 8
29. PROVISION FOR EMPLOYEE BENEFITS (cont’d)
(e) Share Plans (cont’d)
F&NHB Performance Share Plan ("F&NHB PSP") The F&NHB PSP is a share-based incentive plan for senior executives and key senior management, which was approved by shareholders of F&NHB at an Extraordinary General Meeting held on 13 January 2012.
Information regarding the F&NHB PSP (i) Depending on the achievement of pre-determined targets over a three-year performance period, the final number
of PSP shares awarded could range between 0% to 200% of the initial grant of the PSP shares.
(ii) PSP share awards will vest based on meeting stated performance conditions over a three-year performance period.
As at 30 September 2016, no share has been granted under F&NHB PSP.
30. DEFERRED TAX ASSETS AND LIABILITIES
THE GROUP THE COMPANY Balance Sheet Profit Statement Balance Sheet
2016
($'000)2015
($'000)2016
($'000)2015
($'000) 2016
($'000) 2015
($'000) Deferred tax liabilities Differences in depreciation 16,220 15,956 (222) (5,785) - -Provisions, expenses and
income taken in a different period 1,253 1,811 (338) (415) - -
Fair value adjustments 2,461 2,348 65 (699) 185 114Other deferred tax liabilities 856 409 (47) (16) - -Gross deferred tax liabilities 20,790 20,524 (542) (6,915) 185 114 Less: Deferred tax assets Employee benefits (778) (859) 98 88 - -Unabsorbed losses and
capital allowances 122 (5) (98) 192 - - Provisions, expenses and
income taken in a different period (616) (521) (84) 632 - -
Gross deferred tax assets (1,272) (1,385) (84) 912 - - Net deferred tax liabilities 19,518 19,139 (626) (6,003) 185 114
Some subsidiary companies have net deferred tax assets relating to the following:
Employee benefits (1,639) (2,081) 472 (79) - -Differences in depreciation 11,218 10,129 1,132 (517) - -Unabsorbed losses and
capital allowances 5,062 5,695 303 2,201 - - Provisions (8,604) (8,912) (521) (24) - -Investment allowances (19,259) (22,458) 3,895 4,136 - -Fair value adjustments (45) (529) 590 (1,689) - - Net deferred tax assets (13,267) (18,156) 5,871 4,028 - -
The deferred tax charge relating to fair value adjustment in other comprehensive income during the year is $525,000 (2015: $143,000).
Deferred tax liabilities of $1,285,000 (2015: $322,000) have not been recognised in the consolidated financial statements for withholding and other taxes that would be payable on the unremitted earnings of $7,559,000 at 30 September 2016 (2015: $1,895,000).
148 Fra s e r a n d N ea v e , L i m i t e d & S u b s i d i a r y C o m pa n i e sA n n u a l R e p o r t 2 0 1 6

A n n u a l R e p o r t 2 0 1 6
F r a s e r a n d N e a v e , L i m i t e d & S u b s i d i a r y C o m p a n i e s
NOTES TO THE FINANCIAL STATEMENTS For the year ended 30 September 2016
1 4 8
29. PROVISION FOR EMPLOYEE BENEFITS (cont’d)
(e) Share Plans (cont’d)
F&NHB Performance Share Plan ("F&NHB PSP") The F&NHB PSP is a share-based incentive plan for senior executives and key senior management, which was approved by shareholders of F&NHB at an Extraordinary General Meeting held on 13 January 2012.
Information regarding the F&NHB PSP (i) Depending on the achievement of pre-determined targets over a three-year performance period, the final number
of PSP shares awarded could range between 0% to 200% of the initial grant of the PSP shares.
(ii) PSP share awards will vest based on meeting stated performance conditions over a three-year performance period.
As at 30 September 2016, no share has been granted under F&NHB PSP.
30. DEFERRED TAX ASSETS AND LIABILITIES
THE GROUP THE COMPANY Balance Sheet Profit Statement Balance Sheet
2016
($'000)2015
($'000)2016
($'000)2015
($'000) 2016
($'000) 2015
($'000) Deferred tax liabilities Differences in depreciation 16,220 15,956 (222) (5,785) - -Provisions, expenses and
income taken in a different period 1,253 1,811 (338) (415) - -
Fair value adjustments 2,461 2,348 65 (699) 185 114Other deferred tax liabilities 856 409 (47) (16) - -Gross deferred tax liabilities 20,790 20,524 (542) (6,915) 185 114 Less: Deferred tax assets Employee benefits (778) (859) 98 88 - -Unabsorbed losses and
capital allowances 122 (5) (98) 192 - - Provisions, expenses and
income taken in a different period (616) (521) (84) 632 - -
Gross deferred tax assets (1,272) (1,385) (84) 912 - - Net deferred tax liabilities 19,518 19,139 (626) (6,003) 185 114
Some subsidiary companies have net deferred tax assets relating to the following:
Employee benefits (1,639) (2,081) 472 (79) - -Differences in depreciation 11,218 10,129 1,132 (517) - -Unabsorbed losses and
capital allowances 5,062 5,695 303 2,201 - - Provisions (8,604) (8,912) (521) (24) - -Investment allowances (19,259) (22,458) 3,895 4,136 - -Fair value adjustments (45) (529) 590 (1,689) - - Net deferred tax assets (13,267) (18,156) 5,871 4,028 - -
The deferred tax charge relating to fair value adjustment in other comprehensive income during the year is $525,000 (2015: $143,000).
Deferred tax liabilities of $1,285,000 (2015: $322,000) have not been recognised in the consolidated financial statements for withholding and other taxes that would be payable on the unremitted earnings of $7,559,000 at 30 September 2016 (2015: $1,895,000).
F r a s e r a n d N e a v e , L i m i t e d & S u b s i d i a r y C o m p a n i e s
NOTES TO THE FINANCIAL STATEMENTSFor the year ended 30 September 2016
A n n u a l R e p o r t 2 0 1 6 1 4 9
30. DEFERRED TAX ASSETS AND LIABILITIES (cont’d) Deferred tax liabilities of $46,000 (2015: $46,000) have not been recognised in the consolidated financial statements for withholding and other taxes that would be payable on the undistributed earnings of $458,000 at 30 September 2016 (2015: $456,000) of certain of the Group's subsidiary companies as the Group has determined that the undistributed earnings of its subsidiary companies will not be distributed in the foreseeable future.
Deferred tax assets have not been recognised in respect of the following items:
THE GROUP
2016
($'000) 2015
($'000) Deductible temporary differences 32,404 29,855Tax losses 132,568 136,665 164,972 166,520
Tax losses of $90,920,000 (2015: $94,701,000) expire in 2027. The remaining tax losses and the deductible temporary differences do not expire under current tax legislation. Deferred tax assets have not been recognised in respect of these items because it is not probable that future taxable profit will be available against which the Group can utilise the benefits therefrom.
31. FUTURE COMMITMENTS Commitments not provided for in the financial statements: (a) Commitments in respect of contracts placed Fixed assets 17,482 14,444 (b) Other amounts approved by directors but not contracted for Fixed assets 94,096 12,780 Total 111,578 27,224 6B32. 7BLEASE COMMITMENTS
11BOperating Leases Lease commitments under non-cancellable operating leases where the Group is a lessee: Payable within one year 9,905 13,664 Payable between one and five years 17,102 20,642 Payable after five years 28,191 27,072 55,198 61,378
Operating lease expense for the year 20,065 21,811
The operating leases do not contain any escalation clauses and do not provide for contingent rents. Lease terms do not contain restrictions on the Group activities concerning dividends, additional debts or entering into other leasing agreements.
Lease commitments under non-cancellable operating leases where the Group is a lessor:
Receivable within one year 723 165Receivable between one and five years 301 - 1,024 165
Finance Leases Lease commitments under non-cancellable finance leases where the Group is a lessee:
THE GROUP
2016
($'000) 2015
($'000)
Minimum lease
payments
Present value of
payments
Minimum lease
payments
Present value of
payments
Minimum lease payments due: Payable within one year 567 535 14 12Payable between one and five years 214 200 26 25Total minimum lease payments 781 735 40 37Less: Future finance charges Payable within one year (32) - (2) -Payable between one and five years (14) - (1) - (46) - (3) - 735 735 37 37
The finance leases do not contain any escalation clauses and do not provide for contingent rents. Lease terms do not contain restrictions on the Group activities concerning dividends, additional debts or entering into other leasing agreements.
149Fra s e r a n d N ea v e , L i m i t e d & S u b s i d i a r y C o m pa n i e s A n n u a l R e p o r t 2 0 1 6

A n n u a l R e p o r t 2 0 1 6
F r a s e r a n d N e a v e , L i m i t e d & S u b s i d i a r y C o m p a n i e s
NOTES TO THE FINANCIAL STATEMENTS For the year ended 30 September 2016
1 5 0
33. SIGNIFICANT RELATED PARTY TRANSACTIONS For the purposes of these financial statements, parties are considered to be related to the Group if the Group has the direct and indirect ability to control the party, jointly control or exercise significant influence over the party in making financial and operating decisions, or vice versa, or where the Group and the party are subject to common control or common significant influence. Related parties may be individuals or other entities.
In addition to the information disclosed elsewhere in the financial statements, the following were the significant related party transactions entered into between the Group and related parties based on agreed fees or terms between the parties.
THE GROUP
2016
($'000) 2015
($'000) (a) Transactions with TCC Group of Companies Sales 3,597 5,188 Corporate service recoveries 1,238 1,655 Management fee income - 1,245 Advertising & promotion support 2,578 - Service fee and other income 2,105 - Purchases (27,109) (32,670) Marketing expense (4,866) (6,794) Insurance premium expense (1,339) (1,285) Management fee expense (674) (590) Payment for intangible assets (200) - Rental and other expenses (4,566) (4,355) (b) Transactions with Joint Operation and Associated Companies Sales 1,019 1,272 Receipt of corporate service fees 184 364 Rental income - 33 Finance income 1,916 1,960 Purchases (5,766) (5,315) Shareholder's loan granted - (2,450)
34. CONTINGENT LIABILITIES The Company issued corporate guarantees to the extent of $2,460,978,000 (2015: $2,407,680,000) for the purpose of assisting its subsidiary companies to obtain external borrowings. Of the $2,460,978,000 (2015: $2,407,680,000) corporate guarantees given by the Company, $Nil (2015: $Nil) has been utilised by its subsidiary companies as security for its borrowings.
35. FINANCIAL RISK MANAGEMENT The Group and the Company are exposed to financial risks, including primarily the effects of changes in currency exchange rates and interest rates and use derivatives and other instruments in connection with their risk management activities. The Group and the Company do not hold or issue derivative financial instruments for trading purposes.
The Group has established processes to monitor and control hedging transactions in a timely and accurate manner.
These policies are reviewed regularly by the Audit Committee to ensure that the Group's policies and guidelines are adhered to. The Group's accounting policies in relation to derivatives are set out in Note 2.
150 Fra s e r a n d N ea v e , L i m i t e d & S u b s i d i a r y C o m pa n i e sA n n u a l R e p o r t 2 0 1 6
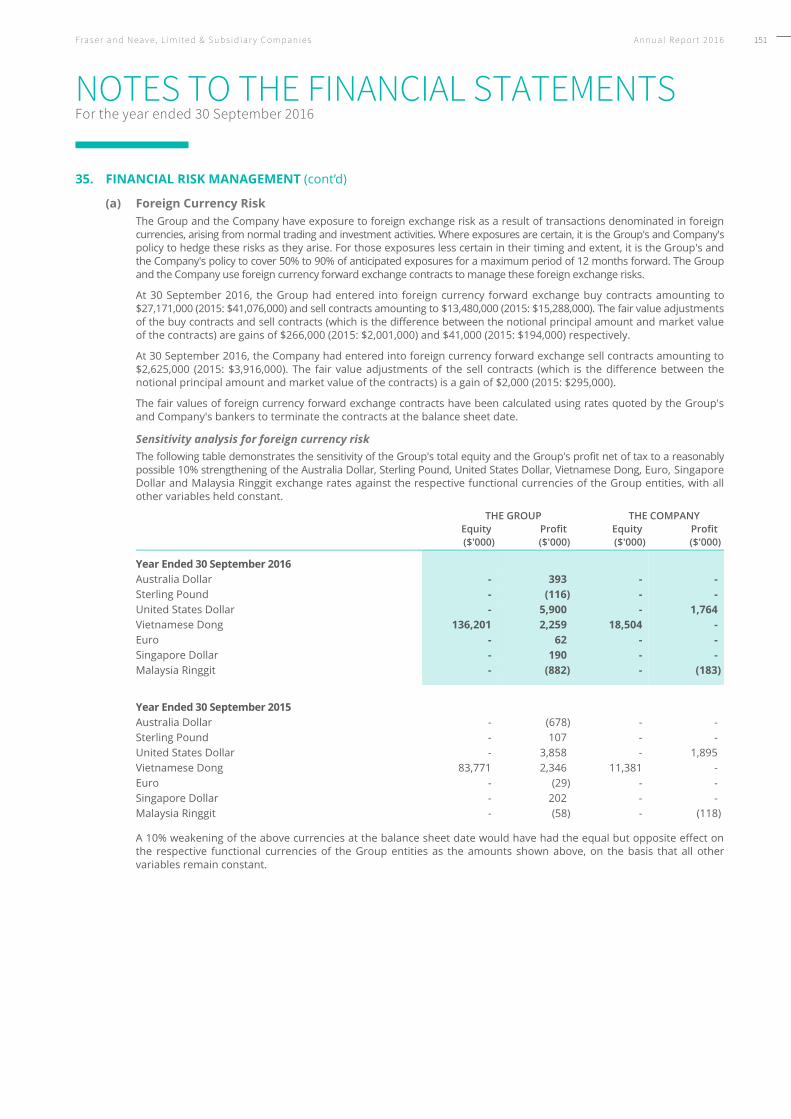
A n n u a l R e p o r t 2 0 1 6
F r a s e r a n d N e a v e , L i m i t e d & S u b s i d i a r y C o m p a n i e s
NOTES TO THE FINANCIAL STATEMENTS For the year ended 30 September 2016
1 5 0
33. SIGNIFICANT RELATED PARTY TRANSACTIONS For the purposes of these financial statements, parties are considered to be related to the Group if the Group has the direct and indirect ability to control the party, jointly control or exercise significant influence over the party in making financial and operating decisions, or vice versa, or where the Group and the party are subject to common control or common significant influence. Related parties may be individuals or other entities.
In addition to the information disclosed elsewhere in the financial statements, the following were the significant related party transactions entered into between the Group and related parties based on agreed fees or terms between the parties.
THE GROUP
2016
($'000) 2015
($'000) (a) Transactions with TCC Group of Companies Sales 3,597 5,188 Corporate service recoveries 1,238 1,655 Management fee income - 1,245 Advertising & promotion support 2,578 - Service fee and other income 2,105 - Purchases (27,109) (32,670) Marketing expense (4,866) (6,794) Insurance premium expense (1,339) (1,285) Management fee expense (674) (590) Payment for intangible assets (200) - Rental and other expenses (4,566) (4,355) (b) Transactions with Joint Operation and Associated Companies Sales 1,019 1,272 Receipt of corporate service fees 184 364 Rental income - 33 Finance income 1,916 1,960 Purchases (5,766) (5,315) Shareholder's loan granted - (2,450)
34. CONTINGENT LIABILITIES The Company issued corporate guarantees to the extent of $2,460,978,000 (2015: $2,407,680,000) for the purpose of assisting its subsidiary companies to obtain external borrowings. Of the $2,460,978,000 (2015: $2,407,680,000) corporate guarantees given by the Company, $Nil (2015: $Nil) has been utilised by its subsidiary companies as security for its borrowings.
35. FINANCIAL RISK MANAGEMENT The Group and the Company are exposed to financial risks, including primarily the effects of changes in currency exchange rates and interest rates and use derivatives and other instruments in connection with their risk management activities. The Group and the Company do not hold or issue derivative financial instruments for trading purposes.
The Group has established processes to monitor and control hedging transactions in a timely and accurate manner.
These policies are reviewed regularly by the Audit Committee to ensure that the Group's policies and guidelines are adhered to. The Group's accounting policies in relation to derivatives are set out in Note 2.
F r a s e r a n d N e a v e , L i m i t e d & S u b s i d i a r y C o m p a n i e s
NOTES TO THE FINANCIAL STATEMENTSFor the year ended 30 September 2016
A n n u a l R e p o r t 2 0 1 6 1 5 1
35. FINANCIAL RISK MANAGEMENT (cont’d)
(a) Foreign Currency Risk The Group and the Company have exposure to foreign exchange risk as a result of transactions denominated in foreign currencies, arising from normal trading and investment activities. Where exposures are certain, it is the Group's and Company's policy to hedge these risks as they arise. For those exposures less certain in their timing and extent, it is the Group's and the Company's policy to cover 50% to 90% of anticipated exposures for a maximum period of 12 months forward. The Group and the Company use foreign currency forward exchange contracts to manage these foreign exchange risks.
At 30 September 2016, the Group had entered into foreign currency forward exchange buy contracts amounting to $27,171,000 (2015: $41,076,000) and sell contracts amounting to $13,480,000 (2015: $15,288,000). The fair value adjustments of the buy contracts and sell contracts (which is the difference between the notional principal amount and market value of the contracts) are gains of $266,000 (2015: $2,001,000) and $41,000 (2015: $194,000) respectively.
At 30 September 2016, the Company had entered into foreign currency forward exchange sell contracts amounting to $2,625,000 (2015: $3,916,000). The fair value adjustments of the sell contracts (which is the difference between the notional principal amount and market value of the contracts) is a gain of $2,000 (2015: $295,000).
The fair values of foreign currency forward exchange contracts have been calculated using rates quoted by the Group's and Company's bankers to terminate the contracts at the balance sheet date.
Sensitivity analysis for foreign currency risk The following table demonstrates the sensitivity of the Group's total equity and the Group's profit net of tax to a reasonably possible 10% strengthening of the Australia Dollar, Sterling Pound, United States Dollar, Vietnamese Dong, Euro, Singapore Dollar and Malaysia Ringgit exchange rates against the respective functional currencies of the Group entities, with all other variables held constant.
THE GROUP THE COMPANY
Equity($'000)
Profit ($'000)
Equity ($'000)
Profit($'000)
Year Ended 30 September 2016 Australia Dollar - 393 - -Sterling Pound - (116) - -United States Dollar - 5,900 - 1,764Vietnamese Dong 136,201 2,259 18,504 -Euro - 62 - -Singapore Dollar - 190 - -Malaysia Ringgit - (882) - (183) Year Ended 30 September 2015 Australia Dollar - (678) - -Sterling Pound - 107 - -United States Dollar - 3,858 - 1,895Vietnamese Dong 83,771 2,346 11,381 -Euro - (29) - -Singapore Dollar - 202 - -Malaysia Ringgit - (58) - (118)
A 10% weakening of the above currencies at the balance sheet date would have had the equal but opposite effect on the respective functional currencies of the Group entities as the amounts shown above, on the basis that all other variables remain constant.
151Fra s e r a n d N ea v e , L i m i t e d & S u b s i d i a r y C o m pa n i e s A n n u a l R e p o r t 2 0 1 6

A n n u a l R e p o r t 2 0 1 6
F r a s e r a n d N e a v e , L i m i t e d & S u b s i d i a r y C o m p a n i e s
NOTES TO THE FINANCIAL STATEMENTS For the year ended 30 September 2016
1 5 2
35. FINANCIAL RISK MANAGEMENT (cont’d)
(b) Liquidity Risk The Group's and the Company's exposure to liquidity risk arises in the general funding of the Group's and the Company's business activities. It includes the risks of being able to fund business activities in a timely manner.
The Group adopts a prudent approach to managing its liquidity risk. The Group maintains sufficient cash and marketable securities, and have available funding through diverse sources of committed and uncommitted credit facilities from various banks.
The table below analyses the maturity profile of the Group’s and Company’s financial assets and liabilities (including derivative financial instruments) based on contractual undiscounted cash flows.
Cash Flows
Carrying amount
($'000)
Contractual cash flow
($'000)
Less than 1 year ($'000)
Between 1 and 5
years ($'000)
Over 5 years
($'000) The Group Year Ended 30 September 2016 Financial Assets Trade receivables 267,178 267,178 267,178 - -Other receivables (excluding derivative
financial instruments) 30,286 30,286 29,671 615 -Derivative financial instruments 549 549 549 - -Related parties 4,565 4,565 4,565 - -Joint venture companies 48,631 48,631 558 - 48,073Associated companies 3 3 3 - -Bank fixed deposits 566,182 566,734 563,834 2,900 -Cash and bank balances 479,347 482,601 482,601 - - 1,396,741 1,400,547 1,348,959 3,515 48,073 Financial Liabilities Trade payables 180,548 180,548 180,548 - -Other payables (excluding derivative
financial instruments) 203,287 203,346 200,446 2,900 -Derivative financial instruments 242 242 242 - -Borrowings 137,048 147,084 17,332 129,355 397Related parties 13,915 13,915 12,650 1,265 -Associated companies 1,565 1,565 1,565 - - 536,605 546,700 412,783 133,520 397 Total net undiscounted financial
assets/(liabilities) 853,847 936,176 (130,005) 47,676
152 Fra s e r a n d N ea v e , L i m i t e d & S u b s i d i a r y C o m pa n i e sA n n u a l R e p o r t 2 0 1 6

A n n u a l R e p o r t 2 0 1 6
F r a s e r a n d N e a v e , L i m i t e d & S u b s i d i a r y C o m p a n i e s
NOTES TO THE FINANCIAL STATEMENTS For the year ended 30 September 2016
1 5 2
35. FINANCIAL RISK MANAGEMENT (cont’d)
(b) Liquidity Risk The Group's and the Company's exposure to liquidity risk arises in the general funding of the Group's and the Company's business activities. It includes the risks of being able to fund business activities in a timely manner.
The Group adopts a prudent approach to managing its liquidity risk. The Group maintains sufficient cash and marketable securities, and have available funding through diverse sources of committed and uncommitted credit facilities from various banks.
The table below analyses the maturity profile of the Group’s and Company’s financial assets and liabilities (including derivative financial instruments) based on contractual undiscounted cash flows.
Cash Flows
Carrying amount
($'000)
Contractual cash flow
($'000)
Less than 1 year ($'000)
Between 1 and 5
years ($'000)
Over 5 years
($'000) The Group Year Ended 30 September 2016 Financial Assets Trade receivables 267,178 267,178 267,178 - -Other receivables (excluding derivative
financial instruments) 30,286 30,286 29,671 615 -Derivative financial instruments 549 549 549 - -Related parties 4,565 4,565 4,565 - -Joint venture companies 48,631 48,631 558 - 48,073Associated companies 3 3 3 - -Bank fixed deposits 566,182 566,734 563,834 2,900 -Cash and bank balances 479,347 482,601 482,601 - - 1,396,741 1,400,547 1,348,959 3,515 48,073 Financial Liabilities Trade payables 180,548 180,548 180,548 - -Other payables (excluding derivative
financial instruments) 203,287 203,346 200,446 2,900 -Derivative financial instruments 242 242 242 - -Borrowings 137,048 147,084 17,332 129,355 397Related parties 13,915 13,915 12,650 1,265 -Associated companies 1,565 1,565 1,565 - - 536,605 546,700 412,783 133,520 397 Total net undiscounted financial
assets/(liabilities) 853,847 936,176 (130,005) 47,676
F r a s e r a n d N e a v e , L i m i t e d & S u b s i d i a r y C o m p a n i e s
NOTES TO THE FINANCIAL STATEMENTSFor the year ended 30 September 2016
A n n u a l R e p o r t 2 0 1 6 1 5 3
35. FINANCIAL RISK MANAGEMENT (cont’d)
(b) Liquidity Risk (cont’d)
Cash Flows
Carryingamount
($'000)
Contractual cash flow
($'000)
Less than 1 year ($'000)
Between 1 and 5
years ($'000)
Over 5 years
($'000) The Group Year Ended 30 September 2015 Financial Assets Trade receivables 278,792 278,792 278,792 - -Other receivables (excluding derivative
financial instruments) 31,696 31,696 31,294 402 -Derivative financial instruments 2,533 2,533 2,533 - -Related parties 1,742 1,742 1,742 - -Joint venture companies 45,991 45,991 756 - 45,235Associated companies 3,403 3,403 3,403 - -Bank fixed deposits 450,336 454,693 450,781 3,912 -Cash and bank balances 515,243 517,120 517,120 - - 1,329,736 1,335,970 1,286,421 4,314 45,235 Financial Liabilities Trade payables 201,113 201,113 201,113 - -Other payables (excluding derivative
financial instruments) 184,783 184,974 181,062 3,912 -Derivative financial instruments 338 338 338 - -Borrowings 100,475 114,217 7,839 106,202 176Related parties 15,788 15,788 14,523 1,265 -Associated companies 1,843 1,843 1,843 - - 504,340 518,273 406,718 111,379 176 Total net undiscounted financial
assets/(liabilities) 817,697 879,703 (107,065) 45,059
153Fra s e r a n d N ea v e , L i m i t e d & S u b s i d i a r y C o m pa n i e s A n n u a l R e p o r t 2 0 1 6

A n n u a l R e p o r t 2 0 1 6
F r a s e r a n d N e a v e , L i m i t e d & S u b s i d i a r y C o m p a n i e s
NOTES TO THE FINANCIAL STATEMENTS For the year ended 30 September 2016
1 5 4
35. FINANCIAL RISK MANAGEMENT (cont’d)
(b) Liquidity Risk (cont’d)
Cash Flows
Carrying amount
($'000)
Contractualcash flow
($'000)
Less than 1 year ($'000)
Between 1 and 5
years ($'000)
Over 5 years
($'000) The Company Year Ended 30 September 2016 Financial Assets Other receivables (excluding derivative
financial instruments) 854 854 854 - -Derivative financial instruments 22 22 22 - -Subsidiary companies 230,142 230,153 13,916 216,237 -Related parties 6 6 6 - -Bank fixed deposits 231,018 231,235 231,235 - -Cash and bank balances 270,726 273,933 273,933 - - 732,768 736,203 519,966 216,237 -Financial Liabilities Other payables (excluding derivative
financial instruments) 7,403 7,403 7,403 - -Derivative financial instruments 20 20 20 - -Subsidiary companies 108,364 108,364 6,470 101,894 -Related parties 1,286 1,286 21 1,265 - 117,073 117,073 13,914 103,159 - Total net undiscounted financial assets 619,130 506,052 113,078 - Year Ended 30 September 2015 Financial Assets Other receivables (excluding derivative
financial instruments) 574 574 574 - -Derivative financial instruments 295 295 295 - -Subsidiary companies 155,826 155,934 5,755 150,179 -Bank fixed deposits 276,978 281,143 281,143 - -Cash and bank balances 261,494 263,295 263,295 - - 695,167 701,241 551,062 150,179 -Financial Liabilities Other payables 10,312 10,312 10,312 - -Subsidiary companies 95,789 95,789 692 95,097 -Related parties 1,265 1,265 - 1,265 - 107,366 107,366 11,004 96,362 - Total net undiscounted financial assets 593,875 540,058 53,817 -
154 Fra s e r a n d N ea v e , L i m i t e d & S u b s i d i a r y C o m pa n i e sA n n u a l R e p o r t 2 0 1 6

A n n u a l R e p o r t 2 0 1 6
F r a s e r a n d N e a v e , L i m i t e d & S u b s i d i a r y C o m p a n i e s
NOTES TO THE FINANCIAL STATEMENTS For the year ended 30 September 2016
1 5 4
35. FINANCIAL RISK MANAGEMENT (cont’d)
(b) Liquidity Risk (cont’d)
Cash Flows
Carrying amount
($'000)
Contractualcash flow
($'000)
Less than 1 year ($'000)
Between 1 and 5
years ($'000)
Over 5 years
($'000) The Company Year Ended 30 September 2016 Financial Assets Other receivables (excluding derivative
financial instruments) 854 854 854 - -Derivative financial instruments 22 22 22 - -Subsidiary companies 230,142 230,153 13,916 216,237 -Related parties 6 6 6 - -Bank fixed deposits 231,018 231,235 231,235 - -Cash and bank balances 270,726 273,933 273,933 - - 732,768 736,203 519,966 216,237 -Financial Liabilities Other payables (excluding derivative
financial instruments) 7,403 7,403 7,403 - -Derivative financial instruments 20 20 20 - -Subsidiary companies 108,364 108,364 6,470 101,894 -Related parties 1,286 1,286 21 1,265 - 117,073 117,073 13,914 103,159 - Total net undiscounted financial assets 619,130 506,052 113,078 - Year Ended 30 September 2015 Financial Assets Other receivables (excluding derivative
financial instruments) 574 574 574 - -Derivative financial instruments 295 295 295 - -Subsidiary companies 155,826 155,934 5,755 150,179 -Bank fixed deposits 276,978 281,143 281,143 - -Cash and bank balances 261,494 263,295 263,295 - - 695,167 701,241 551,062 150,179 -Financial Liabilities Other payables 10,312 10,312 10,312 - -Subsidiary companies 95,789 95,789 692 95,097 -Related parties 1,265 1,265 - 1,265 - 107,366 107,366 11,004 96,362 - Total net undiscounted financial assets 593,875 540,058 53,817 -
F r a s e r a n d N e a v e , L i m i t e d & S u b s i d i a r y C o m p a n i e s
NOTES TO THE FINANCIAL STATEMENTSFor the year ended 30 September 2016
A n n u a l R e p o r t 2 0 1 6 1 5 5
35. FINANCIAL RISK MANAGEMENT (cont’d)
(c) Credit Risk At the balance sheet date, the Group's and the Company's total exposure to credit risk in the event that the counterparties fail to perform their obligations is represented by the carrying amount of each class of financial assets recognised in the balance sheets, including derivatives with positive fair values.
Credit risk concentration profile The Group determines concentrations of credit risk by monitoring the country and business segment profile of its trade receivables on an ongoing basis. The credit risk concentration profile of the Group's trade receivables at the balance sheet date is as follows:
THE GROUP 2016 2015
($'000) % of total ($'000) % of total By Geographical Segment: Singapore 92,747 35% 93,810 33%Malaysia 104,793 39% 108,411 39%Other ASEAN 49,621 19% 52,335 19%North/South Asia 19,233 7% 22,676 8%Outside Asia 784 0% 1,560 1% 267,178 100% 278,792 100% By Business Segment: Beverages 67,941 25% 68,077 24%Dairies 128,252 48% 133,265 48%Printing & Publishing 70,977 27% 77,441 28%Others 8 0% 9 0% 267,178 100% 278,792 100%
The Group and the Company have no significant concentration of credit risk. The Group and the Company have policies in place to monitor its credit risk. Sales of products and services are made to customers with an appropriate credit history. Contractual deposits are collected and scheduled progress payments are received from the buyers when due.
Cash and fixed deposits are placed in banks and financial institutions which are regulated. The Group limits its credit risk exposure in respect of investments by only investing in liquid securities and only with counterparties that have a sound credit rating. Management does not expect any counterparty to fail to meet its obligations.
Information regarding financial assets that are either past due or impaired and ageing analysis is disclosed in Note 24. Management believes that no additional credit risk beyond that provided for is inherent in the Group's trade and other receivables.
With respect to derivative financial instruments, credit risk arises from the potential failure of counterparties to meet their obligations under the contract or arrangement. The Group's total credit risk exposure for foreign exchange contracts are limited to the fair value adjustments of these contracts. It is the Group's and the Company's policy to enter into financial instruments with a diversity of credit worthy counterparties. The Group and the Company do not expect to incur material credit losses on their financial assets or other financial instruments.
The Group and the Company do not have significant exposure to any individual customer or counterparty.
155Fra s e r a n d N ea v e , L i m i t e d & S u b s i d i a r y C o m pa n i e s A n n u a l R e p o r t 2 0 1 6

A n n u a l R e p o r t 2 0 1 6
F r a s e r a n d N e a v e , L i m i t e d & S u b s i d i a r y C o m p a n i e s
NOTES TO THE FINANCIAL STATEMENTS For the year ended 30 September 2016
1 5 6
35. FINANCIAL RISK MANAGEMENT (cont’d)
(d) Interest Rate Risk The Group's exposure to market risk for changes in interest rates relate primarily to debt obligation with financial institutions. The Group's policy is to manage interest cost using a mix of fixed and variable rate debts, and interest rate economic effect of converting borrowings from fixed rates to variable rates or vice versa.
The following table sets out the carrying amount, by maturity, of the Group's and the Company's financial instruments that are exposed to interest rate risk:
Floating rates Fixed rates
($'000)
Less than 1 year ($'000)
Between 1 to 5 years ($'000)
After 5 years
($'000) The Group Year Ended 30 September 2016 Assets Cash and bank deposits 2,174 933,680 2,900 -
Liabilities Borrowings 2,376 10,967 123,705 -Other financial liabilities - 3,955 2,900 - Year Ended 30 September 2015 Assets Cash and bank deposits 215 853,145 3,874 - Liabilities Borrowings 3,007 603 96,865 -Other financial liabilities - - 3,874 - The Company Year Ended 30 September 2016 Assets Cash and bank deposits - 499,505 - - Year Ended 30 September 2015 Assets Cash and bank deposits - 538,319 - -
Interest on financial instruments classified as floating rate is repriced at intervals of less than one year. Interest on financial instruments classified as fixed rate is fixed until the maturity of the instrument. The other financial instruments of the Group and the Company that are not included in the above tables are non-interest bearing and are therefore not subject to interest rate risk.
The Group and the Company are in a net finance income position for the years ended 30 September 2016 and 2015.
Sensitivity analysis for interest rate risk It is estimated that a hundred basis points (bps) increase in interest rate, with all other variables held constant, would decrease the Group’s profit after tax by approximately $2,000 (2015: $23,000). A decrease of a hundred bps in interest rate would have an equal but opposite effect. The analysis is performed on the same basis for 2015.
156 Fra s e r a n d N ea v e , L i m i t e d & S u b s i d i a r y C o m pa n i e sA n n u a l R e p o r t 2 0 1 6

A n n u a l R e p o r t 2 0 1 6
F r a s e r a n d N e a v e , L i m i t e d & S u b s i d i a r y C o m p a n i e s
NOTES TO THE FINANCIAL STATEMENTS For the year ended 30 September 2016
1 5 6
35. FINANCIAL RISK MANAGEMENT (cont’d)
(d) Interest Rate Risk The Group's exposure to market risk for changes in interest rates relate primarily to debt obligation with financial institutions. The Group's policy is to manage interest cost using a mix of fixed and variable rate debts, and interest rate economic effect of converting borrowings from fixed rates to variable rates or vice versa.
The following table sets out the carrying amount, by maturity, of the Group's and the Company's financial instruments that are exposed to interest rate risk:
Floating rates Fixed rates
($'000)
Less than 1 year ($'000)
Between 1 to 5 years ($'000)
After 5 years
($'000) The Group Year Ended 30 September 2016 Assets Cash and bank deposits 2,174 933,680 2,900 -
Liabilities Borrowings 2,376 10,967 123,705 -Other financial liabilities - 3,955 2,900 - Year Ended 30 September 2015 Assets Cash and bank deposits 215 853,145 3,874 - Liabilities Borrowings 3,007 603 96,865 -Other financial liabilities - - 3,874 - The Company Year Ended 30 September 2016 Assets Cash and bank deposits - 499,505 - - Year Ended 30 September 2015 Assets Cash and bank deposits - 538,319 - -
Interest on financial instruments classified as floating rate is repriced at intervals of less than one year. Interest on financial instruments classified as fixed rate is fixed until the maturity of the instrument. The other financial instruments of the Group and the Company that are not included in the above tables are non-interest bearing and are therefore not subject to interest rate risk.
The Group and the Company are in a net finance income position for the years ended 30 September 2016 and 2015.
Sensitivity analysis for interest rate risk It is estimated that a hundred basis points (bps) increase in interest rate, with all other variables held constant, would decrease the Group’s profit after tax by approximately $2,000 (2015: $23,000). A decrease of a hundred bps in interest rate would have an equal but opposite effect. The analysis is performed on the same basis for 2015.
A n n u a l R e p o r t 2 0 1 6
F r a s e r a n d N e a v e , L i m i t e d & S u b s i d i a r y C o m p a n i e s
NOTES TO THE FINANCIAL STATEMENTS For the year ended 30 September 2016
1 5 7
35. FINANCIAL RISK MANAGEMENT (cont’d)
(e) Market Price Risk The Group and the Company are exposed to market price risk and the risk of impairment in the value of investments held. The Group and the Company manage the risk of impairment by evaluation of investment opportunities, continuously monitoring the performance of investments held and assessing market risk relevant to which the investments operate.
Sensitivity analysis for quoted investment risk If prices for available-for-sale investments increase by 10% with all other variables including tax rate being held constant, the impact on fair value adjustment reserve will be as follows:
THE GROUP THE COMPANY
2016
($'000)2015
($'000) 2016
($'000) 2015
($'000) Fair value adjustment reserve 136,201 84,285 18,504 11,895
There will be no impact to profit after tax.
A 10% decrease in the underlying equity prices would have had the equal but opposite effect as the amounts shown above. The analysis is performed on the same basis as for 2015 and assumes that all other variables remain constant.
(f) Fair Values The following methods and assumptions are used to estimate the fair value of each class of financial instruments for which it is practicable to estimate that value:
(i) Cash and bank deposits, other receivables and other payables The carrying amounts of these items in current assets and current liabilities approximate fair value due to their short term nature. The carrying amount of non-current fixed deposits approximates their fair values as these fixed deposits bear interest rate at the market prevailing interest for similar type of fixed deposits instrument at the end of the reporting period.
(ii) Trade receivables and trade payables The carrying amounts of receivables and payables approximate fair value because these are subject to normal trade credit terms.
(iii) Amounts due from/to related companies The carrying amounts of amounts due from/to related companies in current assets and current liabilities approximate fair value due to their short term nature. For amounts due to related companies included in long term liabilities, no disclosure of the fair value has been made, as it is not practicable to determine the fair value with sufficient reliability since these balances have no fixed terms of repayment.
(iv) Short term and other investments Market value of quoted investment is determined by reference to stock exchange quoted prices.
Certain unquoted investments do not have quoted market prices in an active market nor are there other methods of reasonably estimating the fair value readily available. It is not practicable to determine fair value with sufficient reliability without incurring excessive costs.
(v) Bank borrowings and term loans The fair value of fixed rate bank borrowings and term loans are disclosed in Note 28. The carrying values of bank borrowings, and term loans maturing within one year and the floating rate borrowings and loans approximate their fair value.
(vi) Assets and liabilities measured at fair value The Group classifies fair value measurement using a fair value hierarchy that reflects the significance of the inputs used in making the measurements. The fair value hierarchy has the following levels:
- Level 1 - Quoted prices in active markets for identical assets or liabilities
- Level 2 - Inputs other than quoted prices included within Level 1 that are observable for the asset or liability,either directly or indirectly
- Level 3 - Inputs for the asset or liability that are not based on observable market data
157Fra s e r a n d N ea v e , L i m i t e d & S u b s i d i a r y C o m pa n i e s A n n u a l R e p o r t 2 0 1 6

F r a s e r a n d N e a v e , L i m i t e d & S u b s i d i a r y C o m p a n i e s
NOTES TO THE FINANCIAL STATEMENTSFor the year ended 30 September 2016
A n n u a l R e p o r t 2 0 1 6 1 5 8
35. FINANCIAL RISK MANAGEMENT (cont’d)
(f) Fair Values (cont’d)
(vi) Assets and liabilities measured at fair value (cont’d) The following table shows an analysis of assets and liabilities financial instruments carried at fair value by level of fair value hierarchy:
Level 1($'000)
Level 2 ($'000)
Level 3 ($'000)
Total ($'000)
The Group Year Ended 30 September 2016 Financial Assets Other investments (Note 20) - Quoted available-for-sale financial assets 1,363,375 - - 1,363,375Derivative financial instruments (Note 25) - 549 - 549 1,363,375 549 - 1,363,924 Non-Financial Assets Investment properties (Note 13) - Commercial - - 42,863 42,863 Financial Liabilities Derivative financial instruments (Note 25) - 242 - 242 Year Ended 30 September 2015 Financial Assets Other investments (Note 20) - Quoted available-for-sale financial assets 844,741 - - 844,741Derivative financial instruments (Note 25) - 2,533 - 2,533 844,741 2,533 - 847,274 Non-Financial Assets Investment properties (Note 13) - Commercial - - 35,018 35,018 Financial Liabilities Derivative financial instruments (Note 25) - 338 - 338
The Company Year Ended 30 September 2016 Financial Assets Other investments (Note 20) - Quoted available-for-sale financial assets 185,226 - - 185,226Derivative financial instruments (Note 25) - 22 - 22 185,226 22 - 185,248 Financial Liabilities Derivative financial instruments (Note 25) - 20 - 20 Year Ended 30 September 2015 Financial Assets Other investments (Note 20) - Quoted available-for-sale financial assets 120,115 - - 120,115Derivative financial instruments (Note 25) - 295 - 295 120,115 295 - 120,410
158 Fra s e r a n d N ea v e , L i m i t e d & S u b s i d i a r y C o m pa n i e sA n n u a l R e p o r t 2 0 1 6

F r a s e r a n d N e a v e , L i m i t e d & S u b s i d i a r y C o m p a n i e s
NOTES TO THE FINANCIAL STATEMENTSFor the year ended 30 September 2016
A n n u a l R e p o r t 2 0 1 6 1 5 8
35. FINANCIAL RISK MANAGEMENT (cont’d)
(f) Fair Values (cont’d)
(vi) Assets and liabilities measured at fair value (cont’d) The following table shows an analysis of assets and liabilities financial instruments carried at fair value by level of fair value hierarchy:
Level 1($'000)
Level 2 ($'000)
Level 3 ($'000)
Total ($'000)
The Group Year Ended 30 September 2016 Financial Assets Other investments (Note 20) - Quoted available-for-sale financial assets 1,363,375 - - 1,363,375Derivative financial instruments (Note 25) - 549 - 549 1,363,375 549 - 1,363,924 Non-Financial Assets Investment properties (Note 13) - Commercial - - 42,863 42,863 Financial Liabilities Derivative financial instruments (Note 25) - 242 - 242 Year Ended 30 September 2015 Financial Assets Other investments (Note 20) - Quoted available-for-sale financial assets 844,741 - - 844,741Derivative financial instruments (Note 25) - 2,533 - 2,533 844,741 2,533 - 847,274 Non-Financial Assets Investment properties (Note 13) - Commercial - - 35,018 35,018 Financial Liabilities Derivative financial instruments (Note 25) - 338 - 338
The Company Year Ended 30 September 2016 Financial Assets Other investments (Note 20) - Quoted available-for-sale financial assets 185,226 - - 185,226Derivative financial instruments (Note 25) - 22 - 22 185,226 22 - 185,248 Financial Liabilities Derivative financial instruments (Note 25) - 20 - 20 Year Ended 30 September 2015 Financial Assets Other investments (Note 20) - Quoted available-for-sale financial assets 120,115 - - 120,115Derivative financial instruments (Note 25) - 295 - 295 120,115 295 - 120,410
F r a s e r a n d N e a v e , L i m i t e d & S u b s i d i a r y C o m p a n i e s
NOTES TO THE FINANCIAL STATEMENTSFor the year ended 30 September 2016
A n n u a l R e p o r t 2 0 1 6 1 5 9
35. FINANCIAL RISK MANAGEMENT (cont’d)
(f) Fair Values (cont’d)
(vi) Assets and liabilities measured at fair value (cont’d) There have been no transfers between Level 1, Level 2 and Level 3 for the Group and the Company during the financial year ended 2016.
The fair value of quoted investments categorised within Level 1 of the fair value hierarchy is determined directly by reference to the quoted market price at the balance sheet date.
The fair value of derivatives categorised within Level 2 of the fair value hierarchy are valued using a valuation technique with market observable inputs. These include forward pricing and swap models, using present value calculations. The models incorporate various inputs such as foreign exchange spot and forward rates.
The following table presents the valuation techniques and key inputs that were used to determine the fair value of investment properties categorised under Level 3 of the fair value hierarchy:
Description
Fair value as at
30.9.2016($'000)
Valuation techniques
Unobservable inputs Range
Investment Properties 42,863 Investment
Approach Discount rate 7.25%
Discounted
cash flows Discount rate 8.10%
Direct ComparisonApproach
Market value 0% to 16%
Description
Fair value as at
30.9.2015 ($'000)
Valuation techniques
Unobservable inputs Range
Investment Properties 35,018 Investment
ApproachDiscount rate 7.25%
Discounted
cash flowsDiscount rate 8.70%
Direct Comparison
ApproachMarket value 0% to 15%
The investment properties categorised under Level 3 of the fair value hierarchy are generally sensitive to the various unobservable inputs tabled above. A significant movement of each input would result in significant change to the fair value of the properties.
The following table presents the reconciliation for the investment properties measured at fair value based on unobservable inputs (Level 3):
2016
($'000) 2015
($'000) The Group Balance at beginning of year 35,018 40,702Currency realignment 288 (3,373)Additions 102 -Reclassified from fixed assets 9,510 -Reclassified to fixed assets (523) -Net fair value loss recognised in the profit statement (1,532) (2,311)Balance at end of year 42,863 35,018
159Fra s e r a n d N ea v e , L i m i t e d & S u b s i d i a r y C o m pa n i e s A n n u a l R e p o r t 2 0 1 6

A n n u a l R e p o r t 2 0 1 6
F r a s e r a n d N e a v e , L i m i t e d & S u b s i d i a r y C o m p a n i e s
NOTES TO THE FINANCIAL STATEMENTS For the year ended 30 September 2016
1 6 0
35. FINANCIAL RISK MANAGEMENT (cont’d)
(g) Classification of Financial Instruments Set out below is a comparison by category of carrying amounts of all the Group's and the Company's financial instruments that are carried in the financial statements:
Loans and
receivables($'000)
Fair value through
profit and loss
($'000)
Available- for-sale
($'000)
Liabilities at
amortised cost
($'000)
Non- financial
assets/ liabilities
($'000) Total
($'000) The Group Year Ended 30 September 2016 Assets Fixed assets - - - - 490,886 490,886Investment properties - - - - 42,863 42,863Properties held for development - - - - 18,232 18,232Joint venture companies 48,631 - - - (2,062) 46,569Associated companies 3 - - - 43,003 43,006Intangible assets - - - - 96,764 96,764Brands - - - - 27,892 27,892Other investments - - 1,363,389 - - 1,363,389Other receivables 30,286 549 - - 24,190 55,025Deferred tax assets - - - - 13,267 13,267Inventories - - - - 247,332 247,332Trade receivables 267,178 - - - - 267,178Related parties 4,565 - - - - 4,565Bank fixed deposits 566,182 - - - - 566,182Cash and bank balances 479,347 - - - - 479,347Assets held for sale 3,672 - - - 6,703 10,375 1,399,864 549 1,363,389 - 1,009,070 3,772,872Liabilities Trade payables - - - 180,548 - 180,548Other payables - 242 - 203,287 10,344 213,873Associated companies - - - 1,565 - 1,565Related parties - - - 13,915 - 13,915Borrowings - - - 137,048 - 137,048Provision for taxation - - - - 30,851 30,851Liabilities held for sale - - - 2,339 - 2,339Provision for employee benefits - - - - 20,671 20,671Deferred tax liabilities - - - - 19,518 19,518 - 242 - 538,702 81,384 620,328
160 Fra s e r a n d N ea v e , L i m i t e d & S u b s i d i a r y C o m pa n i e sA n n u a l R e p o r t 2 0 1 6

A n n u a l R e p o r t 2 0 1 6
F r a s e r a n d N e a v e , L i m i t e d & S u b s i d i a r y C o m p a n i e s
NOTES TO THE FINANCIAL STATEMENTS For the year ended 30 September 2016
1 6 0
35. FINANCIAL RISK MANAGEMENT (cont’d)
(g) Classification of Financial Instruments Set out below is a comparison by category of carrying amounts of all the Group's and the Company's financial instruments that are carried in the financial statements:
Loans and
receivables($'000)
Fair value through
profit and loss
($'000)
Available- for-sale
($'000)
Liabilities at
amortised cost
($'000)
Non- financial
assets/ liabilities
($'000) Total
($'000) The Group Year Ended 30 September 2016 Assets Fixed assets - - - - 490,886 490,886Investment properties - - - - 42,863 42,863Properties held for development - - - - 18,232 18,232Joint venture companies 48,631 - - - (2,062) 46,569Associated companies 3 - - - 43,003 43,006Intangible assets - - - - 96,764 96,764Brands - - - - 27,892 27,892Other investments - - 1,363,389 - - 1,363,389Other receivables 30,286 549 - - 24,190 55,025Deferred tax assets - - - - 13,267 13,267Inventories - - - - 247,332 247,332Trade receivables 267,178 - - - - 267,178Related parties 4,565 - - - - 4,565Bank fixed deposits 566,182 - - - - 566,182Cash and bank balances 479,347 - - - - 479,347Assets held for sale 3,672 - - - 6,703 10,375 1,399,864 549 1,363,389 - 1,009,070 3,772,872Liabilities Trade payables - - - 180,548 - 180,548Other payables - 242 - 203,287 10,344 213,873Associated companies - - - 1,565 - 1,565Related parties - - - 13,915 - 13,915Borrowings - - - 137,048 - 137,048Provision for taxation - - - - 30,851 30,851Liabilities held for sale - - - 2,339 - 2,339Provision for employee benefits - - - - 20,671 20,671Deferred tax liabilities - - - - 19,518 19,518 - 242 - 538,702 81,384 620,328
F r a s e r a n d N e a v e , L i m i t e d & S u b s i d i a r y C o m p a n i e s
NOTES TO THE FINANCIAL STATEMENTSFor the year ended 30 September 2016
A n n u a l R e p o r t 2 0 1 6 1 6 1
35. FINANCIAL RISK MANAGEMENT (cont’d)
(g) Classification of Financial Instruments (cont’d)
Loans and
receivables($'000)
Fair value through
profit and loss
($'000)
Available- for-sale
($'000)
Liabilities at
amortised cost
($'000)
Non- financial
assets/ liabilities
($'000)Total
($'000) The Group Year Ended 30 September 2015 Assets Fixed assets - - - - 464,388 464,388Investment properties - - - - 35,018 35,018Properties held for development - - - - 17,848 17,848Joint venture companies 45,991 - - - (1,499) 44,492Associated companies 3,403 - - - 41,860 45,263Intangible assets - - - - 78,750 78,750Brands - - - - 27,481 27,481Other investments - - 844,780 - - 844,780Other receivables 31,696 2,533 - - 21,021 55,250Deferred tax assets - - - - 18,156 18,156Inventories - - - - 253,918 253,918Trade receivables 278,792 - - - - 278,792Related parties 1,742 - - - - 1,742Bank fixed deposits 450,336 - - - - 450,336Cash and bank balances 515,243 - - - - 515,243Assets held for sale 3,600 - - - 7,812 11,412 1,330,803 2,533 844,780 - 964,753 3,142,869Liabilities Trade payables - - - 201,113 - 201,113Other payables - 338 - 184,783 11,598 196,719Associated companies - - - 1,843 - 1,843Related parties - - - 15,788 - 15,788Borrowings - - - 100,475 - 100,475Provision for taxation - - - - 31,712 31,712Liabilities held for sale - - - 1,802 - 1,802Provision for employee benefits - - - - 18,201 18,201Deferred tax liabilities - - - - 19,139 19,139 - 338 - 505,804 80,650 586,792
161Fra s e r a n d N ea v e , L i m i t e d & S u b s i d i a r y C o m pa n i e s A n n u a l R e p o r t 2 0 1 6

A n n u a l R e p o r t 2 0 1 6
F r a s e r a n d N e a v e , L i m i t e d & S u b s i d i a r y C o m p a n i e s
NOTES TO THE FINANCIAL STATEMENTS For the year ended 30 September 2016
1 6 2
35. FINANCIAL RISK MANAGEMENT (cont’d)
(g) Classification of Financial Instruments (cont’d)
Loansand
receivables($'000)
Fair value through
profit and loss
($'000)
Available- for-sale
($'000)
Liabilities at
amortised cost
($'000)
Non- financial
assets/ liabilities
($'000) Total
($'000) The Company Year Ended 30 September 2016 Assets Fixed assets - - - - 393 393Subsidiary companies 230,142 - - - 906,790 1,136,932Associated companies - - - - 18,100 18,100Intangible assets - - - - 187 187Brands - - - - 212 212Other investments - - 185,240 - - 185,240Other receivables 854 22 - - 198 1,074Related parties 6 - - - - 6Bank fixed deposits 231,018 - - - - 231,018Cash and bank balances 270,726 - - - - 270,726 732,746 22 185,240 - 925,880 1,843,888Liabilities Other payables - 20 - 7,403 - 7,423Subsidiary companies - - - 108,364 - 108,364Related parties - - - 1,286 - 1,286Provision for taxation - - - - 3,972 3,972Deferred tax liabilities - - - - 185 185 - 20 - 117,053 4,157 121,230 Year Ended 30 September 2015 Assets Subsidiary companies 155,826 - - - 906,790 1,062,616Associated companies - - - - 18,100 18,100Brands - - - - 212 212Other investments - - 120,129 - - 120,129Other receivables 574 295 - - 518 1,387Bank fixed deposits 276,978 - - - - 276,978Cash and bank balances 261,494 - - - - 261,494 694,872 295 120,129 - 925,620 1,740,916Liabilities Other payables - - - 10,312 - 10,312Subsidiary companies - - - 95,789 - 95,789Related parties - - - 1,265 - 1,265Provision for taxation - - - - 3,138 3,138Deferred tax liabilities - - - - 114 114 - - - 107,366 3,252 110,618
162 Fra s e r a n d N ea v e , L i m i t e d & S u b s i d i a r y C o m pa n i e sA n n u a l R e p o r t 2 0 1 6

A n n u a l R e p o r t 2 0 1 6
F r a s e r a n d N e a v e , L i m i t e d & S u b s i d i a r y C o m p a n i e s
NOTES TO THE FINANCIAL STATEMENTS For the year ended 30 September 2016
1 6 2
35. FINANCIAL RISK MANAGEMENT (cont’d)
(g) Classification of Financial Instruments (cont’d)
Loansand
receivables($'000)
Fair value through
profit and loss
($'000)
Available- for-sale
($'000)
Liabilities at
amortised cost
($'000)
Non- financial
assets/ liabilities
($'000) Total
($'000) The Company Year Ended 30 September 2016 Assets Fixed assets - - - - 393 393Subsidiary companies 230,142 - - - 906,790 1,136,932Associated companies - - - - 18,100 18,100Intangible assets - - - - 187 187Brands - - - - 212 212Other investments - - 185,240 - - 185,240Other receivables 854 22 - - 198 1,074Related parties 6 - - - - 6Bank fixed deposits 231,018 - - - - 231,018Cash and bank balances 270,726 - - - - 270,726 732,746 22 185,240 - 925,880 1,843,888Liabilities Other payables - 20 - 7,403 - 7,423Subsidiary companies - - - 108,364 - 108,364Related parties - - - 1,286 - 1,286Provision for taxation - - - - 3,972 3,972Deferred tax liabilities - - - - 185 185 - 20 - 117,053 4,157 121,230 Year Ended 30 September 2015 Assets Subsidiary companies 155,826 - - - 906,790 1,062,616Associated companies - - - - 18,100 18,100Brands - - - - 212 212Other investments - - 120,129 - - 120,129Other receivables 574 295 - - 518 1,387Bank fixed deposits 276,978 - - - - 276,978Cash and bank balances 261,494 - - - - 261,494 694,872 295 120,129 - 925,620 1,740,916Liabilities Other payables - - - 10,312 - 10,312Subsidiary companies - - - 95,789 - 95,789Related parties - - - 1,265 - 1,265Provision for taxation - - - - 3,138 3,138Deferred tax liabilities - - - - 114 114 - - - 107,366 3,252 110,618
F r a s e r a n d N e a v e , L i m i t e d & S u b s i d i a r y C o m p a n i e s
NOTES TO THE FINANCIAL STATEMENTSFor the year ended 30 September 2016
A n n u a l R e p o r t 2 0 1 6 1 6 3
36. UNUSUAL ITEM On 9 January 2014, Fraser & Neave Holdings Bhd ("F&NHB"), a subsidiary of the Company listed on Bursa Malaysia, entered into a settlement agreement (the “Settlement Agreement”) with BJC O-I Glass Pte Ltd (“BJC O-I”), Berli Jucker Public Company Ltd ("BJC") and ACI International Pty Ltd (“ACI”) in respect of a suit instituted by BJC O-I against F&NHB.
The Settlement Agreement covered all claims pleaded in the Suit and/or in connection with a share purchase agreement dated 14 May 2010 (the "Share Purchase Agreement") between BJC, ACI and F&NHB for the sale by F&NHB to BJC and ACI as purchasers of the entire issued and paid-up share capital of Malay Glass Products Sdn Bhd ("MGP"), save and except for:
(a) claims relating to Sichuan Malaya Glass Co Ltd (“SMG”) as pleaded in the Suit (“SMG Claims”). SMG is one of the subsidiaries of MGP; and
(b) claims relating to Taxation assessment liabilities pursuant to the terms and conditions in the Share Purchase Agreement (“Tax Claims”).
F&NHB, BJC, ACI and BJC O-I expressly agreed, consented to and acknowledged that:
(a) ACI’s right to institute fresh proceedings against the Company in respect of the Share Purchase Agreement is limited to the SMG Claims as pleaded in the Suit; and
(b) BJC O-I’s right to institute fresh proceedings against the Company in respect of the Share Purchase Agreement is limited to the Tax Claims.
As of the date of this report, no claims in respect of the SMG Claims and Tax Claims have been filed against F&NHB. F&NHB has made adequate provision in respect of the SMG Claims and Tax Claims.
37. CAPITAL MANAGEMENT The primary objective of the Group's capital management is to ensure that it maintains healthy capital ratios to support its business and maximise shareholder value. No changes were made in the objectives, policies or processes during the years ended 30 September 2016 and 2015.
The Group monitors its cashflow, debt maturity profile, cost of funds, overall liquidity position and gearing ratio on a continuous basis. The Group's policy is to keep gearing ratio at not more than 80% of total equity.
The gearing ratio is calculated as net borrowings divided by total equity. Net borrowings is calculated as borrowings less cash and bank deposits. Total equity is calculated as shareholders' fund plus non-controlling interests.
THE GROUP THE COMPANY
2016
($'000)2015
($'000) 2016
($'000) 2015
($'000) Cash & bank deposits 1,045,529 965,579 501,744 538,472Borrowings (137,048) (100,475) - -Net cash 908,481 865,104 501,744 538,472 Shareholders' fund 2,843,084 2,268,049 1,722,658 1,630,298Total equity (including non-controlling interests) 3,152,544 2,556,077 1,722,658 1,630,298
Certain entities in the Group are required to comply with certain externally imposed capital requirements in respect of certain external borrowings. The Group and the Company are in compliance with all externally imposed capital requirements.
163Fra s e r a n d N ea v e , L i m i t e d & S u b s i d i a r y C o m pa n i e s A n n u a l R e p o r t 2 0 1 6

A n n u a l R e p o r t 2 0 1 6
F r a s e r a n d N e a v e , L i m i t e d & S u b s i d i a r y C o m p a n i e s
NOTES TO THE FINANCIAL STATEMENTS For the year ended 30 September 2016
1 6 4
38. NEW ACCOUNTING STANDARDS AND FRS INTERPRETATION
The Group has not adopted the following relevant standards and interpretations that have been issued as at balance sheet date but are not yet effective:
Description
Effective for annual periods beginning
on or after FRS 114 Regulatory Deferral Accounts 1 January 2016Amendments to FRS 27 Equity Method in Separate Financial Statements 1 January 2016Amendments to FRS 16 and FRS 38 Clarification of Acceptable Methods of Depreciation and
Amortisation 1 January 2016Amendments to FRS 16 and FRS 41 Agriculture: Bearer Plants 1 January 2016Amendments to FRS 111 Accounting for Acquisitions of Interests in Joint Operations 1 January 2016Amendments to FRS 110 and FRS 28 Sale or Contribution of Assets between an Investor and its
Associate or Joint Venture To be determinedAmendments to FRS 110, FRS 112
and FRS 28 Investment Entities: Applying the Consolidation Exception
1 January 2016Amendments to FRS 1 Disclosure Initiative 1 January 2016Improvements to FRSs 2014
Amendment to FRS 105 Non-current Assets Held for Sale and Discontinued Operations 1 January 2016Amendment to FRS 107 Financial Instruments: Disclosures 1 January 2016Amendment to FRS 19 Employee Benefits 1 January 2016Amendment to FRS 34 Interim Financial Reporting 1 January 2016
Amendments to FRS 7 Disclosure Initiative 1 January 2017Amendments to FRS 12 Recognition of Deferred Tax Assets for Unrealised Losses 1 January 2017FRS 115 Revenue from Contracts with Customers 1 January 2018FRS 109 Financial Instruments 1 January 2018FRS 116 Leases 1 January 2019
Except for FRS 115, FRS 109 and FRS 116, the Directors expect that the adoption of the other new and amendments to standards above will have no material impact on the financial statements in the period of initial application. The nature of the impending changes in accounting policy on adoption of the following FRS are described below.
(a) FRS 115 Revenue from Contracts with Customers FRS 115 establishes a single comprehensive model for entities to use in accounting for revenue arising from contracts with customers. FRS 115 will supersede the current revenue recognition guidance including FRS 18 Revenue, FRS 11 Construction Contracts and the related interpretations when it becomes effective. The core principle of FRS 115 is that an entity should recognise revenue to depict the transfer of promised goods or services to customers in an amount that reflects the consideration to which the entity expects to be entitled in exchange for those goods or services. Under FRS 115, an entity recognises revenue when (or as) a performance obligation is satisfied, i.e. when ‘control’ of the goods or services underlying the particular performance obligation is transferred to the customer. Furthermore, extensive disclosures are required by FRS 115.
The Group is currently determining the impact of the new accounting standard.
(b) FRS 109 Financial Instruments FRS 109 Financial Instruments replaces the existing guidance in FRS 39 Financial Instruments: Recognition and Measurement. FRS 109 includes revised guidance on the classification and measurement of financial instruments, including classification and measurement of financial assets, impairment of financial assets and hedge accounting. Retrospective application is required, but comparative information is not compulsory in the year of adoption.
The Group is currently determining the impact of the new accounting standard.
(c) FRS 116 Leases FRS 116 Leases will result in almost all leases being recognised on the balance sheet, as the distinction between operating and finance leases is removed. Under the new standard, an asset (the right to use the leased item) and a financial liability to pay rentals are recognised, with exceptions to short-term and low-value leases. The accounting for lessors will not change significantly. The standard will affect primarily the accounting for the Group's operating leases.
The Group is currently determining the impact of the new accounting standard.
On 29 May 2014, the Accounting Standards Council (ASC) announced that Singapore-incorporated companies listed on SGX will apply a new financial reporting framework identical to the International Financial Reporting Standards (IFRS) for the financial year ending 31 December 2018 onwards. This means that the Group's comparative information for the financial year ended 30 September 2018 and the opening balance sheet as at 1 October 2017 would have to comply with this new financial reporting framework.
164 Fra s e r a n d N ea v e , L i m i t e d & S u b s i d i a r y C o m pa n i e sA n n u a l R e p o r t 2 0 1 6

A n n u a l R e p o r t 2 0 1 6
F r a s e r a n d N e a v e , L i m i t e d & S u b s i d i a r y C o m p a n i e s
NOTES TO THE FINANCIAL STATEMENTS For the year ended 30 September 2016
1 6 4
38. NEW ACCOUNTING STANDARDS AND FRS INTERPRETATION
The Group has not adopted the following relevant standards and interpretations that have been issued as at balance sheet date but are not yet effective:
Description
Effective for annual periods beginning
on or after FRS 114 Regulatory Deferral Accounts 1 January 2016Amendments to FRS 27 Equity Method in Separate Financial Statements 1 January 2016Amendments to FRS 16 and FRS 38 Clarification of Acceptable Methods of Depreciation and
Amortisation 1 January 2016Amendments to FRS 16 and FRS 41 Agriculture: Bearer Plants 1 January 2016Amendments to FRS 111 Accounting for Acquisitions of Interests in Joint Operations 1 January 2016Amendments to FRS 110 and FRS 28 Sale or Contribution of Assets between an Investor and its
Associate or Joint Venture To be determinedAmendments to FRS 110, FRS 112
and FRS 28 Investment Entities: Applying the Consolidation Exception
1 January 2016Amendments to FRS 1 Disclosure Initiative 1 January 2016Improvements to FRSs 2014
Amendment to FRS 105 Non-current Assets Held for Sale and Discontinued Operations 1 January 2016Amendment to FRS 107 Financial Instruments: Disclosures 1 January 2016Amendment to FRS 19 Employee Benefits 1 January 2016Amendment to FRS 34 Interim Financial Reporting 1 January 2016
Amendments to FRS 7 Disclosure Initiative 1 January 2017Amendments to FRS 12 Recognition of Deferred Tax Assets for Unrealised Losses 1 January 2017FRS 115 Revenue from Contracts with Customers 1 January 2018FRS 109 Financial Instruments 1 January 2018FRS 116 Leases 1 January 2019
Except for FRS 115, FRS 109 and FRS 116, the Directors expect that the adoption of the other new and amendments to standards above will have no material impact on the financial statements in the period of initial application. The nature of the impending changes in accounting policy on adoption of the following FRS are described below.
(a) FRS 115 Revenue from Contracts with Customers FRS 115 establishes a single comprehensive model for entities to use in accounting for revenue arising from contracts with customers. FRS 115 will supersede the current revenue recognition guidance including FRS 18 Revenue, FRS 11 Construction Contracts and the related interpretations when it becomes effective. The core principle of FRS 115 is that an entity should recognise revenue to depict the transfer of promised goods or services to customers in an amount that reflects the consideration to which the entity expects to be entitled in exchange for those goods or services. Under FRS 115, an entity recognises revenue when (or as) a performance obligation is satisfied, i.e. when ‘control’ of the goods or services underlying the particular performance obligation is transferred to the customer. Furthermore, extensive disclosures are required by FRS 115.
The Group is currently determining the impact of the new accounting standard.
(b) FRS 109 Financial Instruments FRS 109 Financial Instruments replaces the existing guidance in FRS 39 Financial Instruments: Recognition and Measurement. FRS 109 includes revised guidance on the classification and measurement of financial instruments, including classification and measurement of financial assets, impairment of financial assets and hedge accounting. Retrospective application is required, but comparative information is not compulsory in the year of adoption.
The Group is currently determining the impact of the new accounting standard.
(c) FRS 116 Leases FRS 116 Leases will result in almost all leases being recognised on the balance sheet, as the distinction between operating and finance leases is removed. Under the new standard, an asset (the right to use the leased item) and a financial liability to pay rentals are recognised, with exceptions to short-term and low-value leases. The accounting for lessors will not change significantly. The standard will affect primarily the accounting for the Group's operating leases.
The Group is currently determining the impact of the new accounting standard.
On 29 May 2014, the Accounting Standards Council (ASC) announced that Singapore-incorporated companies listed on SGX will apply a new financial reporting framework identical to the International Financial Reporting Standards (IFRS) for the financial year ending 31 December 2018 onwards. This means that the Group's comparative information for the financial year ended 30 September 2018 and the opening balance sheet as at 1 October 2017 would have to comply with this new financial reporting framework.
F r a s e r a n d N e a v e , L i m i t e d & S u b s i d i a r y C o m p a n i e s
NOTES TO THE FINANCIAL STATEMENTSFor the year ended 30 September 2016
A n n u a l R e p o r t 2 0 1 6 1 6 5
39. SIGNIFICANT SUBSIDIARY COMPANIES, JOINT ARRANGEMENTS AND ASSOCIATED COMPANIES
Effective
Shareholding 2016 2015 Principal Activities SUBSIDIARY COMPANIES OF THE COMPANY Country of Incorporation and Place of Business: Singapore(A) Fraser & Neave (Singapore) Pte. Limited 100.0% 100.0% Management Services(A) F&N Investments Pte Ltd 100.0% 100.0% Investment Holding (A) F&N Foods Pte Ltd 100.0% 100.0% Manufacture and Distribution of
Dairy Products and Beverages(A) Asia Dairies (S) Pte Ltd 100.0% 100.0% Dormant (A) F&N Dairy Investments Pte Ltd 100.0% 100.0% Investment Holding (A) F&N Interflavine Pte Ltd 100.0% 100.0% Beverage Base Manufacturing(A) InterF&B Pte. Ltd. 100.0% 100.0% Dormant (A) Times Publishing Limited 100.0% 100.0% Investment Holding (A) F&NBev Manufacturing Pte. Ltd. 100.0% 100.0% Dormant (A) F&N Treasury Pte Ltd 100.0% 100.0% Provision of Treasury and
Financial Services (A) F&N Creameries (S) Pte. Ltd.
(Held by a subsidiary company) 100.0% 100.0% Distribution of Ice-Cream
(A) Warburg Vending Pte Ltd (Held by a subsidiary company)
100.0% -
Vending Machine Operator
(A) Warburg Engineering Pte. Ltd. (Held by a subsidiary company)
100.0% -
Machine Repair and Servicing
(A) Warburg Vending Services Pte. Ltd. (Held by a subsidiary company)
100.0% -
Vending Machine Operator
Country of Incorporation and Place of Business: Hong Kong(B) Fraser & Neave Investments (Hong Kong) Limited 100.0% 100.0% Dormant Country of Incorporation and Place of Business: Malaysia(B) Fraser & Neave Holdings Bhd 55.5% 55.5% Investment Holding (B) Tiger Tavern Sdn. Bhd. 100.0% 100.0% Dormant (B) Magnolia - PDL Dairies (1993) Sdn. Bhd. 100.0% 100.0% Investment Holding (B) F&N Services (F&B) Sdn Bhd 100.0% 100.0%
Technical Application and BrandMarketing Support Services
(B) F&N Services (L) Bhd 100.0% 100.0% Dormant (B) Yoke Food Industries Sdn Bhd
(Held by a subsidiary company) 70.0% 70.0%
Manufacture, Export andDistribution of Soft Drinks
Country of Incorporation and Place of Business: Thailand(B) F&N United Limited
(Held by a subsidiary company) 95.0% 95.0%
Manufacture and Distribution ofDairy Products
Country of Incorporation and Place of Business: Indonesia(C) PT. F&N Indonesia
(Held by subsidiary companies) 100.0% 100.0%
Dormant
Country of Incorporation and Place of Business: Vietnam(C) F&N Vietnam Limited Liability Company
(Held by a subsidiary company) 100.0% -
Dormant
SUBSIDIARY COMPANIES OF F&N CREAMERIES GROUP Country of Incorporation and Place of Business: Malaysia(B) F&N Ice Cream Manufacturing (M) Sdn Bhd 100.0% 100.0%
Manufacture and Distribution ofIce-Cream
(B) F&N Creameries (M) Sdn Bhd 100.0% 100.0% Distribution of Ice-Cream (B) F&N Ice Cream Manufacturing (Sarawak) Sdn Bhd 100.0% 100.0% Dormant (B) F&N Creameries (Sarawak) Sdn Bhd 100.0% 100.0% Dormant
Notes: (A) Audited by KPMG LLP Singapore. (B) Audited by KPMG in the respective countries. (C) To be appointed.
165Fra s e r a n d N ea v e , L i m i t e d & S u b s i d i a r y C o m pa n i e s A n n u a l R e p o r t 2 0 1 6

A n n u a l R e p o r t 2 0 1 6
F r a s e r a n d N e a v e , L i m i t e d & S u b s i d i a r y C o m p a n i e s
NOTES TO THE FINANCIAL STATEMENTS For the year ended 30 September 2016
1 6 6
39. SIGNIFICANT SUBSIDIARY COMPANIES, JOINT ARRANGEMENTS AND ASSOCIATED COMPANIES (cont’d)
Effective
Shareholding 2016 2015 Principal Activities SUBSIDIARY COMPANIES OF YOKE FOOD INDUSTRIES GROUP Country of Incorporation and Place of Business: Malaysia(B) Lee Fah Marketing Sdn Bhd 70.0% 70.0% Dormant Country of Incorporation and Place of Business: Indonesia(B) PT Yoke Food Industries Indonesia 70.0% 70.0% Distribution of Soft Drinks SUBSIDIARY COMPANIES OF FRASER & NEAVE HOLDINGS GROUP Country of Incorporation and Place of Business: Malaysia(B) Fraser & Neave (Malaya) Sdn Bhd 55.5% 55.5% Management Services and
Property Investment Holding(B) F&N Beverages Marketing Sdn Bhd 55.5% 55.5% Distribution of Soft Drinks(B) F&N Beverages Manufacturing Sdn Bhd 55.5% 55.5% Manufacture and Distribution
of Soft Drinks (B) F&N Dairies (Malaysia) Sdn Bhd 55.5% 55.5% Distribution of Dairy Products(B) Premier Milk (Malaya) Sdn Bhd 55.5% 55.5% Dormant (B)* F&N Foods Sdn Bhd 55.5% 55.5% Dormant (B)* Kuala Lumpur Glass Manufacturers Company Sdn Bhd 55.5% 55.5% Dormant (B) Wimanis Sdn Bhd 55.5% 55.5% Dormant (B) Lettricia Corporation Sdn Bhd 38.9% 38.9% Property Development(B) Elsinburg Holdings Sdn Bhd 55.5% 55.5% Dormant (B) Nuvak Company Sdn Bhd 55.5% 55.5% Dormant (B) Greenclipper Corporation Sdn Bhd 55.5% 55.5% Property Development(B) Utas Mutiara Sdn Bhd 55.5% 55.5% Property Investment Holding(B) Borneo Springs Sdn Bhd 55.5% 55.5% Manufacture and Sale of
Mineral Water (B) F&N Dairies Manufacturing Sdn Bhd 55.5% 55.5% Manufacture and Distribution
Of Dairy Products (B) F&N Properties Sdn Bhd 55.5% 55.5% Provision of Property
Management Services(B) F&N Capital Sdn Bhd 55.5% 55.5% Provision of Treasury and
Financial Services (B) Tropical League Sdn Bhd 55.5% 55.5% Dormant Country of Incorporation and Place of Business: Singapore(A) F&N Dairies Distribution (Singapore) Pte Ltd 55.5% 55.5% Distribution of Dairy Products Country of Incorporation and Place of Business: Thailand(B) F&N Dairies (Thailand) Limited 55.5% 55.5% Manufacture and Distribution
of Dairy Products (B)* F&N Beverages (Thailand) Limited 55.5% 55.5% Dormant Country of Incorporation and Place of Business: British Virgin
Islands (B) Lion Share Management Limited 55.5% 55.5% Brand Owner Country of Incorporation and Place of Business: Brunei(B) F&N Marketing (B) Sdn Bhd 55.5% 55.5% Dormant SUBSIDIARY COMPANIES OF TIMES PUBLISHING GROUP Country of Incorporation and Place of Business: Singapore(A) Marshall Cavendish International Private Limited 100.0% 100.0% Investment Holding(A) Marshall Cavendish International (Asia) Private Limited 100.0% 100.0% Publishing of Trade Books(A) Marshall Cavendish Education Pte. Ltd. 100.0% 100.0% Publishing - Education(A) Marshall Cavendish Business Information Private Limited 100.0% 100.0% Publishing of Trade Directory
and Business Information
Notes: (A) Audited by KPMG LLP Singapore. (B) Audited by KPMG in the respective countries. * In voluntary liquidation
166 Fra s e r a n d N ea v e , L i m i t e d & S u b s i d i a r y C o m pa n i e sA n n u a l R e p o r t 2 0 1 6

A n n u a l R e p o r t 2 0 1 6
F r a s e r a n d N e a v e , L i m i t e d & S u b s i d i a r y C o m p a n i e s
NOTES TO THE FINANCIAL STATEMENTS For the year ended 30 September 2016
1 6 6
39. SIGNIFICANT SUBSIDIARY COMPANIES, JOINT ARRANGEMENTS AND ASSOCIATED COMPANIES (cont’d)
Effective
Shareholding 2016 2015 Principal Activities SUBSIDIARY COMPANIES OF YOKE FOOD INDUSTRIES GROUP Country of Incorporation and Place of Business: Malaysia(B) Lee Fah Marketing Sdn Bhd 70.0% 70.0% Dormant Country of Incorporation and Place of Business: Indonesia(B) PT Yoke Food Industries Indonesia 70.0% 70.0% Distribution of Soft Drinks SUBSIDIARY COMPANIES OF FRASER & NEAVE HOLDINGS GROUP Country of Incorporation and Place of Business: Malaysia(B) Fraser & Neave (Malaya) Sdn Bhd 55.5% 55.5% Management Services and
Property Investment Holding(B) F&N Beverages Marketing Sdn Bhd 55.5% 55.5% Distribution of Soft Drinks(B) F&N Beverages Manufacturing Sdn Bhd 55.5% 55.5% Manufacture and Distribution
of Soft Drinks (B) F&N Dairies (Malaysia) Sdn Bhd 55.5% 55.5% Distribution of Dairy Products(B) Premier Milk (Malaya) Sdn Bhd 55.5% 55.5% Dormant (B)* F&N Foods Sdn Bhd 55.5% 55.5% Dormant (B)* Kuala Lumpur Glass Manufacturers Company Sdn Bhd 55.5% 55.5% Dormant (B) Wimanis Sdn Bhd 55.5% 55.5% Dormant (B) Lettricia Corporation Sdn Bhd 38.9% 38.9% Property Development(B) Elsinburg Holdings Sdn Bhd 55.5% 55.5% Dormant (B) Nuvak Company Sdn Bhd 55.5% 55.5% Dormant (B) Greenclipper Corporation Sdn Bhd 55.5% 55.5% Property Development(B) Utas Mutiara Sdn Bhd 55.5% 55.5% Property Investment Holding(B) Borneo Springs Sdn Bhd 55.5% 55.5% Manufacture and Sale of
Mineral Water (B) F&N Dairies Manufacturing Sdn Bhd 55.5% 55.5% Manufacture and Distribution
Of Dairy Products (B) F&N Properties Sdn Bhd 55.5% 55.5% Provision of Property
Management Services(B) F&N Capital Sdn Bhd 55.5% 55.5% Provision of Treasury and
Financial Services (B) Tropical League Sdn Bhd 55.5% 55.5% Dormant Country of Incorporation and Place of Business: Singapore(A) F&N Dairies Distribution (Singapore) Pte Ltd 55.5% 55.5% Distribution of Dairy Products Country of Incorporation and Place of Business: Thailand(B) F&N Dairies (Thailand) Limited 55.5% 55.5% Manufacture and Distribution
of Dairy Products (B)* F&N Beverages (Thailand) Limited 55.5% 55.5% Dormant Country of Incorporation and Place of Business: British Virgin
Islands (B) Lion Share Management Limited 55.5% 55.5% Brand Owner Country of Incorporation and Place of Business: Brunei(B) F&N Marketing (B) Sdn Bhd 55.5% 55.5% Dormant SUBSIDIARY COMPANIES OF TIMES PUBLISHING GROUP Country of Incorporation and Place of Business: Singapore(A) Marshall Cavendish International Private Limited 100.0% 100.0% Investment Holding(A) Marshall Cavendish International (Asia) Private Limited 100.0% 100.0% Publishing of Trade Books(A) Marshall Cavendish Education Pte. Ltd. 100.0% 100.0% Publishing - Education(A) Marshall Cavendish Business Information Private Limited 100.0% 100.0% Publishing of Trade Directory
and Business Information
Notes: (A) Audited by KPMG LLP Singapore. (B) Audited by KPMG in the respective countries. * In voluntary liquidation
F r a s e r a n d N e a v e , L i m i t e d & S u b s i d i a r y C o m p a n i e s
NOTES TO THE FINANCIAL STATEMENTSFor the year ended 30 September 2016
A n n u a l R e p o r t 2 0 1 6 1 6 7
39. SIGNIFICANT SUBSIDIARY COMPANIES, JOINT ARRANGEMENTS AND ASSOCIATED COMPANIES (cont’d)
Effective
Shareholding
2016 2015 Principal Activities SUBSIDIARY COMPANIES OF TIMES PUBLISHING GROUP (cont’d) Country of Incorporation and Place of Business: Singapore (cont’d) (E) Educational Technologies Private Limited 100.0% 100.0% Dormant (A) Marshall Cavendish Institute Pte. Ltd. 100.0% 100.0% Publishing - Education(A) Pansing Distribution Private Limited 100.0% 100.0% Distribution of Books and
Magazines (E) Goodwill Binding Pte. Ltd. 51.0% 51.0% Dormant (A) JCS Digital Solutions Pte. Ltd. 100.0% 100.0% Digital Printing (A) Times Experience Pte. Ltd.
(Formerly Times Editions Pte Ltd) 100.0% 100.0% Organising Conventions/
Conferences and E-retail of Products & Services
(A) Times Graphics Private Limited 100.0% 100.0% Dormant (A) Times Printers Private Limited 100.0% 100.0% Commercial Printing Country of Incorporation: Singapore
Place of Business: Singapore and Malaysia
(A) Times The Bookshop Pte Ltd 100.0% 100.0% Retail of Books, Stationery, Magazines and Periodicals
Country of Incorporation and Place of Business: Malaysia (B) Marshall Cavendish (Malaysia) Sdn. Bhd. 100.0% 100.0% Publishing - Education,
Business Information and Trade Books
(B) STP Distributors (M) Sendirian Berhad 100.0% 100.0% Dormant (B) Pansing Marketing Sdn Bhd 100.0% 100.0% Distribution of Books and
Magazines (B) Times Offset (Malaysia) Sdn Bhd 100.0% 100.0% Commercial Printing(B) Pansing Distribution Sdn Bhd 100.0% 100.0% Distribution of Books and
Magazines Country of Incorporation: Hong Kong
Place of Business: Hong Kong/Thailand
(B) Far East Publications Limited 100.0% 100.0% Distribution of Home Library Reference Books
Country of Incorporation and Place of Business: Thailand (B)(1) Marshall Cavendish International (Thailand) Co., Ltd 49.0% 49.0% Publishing - Education Country of Incorporation and Place of Business: Hong Kong (B) Everbest Printing Holdings Limited 100.0% 100.0% Investment Holding(B) Everbest Printing Investment Limited 100.0% 100.0% Investment Holding(B) Everbest Printing Company Limited
(accounting year ends on 31 March) 100.0% 100.0% Commercial Printing
(B) Marshall Cavendish Business Information (HK) Limited 100.0% 100.0% Publishing of Trade Directory and Business Information
(B) Times Publishing (Hong Kong) Limited 100.0% 100.0% Education Publishing andDistribution of Magazines
(B) Educational Technologies Limited 100.0% 100.0% Publishing and Selling ofHome Library Reference Books
Country of Incorporation and Place of Business: China (B) Everbest Printing (Guangzhou) Company Limited 100.0% 100.0% Commercial Printing(B)(2) Shanxi Xinhua Times Packaging Printing Co., Ltd 51.0% 51.0% Commercial Printing and
Packaging
Notes: (A) Audited by KPMG LLP Singapore. (B) Audited by KPMG in the respective countries. (E) Not required to be audited under the laws of the country of incorporation. (1) Company is treated as a subsidiary of the Group by virtue of management control over financial and operating policies of the company. (2) Classified as Assets and Liabilities Held for Sale (Note 26(b)).
167Fra s e r a n d N ea v e , L i m i t e d & S u b s i d i a r y C o m pa n i e s A n n u a l R e p o r t 2 0 1 6

A n n u a l R e p o r t 2 0 1 6
F r a s e r a n d N e a v e , L i m i t e d & S u b s i d i a r y C o m p a n i e s
NOTES TO THE FINANCIAL STATEMENTS For the year ended 30 September 2016
1 6 8
39. SIGNIFICANT SUBSIDIARY COMPANIES, JOINT ARRANGEMENTS AND ASSOCIATED COMPANIES (cont’d)
Effective
Shareholding
2016 2015 Principal Activities SUBSIDIARY COMPANIES OF TIMES PUBLISHING GROUP (cont’d) Country of Incorporation and Place of Business: China (cont’d) (D) Marshall Cavendish (Beijing) Co. Ltd.
(All the above companies, incorporated in China, accounting year ends on 31 December)
100.0% 100.0% Dormant
Country of Incorporation and Place of Business: India (B) Direct Educational Technologies India Pvt. Ltd.
(accounting year ends on 31 March) 100.0% 100.0% Distribution of Home Library
Reference Books Country of Incorporation and Place of Business: Australia (E) Musicway Corporation Pty Ltd 100.0% 100.0% Distribution of Lifestyle
Accessories and Storage Products
(E) Marshall Cavendish (Australia) Pty. Limited 100.0% 100.0% Investment Holding Country of Incorporation and Place of Business: United Kingdom (B) Marshall Cavendish Limited 100.0% 100.0% Investment Holding Country of Incorporation and Place of Business: United States
of America
(E) Marshall Cavendish Corporation 100.0% 100.0% Publishing of Library Reference Books
Country of Incorporation and Place of Business: Chile (E) Marshall Cavendish Education Chile SpA
(accounting year ends on 31 December) 100.0% 100.0% Publishing - Education
JOINT VENTURE COMPANY OF FRASER & NEAVE HOLDINGS GROUP Country of Incorporation and Place of Business: Malaysia (B) Vacaron Company Sdn Bhd 27.8% 27.8% Property Development JOINT OPERATION OF TIMES PUBLISHING GROUP Country of Incorporation and Place of Business: Singapore (D) Times Newslink
(Accounting year ends on 31 December) 50.0% 50.0% Retail of Books and
Magazines ASSOCIATED COMPANY OF THE COMPANY Country of Incorporation and Place of Business: Australia (D)(3) PMP Limited
(Accounting year ends on 30 June) 12.3% 12.1% Printing and Packaging
ASSOCIATED COMPANY OF FRASER & NEAVE HOLDINGS GROUP Country of Incorporation and Place of Business: Malaysia (D) Cocoaland Holdings Berhad
(Accounting year ends on 31 December) 15.1% 15.1% Investment Holding
ASSOCIATED COMPANIES OF TIMES PUBLISHING GROUP Country of Incorporation and Place of Business: China (E) Beijing Universal Times Culture Development Co., Ltd.
(Accounting year ends on 31 December) 40.0% 40.0% Dormant
Country of Incorporation and Place of Business: Nigeria (E) Transworld Times Press (Africa) Limited
(Accounting year ends on 31 December) 40.0% 40.0% Dormant
Notes: (B) Audited by KPMG in the respective countries. (D) Audited by other firms of auditors. (E) Not required to be audited under the laws of the country of incorporation. (3) Company is treated as an associated company of the Group by virtue of significant influence over the company.
168 Fra s e r a n d N ea v e , L i m i t e d & S u b s i d i a r y C o m pa n i e sA n n u a l R e p o r t 2 0 1 6 F r a s e r a n d N e a v e , L i m i t e d & S u b s i d i a r y C o m p a n i e s
PARTICULARS OF GROUP PROPERTIES
A n n u a l R e p o r t 2 0 1 6 1 6 9
The main properties as at 30 September 2016 and their net book values are indicated below: ("F&N" refers to Fraser and Neave Group and "TPL" refers to Times Publishing Group)
Land($'000)
Building($'000)
(A) CLASSIFIED AS FIXED ASSETS (Note 12 to the Financial Statements)
FREEHOLD
Singapore TPL - 1.1 hectares industrial property at Times Centre, 1 New Industrial Road 6,100 4,192
Peninsular Malaysia F&N - 18.0 hectares industrial property at Lot 3-1 & Lot 3-2, Lion Industrial Park,
Shah Alam 16,011 19,210 - 2.3 hectares industrial property at 3724 to 3726 Sungei Nyior, Butterworth 1,556 590 - 2.7 hectares industrial property at 217, Jalan Lahat, Ipoh 928 1,138 - 2.2 hectares industrial property at 701, Jalan Tampoi, Johor Bahru 2,525 48 - 0.6 hectares industrial property at 598, Jalan Tampoi, Johor Bahru 346 981 - 0.1 hectares office premise at No. 3, Jalan Metro Pudu, Fraser Business Park,
Kuala Lumpur - 4,162 - 0.4 hectares industrial property at Seksyen 26, Shah Alam, Selangor 538 266 - 2.0 hectares industrial property at Lot 7399 & 8081, Jalan Mempaga, Mukim Sabai,
Karak, Pahang 761 2,444 - 0.3 hectares office premise at Level 1, 5, 6 & 7, Kompleks Metro Pudu,
No. 1 Jalan Metro Pudu 2, Fraser Business Park, Kuala Lumpur - 4,004 - Other properties 308 103
TPL - 1.2 hectares industrial property at Lot 46, Subang Hi-Tech Industrial Park,
Batu Tiga, Shah Alam 1,270 1,813
East Malaysia F&N - 1.1 hectares industrial property at Lot 924 Block 4, Matang Land District, Sarawak 1,442 1,296
Thailand F&N - 1.2 hectares industrial property at 90 Moo 8 Mitapap Road, Phayayen District,
Amphur Pakchong, Nakonratchasima Province 30320 - 1,098 - 9.2 hectares industrial property at 668 Moo 4 Rojana Industrial Park Zone 2,
U-thai, Phra Nakhon Si Ayutthaya 13210 6,680 44,345
Australia TPL - 0.2 hectares commercial property at Unit 7 & 8 Monash Business Park,
29 Business Park Drive, Nottinghill, Melbourne - Victoria 794 281
United States of America TPL - 0.2 hectares commercial property at 99 White Plains Road, Tarrytown,
New York 683 2,693 Total Freehold 39,942 88,664
LEASEHOLD
Singapore F&N - 4.0 hectares industrial property at 214 Pandan Loop (Lease expires year 2040) - 10,694 - 0.1 hectares industrial property at 51 Quality Road (Lease expires year 2044) - 34 - 0.1 hectares industrial property at 53 Loyang Way (Lease expires year 2029) 1,789 -

A n n u a l R e p o r t 2 0 1 6
F r a s e r a n d N e a v e , L i m i t e d & S u b s i d i a r y C o m p a n i e s
NOTES TO THE FINANCIAL STATEMENTS For the year ended 30 September 2016
1 6 8
39. SIGNIFICANT SUBSIDIARY COMPANIES, JOINT ARRANGEMENTS AND ASSOCIATED COMPANIES (cont’d)
Effective
Shareholding
2016 2015 Principal Activities SUBSIDIARY COMPANIES OF TIMES PUBLISHING GROUP (cont’d) Country of Incorporation and Place of Business: China (cont’d) (D) Marshall Cavendish (Beijing) Co. Ltd.
(All the above companies, incorporated in China, accounting year ends on 31 December)
100.0% 100.0% Dormant
Country of Incorporation and Place of Business: India (B) Direct Educational Technologies India Pvt. Ltd.
(accounting year ends on 31 March) 100.0% 100.0% Distribution of Home Library
Reference Books Country of Incorporation and Place of Business: Australia (E) Musicway Corporation Pty Ltd 100.0% 100.0% Distribution of Lifestyle
Accessories and Storage Products
(E) Marshall Cavendish (Australia) Pty. Limited 100.0% 100.0% Investment Holding Country of Incorporation and Place of Business: United Kingdom (B) Marshall Cavendish Limited 100.0% 100.0% Investment Holding Country of Incorporation and Place of Business: United States
of America
(E) Marshall Cavendish Corporation 100.0% 100.0% Publishing of Library Reference Books
Country of Incorporation and Place of Business: Chile (E) Marshall Cavendish Education Chile SpA
(accounting year ends on 31 December) 100.0% 100.0% Publishing - Education
JOINT VENTURE COMPANY OF FRASER & NEAVE HOLDINGS GROUP Country of Incorporation and Place of Business: Malaysia (B) Vacaron Company Sdn Bhd 27.8% 27.8% Property Development JOINT OPERATION OF TIMES PUBLISHING GROUP Country of Incorporation and Place of Business: Singapore (D) Times Newslink
(Accounting year ends on 31 December) 50.0% 50.0% Retail of Books and
Magazines ASSOCIATED COMPANY OF THE COMPANY Country of Incorporation and Place of Business: Australia (D)(3) PMP Limited
(Accounting year ends on 30 June) 12.3% 12.1% Printing and Packaging
ASSOCIATED COMPANY OF FRASER & NEAVE HOLDINGS GROUP Country of Incorporation and Place of Business: Malaysia (D) Cocoaland Holdings Berhad
(Accounting year ends on 31 December) 15.1% 15.1% Investment Holding
ASSOCIATED COMPANIES OF TIMES PUBLISHING GROUP Country of Incorporation and Place of Business: China (E) Beijing Universal Times Culture Development Co., Ltd.
(Accounting year ends on 31 December) 40.0% 40.0% Dormant
Country of Incorporation and Place of Business: Nigeria (E) Transworld Times Press (Africa) Limited
(Accounting year ends on 31 December) 40.0% 40.0% Dormant
Notes: (B) Audited by KPMG in the respective countries. (D) Audited by other firms of auditors. (E) Not required to be audited under the laws of the country of incorporation. (3) Company is treated as an associated company of the Group by virtue of significant influence over the company.
169Fra s e r a n d N ea v e , L i m i t e d & S u b s i d i a r y C o m pa n i e s A n n u a l R e p o r t 2 0 1 6F r a s e r a n d N e a v e , L i m i t e d & S u b s i d i a r y C o m p a n i e s
PARTICULARS OF GROUP PROPERTIES
A n n u a l R e p o r t 2 0 1 6 1 6 9
The main properties as at 30 September 2016 and their net book values are indicated below: ("F&N" refers to Fraser and Neave Group and "TPL" refers to Times Publishing Group)
Land($'000)
Building($'000)
(A) CLASSIFIED AS FIXED ASSETS (Note 12 to the Financial Statements)
FREEHOLD
Singapore TPL - 1.1 hectares industrial property at Times Centre, 1 New Industrial Road 6,100 4,192
Peninsular Malaysia F&N - 18.0 hectares industrial property at Lot 3-1 & Lot 3-2, Lion Industrial Park,
Shah Alam 16,011 19,210 - 2.3 hectares industrial property at 3724 to 3726 Sungei Nyior, Butterworth 1,556 590 - 2.7 hectares industrial property at 217, Jalan Lahat, Ipoh 928 1,138 - 2.2 hectares industrial property at 701, Jalan Tampoi, Johor Bahru 2,525 48 - 0.6 hectares industrial property at 598, Jalan Tampoi, Johor Bahru 346 981 - 0.1 hectares office premise at No. 3, Jalan Metro Pudu, Fraser Business Park,
Kuala Lumpur - 4,162 - 0.4 hectares industrial property at Seksyen 26, Shah Alam, Selangor 538 266 - 2.0 hectares industrial property at Lot 7399 & 8081, Jalan Mempaga, Mukim Sabai,
Karak, Pahang 761 2,444 - 0.3 hectares office premise at Level 1, 5, 6 & 7, Kompleks Metro Pudu,
No. 1 Jalan Metro Pudu 2, Fraser Business Park, Kuala Lumpur - 4,004 - Other properties 308 103
TPL - 1.2 hectares industrial property at Lot 46, Subang Hi-Tech Industrial Park,
Batu Tiga, Shah Alam 1,270 1,813
East Malaysia F&N - 1.1 hectares industrial property at Lot 924 Block 4, Matang Land District, Sarawak 1,442 1,296
Thailand F&N - 1.2 hectares industrial property at 90 Moo 8 Mitapap Road, Phayayen District,
Amphur Pakchong, Nakonratchasima Province 30320 - 1,098 - 9.2 hectares industrial property at 668 Moo 4 Rojana Industrial Park Zone 2,
U-thai, Phra Nakhon Si Ayutthaya 13210 6,680 44,345
Australia TPL - 0.2 hectares commercial property at Unit 7 & 8 Monash Business Park,
29 Business Park Drive, Nottinghill, Melbourne - Victoria 794 281
United States of America TPL - 0.2 hectares commercial property at 99 White Plains Road, Tarrytown,
New York 683 2,693 Total Freehold 39,942 88,664
LEASEHOLD
Singapore F&N - 4.0 hectares industrial property at 214 Pandan Loop (Lease expires year 2040) - 10,694 - 0.1 hectares industrial property at 51 Quality Road (Lease expires year 2044) - 34 - 0.1 hectares industrial property at 53 Loyang Way (Lease expires year 2029) 1,789 -

170 Fra s e r a n d N ea v e , L i m i t e d & S u b s i d i a r y C o m pa n i e sA n n u a l R e p o r t 2 0 1 6 A n n u a l R e p o r t 2 0 1 6 F r a s e r a n d N e a v e , L i m i t e d & S u b s i d i a r y C o m p a n i e s
PARTICULARS OF GROUP PROPERTIES 1 7 0
Land
($'000)Building
($'000) (A) CLASSIFIED AS FIXED ASSETS (cont’d) (Note 12 to the Financial Statements)
LEASEHOLD (cont’d)
Singapore (cont’d) TPL - Commercial property at Unit #04-08 - #04-11, The Centrepoint, 176 Orchard Road (Lease expires year 2078) - 4 - 1.8 hectares industrial property at 16 & 18 Tuas Avenue 5 (Lease expires year 2043) - 11,432
Peninsular Malaysia F&N - 15.1 hectares industrial property at Lot 56, Section 4, Phase 2B, Mukim Klang, Selangor (Lease expires year 2097) 8,896 51,798 - 2.0 hectares industrial property at Plot 183 & 184, Jalan Cyber 9, Senai, Johor (Lease expires year 2068) 1,490 4,144 - 2.0 hectares industrial property at Plot 182, Jalan Cyber 9, Senai, Johor (Lease expires year 2073) 997 1,565 - Other properties 372 165
East Malaysia F&N - 2.6 hectares industrial property at 5.5 Miles Tuaran Road, Kota Kinabalu (Lease expires year 2062) 659 1,588 - 2.4 hectares industrial property at Lot 1581 Block 4, Matang Land District, Kuching (Lease expires year 2071) 1,331 913 - 2.9 hectares industrial property at Lot 4814 Block 218, KNLD, Kuching (Lease expires year 2074) 2,228 5,456 - Shop office at Lot 142 Block 63, Kuching (Lease expires year 2784) 75 50 - 0.4 hectares industrial property at Lot 1008, Bintawa Industrial Estate, Kuching (Lease expires year 2035) 6 96
Thailand F&N - 3.5 hectares industrial property at No. 19/111 Moo 7, 95 Thakarm Road, Samaedam, Bangkhuntien, Bangkok (Lease expires year 2029) - 110
TPL - Warehouse at Soi Wat Kok #20/526-527, Rama II Road, Bangkok (Lease expires year 2021) - 15 China/Hong Kong TPL - Residential property at Unit 1AF Riverside Garden, Shenyang, China (Lease expires year 2054) - 159 - Industrial property at Dachong Western Industrial District, Nansha Panyu, Guangdong, China (Lease expires year 2044) 2,311 12,250 - Offices at Seaview Estate - 10th Floor, Block C, No. 8 Watson Road, North Point, Hong Kong (Lease expires year 2057) 4,260 102 - Offices at Seaview Estate - 9th Floor, Block C, No. 8 Watson Road, North Point, Hong Kong (Lease expires year 2057) 4,039 90 Total Leasehold 28,453 100,665
TOTAL PROPERTIES (CLASSIFIED AS FIXED ASSETS) 68,395 189,329
F r a s e r a n d N e a v e , L i m i t e d & S u b s i d i a r y C o m p a n i e s
PARTICULARS OF GROUP PROPERTIES
A n n u a l R e p o r t 2 0 1 6 1 7 1
Land
($'000)Building
($'000) (B) CLASSIFIED AS COMPLETED INVESTMENT PROPERTIES (Note 13 to the Financial Statements)
Singapore TPL - 0.7 hectares industrial property at 438 Ang Mo Kio Industrial Park Leasehold (Lease expires year 2038) - 15,700
Peninsular Malaysia F&N - A building comprising office (LG to 5th Floor) at Kompleks Metro Pudu, No. 1 Jalan Metro Pudu 2, Fraser Business Park, Kuala Lumpur Freehold, lettable area - 4,702 sqm - 16,076 - Office at Lot 682 Seksyen 92, Fraser Business Park, Off Jalan Yew, Kuala Lumpur Freehold, lettable area - 3,787 sqm - 168
Hong Kong TPL - Shop unit at Houston Centre, 63 Mody Road, Tsim Sha Tsui, Kowloon Leasehold (Lease expires year 2053), lettable area - 68 sqm 1,256 118 - 0.2 hectares office at Unit 1, 10th Floor of Block A & Unit 5, 10th Floor of Block C, Ko Fai Industrial Building No. 7 Ko Fai Road, Yau Tong, Kowloon Leasehold (Lease expires year 2047) - 9,545 TOTAL PROPERTIES (CLASSIFIED AS INVESTMENT PROPERTIES) 1,256 41,607
Stage of
Completion %
EstimatedDate of
Completion
EffectiveGroup
Interest%
(C) CLASSIFIED AS PROPERTIES HELD FOR DEVELOPMENT (Note 14 to the Financial Statements)
Peninsular Malaysia F&N - Freehold land of approximately 3,787 sqm at Fraser Business Park,
Off Jalan Yew, Kuala Lumpur. - - 56 - Freehold land of approximately 188,182 sqm for a residential
property development at Lot 609, Geran 24235, Mukim Hulu Semenyih, District of Hulu Langat, Selangor. - - 56
- Freehold land of approximately 57,105 sqm for a residential property development at Lot 1954, Geran 243472, Mukim Hulu Semenyih, District of Hulu Langat, Selangor. - - 56
- Freehold land of approximately 12,759 sqm for a commercial property development at Lot 15350 to 15351 & Lot PTB 20048, Jalan Balau 1, Jalan Dato Sulaiman, Jalan Tebrau, Mukim Bandar, Johor Bahru. - - 56

171Fra s e r a n d N ea v e , L i m i t e d & S u b s i d i a r y C o m pa n i e s A n n u a l R e p o r t 2 0 1 6 A n n u a l R e p o r t 2 0 1 6 F r a s e r a n d N e a v e , L i m i t e d & S u b s i d i a r y C o m p a n i e s
PARTICULARS OF GROUP PROPERTIES 1 7 0
Land
($'000)Building
($'000) (A) CLASSIFIED AS FIXED ASSETS (cont’d) (Note 12 to the Financial Statements)
LEASEHOLD (cont’d)
Singapore (cont’d) TPL - Commercial property at Unit #04-08 - #04-11, The Centrepoint, 176 Orchard Road (Lease expires year 2078) - 4 - 1.8 hectares industrial property at 16 & 18 Tuas Avenue 5 (Lease expires year 2043) - 11,432
Peninsular Malaysia F&N - 15.1 hectares industrial property at Lot 56, Section 4, Phase 2B, Mukim Klang, Selangor (Lease expires year 2097) 8,896 51,798 - 2.0 hectares industrial property at Plot 183 & 184, Jalan Cyber 9, Senai, Johor (Lease expires year 2068) 1,490 4,144 - 2.0 hectares industrial property at Plot 182, Jalan Cyber 9, Senai, Johor (Lease expires year 2073) 997 1,565 - Other properties 372 165
East Malaysia F&N - 2.6 hectares industrial property at 5.5 Miles Tuaran Road, Kota Kinabalu (Lease expires year 2062) 659 1,588 - 2.4 hectares industrial property at Lot 1581 Block 4, Matang Land District, Kuching (Lease expires year 2071) 1,331 913 - 2.9 hectares industrial property at Lot 4814 Block 218, KNLD, Kuching (Lease expires year 2074) 2,228 5,456 - Shop office at Lot 142 Block 63, Kuching (Lease expires year 2784) 75 50 - 0.4 hectares industrial property at Lot 1008, Bintawa Industrial Estate, Kuching (Lease expires year 2035) 6 96
Thailand F&N - 3.5 hectares industrial property at No. 19/111 Moo 7, 95 Thakarm Road, Samaedam, Bangkhuntien, Bangkok (Lease expires year 2029) - 110
TPL - Warehouse at Soi Wat Kok #20/526-527, Rama II Road, Bangkok (Lease expires year 2021) - 15 China/Hong Kong TPL - Residential property at Unit 1AF Riverside Garden, Shenyang, China (Lease expires year 2054) - 159 - Industrial property at Dachong Western Industrial District, Nansha Panyu, Guangdong, China (Lease expires year 2044) 2,311 12,250 - Offices at Seaview Estate - 10th Floor, Block C, No. 8 Watson Road, North Point, Hong Kong (Lease expires year 2057) 4,260 102 - Offices at Seaview Estate - 9th Floor, Block C, No. 8 Watson Road, North Point, Hong Kong (Lease expires year 2057) 4,039 90 Total Leasehold 28,453 100,665
TOTAL PROPERTIES (CLASSIFIED AS FIXED ASSETS) 68,395 189,329
F r a s e r a n d N e a v e , L i m i t e d & S u b s i d i a r y C o m p a n i e s
PARTICULARS OF GROUP PROPERTIES
A n n u a l R e p o r t 2 0 1 6 1 7 1
Land
($'000)Building
($'000) (B) CLASSIFIED AS COMPLETED INVESTMENT PROPERTIES (Note 13 to the Financial Statements)
Singapore TPL - 0.7 hectares industrial property at 438 Ang Mo Kio Industrial Park Leasehold (Lease expires year 2038) - 15,700
Peninsular Malaysia F&N - A building comprising office (LG to 5th Floor) at Kompleks Metro Pudu, No. 1 Jalan Metro Pudu 2, Fraser Business Park, Kuala Lumpur Freehold, lettable area - 4,702 sqm - 16,076 - Office at Lot 682 Seksyen 92, Fraser Business Park, Off Jalan Yew, Kuala Lumpur Freehold, lettable area - 3,787 sqm - 168
Hong Kong TPL - Shop unit at Houston Centre, 63 Mody Road, Tsim Sha Tsui, Kowloon Leasehold (Lease expires year 2053), lettable area - 68 sqm 1,256 118 - 0.2 hectares office at Unit 1, 10th Floor of Block A & Unit 5, 10th Floor of Block C, Ko Fai Industrial Building No. 7 Ko Fai Road, Yau Tong, Kowloon Leasehold (Lease expires year 2047) - 9,545 TOTAL PROPERTIES (CLASSIFIED AS INVESTMENT PROPERTIES) 1,256 41,607
Stage of
Completion %
EstimatedDate of
Completion
EffectiveGroup
Interest%
(C) CLASSIFIED AS PROPERTIES HELD FOR DEVELOPMENT (Note 14 to the Financial Statements)
Peninsular Malaysia F&N - Freehold land of approximately 3,787 sqm at Fraser Business Park,
Off Jalan Yew, Kuala Lumpur. - - 56 - Freehold land of approximately 188,182 sqm for a residential
property development at Lot 609, Geran 24235, Mukim Hulu Semenyih, District of Hulu Langat, Selangor. - - 56
- Freehold land of approximately 57,105 sqm for a residential property development at Lot 1954, Geran 243472, Mukim Hulu Semenyih, District of Hulu Langat, Selangor. - - 56
- Freehold land of approximately 12,759 sqm for a commercial property development at Lot 15350 to 15351 & Lot PTB 20048, Jalan Balau 1, Jalan Dato Sulaiman, Jalan Tebrau, Mukim Bandar, Johor Bahru. - - 56
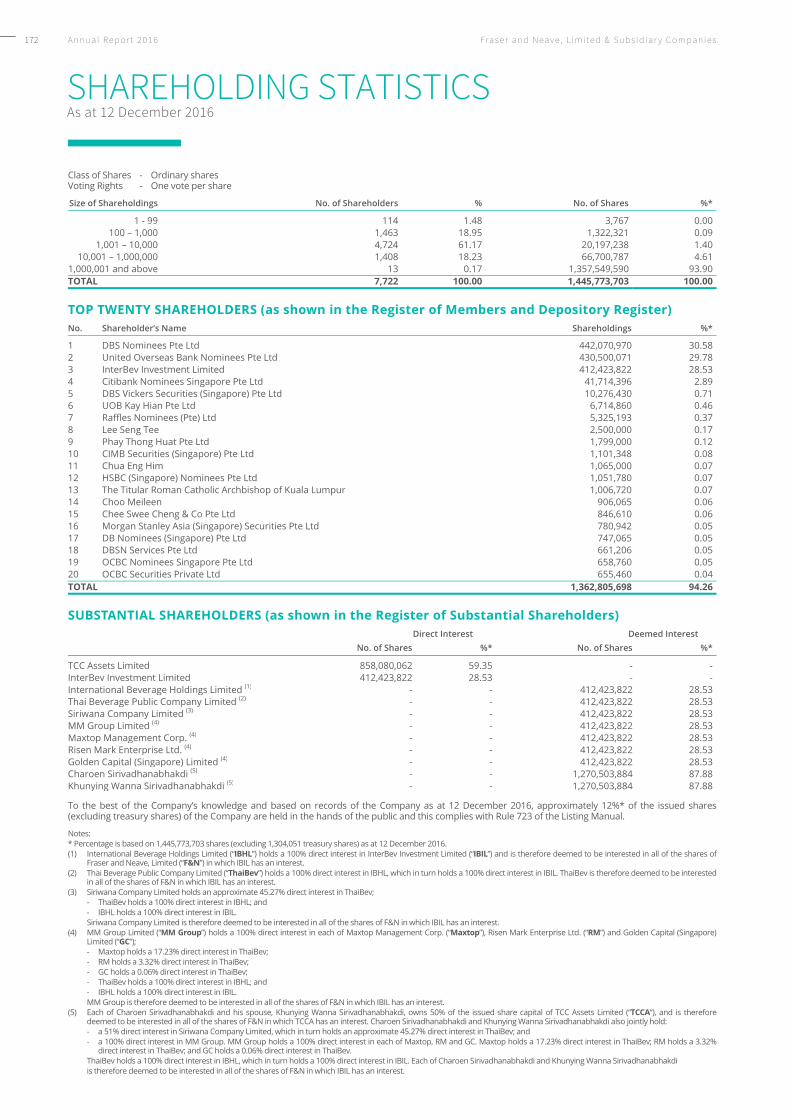
172 Fra s e r a n d N ea v e , L i m i t e d & S u b s i d i a r y C o m pa n i e sA n n u a l R e p o r t 2 0 1 6 F r a s e r a n d N e a v e , L i m i t e d & S u b s i d i a r y C o m p a n i e s
INTERESTED PERSON TRANSACTIONS
A n n u a l R e p o r t 2 0 1 6 1 8 1
Particulars of interested person transactions ("IPTs") for the period from 1 October 2015 to 30 September 2016 as required under Rule 907 of the SGX Listing Manual are set out below.
Name of interested person
Aggregate value of all IPTs during the financial year under
review (excluding transactions less than $100,000 and transactions conducted under shareholders' mandate pursuant to Rule 920)
($'000)
Aggregate value of all IPTs conducted during the financial
year under review under shareholders' mandate pursuant to
Rule 920 (excluding transactions less than $100,000)
($'000) TCC Group of Companies (1)
- Sale of products and provision of services 127 1,533- Provision of management and support services 1,224 386- Reimbursement and recovery of advertising and
promotional expenses 8,213 Nil- Purchase of products and obtaining of services Nil 7,331- Obtaining of marketing services 368 Nil- Lease of office/commercial space Nil 262- Purchase of business and assets 1,033 Nil
Note: (1) This refers to the companies and entities in the TCC Group which are controlled by Mr Charoen Sirivadhanabhakdi and Khunying Wanna
Sirivadhanabhakdi.
MATERIAL CONTRACTS (RULE 1207(8) OF THE SGX LISTING MANUAL) There were no material contracts entered into by the Company or any of its subsidiaries involving the interests of any director or controlling shareholder of the Company during the financial year under review, save as disclosed above and in this Annual Report.
A n n u a l R e p o r t 2 0 1 6
F r a s e r a n d N e a v e , L i m i t e d & S u b s i d i a r y C o m p a n i e s
SHAREHOLDING STATISTICSAs at 12 December 2016
1 7 2
Class of Shares - Ordinary shares Voting Rights - One vote per share
Size of Shareholdings No. of Shareholders % No. of Shares %*
1 - 99 114 1.48 3,767 0.00100 – 1,000 1,463 18.95 1,322,321 0.09
1,001 – 10,000 4,724 61.17 20,197,238 1.4010,001 – 1,000,000 1,408 18.23 66,700,787 4.61
1,000,001 and above 13 0.17 1,357,549,590 93.90TOTAL 7,722 100.00 1,445,773,703 100.00
TOP TWENTY SHAREHOLDERS (as shown in the Register of Members and Depository Register) No. Shareholder’s Name Shareholdings %*
1 DBS Nominees Pte Ltd 442,070,970 30.582 United Overseas Bank Nominees Pte Ltd 430,500,071 29.783 InterBev Investment Limited 412,423,822 28.534 Citibank Nominees Singapore Pte Ltd 41,714,396 2.895 DBS Vickers Securities (Singapore) Pte Ltd 10,276,430 0.716 UOB Kay Hian Pte Ltd 6,714,860 0.467 Raffles Nominees (Pte) Ltd 5,325,193 0.378 Lee Seng Tee 2,500,000 0.179 Phay Thong Huat Pte Ltd 1,799,000 0.1210 CIMB Securities (Singapore) Pte Ltd 1,101,348 0.0811 Chua Eng Him 1,065,000 0.0712 HSBC (Singapore) Nominees Pte Ltd 1,051,780 0.0713 The Titular Roman Catholic Archbishop of Kuala Lumpur 1,006,720 0.0714 Choo Meileen 906,065 0.0615 Chee Swee Cheng & Co Pte Ltd 846,610 0.0616 Morgan Stanley Asia (Singapore) Securities Pte Ltd 780,942 0.0517 DB Nominees (Singapore) Pte Ltd 747,065 0.0518 DBSN Services Pte Ltd 661,206 0.0519 OCBC Nominees Singapore Pte Ltd 658,760 0.0520 OCBC Securities Private Ltd 655,460 0.04TOTAL 1,362,805,698 94.26
SUBSTANTIAL SHAREHOLDERS (as shown in the Register of Substantial Shareholders) Direct Interest Deemed Interest
No. of Shares %* No. of Shares %*
TCC Assets Limited 858,080,062 59.35 - -InterBev Investment Limited 412,423,822 28.53 - -International Beverage Holdings Limited (1) - - 412,423,822 28.53Thai Beverage Public Company Limited (2) - - 412,423,822 28.53Siriwana Company Limited (3) - - 412,423,822 28.53MM Group Limited (4) - - 412,423,822 28.53Maxtop Management Corp. (4) - - 412,423,822 28.53Risen Mark Enterprise Ltd. (4) - - 412,423,822 28.53Golden Capital (Singapore) Limited (4) - - 412,423,822 28.53Charoen Sirivadhanabhakdi (5) - - 1,270,503,884 87.88Khunying Wanna Sirivadhanabhakdi (5) - - 1,270,503,884 87.88
To the best of the Company’s knowledge and based on records of the Company as at 12 December 2016, approximately 12%* of the issued shares (excluding treasury shares) of the Company are held in the hands of the public and this complies with Rule 723 of the Listing Manual.
Notes: * Percentage is based on 1,445,773,703 shares (excluding 1,304,051 treasury shares) as at 12 December 2016. (1) International Beverage Holdings Limited (“IBHL”) holds a 100% direct interest in InterBev Investment Limited (“IBIL”) and is therefore deemed to be interested in all of the shares of
Fraser and Neave, Limited (“F&N”) in which IBIL has an interest. (2) Thai Beverage Public Company Limited (“ThaiBev”) holds a 100% direct interest in IBHL, which in turn holds a 100% direct interest in IBIL. ThaiBev is therefore deemed to be interested
in all of the shares of F&N in which IBIL has an interest. (3) Siriwana Company Limited holds an approximate 45.27% direct interest in ThaiBev; - ThaiBev holds a 100% direct interest in IBHL; and - IBHL holds a 100% direct interest in IBIL. Siriwana Company Limited is therefore deemed to be interested in all of the shares of F&N in which IBIL has an interest. (4) MM Group Limited (“MM Group”) holds a 100% direct interest in each of Maxtop Management Corp. (“Maxtop”), Risen Mark Enterprise Ltd. (“RM”) and Golden Capital (Singapore)
Limited (“GC”); - Maxtop holds a 17.23% direct interest in ThaiBev; - RM holds a 3.32% direct interest in ThaiBev; - GC holds a 0.06% direct interest in ThaiBev; - ThaiBev holds a 100% direct interest in IBHL; and - IBHL holds a 100% direct interest in IBIL. MM Group is therefore deemed to be interested in all of the shares of F&N in which IBIL has an interest. (5) Each of Charoen Sirivadhanabhakdi and his spouse, Khunying Wanna Sirivadhanabhakdi, owns 50% of the issued share capital of TCC Assets Limited (“TCCA”), and is therefore
deemed to be interested in all of the shares of F&N in which TCCA has an interest. Charoen Sirivadhanabhakdi and Khunying Wanna Sirivadhanabhakdi also jointly hold: - a 51% direct interest in Siriwana Company Limited, which in turn holds an approximate 45.27% direct interest in ThaiBev; and
- a 100% direct interest in MM Group. MM Group holds a 100% direct interest in each of Maxtop, RM and GC. Maxtop holds a 17.23% direct interest in ThaiBev; RM holds a 3.32% direct interest in ThaiBev; and GC holds a 0.06% direct interest in ThaiBev.
ThaiBev holds a 100% direct interest in IBHL, which in turn holds a 100% direct interest in IBIL. Each of Charoen Sirivadhanabhakdi and Khunying Wanna Sirivadhanabhakdi is therefore deemed to be interested in all of the shares of F&N in which IBIL has an interest.

173Fra s e r a n d N ea v e , L i m i t e d & S u b s i d i a r y C o m pa n i e s A n n u a l R e p o r t 2 0 1 6F r a s e r a n d N e a v e , L i m i t e d & S u b s i d i a r y C o m p a n i e s
INTERESTED PERSON TRANSACTIONS
A n n u a l R e p o r t 2 0 1 6 1 8 1
Particulars of interested person transactions ("IPTs") for the period from 1 October 2015 to 30 September 2016 as required under Rule 907 of the SGX Listing Manual are set out below.
Name of interested person
Aggregate value of all IPTs during the financial year under
review (excluding transactions less than $100,000 and transactions conducted under shareholders' mandate pursuant to Rule 920)
($'000)
Aggregate value of all IPTs conducted during the financial
year under review under shareholders' mandate pursuant to
Rule 920 (excluding transactions less than $100,000)
($'000) TCC Group of Companies (1)
- Sale of products and provision of services 127 1,533- Provision of management and support services 1,224 386- Reimbursement and recovery of advertising and
promotional expenses 8,213 Nil- Purchase of products and obtaining of services Nil 7,331- Obtaining of marketing services 368 Nil- Lease of office/commercial space Nil 262- Purchase of business and assets 1,033 Nil
Note: (1) This refers to the companies and entities in the TCC Group which are controlled by Mr Charoen Sirivadhanabhakdi and Khunying Wanna
Sirivadhanabhakdi.
MATERIAL CONTRACTS (RULE 1207(8) OF THE SGX LISTING MANUAL) There were no material contracts entered into by the Company or any of its subsidiaries involving the interests of any director or controlling shareholder of the Company during the financial year under review, save as disclosed above and in this Annual Report.
A n n u a l R e p o r t 2 0 1 6
F r a s e r a n d N e a v e , L i m i t e d & S u b s i d i a r y C o m p a n i e s
SHAREHOLDING STATISTICSAs at 12 December 2016
1 7 2
Class of Shares - Ordinary shares Voting Rights - One vote per share
Size of Shareholdings No. of Shareholders % No. of Shares %*
1 - 99 114 1.48 3,767 0.00100 – 1,000 1,463 18.95 1,322,321 0.09
1,001 – 10,000 4,724 61.17 20,197,238 1.4010,001 – 1,000,000 1,408 18.23 66,700,787 4.61
1,000,001 and above 13 0.17 1,357,549,590 93.90TOTAL 7,722 100.00 1,445,773,703 100.00
TOP TWENTY SHAREHOLDERS (as shown in the Register of Members and Depository Register) No. Shareholder’s Name Shareholdings %*
1 DBS Nominees Pte Ltd 442,070,970 30.582 United Overseas Bank Nominees Pte Ltd 430,500,071 29.783 InterBev Investment Limited 412,423,822 28.534 Citibank Nominees Singapore Pte Ltd 41,714,396 2.895 DBS Vickers Securities (Singapore) Pte Ltd 10,276,430 0.716 UOB Kay Hian Pte Ltd 6,714,860 0.467 Raffles Nominees (Pte) Ltd 5,325,193 0.378 Lee Seng Tee 2,500,000 0.179 Phay Thong Huat Pte Ltd 1,799,000 0.1210 CIMB Securities (Singapore) Pte Ltd 1,101,348 0.0811 Chua Eng Him 1,065,000 0.0712 HSBC (Singapore) Nominees Pte Ltd 1,051,780 0.0713 The Titular Roman Catholic Archbishop of Kuala Lumpur 1,006,720 0.0714 Choo Meileen 906,065 0.0615 Chee Swee Cheng & Co Pte Ltd 846,610 0.0616 Morgan Stanley Asia (Singapore) Securities Pte Ltd 780,942 0.0517 DB Nominees (Singapore) Pte Ltd 747,065 0.0518 DBSN Services Pte Ltd 661,206 0.0519 OCBC Nominees Singapore Pte Ltd 658,760 0.0520 OCBC Securities Private Ltd 655,460 0.04TOTAL 1,362,805,698 94.26
SUBSTANTIAL SHAREHOLDERS (as shown in the Register of Substantial Shareholders) Direct Interest Deemed Interest
No. of Shares %* No. of Shares %*
TCC Assets Limited 858,080,062 59.35 - -InterBev Investment Limited 412,423,822 28.53 - -International Beverage Holdings Limited (1) - - 412,423,822 28.53Thai Beverage Public Company Limited (2) - - 412,423,822 28.53Siriwana Company Limited (3) - - 412,423,822 28.53MM Group Limited (4) - - 412,423,822 28.53Maxtop Management Corp. (4) - - 412,423,822 28.53Risen Mark Enterprise Ltd. (4) - - 412,423,822 28.53Golden Capital (Singapore) Limited (4) - - 412,423,822 28.53Charoen Sirivadhanabhakdi (5) - - 1,270,503,884 87.88Khunying Wanna Sirivadhanabhakdi (5) - - 1,270,503,884 87.88
To the best of the Company’s knowledge and based on records of the Company as at 12 December 2016, approximately 12%* of the issued shares (excluding treasury shares) of the Company are held in the hands of the public and this complies with Rule 723 of the Listing Manual.
Notes: * Percentage is based on 1,445,773,703 shares (excluding 1,304,051 treasury shares) as at 12 December 2016. (1) International Beverage Holdings Limited (“IBHL”) holds a 100% direct interest in InterBev Investment Limited (“IBIL”) and is therefore deemed to be interested in all of the shares of
Fraser and Neave, Limited (“F&N”) in which IBIL has an interest. (2) Thai Beverage Public Company Limited (“ThaiBev”) holds a 100% direct interest in IBHL, which in turn holds a 100% direct interest in IBIL. ThaiBev is therefore deemed to be interested
in all of the shares of F&N in which IBIL has an interest. (3) Siriwana Company Limited holds an approximate 45.27% direct interest in ThaiBev; - ThaiBev holds a 100% direct interest in IBHL; and - IBHL holds a 100% direct interest in IBIL. Siriwana Company Limited is therefore deemed to be interested in all of the shares of F&N in which IBIL has an interest. (4) MM Group Limited (“MM Group”) holds a 100% direct interest in each of Maxtop Management Corp. (“Maxtop”), Risen Mark Enterprise Ltd. (“RM”) and Golden Capital (Singapore)
Limited (“GC”); - Maxtop holds a 17.23% direct interest in ThaiBev; - RM holds a 3.32% direct interest in ThaiBev; - GC holds a 0.06% direct interest in ThaiBev; - ThaiBev holds a 100% direct interest in IBHL; and - IBHL holds a 100% direct interest in IBIL. MM Group is therefore deemed to be interested in all of the shares of F&N in which IBIL has an interest. (5) Each of Charoen Sirivadhanabhakdi and his spouse, Khunying Wanna Sirivadhanabhakdi, owns 50% of the issued share capital of TCC Assets Limited (“TCCA”), and is therefore
deemed to be interested in all of the shares of F&N in which TCCA has an interest. Charoen Sirivadhanabhakdi and Khunying Wanna Sirivadhanabhakdi also jointly hold: - a 51% direct interest in Siriwana Company Limited, which in turn holds an approximate 45.27% direct interest in ThaiBev; and
- a 100% direct interest in MM Group. MM Group holds a 100% direct interest in each of Maxtop, RM and GC. Maxtop holds a 17.23% direct interest in ThaiBev; RM holds a 3.32% direct interest in ThaiBev; and GC holds a 0.06% direct interest in ThaiBev.
ThaiBev holds a 100% direct interest in IBHL, which in turn holds a 100% direct interest in IBIL. Each of Charoen Sirivadhanabhakdi and Khunying Wanna Sirivadhanabhakdi is therefore deemed to be interested in all of the shares of F&N in which IBIL has an interest.

174 Fra s e r a n d N ea v e , L i m i t e d & S u b s i d i a r y C o m pa n i e sA n n u a l R e p o r t 2 0 1 6 A n n u a l R e p o r t 2 0 1 6 F r a s e r a n d N e a v e , L i m i t e d & S u b s i d i a r y C o m p a n i e s
NOTICE OF ANNUAL GENERAL MEETING1 8 4
FRASER AND NEAVE, LIMITED (Company Registration No. 189800001R) (Incorporated in Singapore)
NOTICE OF ANNUAL GENERAL MEETING Date : Tuesday, 24 January 2017
Place : Ballrooms II and III Level 2, InterContinental Singapore 80 Middle Road Singapore 188966
NOTICE IS HEREBY GIVEN that the 118th Annual General Meeting of FRASER AND NEAVE, LIMITED (the “Company”) will be held at Ballrooms II and III, Level 2, InterContinental Singapore, 80 Middle Road, Singapore 188966 on Tuesday, 24 January 2017 at 9.30 a.m. for the following purposes:
ROUTINE BUSINESS 1. To receive and adopt the Directors’ statement and audited financial statements for the year ended 30 September 2016 and
the auditor’s report thereon.
2. To approve a final tax-exempt (one tier) dividend of 3.0 cents per share in respect of the year ended 30 September 2016.
3. To pass the following resolutions on the recommendation of the Nominating Committee and endorsement of the Board of Directors in respect of appointment of Directors1:
(a) “That Mr Timothy Chia Chee Ming, who will retire by rotation pursuant to article 117 of the Constitution of the Company and who, being eligible, has offered himself for re-election, be and is hereby re-appointed as a Director of the Company.”
Subject to his re-appointment, Mr Chia, who is considered an independent Director, will be re-appointed as Chairman of the Remuneration Committee and a Member of the Audit Committee.
(b) “That Mrs Siripen Sitasuwan, who will retire by rotation pursuant to article 117 of the Constitution of the Company and who, being eligible, has offered herself for re-election, be and is hereby re-appointed as a Director of the Company.”
Subject to her re-appointment, Mrs Siripen, who is considered an independent Director, will be re-appointed as Chairman of the Audit Committee and a Member of each of the Remuneration and Nominating Committees.
(c) “That Mr Chotiphat Bijananda, who will retire by rotation pursuant to article 117 of the Constitution of the Company and who, being eligible, has offered himself for re-election, be and is hereby re-appointed as a Director of the Company.”
Subject to his re-appointment, Mr Chotiphat will continue in office as a Director of the Company.
4. To approve Directors’ fees of up to S$2,000,000 payable by the Company for the year ending 30 September 2017 (last year: up to S$2,000,000).
5. To re-appoint KPMG LLP as the auditor of the Company and to authorise the Directors to fix their remuneration.
SPECIAL BUSINESS To consider and, if thought fit, to pass, with or without modifications, the following resolutions, which will be proposed as Ordinary Resolutions:
6. “That authority be and is hereby given to the Directors of the Company to:
(a) (i) issue shares of the Company (“shares”) whether by way of rights, bonus or otherwise; and/or
(ii) make or grant offers, agreements or options (collectively, “Instruments”) that might or would require shares to be issued, including but not limited to the creation and issue of (as well as adjustments to) warrants, debentures, or other instruments convertible into shares,
at any time and upon such terms and conditions and for such purposes and to such persons as the Directors may in their absolute discretion deem fit; and
1 Detailed information on the Directors who are proposed to be re-appointed can be found under “Board of Directors” and “Corporate Governance” in the Annual Report 2016 of the Company.
F r a s e r a n d N e a v e , L i m i t e d & S u b s i d i a r y C o m p a n i e s
NOTICE OF ANNUAL GENERAL MEETING
A n n u a l R e p o r t 2 0 1 6 1 8 5
(b) (notwithstanding the authority conferred by this Resolution may have ceased to be in force) issue shares in pursuance of any Instrument made or granted by the Directors while this Resolution was in force,
provided that:
(1) the aggregate number of shares to be issued pursuant to this Resolution (including shares to be issued in pursuance of Instruments made or granted pursuant to this Resolution) does not exceed 50% of the total number of issued shares, excluding treasury shares (as calculated in accordance with sub-paragraph (2) below), of which the aggregate number of shares to be issued other than on a pro rata basis to shareholders of the Company (including shares to be issued in pursuance of Instruments made or granted pursuant to this Resolution) shall not exceed 20% of the total number of issued shares, excluding treasury shares (as calculated in accordance with sub-paragraph (2) below);
(2) (subject to such manner of calculation as may be prescribed by the Singapore Exchange Securities Trading Limited (the “SGX-ST”)) for the purpose of determining the aggregate number of shares that may be issued under sub-paragraph (1) above, the percentage of issued shares shall be based on the total number of issued shares, excluding treasury shares, at the time this Resolution is passed, after adjusting for:
(i) new shares arising from the conversion or exercise of any convertible securities or share options or vesting of share awards which are outstanding or subsisting at the time this Resolution is passed; and
(ii) any subsequent bonus issue, consolidation or subdivision of shares;
(3) in exercising the authority conferred by this Resolution, the Company shall comply with the provisions of the Listing Manual of the SGX-ST for the time being in force (unless such compliance has been waived by the SGX-ST) and the Constitution for the time being of the Company; and
(4) (unless revoked or varied by the Company in general meeting) the authority conferred by this Resolution shall continue in force until the conclusion of the next Annual General Meeting of the Company or the date by which the next Annual General Meeting of the Company is required by law to be held, whichever is the earlier.”
7. “That authority be and is hereby given to the Directors of the Company to:
(a) grant awards in accordance with the provisions of the F&N Restricted Share Plan (the “Restricted Share Plan”) and/or the F&N Performance Share Plan (the “Performance Share Plan”); and
(b) allot and issue such number of ordinary shares of the Company as may be required to be delivered pursuant to the vesting of awards under the Restricted Share Plan and/or the Performance Share Plan,
provided that the aggregate number of new ordinary shares allotted and issued and/or to be allotted and issued, when aggregated with existing ordinary shares (including shares held in treasury) delivered and/or to be delivered, pursuant to the Restricted Share Plan and the Performance Share Plan, shall not exceed 10% of the total number of issued ordinary shares of the Company, excluding treasury shares, from time to time.”
8. “That authority be and is hereby given to the Directors of the Company to allot and issue from time to time such number of ordinary shares of the Company as may be required to be allotted and issued pursuant to the Fraser and Neave, Limited Scrip Dividend Scheme.”
9. “That:
(a) approval be and is hereby given, for the purposes of Chapter 9 of the Listing Manual (“Chapter 9”) of the Singapore Exchange Securities Trading Limited, for the Company, its subsidiaries and associated companies that are considered to be “entities at risk” under Chapter 9, or any of them, to enter into any of the transactions falling within the types of interested person transactions described in the Appendix to the Company’s Letter to Shareholders dated 5 January 2017 (the “Letter”), with any party who is of the class of interested persons described in the Appendix to the Letter, provided that such transactions are made on normal commercial terms and in accordance with the review procedures for such interested person transactions (the “IPT Mandate”);
(b) the IPT Mandate shall, unless revoked or varied by the Company in general meeting, continue in force until the conclusion of the next Annual General Meeting of the Company; and
(c) the Directors of the Company and/or any of them be and are hereby authorised to complete and do all such acts and things (including executing all such documents as may be required) as they and/or he may consider expedient or necessary or in the interests of the Company to give effect to the IPT Mandate and/or this Resolution.”

175Fra s e r a n d N ea v e , L i m i t e d & S u b s i d i a r y C o m pa n i e s A n n u a l R e p o r t 2 0 1 6 A n n u a l R e p o r t 2 0 1 6 F r a s e r a n d N e a v e , L i m i t e d & S u b s i d i a r y C o m p a n i e s
NOTICE OF ANNUAL GENERAL MEETING1 8 4
FRASER AND NEAVE, LIMITED (Company Registration No. 189800001R) (Incorporated in Singapore)
NOTICE OF ANNUAL GENERAL MEETING Date : Tuesday, 24 January 2017
Place : Ballrooms II and III Level 2, InterContinental Singapore 80 Middle Road Singapore 188966
NOTICE IS HEREBY GIVEN that the 118th Annual General Meeting of FRASER AND NEAVE, LIMITED (the “Company”) will be held at Ballrooms II and III, Level 2, InterContinental Singapore, 80 Middle Road, Singapore 188966 on Tuesday, 24 January 2017 at 9.30 a.m. for the following purposes:
ROUTINE BUSINESS 1. To receive and adopt the Directors’ statement and audited financial statements for the year ended 30 September 2016 and
the auditor’s report thereon.
2. To approve a final tax-exempt (one tier) dividend of 3.0 cents per share in respect of the year ended 30 September 2016.
3. To pass the following resolutions on the recommendation of the Nominating Committee and endorsement of the Board of Directors in respect of appointment of Directors1:
(a) “That Mr Timothy Chia Chee Ming, who will retire by rotation pursuant to article 117 of the Constitution of the Company and who, being eligible, has offered himself for re-election, be and is hereby re-appointed as a Director of the Company.”
Subject to his re-appointment, Mr Chia, who is considered an independent Director, will be re-appointed as Chairman of the Remuneration Committee and a Member of the Audit Committee.
(b) “That Mrs Siripen Sitasuwan, who will retire by rotation pursuant to article 117 of the Constitution of the Company and who, being eligible, has offered herself for re-election, be and is hereby re-appointed as a Director of the Company.”
Subject to her re-appointment, Mrs Siripen, who is considered an independent Director, will be re-appointed as Chairman of the Audit Committee and a Member of each of the Remuneration and Nominating Committees.
(c) “That Mr Chotiphat Bijananda, who will retire by rotation pursuant to article 117 of the Constitution of the Company and who, being eligible, has offered himself for re-election, be and is hereby re-appointed as a Director of the Company.”
Subject to his re-appointment, Mr Chotiphat will continue in office as a Director of the Company.
4. To approve Directors’ fees of up to S$2,000,000 payable by the Company for the year ending 30 September 2017 (last year: up to S$2,000,000).
5. To re-appoint KPMG LLP as the auditor of the Company and to authorise the Directors to fix their remuneration.
SPECIAL BUSINESS To consider and, if thought fit, to pass, with or without modifications, the following resolutions, which will be proposed as Ordinary Resolutions:
6. “That authority be and is hereby given to the Directors of the Company to:
(a) (i) issue shares of the Company (“shares”) whether by way of rights, bonus or otherwise; and/or
(ii) make or grant offers, agreements or options (collectively, “Instruments”) that might or would require shares to be issued, including but not limited to the creation and issue of (as well as adjustments to) warrants, debentures, or other instruments convertible into shares,
at any time and upon such terms and conditions and for such purposes and to such persons as the Directors may in their absolute discretion deem fit; and
1 Detailed information on the Directors who are proposed to be re-appointed can be found under “Board of Directors” and “Corporate Governance” in the Annual Report 2016 of the Company.
F r a s e r a n d N e a v e , L i m i t e d & S u b s i d i a r y C o m p a n i e s
NOTICE OF ANNUAL GENERAL MEETING
A n n u a l R e p o r t 2 0 1 6 1 8 5
(b) (notwithstanding the authority conferred by this Resolution may have ceased to be in force) issue shares in pursuance of any Instrument made or granted by the Directors while this Resolution was in force,
provided that:
(1) the aggregate number of shares to be issued pursuant to this Resolution (including shares to be issued in pursuance of Instruments made or granted pursuant to this Resolution) does not exceed 50% of the total number of issued shares, excluding treasury shares (as calculated in accordance with sub-paragraph (2) below), of which the aggregate number of shares to be issued other than on a pro rata basis to shareholders of the Company (including shares to be issued in pursuance of Instruments made or granted pursuant to this Resolution) shall not exceed 20% of the total number of issued shares, excluding treasury shares (as calculated in accordance with sub-paragraph (2) below);
(2) (subject to such manner of calculation as may be prescribed by the Singapore Exchange Securities Trading Limited (the “SGX-ST”)) for the purpose of determining the aggregate number of shares that may be issued under sub-paragraph (1) above, the percentage of issued shares shall be based on the total number of issued shares, excluding treasury shares, at the time this Resolution is passed, after adjusting for:
(i) new shares arising from the conversion or exercise of any convertible securities or share options or vesting of share awards which are outstanding or subsisting at the time this Resolution is passed; and
(ii) any subsequent bonus issue, consolidation or subdivision of shares;
(3) in exercising the authority conferred by this Resolution, the Company shall comply with the provisions of the Listing Manual of the SGX-ST for the time being in force (unless such compliance has been waived by the SGX-ST) and the Constitution for the time being of the Company; and
(4) (unless revoked or varied by the Company in general meeting) the authority conferred by this Resolution shall continue in force until the conclusion of the next Annual General Meeting of the Company or the date by which the next Annual General Meeting of the Company is required by law to be held, whichever is the earlier.”
7. “That authority be and is hereby given to the Directors of the Company to:
(a) grant awards in accordance with the provisions of the F&N Restricted Share Plan (the “Restricted Share Plan”) and/or the F&N Performance Share Plan (the “Performance Share Plan”); and
(b) allot and issue such number of ordinary shares of the Company as may be required to be delivered pursuant to the vesting of awards under the Restricted Share Plan and/or the Performance Share Plan,
provided that the aggregate number of new ordinary shares allotted and issued and/or to be allotted and issued, when aggregated with existing ordinary shares (including shares held in treasury) delivered and/or to be delivered, pursuant to the Restricted Share Plan and the Performance Share Plan, shall not exceed 10% of the total number of issued ordinary shares of the Company, excluding treasury shares, from time to time.”
8. “That authority be and is hereby given to the Directors of the Company to allot and issue from time to time such number of ordinary shares of the Company as may be required to be allotted and issued pursuant to the Fraser and Neave, Limited Scrip Dividend Scheme.”
9. “That:
(a) approval be and is hereby given, for the purposes of Chapter 9 of the Listing Manual (“Chapter 9”) of the Singapore Exchange Securities Trading Limited, for the Company, its subsidiaries and associated companies that are considered to be “entities at risk” under Chapter 9, or any of them, to enter into any of the transactions falling within the types of interested person transactions described in the Appendix to the Company’s Letter to Shareholders dated 5 January 2017 (the “Letter”), with any party who is of the class of interested persons described in the Appendix to the Letter, provided that such transactions are made on normal commercial terms and in accordance with the review procedures for such interested person transactions (the “IPT Mandate”);
(b) the IPT Mandate shall, unless revoked or varied by the Company in general meeting, continue in force until the conclusion of the next Annual General Meeting of the Company; and
(c) the Directors of the Company and/or any of them be and are hereby authorised to complete and do all such acts and things (including executing all such documents as may be required) as they and/or he may consider expedient or necessary or in the interests of the Company to give effect to the IPT Mandate and/or this Resolution.”

176 Fra s e r a n d N ea v e , L i m i t e d & S u b s i d i a r y C o m pa n i e sA n n u a l R e p o r t 2 0 1 6 A n n u a l R e p o r t 2 0 1 6 F r a s e r a n d N e a v e , L i m i t e d & S u b s i d i a r y C o m p a n i e s
NOTICE OF ANNUAL GENERAL MEETING1 8 6
10. “That:
(a) for the purposes of Sections 76C and 76E of the Companies Act, Chapter 50 (the “Companies Act”), the exercise by the Directors of the Company of all the powers of the Company to purchase or otherwise acquire issued ordinary shares of the Company (“Shares”) not exceeding in aggregate the Maximum Percentage (as hereafter defined), at such price or prices as may be determined by the Directors from time to time up to the Maximum Price (as hereafter defined), whether by way of:
(i) market purchase(s) on the Singapore Exchange Securities Trading Limited (the “SGX-ST”) transacted through the SGX-ST trading system and/or any other securities exchange on which the Shares may for the time being be listed and quoted (“Other Exchange”); and/or
(ii) off-market purchase(s) (if effected otherwise than on the SGX-ST or, as the case may be, Other Exchange) in accordance with any equal access scheme(s) as may be determined or formulated by the Directors as they consider fit, which scheme(s) shall satisfy all the conditions prescribed by the Companies Act,
and otherwise in accordance with all other laws and regulations and rules of the SGX-ST or, as the case may be, Other Exchange as may for the time being be applicable, be and is hereby authorised and approved generally and unconditionally (the “Share Purchase Mandate”);
(b) unless varied or revoked by the Company in general meeting, the authority conferred on the Directors of the Company pursuant to the Share Purchase Mandate may be exercised by the Directors at any time and from time to time during the period commencing from the date of the passing of this Resolution and expiring on the earliest of:
(i) the date on which the next Annual General Meeting of the Company is held;
(ii) the date by which the next Annual General Meeting of the Company is required by law to be held; and
(iii) the date on which purchases and acquisitions of Shares pursuant to the Share Purchase Mandate are carried out to the full extent mandated;
(c) in this Resolution:
“Average Closing Price” means the average of the closing market prices of a Share over the five consecutive market days on which the Shares are transacted on the SGX-ST or, as the case may be, Other Exchange, immediately preceding the date of the market purchase by the Company or, as the case may be, the date of the making of the offer pursuant to the off-market purchase, and deemed to be adjusted, in accordance with the listing rules of the SGX-ST, for any corporate action that occurs after the relevant five-day period;
“date of the making of the offer” means the date on which the Company makes an offer for the purchase or acquisition of Shares from holders of Shares, stating therein the relevant terms of the equal access scheme for effecting the off-market purchase;
“Maximum Percentage” means that number of issued Shares representing 7% of the issued Shares as at the date of the passing of this Resolution (excluding any Shares which are held as treasury shares as at that date); and
“Maximum Price” in relation to a Share to be purchased or acquired, means the purchase price (excluding related brokerage, commission, applicable goods and services tax, stamp duties, clearance fees and other related expenses) which shall not exceed 105% of the Average Closing Price of the Shares; and
(d) the Directors of the Company and/or any of them be and are hereby authorised to complete and do all such acts and things (including executing all such documents as may be required) as they and/or he may consider expedient or necessary or in the interests of the Company to give effect to the transactions contemplated and/or authorised by this Resolution.”
By Order of the Board Anthony Cheong Fook Seng Company Secretary 5 January 2017
F r a s e r a n d N e a v e , L i m i t e d & S u b s i d i a r y C o m p a n i e s
NOTICE OF ANNUAL GENERAL MEETING
A n n u a l R e p o r t 2 0 1 6 1 8 7
NOTES: 1. (a) A member of the Company who is not a relevant intermediary is entitled to appoint not more than two proxies to
attend, speak and vote at the meeting. Where such member’s form of proxy appoints more than one proxy, the proportion of the shareholding concerned to be represented by each proxy shall be specified in the form of proxy.
(b) A member of the Company who is a relevant intermediary is entitled to appoint more than two proxies to attend, speak and vote at the meeting, but each proxy must be appointed to exercise the rights attached to a different share or shares held by such member. Where such member’s form of proxy appoints more than two proxies, the number and class of shares in relation to which each proxy has been appointed shall be specified in the form of proxy.
“Relevant intermediary” has the meaning ascribed to it in Section 181 of the Companies Act, Chapter 50.
2. A proxy need not be a member of the Company.
3. The instrument appointing a proxy or proxies must be deposited at the office of the share registrar of the Company, Tricor Barbinder Share Registration Services (A division of Tricor Singapore Pte. Ltd.), 80 Robinson Road #11-02, Singapore 068898, not less than 72 hours before the time appointed for holding the meeting.
EXPLANATORY NOTES: (a) The Ordinary Resolution proposed in item 6 above is to authorise the Directors of the Company from the date of the Annual
General Meeting until the next Annual General Meeting to issue shares and/or make or grant instruments that might require shares to be issued, and to issue shares in pursuance of such instruments, up to a limit of 50% of the total number of issued shares of the Company, excluding treasury shares, with a sub-limit of 20% for issues other than on a pro rata basis, calculated as described in the Resolution.
(b) The Ordinary Resolution proposed in item 7 above is to authorise the Directors of the Company to offer and grant awards and to issue ordinary shares of the Company pursuant to the F&N Restricted Share Plan (the “Restricted Share Plan”) and the F&N Performance Share Plan (the “Performance Share Plan”) provided that the aggregate number of new ordinary shares allotted and issued and/or to be allotted and issued, when aggregated with existing ordinary shares (including shares held in treasury) delivered and/or to be delivered, pursuant to the Restricted Share Plan and the Performance Share Plan, shall not exceed 10% of the total number of issued ordinary shares of the Company, excluding treasury shares, from time to time. The Committee administering the Restricted Share Plan and the Performance Share Plan currently does not intend, in any given year, to grant awards under the Restricted Share Plan and the Performance Share Plan which would comprise more than 1% of the total number of issued ordinary shares from time to time (the “Yearly Limit”). However, if the Yearly Limit is not fully utilised in any given year, the balance of the unutilised Yearly Limit may be used by the Company to make grants of awards in subsequent years.
(c) The Ordinary Resolution proposed in item 8 above is to authorise the Directors of the Company to allot and issue ordinary shares of the Company pursuant to the Fraser and Neave, Limited Scrip Dividend Scheme to eligible members who, in respect of a qualifying dividend, have elected to receive scrip in lieu of the cash amount of that qualifying dividend.
(d) The Ordinary Resolution proposed in item 9 above is to renew the mandate to enable the Company, its subsidiaries and associated companies that are considered to be “entities at risk” under Chapter 9 of the Listing Manual, or any of them, to enter into certain interested person transactions with specified classes of interested persons, as described in the Letter to Shareholders dated 5 January 2017 (the “Letter”). Please refer to the Letter for more details.
(e) The Ordinary Resolution proposed in item 10 above is to renew the mandate to allow the Company to purchase or otherwise acquire its issued ordinary shares, on the terms and subject to the conditions set out in the Resolution.
The Company intends to use internal resources or external borrowings or a combination of both to finance the purchase or acquisition of its ordinary shares. The amount of financing required for the Company to purchase or acquire its ordinary shares, and the impact on the Company’s financial position, cannot be ascertained as at the date of this Notice as these will depend on the number of ordinary shares purchased or acquired, whether the purchase or acquisition is made out of capital or profits, and the price at which such ordinary shares were purchased or acquired and whether the ordinary shares purchased or acquired are held in treasury or cancelled.
Purely for illustrative purposes only, the financial effects of an assumed purchase or acquisition of (i) 28,915,474 ordinary shares on 12 December 2016 (the “Latest Practicable Date”), representing 2% of the issued ordinary shares (excluding treasury shares) as at that date, and (ii) 101,204,159 ordinary shares on the Latest Practicable Date, representing 7% of the issued ordinary shares (excluding treasury shares) as at that date, at the maximum price of S$2.20 for one ordinary share (being the price equivalent to 5% above the average of the closing market prices of the ordinary shares for the five consecutive market days on which the ordinary shares were traded on the Singapore Exchange Securities Trading Limited immediately preceding the Latest Practicable Date), in the case of a market purchase and an off-market purchase respectively, based on the audited financial statements of the Company and its subsidiaries for the financial year ended 30 September 2016 and certain assumptions, are set out in paragraph 3.7 of the Letter.
Please refer to the Letter for more details.

177Fra s e r a n d N ea v e , L i m i t e d & S u b s i d i a r y C o m pa n i e s A n n u a l R e p o r t 2 0 1 6 A n n u a l R e p o r t 2 0 1 6 F r a s e r a n d N e a v e , L i m i t e d & S u b s i d i a r y C o m p a n i e s
NOTICE OF ANNUAL GENERAL MEETING1 8 6
10. “That:
(a) for the purposes of Sections 76C and 76E of the Companies Act, Chapter 50 (the “Companies Act”), the exercise by the Directors of the Company of all the powers of the Company to purchase or otherwise acquire issued ordinary shares of the Company (“Shares”) not exceeding in aggregate the Maximum Percentage (as hereafter defined), at such price or prices as may be determined by the Directors from time to time up to the Maximum Price (as hereafter defined), whether by way of:
(i) market purchase(s) on the Singapore Exchange Securities Trading Limited (the “SGX-ST”) transacted through the SGX-ST trading system and/or any other securities exchange on which the Shares may for the time being be listed and quoted (“Other Exchange”); and/or
(ii) off-market purchase(s) (if effected otherwise than on the SGX-ST or, as the case may be, Other Exchange) in accordance with any equal access scheme(s) as may be determined or formulated by the Directors as they consider fit, which scheme(s) shall satisfy all the conditions prescribed by the Companies Act,
and otherwise in accordance with all other laws and regulations and rules of the SGX-ST or, as the case may be, Other Exchange as may for the time being be applicable, be and is hereby authorised and approved generally and unconditionally (the “Share Purchase Mandate”);
(b) unless varied or revoked by the Company in general meeting, the authority conferred on the Directors of the Company pursuant to the Share Purchase Mandate may be exercised by the Directors at any time and from time to time during the period commencing from the date of the passing of this Resolution and expiring on the earliest of:
(i) the date on which the next Annual General Meeting of the Company is held;
(ii) the date by which the next Annual General Meeting of the Company is required by law to be held; and
(iii) the date on which purchases and acquisitions of Shares pursuant to the Share Purchase Mandate are carried out to the full extent mandated;
(c) in this Resolution:
“Average Closing Price” means the average of the closing market prices of a Share over the five consecutive market days on which the Shares are transacted on the SGX-ST or, as the case may be, Other Exchange, immediately preceding the date of the market purchase by the Company or, as the case may be, the date of the making of the offer pursuant to the off-market purchase, and deemed to be adjusted, in accordance with the listing rules of the SGX-ST, for any corporate action that occurs after the relevant five-day period;
“date of the making of the offer” means the date on which the Company makes an offer for the purchase or acquisition of Shares from holders of Shares, stating therein the relevant terms of the equal access scheme for effecting the off-market purchase;
“Maximum Percentage” means that number of issued Shares representing 7% of the issued Shares as at the date of the passing of this Resolution (excluding any Shares which are held as treasury shares as at that date); and
“Maximum Price” in relation to a Share to be purchased or acquired, means the purchase price (excluding related brokerage, commission, applicable goods and services tax, stamp duties, clearance fees and other related expenses) which shall not exceed 105% of the Average Closing Price of the Shares; and
(d) the Directors of the Company and/or any of them be and are hereby authorised to complete and do all such acts and things (including executing all such documents as may be required) as they and/or he may consider expedient or necessary or in the interests of the Company to give effect to the transactions contemplated and/or authorised by this Resolution.”
By Order of the Board Anthony Cheong Fook Seng Company Secretary 5 January 2017
F r a s e r a n d N e a v e , L i m i t e d & S u b s i d i a r y C o m p a n i e s
NOTICE OF ANNUAL GENERAL MEETING
A n n u a l R e p o r t 2 0 1 6 1 8 7
NOTES: 1. (a) A member of the Company who is not a relevant intermediary is entitled to appoint not more than two proxies to
attend, speak and vote at the meeting. Where such member’s form of proxy appoints more than one proxy, the proportion of the shareholding concerned to be represented by each proxy shall be specified in the form of proxy.
(b) A member of the Company who is a relevant intermediary is entitled to appoint more than two proxies to attend, speak and vote at the meeting, but each proxy must be appointed to exercise the rights attached to a different share or shares held by such member. Where such member’s form of proxy appoints more than two proxies, the number and class of shares in relation to which each proxy has been appointed shall be specified in the form of proxy.
“Relevant intermediary” has the meaning ascribed to it in Section 181 of the Companies Act, Chapter 50.
2. A proxy need not be a member of the Company.
3. The instrument appointing a proxy or proxies must be deposited at the office of the share registrar of the Company, Tricor Barbinder Share Registration Services (A division of Tricor Singapore Pte. Ltd.), 80 Robinson Road #11-02, Singapore 068898, not less than 72 hours before the time appointed for holding the meeting.
EXPLANATORY NOTES: (a) The Ordinary Resolution proposed in item 6 above is to authorise the Directors of the Company from the date of the Annual
General Meeting until the next Annual General Meeting to issue shares and/or make or grant instruments that might require shares to be issued, and to issue shares in pursuance of such instruments, up to a limit of 50% of the total number of issued shares of the Company, excluding treasury shares, with a sub-limit of 20% for issues other than on a pro rata basis, calculated as described in the Resolution.
(b) The Ordinary Resolution proposed in item 7 above is to authorise the Directors of the Company to offer and grant awards and to issue ordinary shares of the Company pursuant to the F&N Restricted Share Plan (the “Restricted Share Plan”) and the F&N Performance Share Plan (the “Performance Share Plan”) provided that the aggregate number of new ordinary shares allotted and issued and/or to be allotted and issued, when aggregated with existing ordinary shares (including shares held in treasury) delivered and/or to be delivered, pursuant to the Restricted Share Plan and the Performance Share Plan, shall not exceed 10% of the total number of issued ordinary shares of the Company, excluding treasury shares, from time to time. The Committee administering the Restricted Share Plan and the Performance Share Plan currently does not intend, in any given year, to grant awards under the Restricted Share Plan and the Performance Share Plan which would comprise more than 1% of the total number of issued ordinary shares from time to time (the “Yearly Limit”). However, if the Yearly Limit is not fully utilised in any given year, the balance of the unutilised Yearly Limit may be used by the Company to make grants of awards in subsequent years.
(c) The Ordinary Resolution proposed in item 8 above is to authorise the Directors of the Company to allot and issue ordinary shares of the Company pursuant to the Fraser and Neave, Limited Scrip Dividend Scheme to eligible members who, in respect of a qualifying dividend, have elected to receive scrip in lieu of the cash amount of that qualifying dividend.
(d) The Ordinary Resolution proposed in item 9 above is to renew the mandate to enable the Company, its subsidiaries and associated companies that are considered to be “entities at risk” under Chapter 9 of the Listing Manual, or any of them, to enter into certain interested person transactions with specified classes of interested persons, as described in the Letter to Shareholders dated 5 January 2017 (the “Letter”). Please refer to the Letter for more details.
(e) The Ordinary Resolution proposed in item 10 above is to renew the mandate to allow the Company to purchase or otherwise acquire its issued ordinary shares, on the terms and subject to the conditions set out in the Resolution.
The Company intends to use internal resources or external borrowings or a combination of both to finance the purchase or acquisition of its ordinary shares. The amount of financing required for the Company to purchase or acquire its ordinary shares, and the impact on the Company’s financial position, cannot be ascertained as at the date of this Notice as these will depend on the number of ordinary shares purchased or acquired, whether the purchase or acquisition is made out of capital or profits, and the price at which such ordinary shares were purchased or acquired and whether the ordinary shares purchased or acquired are held in treasury or cancelled.
Purely for illustrative purposes only, the financial effects of an assumed purchase or acquisition of (i) 28,915,474 ordinary shares on 12 December 2016 (the “Latest Practicable Date”), representing 2% of the issued ordinary shares (excluding treasury shares) as at that date, and (ii) 101,204,159 ordinary shares on the Latest Practicable Date, representing 7% of the issued ordinary shares (excluding treasury shares) as at that date, at the maximum price of S$2.20 for one ordinary share (being the price equivalent to 5% above the average of the closing market prices of the ordinary shares for the five consecutive market days on which the ordinary shares were traded on the Singapore Exchange Securities Trading Limited immediately preceding the Latest Practicable Date), in the case of a market purchase and an off-market purchase respectively, based on the audited financial statements of the Company and its subsidiaries for the financial year ended 30 September 2016 and certain assumptions, are set out in paragraph 3.7 of the Letter.
Please refer to the Letter for more details.

178 Fra s e r a n d N ea v e , L i m i t e d & S u b s i d i a r y C o m pa n i e sA n n u a l R e p o r t 2 0 1 6F r a s e r a n d N e a v e , L i m i t e d & S u b s i d i a r y C o m p a n i e s
NOTICE OF ANNUAL GENERAL MEETING
A n n u a l R e p o r t 2 0 1 6 1 8 8
PERSONAL DATA PRIVACY By submitting an instrument appointing a proxy(ies) and/or representative(s) to attend, speak and vote at the Annual General Meeting and/or any adjournment thereof, a member of the Company (i) consents to the collection, use and disclosure of the member’s personal data by the Company (or its agents or service providers) for the purpose of the processing, administration and analysis by the Company (or its agents or service providers) of proxies and representatives appointed for the Annual General Meeting (including any adjournment thereof) and the preparation and compilation of the attendance lists, minutes and other documents relating to the Annual General Meeting (including any adjournment thereof), and in order for the Company (or its agents or service providers) to comply with any applicable laws, listing rules, take-over rules, regulations and/or guidelines (collectively, the “Purposes”), and (ii) warrants that where the member discloses the personal data of the member’s proxy(ies) and/or representative(s) to the Company (or its agents or service providers), the member has obtained the prior consent of such proxy(ies) and/or representative(s) for the collection, use and disclosure by the Company (or its agents or service providers) of the personal data of such proxy(ies) and/or representative(s) for the Purposes.
of_____________________________________________________________________________
I/We _____________________________________________________ (Name) __________________________________ (NRIC/Passport/Co Reg Number)
of __________________________________________________________________________________________________________________________ (Address)
being a member/members of Fraser and Neave, Limited (the “Company”), hereby appoint:
Proportion of Shareholdings Name Address NRIC/Passport Number No. of Shares %
and/or (delete as appropriate)
Proportion of Shareholdings Name Address NRIC/Passport Number No. of Shares %
or failing him/them, the Chairman of the Annual General Meeting (“AGM”), as my/our proxy/proxies to attend, speak and vote for me/us on my/our behalf at the AGM of the Company to be held at 9.30 a.m. on Tuesday, 24 January 2017 at Ballrooms II and III, Level 2, InterContinental Singapore, 80 Middle Road, Singapore 188966 and at any adjournment thereof. I/We direct my/our proxy/proxies to vote for or against the resolutions to be proposed at the AGM as indicated below. If no specific direction as to voting is given, the proxy/proxies may vote or abstain from voting at his/their discretion, as he/they may on any other matter arising at the AGM.
NO. RESOLUTIONS RELATING TO: No. of Votes
For* No. of Votes
Against* ROUTINE BUSINESS
1. To receive and adopt the Directors’ statement and audited financial statements for the year ended 30 September 2016 and the auditor’s report thereon.
2. To approve a final tax-exempt (one-tier) dividend of 3.0 cents per share in respect of the year ended 30 September 2016.
3. (a) To re-appoint Director: Mr Timothy Chia Chee Ming
(b) To re-appoint Director: Mrs Siripen Sitasuwan
(c) To re-appoint Director: Mr Chotiphat Bijananda
4. To approve Directors’ fees of up to S$2,000,000 payable by the Company for the yearending 30 September 2017.
5. To re-appoint KPMG LLP as the auditor of the Company and to authorise the Directors to fix their remuneration.
SPECIAL BUSINESS 6. To authorise Directors to issue shares and to make or grant convertible instruments. 7. To authorise Directors to grant awards and to allot and issue shares pursuant to the
F&N Restricted Share Plan and/or the F&N Performance Share Plan.
8. To authorise Directors to allot and issue shares pursuant to the Fraser and Neave, Limited Scrip Dividend Scheme.
9. To approve the proposed renewal of the mandate for interested person transactions.
10. To approve the proposed renewal of the share purchase mandate.
* Voting will be conducted by poll. If you wish to exercise all your votes “For” or “Against” the relevant resolution, please tick () within the relevant box provided. Alternatively, if you wish to exercise your votes both “For” and “Against” the relevant resolution, please indicate the number of shares in the boxes provided.
Dated this _______________ day of ______________ 2017. Total Number of Shares held (Note 1)
________________________________________________ Signature/Common Seal of Member(s) IMPORTANT: PLEASE READ NOTES OVERLEAF
IMPORTANT1. Relevant intermediaries as defined in Section 181 of the Companies Act,
Chapter 50 may appoint more than two proxies to attend, speak and vote at the Annual General Meeting.
2. For CPF/SRS investors who have used their CPF/SRS monies to buy Fraser and Neave, Limited shares, this form of proxy is not valid for use and shall be ineffective for all intents and purposes if used or purported to be used by them. CPF/SRS investors should contact their respective Agent Banks/SRS Operators if they have any queries regarding their appointment as proxies.
3. By submitting an instrument appointing a proxy(ies) and/or representative(s), the member accepts and agrees to the personal data privacy terms set out in the Notice of Annual General Meeting dated 5 January 2017.
PROXY FORM ANNUAL GENERAL MEETING
FRASER AND NEAVE, LIMITED (Company Registration No. 189800001R) (Incorporated in Singapore)

Fold and seal here NOTES TO PROXY FORM: 1. If the member has shares entered against his name in the Depository Register (maintained by The Central Depository (Pte) Limited), he should insert that
number of shares. If the member has shares registered in his name in the Register of Members (maintained by or on behalf of the Company), he should insert that number of shares. If the member has shares entered against his name in the Depository Register and shares registered in his name in the Register of Members, he should insert the aggregate number of shares. If no number is inserted, this instrument appointing a proxy or proxies will be deemed to relate to all the shares held by the member.
2. (a) A member of the Company who is not a relevant intermediary is entitled to appoint not more than two proxies to attend, speak and vote at the meeting. Where such member’s form of proxy appoints more than one proxy, the proportion of the shareholding concerned to be represented by each proxy shall be specified in the form of proxy.
(b) A member of the Company who is a relevant intermediary is entitled to appoint more than two proxies to attend, speak and vote at the meeting, but each proxy must be appointed to exercise the rights attached to a different share or shares held by such member. Where such member’s form of proxy appoints more than two proxies, the number and class of shares in relation to which each proxy has been appointed shall be specified in the form of proxy.
“Relevant intermediary” has the meaning ascribed to it in Section 181 of the Companies Act, Chapter 50. 3. A proxy need not be a member of the Company. 4. This instrument appointing a proxy or proxies must be deposited at the office of the share registrar of the Company, Tricor Barbinder Share Registration
Services (A division of Tricor Singapore Pte. Ltd.), 80 Robinson Road #11-02, Singapore 068898, not less than 72 hours before the time appointed for holding the meeting.
5. Completion and return of this instrument appointing a proxy or proxies shall not preclude a member from attending and voting at the meeting. Any appointment of a proxy or proxies shall be deemed to be revoked if a member attends the meeting in person, and in such event, the Company reserves the right to refuse to admit any person or persons appointed under the instrument of proxy, to the meeting.
6. The instrument appointing a proxy or proxies must be under the hand of the appointor or of his attorney duly authorised in writing. Where the instrument appointing a proxy or proxies is executed by a corporation, it must be executed either under its common seal or under the hand of its attorney or a duly authorised officer.
7. Where an instrument appointing a proxy or proxies is signed on behalf of the appointor by an attorney, the letter or power of attorney or a duly certified copy thereof must (failing previous registration with the Company) be lodged with the instrument of proxy, failing which the instrument may be treated as invalid.
8. The Company shall be entitled to reject an instrument appointing a proxy or proxies which is incomplete, improperly completed, illegible or where the true intentions of the appointor are not ascertainable from the instructions of the appointor specified in the instrument (including any related attachment). In addition, in the case of a member whose shares are entered in the Depository Register, the Company may reject an instrument appointing a proxy or proxies if the member, being the appointor, is not shown to have shares entered against his name in the Depository Register as at 72 hours before the time appointed for holding the meeting, as certified by The Central Depository (Pte) Limited to the Company.
Fold here
Affix Postage Stamp
THE COMPANY SECRETARY FRASER AND NEAVE, LIMITED
c/o Tricor Barbinder Share Registration Services (A division of Tricor Singapore Pte. Ltd.)
80 Robinson Road #11-02 Singapore 068898
Fold here


Untitled-2 1 27/9/16 12:02 PM
This annual report is printed on environmentally-friendly paper which contains
wood pulp from well-managed forests using an elemental chlorine free process.
Fraser and Neave, Limited438 Alexandra Road#20-00 Alexandra PointSingapore 119958Tel: (65) 6318 9393Fax: (65) 6271 0811www.fraserandneave.com
(Company Registration No. 189800001R)(Incorporated in Republic of Singapore)
Only available in digital format. Download it at www.fraserandneave.com/investor-relations/corporate-sustainabilityFor easy-to-read guides on annual reports, please refer to www.sgx.com/wps/wcm/connect/mp_en/site/highlights/highlight_contents/Investors_Guide
SUSTAINABILITYREPORT2016
For online version of F&N FY2016 Annual Report, please refer to www.fraserandneave.com/investor-relations
Accompanying this report: F&N Sustainability Report


