Page 1
Towards Sustainable Dolphin Watching Tourism in
Lovina, Bali, Indonesia
Thesis submitted by
Putu Liza Kusuma Mustika
MSc. James Cook University
December 2011
For the degree of Doctor of Philosophy
in the School of Earth and Environmental Sciences
James Cook University
Page 3
iii
PREFACE
I first heard of Lovina in 2003 when my friend told me about her honours research in
a small village in North Bali, the inhabitants of which depended on dolphin watching
tourism for their main income. Then in June 2006, I was approached by a Balinese
journalist who suggested that I should have a look at the tourism industry in Lovina.
„They‟re chasing the dolphins there!‟ he exclaimed.
The Australian Leadership Award of AusAID invited applications for its first PhD
scholarships in 2006. I submitted my application with the sustainability of dolphin
watching tourism in Lovina as the proposed research project. When I was officially
awarded the ALA scholarship in December 2006, it became clear that I had to visit
Lovina before returning to Australia and to write my full PhD proposal as part of the
Confirmation of Candidature Process at James Cook University.
Thus in January 2007, I visited Lovina for the first time as a researcher. My friend and
I were at the beach before 6am. It was still dark. Our boatman started the long-tailed
outboard engine and his 10m long jukung chugged northwards over the calm waters. I
was searching the horizon with the help of the first rays of the morning sun when I
saw them. No, not the dolphins.
Page 4
iv
The boats. A myriad of outriggered boats scattered along the horizon, each was
moving around, making circles on the water, as the boatmen diligently searched for
the dolphins. Their 5m width outriggers made the boats looked like spiders searching
for victims. When the first boat saw the first dolphins, tens of other boats immediately
raced towards the animals (usually with tourists screaming in excitement). The poor
animals immediately dived or swam away, leaving the tourists to contemplate the
empty space on the water. This peace did not last long. As soon as another boat
spotted another group of dolphins, almost all the boats accelerated towards that group.
The game of hide and seek, hunter and prey resumed until the dolphins were nowhere
to be seen or the heat of the day was too much for the tourists.
And that was it – my first encounter with the dolphin watching industry in Lovina.
Could this industry really be sustainable? Is there a future for Lovina in which
dolphins, boatmen and tourists can co-exist?
This research is a first attempt to answer that question.
Page 5
v
STATEMENT OF CONTRIBUTION BY OTHERS
Publications
Chapter
#
Details of publication(s) on which
chapter is based
Nature and extent of the
intellectual input of each
author
3 Encounters between cetaceans and
tourist vessels in Lovina, Bali
(Indonesia): could this industry be
biologically sustainable?
Journal of Cetacean Research and
Management
To be submitted to the journal in
January 2012
Mustika, Birtles, Everingham
and Marsh
I analysed the data and wrote
the chapter. Professor Helene
Marsh (marine mammal
scientist), Dr Alastair Birtles
(marine wildlife tourism
expert) and Dr Yvette
Everingham (statistician)
assisted in designing the study,
interpreting the results and
editing. Statistical advice was
provided by Dr Yvette
Everingham.
4 The need for increased research on the
human dimensions of wildlife tourism
in developing countries: dolphin
watching in Lovina as a case study
Journal of Sustainable Tourism
In revision
Mustika, Birtles, Everingham
and Marsh
I analysed the data and wrote
the chapter. Professor Helene
Marsh (marine mammal
scientist), Dr Alastair Birtles
(marine wildlife tourism
expert) and Dr Yvette
Everingham (statistician)
assisted in designing the study,
interpreting the results and
editing. Statistical advice was
provided by Yvette
Everingham.
5 The economic influence of community-
based dolphin watching on a local
economy in a developing country:
implications for conservation.
Journal of Ecological Economics
Mustika, Birtles, Welters and
Marsh
I analysed the data and wrote
the chapter. Professor Helene
Page 6
vi
In revision
Marsh (marine mammal
scientist), Dr Alastair Birtles
(marine wildlife tourism
expert) and Dr Ricardo
Welters (economist) assisted
in designing the study,
interpreting the results and
editing. Economic advice was
provided by Dr Riccardo
Welters.
6 The importance of community-based
involvement for managing whale
watching in a developing country with
decentralised management of marine
resources.
Journal of Cetacean Research and
Management
To be submitted to the journal in
March 2012
Mustika, Birtles and Marsh
I analysed the data and wrote
the chapter. Professor Helene
Marsh (marine mammal
scientist), and Dr Alastair
Birtles (marine wildlife
tourism expert)
assisted in the development of
the approach, result
interpretation and editing.
7 A comprehensive approach to
determining sustainability of wildlife
tourism in developing countries:
Dolphin watching in Lovina as a case
study.
Conservation Letters
To be submitted to the journal in May
2012
Mustika, Birtles, Hamann and
Marsh
I analysed the data and wrote
the chapter. Professor Helene
Marsh (marine mammal
scientist), Dr Alastair Birtles
(marine wildlife tourism
expert) and Dr Mark Hamann
(marine wildlife ecologist)
assisted in the development of
the approach, result
interpretation and editing.
Page 7
vii
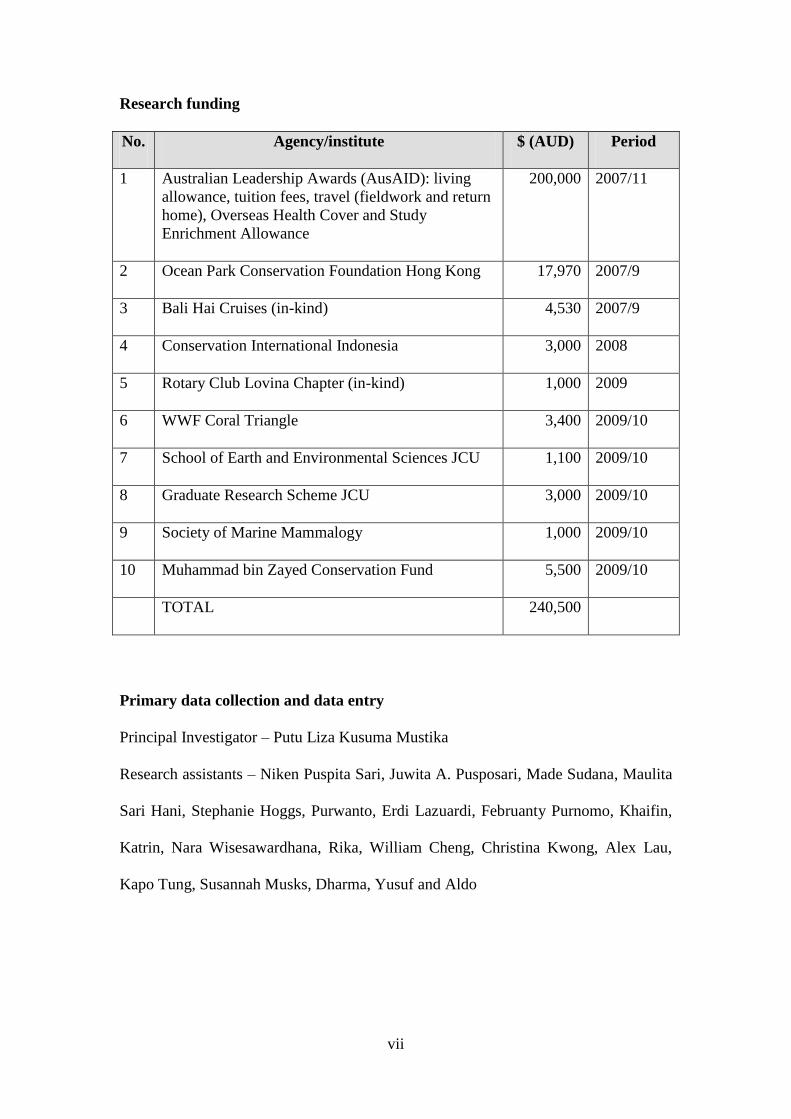
Research funding
No. Agency/institute $ (AUD) Period
1 Australian Leadership Awards (AusAID): living
allowance, tuition fees, travel (fieldwork and return
home), Overseas Health Cover and Study
Enrichment Allowance
200,000 2007/11
2 Ocean Park Conservation Foundation Hong Kong 17,970 2007/9
3 Bali Hai Cruises (in-kind) 4,530 2007/9
4 Conservation International Indonesia 3,000 2008
5 Rotary Club Lovina Chapter (in-kind) 1,000 2009
6 WWF Coral Triangle 3,400 2009/10
7 School of Earth and Environmental Sciences JCU 1,100 2009/10
8 Graduate Research Scheme JCU 3,000 2009/10
9 Society of Marine Mammalogy 1,000 2009/10
10 Muhammad bin Zayed Conservation Fund 5,500 2009/10
TOTAL 240,500
Primary data collection and data entry
Principal Investigator – Putu Liza Kusuma Mustika
Research assistants – Niken Puspita Sari, Juwita A. Pusposari, Made Sudana, Maulita
Sari Hani, Stephanie Hoggs, Purwanto, Erdi Lazuardi, Februanty Purnomo, Khaifin,
Katrin, Nara Wisesawardhana, Rika, William Cheng, Christina Kwong, Alex Lau,
Kapo Tung, Susannah Musks, Dharma, Yusuf and Aldo
Page 8
viii
Data analysis
Principal analyst – Putu Liza Kusuma Mustika
Supporting analysts – Dr Yvette Everingham, Dr Riccardo Welters, Prof Helene
Marsh, Dr Alastair Birtles
Editorial support
Distinguished Professor Helene Marsh
Dr Alastair Birtles
Dr Elizabeth Tynan
Dr Mark Hamann
Ms Rae Wiseman
Photographs
Purwanto – The Nature Conservancy Indonesia (Chapter 1, Figure 1.1)
An unidentified tourist by way of Mr Made Rudita (Chapter 3, Figure 3.4b)
Ethics Approvals
JCU Animal Ethics Approval #A1247
JCU Human Ethics Approval #H2769
External examiners
Dr Paul Forestell
Prof Mark Orams
Page 9
ix
ACKNOWLEDGEMENTS
Some people say that doing a PhD is a lonely path; you have to do everything alone.
While I agree that I am responsible for every number and word in this thesis, I have
come to the conclusion that my PhD was not a lonesome journey. In fact, without the
help of many people (only some are mentioned here due to insufficient space and
memory), I would not have arrived this far.
The first acknowledgement is to Distinguished Professor Helene Marsh, who once
again took me as a rather uncoordinated student under her wing. She has an amazing
ability to wake up before the sun rises and provide valuable input towards my
manuscripts. As I arrived in Australia, Dr Alastair Birtles joined the team with his
expertise on marine tourism management. He added extra colour to this thesis by
making sure I did not omit important details; not to mention that he later introduced
me to the love of my life. Last but definitely not least, Dr Mark Hamann helped me
during the final stages of my thesis. His input was very valuable for he made me
aware of aspects that I would have otherwise ignored. I thank the external examiners
Dr Paul Forestell and Prof Mark Orams for providing me with excellent suggestions
for improving this thesis.
A special gratitude goes to the AusAID, particularly its Australian Leadership Awards
that enables a non-government individual like me to pursue a doctorate degree and
bring me back to Townsville. Alex Salvador and Katherine Elliot of the AusAID and
the International Student Center at the James Cook University have provided
Page 10
x
tremendous (in fact, immeasurable) assistance during my journey to produce this
thesis.
The most important part of this thesis (i.e., data collection) could not have happened
without the consent of the local boatmen of Lovina who accepted the presence of my
research team in their villages; I thank them for being patient with me and being able
to set aside our differences for a better Lovina. There are too many names to mention
here; the following represent all the boatmen I‟ve worked with: Mr Bahruddin, Mr
Darmayasa, Mr Rudita, Mr Putu Liong, Mr Ginantra, Mr Koleng, Mr Dolphin, and
Mr Koming. Mr Putu Tastra Wijaya (Head of Cultural and Tourism Agency of
Buleleng) offered me tremendous support with his patronage and advice. Without
their support, I might have packed my suitcase and left earlier without such rich data
to analyse. My sincere hope is that I will always honour their trust in me and, in turn,
help them to improve this industry.
Many organisations provided in-kind or financial support to this project. Thanks to
Bali Hai Cruises for allowing me to use their tourist visitation data for Chapter 3 and
the Ocean Park Conservation Foundation Hong Kong, AusAID, the Mohamed bin
Zayed Conservation Fund, the Conservation International Indonesia, the Rotary Club
Lovina Chapter, the WWF Indonesia, the Society of Marine Mammalogy and James
Cook University for funding the research in Lovina. The exact amount granted is
detailed in the „Statement of Contribution of Others‟ above.
I couldn‟t collect all the data myself. In this regard, my research assistants were (and
still are) very valuable to me. Niken Puspita Sari, Juwita A. Pusposari and Made
Page 11
xi
Sudana were very supportive throughout the 2008-2010 data collection. I hope that
this research improved their lives as it did mine. A horde of volunteers also assisted
the data collection at different times: Maulita Sari Hani, Stephanie Hoggs, Purwanto,
Erdi Lazuardi, Februanty Purnomo, Khaifin, Katrin, Nara Wisesawardhana, Rika,
William Cheng, Christina Kwong, Alex Lau, Kapo Tung, Susannah Musks, Dharma,
Yusuf and Aldo.
I am grateful for my respondents who allowed my team to disturb their holidays with
our questionnaires. Information they provided enriched this thesis very significantly.
I thank the following experts who offered me advice for the improvement of
individual chapter manuscripts: Dr Yvette Everingham, Dr Riccardo Welters,
Associate Professor Natalie Stoeckl, Professor Philip Pearce, Dr Alana Grech and Mr
Timan Sodinomo. I am very grateful to Dr Elizabeth Tynan who set aside time to
make sure that each word in my thesis is there for a reason. Ms Rae Wiseman
provided the last thorough editorial checks that I needed, I thank her for her
tremendous assistance.
I‟d like to thank James Cook University for providing me with a chance to grow and
fulfill my potential. Several administrative officers, particularly Ms Glen Connolly,
Miss Jennifer Flemmings, Ms Vivian Doherty, Mrs Sue Midson and Ms Beth Moore
have provided their support during the last leg of my thesis writing. My friends in
JCU and Townsville – Rie Hagihara, Coralie D‟Lima, Kristen Weiss, Aurelie Delisle
and Mike Kinney – thanks a lot for your support. Being a PhD student would have
been terrible without having you guys to talk to.
Page 12
xii
I am thankful to my parents and my sister Ayu for understanding the path I am taking.
Special hugs and kisses for Debbie Sutopo, Wong Ee Phin and Atiek Ambarwati for
sharing my laughters and tears. My deep gratitude to my spiritual teachers past and
present – Mr Anand Krishna, His Holiness Dalai Lama, Ms Jasmine Healy-Pagan and
Dr Christiane Northrup – for reminding me that I just have to always trust the Light
within me, and all will be fine.
Last but not least, I thank my Jade family: Riccardo, Dino, Pinho, Bluey, etc. who are
always there to hold me when I‟m down and to help me believe that I shall win this
journey, instead of just surviving. Riccardo, thanks a lot for all the cooking, walking,
talking, sharing and love you gave me. I may have been able to make this journey
alone without you, but it would have taken a much longer time with much less
sunshine and smiles. Thanks for accepting me and my quirkiness. I love you. You‟re
my star.
Page 13
xiii
ABSTRACT
This research studied dolphin watching in Lovina, North Bali, Indonesia in the
theoretical context of quadruple bottomline sustainability and the prism of
sustainability to investigate the biological, social, economic and managerial elements
of the sustainability of the industry.
This industry depends on predictable access to coastal dolphins, particularly dwarf
spinner dolphins (Stenella longirostris roseiventris). Dolphin watching tourism at
Lovina began in the late 1980s when local artisanal fishers formed self-regulating
cooperatives. Up to 179 dedicated traditional fishing vessels (jukungs) are available to
take passengers to watch the cetaceans that are predictably found 3-4 km from the
shore. An average of 34.5 tour boats from four dolphin associations operated for up to
three hours each morning in Lovina during my data collection period (2007 to 2009),
with up to about 100 tour boats per day searching for the animals during the high
tourist visitation season. A school of dolphins could be surrounded by up to 83 boats
(median 15.35). In an encounter, the number of boats generally outnumbered the
number of dolphins (median spinner-to-boat ratio = 0.8:1).
The dolphins generally surfaced only briefly (<2 minutes) and were almost always
travelling when first sighted in the mornings. Most dolphin schools were surrounded
by boats, making the establishment of control units impossible. Many boats were
driven erratically, making it very difficult to measure the impact of this industry on
the local dolphin population. However, examination of the boatmen‟s conduct
indicated that the operations at Lovina did not conform to accepted international
Page 14
xiv
norms. Most boatmen attempted to get as close as possible to the dolphins (generally
much closer than the recommended 50m minimum approach distance stipulated in
Australian and many other national-level regulations). During 175 scan sampling
efforts over 36 days I identified 64 individual boats that displayed „behaviours of
concern‟ at least once.
The industry generally attracts tertiary-educated international visitors. In 2007-2009,
two-thirds of the dolphin tourists came from Western countries; the rest were from
Asia. Average tourist satisfaction was low to medium (7.1 on a scale of 1-10). While
there was no significant difference between the average satisfaction of Western and
Asian tourists, the associated variables differed. The satisfaction of Western tourists
was associated with encounter management, their preferred number of surrounding
boats and the number of dolphins seen. Encounter management was the only variable
associated with the satisfaction of Asian tourists. Western respondents disliked the
mismanagement of the dolphin tour; they considered that too many boats exhibited
behaviours of concern and that the approach distances were too close. Satisfaction
was positively associated with the willingness of tourists to recommend the tour to
others. Western respondents who felt neutral to very comfortable with the way their
boatmen managed the dolphin encounters were more likely to promote the tour. Thus
the low to medium satisfaction levels of Western dolphin tourists threatened to bring
negative publicity for Lovina dolphin tourism from word of mouth and other sources.
In 2007-2009, the industry attracted at least 37,000 overnight visitors per annum
(~60% of Lovina‟s overnight tourists) who contributed up to USD 9.5 million p.a. in
total direct expenditures (i.e., tickets, accommodation, meals, transportation,
Page 15
xv
communication and souvenirs). At least 46% of the total direct expenditure was
attributable to the dolphin watching tourism. The boatmen enjoyed an above average
income but trip fees constituted only 3% of the total income generated by dolphin
watching tourism; the remainder was spent on local businesses e.g., accommodation,
restaurant and transport, which are the most substantial beneficiaries. As a
consequence of the economic importance of this industry to the boatmen and the
villages, it is important for the boatmen to improve their dolphin encounter
management to meet the expectations of the highly educated international visitors.
Because the industry also brings a significant economic contribution to other business
sectors, the sustainability of the overall industry is very important to them. The
hoteliers, restaurateurs and travel agents should also be included in the future
management strategies in Lovina, including assisting the boatmen in improving their
service.
Interviews with the boatmen confirmed that the industry was essentially unregulated.
The boatmen were concerned about the industry‟s long-term sustainability, especially
their encounter management practices and other operational issues such as garbage
and safety. The boatmen agreed in-principle to improve their encounter management
by: 1) turning off the engine/lifting the propeller, 2) keeping the boat‟s distance from
the dolphins and 3) avoiding cutting across the dolphin‟s route. However, they were
reluctant to limit the fleet size, very likely due to the economic importance of the
industry to their livelihoods.
Reduction of the boat crowding in Lovina is important from the perspectives of
animal welfare and tourist satisfaction. Replacing the jukungs with larger boats to
Page 16
xvi
reduce the number of boats is considered impractical from funding and organisational
viewpoints. This idea is also undesirable from the cultural viewpoint and because it
might reduce tourist experience. Establishing an agreed minimum approach distance
would be an indirect approach to managing the number of boats and viewing duration.
This strategy could be achieved by establishing an agreed maximum number of boats
(15 is suggested) in a 50m perimeter for an agreed viewing time for safety, comfort
and tourist experience.
The in-principle agreements established by the Lovina boatmen have not yet been
implemented. Training programs should be offered to the boatmen, including how to
estimate approach distance and speed limit and appropriate methods to approach the
animals. Once training is completed, discussions should be directed to add more
management aspects to the codes of practice (e.g., speed limitation, encounter fleet
size and approach behaviours) and to codify the codes of practice e.g., by including
the guideline in the local Balinese awig-awig (customary norms/rules). The
guidelines could then be adopted at regency and national levels.
Several challenges and opportunities must be considered in managing the Lovina
dolphin watching industry in a sustainable manner. Working with the local
community in Bali requires an appreciation of the characteristics of the people of Bali,
including its patriarchal nature, the traditional codification system or awig-awig and
the local sustainability framework („Tri Hita Karana‟). Bali was usually conceived as
a cultural tourism destination. The inclusion of cultural elements (e.g., the daily life of
a dolphin boatman and the construction, repair and maintenance of the traditional
outriggered wooden canoe or „jukung‟) can enhance the tourist experience, increase
Page 17
xvii
the length of stay and reduce the focus on the dolphins themselves, which in turn
could benefit the promotion of the dolphin tour and the local economy.
The biological sustainability of the dolphin watching industry in Lovina is
questionable and most tourists are not very satisfied. However, because the industry is
very valuable to the boatmen and the villages, the long term sustainability, viability
and health of the dolphins are a priority to a socially and economically sustainable
industry. Consequently, the industry needs to be sustainably managed with the
consent and involvement of all boatmen and other supporting stakeholders. Despite
the current concerns over its sustainability, the Lovina dolphin watching industry
could potentially become an exemplar of community-based tourism in a developing
country that is successfully co-managed from multiple perspectives. The four
elements of sustainability used in this research provided valuable insights into the
industry and should be applicable to other studies designed to inform sustainable
marine wildlife tourism in developing countries.
Page 18
xviii
TABLE OF CONTENTS
Preface
iii
Statement of contribution by others v
Acknowledgements
ix
Abstract
xiii
Table of contents
xviii
List of tables
xix
List of figures
xx
Chapter 1
Introduction 1
Chapter 2
Overview of methodology 31
Chapter 3 The dynamics of the boats and the cetaceans
39
Chapter 4
The tourist experience 89
Chapter 5 Economic aspects of the dolphin watching tourism
117
Chapter 6 Management of the industry 145
Chapter 7 General discussion 181
References 206
Appendix 1 Tourist questionnaire in High Season
219
Appendix 2 Tourist questionnaire in Low Season
222
Appendix 3 Questions for semi-structured interviews with
dolphin association coordinators
225
Appendix 4 Questions for semi-structured interviews with
dolphin boatmen
230
Appendix 5 Details of the card technique used in stakeholder
meetings in Lovina
236
Appendix 6 Short project flyer
239
Page 19
xix
LIST OF TABLES
Table 3.1 Categories of cetacean behaviours used in the dolphin
research off Lovina
54
Table 3.2 Categories of boat behaviours used in the dolphin research off
Lovina
55
Table 3.3 The likelihood of encountering a cetacean species off Lovina
on any given day in the High and Low Tourist Seasons
67
Table 3.4 Summary statistics of the cetaceans and the tour fleet off
Lovina
69
Table 4.1 Summary details of the respondents to the dolphin tourism
surveys administered in Lovina, Bali
100
Table 4.2 Variables significantly associated with the satisfaction level
of tourists who went dolphin watching at Lovina (data from
Low and High Seasons combined)
105
Table 4.3 The most important variables associated with satisfaction with
the dolphin tourism experience at Lovina and the aspects of
the experience that respondents disliked the most.
109
Table 4.4 Preferred and disliked features of the dolphin watching trips
in Lovina
110
Table 4.5 Comparison of satisfaction levels of visitors to nine wildlife
viewing attractions in developing countries
114
Table 5.1 Estimated daily auxiliary direct expenditures of dolphin
watching tourists in Lovina from tourist questionnaires in
2008 and 2009
135
Table 5.2 Total expenditures of dedicated and non-dedicated dolphin
tourists in Lovina from tourist questionnaires in 2008 and
2009.
137
Table 6.1 List of Indonesian regulations relevant to cetaceans and
species conservation
151
Table 6.2 Matters included in cetacean watching codes of practice by
Carlson (2010)
174
Page 20
xx
LIST OF FIGURES
Figure 1.1 Traditional boats (jukung) that take tourists to watch the
dolphins at Lovina
1
Figure 1.2 Overlap between wildlife tourism and ecotourism
5
Figure 1.3 The four elements of sustainability used in this thesis which
will be adapted to the situation at Lovina, Bali, Indonesia
19
Figure 1.4 Outline of this thesis
27
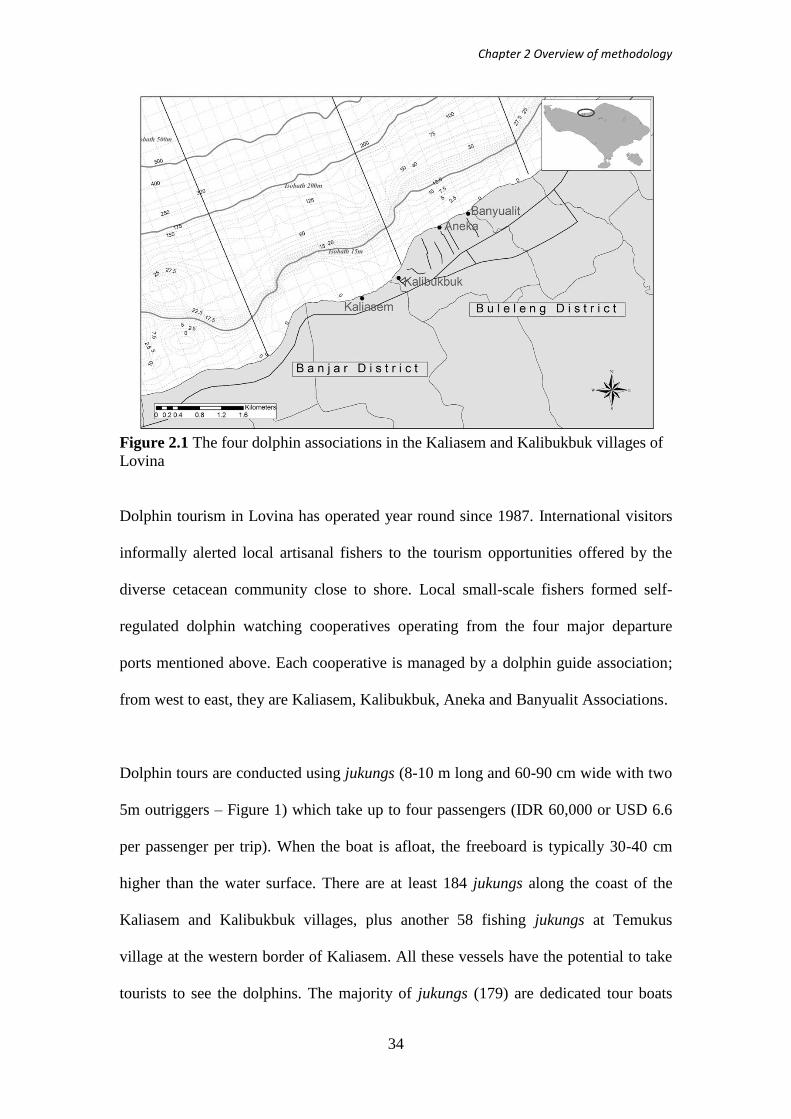
Figure 2.1 The four dolphin associations in the Kaliasem and
Kalibukbuk villages of Lovina
34
Figure 2.2 The iconic dolphin statue at the end of the main lane in
Kalibukbuk, Lovina
36
Figure 3.1 Research design framework used to understand the dynamics
between cetaceans and tour boats in Lovina
47
Figure 3.2 Morning sightings (before 8am) of cetaceans during the 2009
and 2010 point surveys (36 days) off Lovina, overlaid with
the 2008 line transect sightings
50
Figure 3.3 The Australian national guidelines for dolphin watching used
to analyse the dolphin watching situation off Lovina
64
Figure 3.4 (a) A dwarf spinner dolphin (Stenella longirostris roseiventris) in
Lovina
66
Figure 3.4 (b) The Hawaiian subspecies (Stenella longirostris longirostris)
that is found offshore of Lovina
66
Figure 3.5 (a) The spatial activity pattern of 15 tourist vessels in High
Season 2008
70
Figure 3.5 (b) The spatial activity pattern of the research vessel on 21 days
in High Season 2008
70
Figure 3.5 (c) The spatial activity pattern of the research vessel on 15 days
in Low Season 2009
71
Figure 3.6 Dolphin behaviours in relation to the presence of tour boats
during the point surveys for dolphins conducted in 2009-2010
from 6am to 10am
74
Page 21
xxi
Figure 3.7 Comparison of the approach distances of the tourist boats off
Lovina with the Australian National Guidelines for Whale
and Dolphin Watching 2005
77
Figure 4.1 An outline of the statistical methods used to analyse the
quantitative data from Lovina
96
Figure 4.2 Distribution of satisfaction levels with dolphin watching
tourism at Lovina, Bali according to nationality type.
103
Figure 4.3 Details of the analysis of the variables associated with the
satisfaction of dolphin watching in the Low Season at Lovina
using multi regression trees
106
Figure 4.4 Association between respondents‟ willingness to recommend
a dolphin watching trip at Lovina to others and how they felt
about the way the boatmen managed their encounters
111
Figure 5.1 Total economic value and its association with direct tourist
expenditures in Lovina
120
Figure 5.2 A decision tree that explains the characterization of the
respondents to the 2008 and 2009 surveys as dedicated and
non-dedicated dolphin tourists.
130
Figure 5.3 Number of overnight tourists in Lovina from 2004-2010
(Source: Cultural and Tourism Agency of Buleleng)
132
Figure 5.4 The distribution of accommodation facilities in Lovina (insert
shows Bali and the position of Lovina on the north coast)
133
Figure 5.5 The potential conflict between the economically optimum
daily fleet size (X2) and the biologically acceptable daily fleet
size (X1)
142
Figure 6.1 Organisation of the interviews and stakeholder workshops in
Lovina
152
Figure 6.2 Details of the information presented during the community
and stakeholder workshops
153
Figure 6.3 Dolphin boatmen deciding topic they would like to discuss
during the stakeholder meeting in Kalibukbuk, April 2010
171
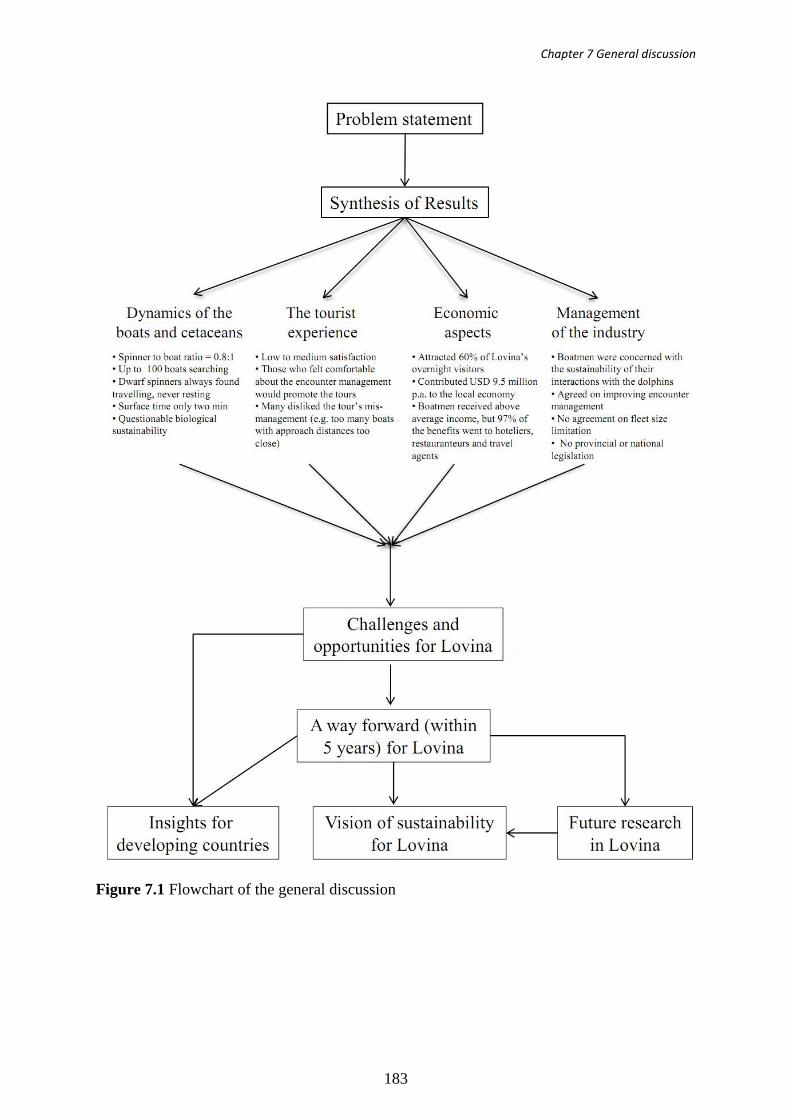
Figure 7.1
Flowchart of the general discussion 183
Figure 7.2 Staged approach for a dolphin tourism code of practice
development in Lovina and the adaptation strategy at national
level
197
Page 22
xxii
Figure 7.3 Management steps towards sustainable dolphin watching
tourism in Lovina
200
Figure 7.4 Management options to improve the dolphin watching
industry in Lovina (each number represents a management
option that directly links two elements of sustainability)
200
Page 23
1
CHAPTER 1
INTRODUCTION
This chapter explains the background of my research on dolphin watching tourism in
Lovina (Bali, Indonesia). It explores the definition and benefits of wildlife tourism,
particularly cetacean (whale and dolphin) watching tourism, and introduces quadruple
bottom line and prism of sustainability as the theoretical frameworks of this research.
This chapter also provides basic information on tourism in Bali and introduces
dolphin watching tourism in Lovina.
1.1 The context and benefits of wildlife tourism
As briefly stated in the Preface to this thesis, this research project stemmed from my
visit to Lovina in January 2007. After witnessing many boats surrounding a group of
dolphins (which immediately disappeared), I found myself questioning the
sustainability of the local dolphin watching industry. However, before outlining the
objectives of my research, I will discuss wildlife tourism and cetacean (whale and
dolphin) watching tourism, with a focus on developing countries.
Figure 1.1 Traditional boats (jukung) that take tourists to watch the dolphins at
Lovina. Each vessel is about 10 m long and takes up to four passengers and the
boatman. Approximately 20 boats were captured in this photograph (Courtesy of
Purwanto@TNC Indonesia 2008)
Page 24
Chapter 1 Introduction
2
The Oxford Dictionary (Fowler & Fowler 1979) defined tourism as: „organised
touring; operation of tours as a business ; provision of things and services that attract
tourists‟ whereas a tourist is defined as a „person who makes a tour, traveller, esp.
for recreation‟. The most common type of tourism is mass tourism; many people
perceive this type of tourism as the culprit responsible for environmental destruction
at tourism sites (France 2002). Alternative styles of tourism have developed especially
since the early 1980s as an antitheses to mass tourism (Lanfant & Graburn 1992;
Pearce 1992; Page & Dowling 2002). Alternative tourism is defined as „forms of
tourism that set out to be consistent with natural, social and community values and
which allow both hosts and guests to enjoy positive and worthwhile interaction and
shared experiences‟ (Wearing & Neil 2009, p. 4). Alternative tourism is ecologically
sound, features smaller attractions organised by villages or communities, benefits the
locals and thus has fewer negative social or cultural effects (Kadt 1992). Alternative
tourism has many variants that occasionally overlap with mass tourism, e.g., cultural
tourism (Lanfant & Graburn 1992), adventure tourism, nature tourism and community
tourism (France 2002). These variants may also overlap with each other. In this thesis,
I focus the discussion on nature tourism, although cultural tourism shall also be
discussed in Chapter 7.
Nature-based tourism or nature tourism refers to „all tourism directly dependent on
the use of natural resources in a relatively undeveloped state, including scenery,
topography, water features, vegetation and wildlife‟, irrespective of whether the usage
is sustainable (Ceballos-Lascuráin 1996, p. 19). Although sometimes passive, nature
tourism can include aspects of adventure tourism (France 2002; Williams & Soutar
2009). Nature tourism intersects with wildlife tourism when it involves encounters
Page 25
Chapter 1 Introduction
3
with wildlife/animals. Wildlife tourism is not always conducted in a natural
environment; its definition is „tourism based on encounters with non-domesticated
(non-human) animals…in either the animal‟s natural environment or in captivity‟
(Higginbottom 2004, p. 2). As implied by this definition, wildlife-tourist interactions
vary from interactions in captive facilities to interactions in wildlife habitats. Orams
(2002a) grouped the interactions between humans and wildlife into captive (e.g., zoos
and oceanariums), semi-captive (e.g., wildlife feeding) and wild (e.g., cetacean
watching, wildlife watching in national parks).
1.1.1 Comparison between wildlife tourism and ecotourism
Wildlife tourism is often classified as consumptive or non-consumptive based on the
activities of the tourists (Duffus & Dearden 1990). Consumptive wildlife tourism
usually includes the removal or death of animals, e.g., wildlife hunting programs,
safari or unregulated whale watching packages (Wilkie & Carpenter 1999; Orams
2000; Reynolds & Braithwaite 2001; Newsome et al. 2005). In contrast, non-
consumptive wildlife tourism is defined as „human recreational engagement with
wildlife wherein the focal organism is not purposefully removed or permanently
affected by the engagement‟ (Duffus & Dearden 1990, p. 215). When managed
properly, non-consumptive wildlife tourism is a step towards sustainable wildlife
tourism that „aims to meet the needs of present tourists and host regions while
protecting and enhancing environmental, social and economic values for the future‟
(Newsome et al. 2005, p. 41). When wildlife tourism achieves sustainability, it is
another step closer to meeting the criteria of another type of tourism: ecotourism.
Page 26
Chapter 1 Introduction
4
Ecotourism is the only type of alternative tourism that does not overlap with mass
tourism (France 2002, p. 17). There are several definitions of ecotourism; I quote only
those relevant to my doctoral study. Ecotourism has been described as „a subset of
natural area tourism and may combine elements of both nature-based tourism and
adventure travel… that involves education and interpretation of the natural
environment and is managed to be ecologically sustainable.‟ (Newsome et al. 2005, p.
13). Page and Dowling (2002) proposed five characteristics of ecotourism: nature-
based, ecologically sustainable, environmentally educative, locally beneficial and
generating tourist satisfaction. Ecotourism Australia added an appreciation of the local
culture to the definition of ecotourism: „Ecotourism is ecologically sustainable
tourism with a primary focus on experiencing natural areas that fosters
environmental and cultural understanding, appreciation and conservation.‟
(www.ecotourism.org.au). Based on these definitions, a wildlife tourism industry can
be called ecotourism if it is conducted in a natural area in a manner that is
ecologically sustainable, appreciates the local culture and has high levels of education
and interpretation, such that it benefits the locals and generates tourist satisfaction.
Following Newsome et al. (2005), Figure 1.2 below is an overview of the interactions
between wildlife tourism and ecotourism:
Page 27
Chapter 1 Introduction
5
Figure 1.2 Overlap between wildlife tourism and ecotourism (re-drawn from
Newsome et al. 2005, p. 19)
1.1.2 Benefits of wildlife tourism
Because my research was conducted in a developing country, this section provides an
overview of the benefits of wildlife tourism in developing countries. „Developing
countries‟ are defined as countries with a medium to high Human Development Index
in 2010 as recorded by the United Nations Development Programme
(http://hdr.undp.org/en/statistics/). Wildlife tourism in developing countries has grown
substantially in the past few years, providing several benefits for its stakeholders, i.e.,
economic benefits, better research and better protection for target wildlife species.
Economic benefits
Wildlife tourism can bring economic benefits to the tourism industry per se, the local
people and, if managed properly, to the ecosystem that supports this activity. In
Page 28
Chapter 1 Introduction
6
developing countries, wildlife tourism attracts an international market (typically from
Western countries) that significantly contributes to the local economy (Barnes et al.
1992; Akama 1996; Okello & Yerian 2009). Gorilla tourism in three natural reserves
in Africa generated nearly USD 2 million in 1990 alone (Weber 1993). In 1995-96,
30,000 tourists (93% foreigners) visited Komodo National Park in Indonesia to view
the threatened Komodo dragons, thereby contributing USD 1.1 million to the local
economy (Walpole & Goodwin 2000; Walpole et al. 2001). Such profit can eventually
assist biodiversity conservation in the region (Dharmaratne et al. 2000; Kiss 2004).
However, when managers and policy makers are reluctant to implement or increase
user fees, fearing that tourist numbers may drop as a direct result (Dharmaratne et al.
2000), tourism income may not be used to assist in biodiversity conservation, or be
ineffective in so doing.
Research and conservation
The targets for wildlife tourism are often animals with charismatic features that attract
public interest and, therefore, support. In turn, such public support enables these
animals to be used as flagship species, or as a species that „can be used to anchor a
conservation campaign because it arouses public interest and sympathy‟ (Simberloff
1998, p. 247). The role of a flagship species is more socio-economical than ecological
(Walpole & Leader-Williams 2002). Therefore, a wildlife tourism industry can use its
target species as a flagship species to raise public awareness of an associated
conservation issue.
Major wildlife tourism hotspots are often places of significance to the target animal‟s
life cycle, e.g., migratory routes or breeding grounds (Roe et al. 1997). Hence,
Page 29
Chapter 1 Introduction
7
wildlife tourism activities are often found on bird and whale migratory routes, sea
turtle nesting sites, or in the home ranges of flagship terrestrial animals, such as
pandas, rhinoceros and giant tortoises. Two prominent wildlife hotspots in Indonesia
have flagship species as the major attraction. Ujung Kulon National Park in West Java
has the Javanese rhino, while the Komodo National Park in East Nusa Tenggara has
the Komodo dragon. Both sites are listed as UNESCO Heritage Sites
(http://whc.unesco.org) and have developed wildlife tourism packages for their
respective flagship species.
To understand the maximum limit of external pressure that a species population can
absorb, wildlife tourism managers must ensure that adequate research on the species,
the habitat and related tourism activities are properly in place. Results of such
research are very useful for sustainably managing the industry. The conservation of
the Komodo dragon in the Komodo National Park Indonesia (Pet & Yeager 2000), the
Javanese rhinoceros (Rhinoceros sondaicus) in the Ujung Kulon National Park
Indonesia (Cohn 1988), the giant panda (Ailuropoda melanoleuca) in Baoxing Jiajin
Mountain in China (Environmental News Service 2004) and the Indo-Pacific
humpback dolphin (Sousa chinensis) in Hong Kong (www.hkdolphinwatch.com) are
some examples of this approach in Asia. Long term conservation initiatives that have
been conducted in those locations have contributed to better conservation
management of the species. Eventually, such initiatives can also benefit wildlife
tourism that depends on the health of its target populations.
Page 30
Chapter 1 Introduction
8
1.2 The context of cetacean watching tourism
Tourists are attracted to wildlife tourism because it often allows them to experience
larger numbers of animals or animals of larger body mass in close proximity (Roe et
al. 1997). Hence, bird watching and cetacean (whale and dolphin) watching are
among the most popular forms of wildlife tourism. Although bird watching is the
largest type of non-consumptive wildlife tourism (Roe et al. 1997), whale watching is
a rapidly growing area (Roe et al. 1997; Hoyt 2001; O'Connor et al. 2009).
Cetacean watching is a lucrative source of income. A 2008 review of tourist visitation
and expenditures for worldwide cetacean watching industries suggests that the
industry attracted 13 million tourists in 119 countries, contributed USD 2.1 billion of
total tourist expenditure to the global economy in 2008 and supported 19,000 jobs
worldwide (O'Connor et al. 2009; Cisneros-Montemayor et al. 2010). Almost 55% of
the countries mentioned in O‟Connor et al. (2009) were developing countries, which
suggests that cetacean watching tourism is playing an increasingly important role in
the national economy of developing countries. In 2008, cetacean watching generated
USD 66 million in total tourist expenditure in 19 Asian countries/territories (90% of
which were developing nations) (see O'Connor et al. 2009). In particular, Indonesia
enjoyed more than USD 517,000 from the direct expenditures of whale watching
tourists in 2008 (i.e., the sum of admission fees and other items attributable to the
tour) (O'Connor et al. 2009).
Its potential for generating considerable income makes cetacean watching tourism a
good alternative to destructive activities such as whaling (O'Connor et al. 2009; Neves
2010). Whale hunting used to be a common practice in Tonga until banned in 1978
Page 31
Chapter 1 Introduction
9
(Orams 2001). Whale watching contributed USD 550,000 to Tonga‟s 1999 tourism
revenue (Orams 2001) . This value had increased sharply to more than USD 980,000
by 2009 (O'Connor et al. 2009). Australia officially banned whale hunting activities in
1980 (O'Connor 2004). In 2008, Australia generated almost USD 172 million in total
direct expenditures from cetacean watching industries (O'Connor et al. 2009). Some
stakeholders have also suggested cetacean watching tourism as an alternative to
traditional whale hunting in Lamalera (eastern Indonesia), although the effectiveness
of this suggestion is arguable, due in part to the cultural significance of whale hunting
for the people of Lamalera (Mustika 2006).
Cetacean watching is not without risks to target wildlife populations. The behaviour
of some dolphin species shifted from resting to milling or travelling when the number
of boats around the school increased (Lusseau 2003; Constantine et al. 2004;
Christiansen et al. 2010). The presence of tour boats has been observed to alter the
target cetacean‟s line of travel (Williams & Ashe 2007) to the point that the animals
dived to avoid the boats (Schaffar et al. 2009). As a result, experts have become
increasingly vocal about the need to regulate whale and dolphin watching activities
(Orams 2000; Brownell & Oosthuizen 2004; Constantine et al. 2004; Corkeron 2004;
IWC 2009).
Since the 1980s, regulations or voluntary guidelines have been established in response
to the increased concerns about the sustainability of boat based whale watching
industries (Carlson 2004). Carlson (2010) examined the regulations and guidelines for
cetacean watching tourism adopted by 42 countries or territories (20 were developed
countries and 22 were developing countries, including Indonesia). Carlson (2010) also
Page 32
Chapter 1 Introduction
10
examined two regional agreements (ACCOBAMS and the Pacific Islands) and one
international territory (Antarctica). A total of 65% (13 of 20) of the developed
countries had adopted voluntary guidelines (including United Kingdom and United
States (in several states)); the remaining seven countries (including Australia, New
Zealand and United States (in several other states)) imposed regulations. In contrast,
the number of developing countries or territories which have adopted voluntary
guidelines almost equals those which adopted regulations (10 versus 12). Several non-
governmental organisations in Indonesia (WWF, The Nature Conservancy and the
Apex Environment) have endorsed voluntary guidelines for cetacean watching in that
country (Gouyon 2005; Carlson 2010). However, to date the Indonesian government
has not issued any national-level endorsement of guidelines.
The development of codes of practice should be species-specific, location-specific and
industry-specific (Birtles et al. 2001; Carlson 2010). International codes of practice
for cetacean watching usually cover at least one of the following aspects of the
encounter: (1) minimum approach distance to the animals (the condition most
frequently stipulated); (2) maximum number of boats around the cetaceans at any one
time; (3) maximum time allowed around the animals; and (4) speed and angle of
approaching the animals, etc. (Carlson 2004; Garrod & Fennell 2004; Department of
the Environment and Water Resources Australia 2005; Allen et al. 2007; Delfour
2007, see also Chapter 3). Although there is no global agreement, the codes of
practice usually stipulate a minimum approach distance of either 50 m or 100 m
(Garrod & Fennell 2004). Garrod & Fennel (2004) also found that more than 25% of
the 58 codes they examined allowed only one boat at a time (only one code allowed a
maximum of six boats at a time). These guideline/regulations will be revisited in later
Page 33
Chapter 1 Introduction
11
chapters for they are among the many important aspects of sustainability to be
discussed in this thesis.
As is the case with other wildlife tourism activities, cetacean watching tourism is not
only about the whales and dolphins. Tourists in Tangalooma, Australia, were satisfied
with their whale watching trips not only because of the whales but also because of
other aspects of the experience such as crew hospitality and the small number of
passengers on board (Orams 2000). Tourists participating in trips that allow
swimming with dwarf minke whales in the waters of the Great Barrier Reef
appreciated similar aspects of their experience (Birtles et al. 2002a). These tourists
were not only satisfied with their encounters with the whales; the menu on board, the
live-aboard experience, meeting other guests and diving also contributed to their
overall experience. These additional factors need to be taken into account when
designing a sustainable cetacean watching industry (later discussed in Chapter 7).
1.3 Research framework
1.3.1 The dearth of cross-disciplinary research on cetacean watching
tourism
Despite many studies on how anthropogenic activities affect cetacean populations,
unequivocally linking behavioural changes in the target species caused by tourism to
long term population impacts is difficult. Only a few ecological assessments have
documented long-term changes (i.e., 10 years or more) in the behaviour of cetaceans
in response to vessels or human presence (e.g. Watkins 1986; Mann et al. 2000; Laist
et al. 2001). All such studies have been conducted in developed countries and only a
Page 34
Chapter 1 Introduction
12
few have demonstrated the link between these long-term behaviour changes to long-
term demographic impacts (e.g., Bejder et al. 2006).
Research on cetacean tourism in developing countries has generally focused on the
ecological aspects of the industry, i.e., the anthropogenic impacts on the animals
(Stensland et al. 2006; Stensland & Berggren 2007; Schaffar et al. 2009; Christiansen
et al. 2010). However, only in Zanzibar (Tanzania) has at least 10 years of research
data been collected on the impact of tourism on the local dolphin populations (since
1999, Stensland et al. 2006).
Although biological knowledge is important for species management, this approach
presents generic challenges including separating the impacts of tourism from
confounding influences on the population of interest and the high cost of extensive
fieldwork. Even if the size of the target population is found to be declining (which is
very difficult to establish, see Taylor et al. 2007), it is usually impossible to
unequivocally attribute the cause of the decline to tourist interactions because of
confounding factors and the lack of controls (see Milinski 1997). Limited funding
often forces researchers to conduct short-term rather than long-term ecological
research, particularly in developing countries where researchers also rarely have
access to the funding required for robust ecological surveys (Aragones et al. 1997).
Research on the human dimensions of cetacean tourism (e.g., the social and economic
aspects) may potentially generate relatively low cost information quickly. This
information may help managers design and implement the best strategies for
managing their cetacean tourism industries in accordance with the Precautionary
Page 35
Chapter 1 Introduction
13
Principle (Johannes 1998; Kazmierow et al. 2000; Birtles et al. 2001; Birtles et al.
2002a; Valentine & Birtles 2004). Nonetheless, relatively few studies have
documented the values and drivers of the socio-economic aspects of cetacean tourism,
or whether this information influences management decisions.
I reviewed 70 papers, theses and reports that discussed marine wildlife tourism
including dive tourism. Only six of these studies described the experience of marine
wildlife tourists in developing countries (Musa 2002; Orams 2002b; Campbell &
Smith 2006; Curtin 2006; Curtin & Wilkes 2007; Kessler & Harcourt 2010). Curtin
and Wilkes (2006; 2007) discussed the experiences of tourists who swam with
dolphins in developed and developing countries; however, they did not differentiate
between the tourist experiences based on country of origin. In his economic-focused
paper, Orams (2002b) briefly discussed the profile and experience of tourists who
joined the whale watching tours in Tonga. Kessler and Harcourt (2010) is the only
publication that specifically documents the experience and satisfaction of cetacean
watching tourists in a developing country (i.e., Tonga). Only three papers discussed
the economic impact of cetacean watching tourism in developing countries (Hoyt
2001; Orams 2002b; O'Connor et al. 2009). Although the economic valuation of
Chilika Lake (home to the local Irrawady dolphins) in India has been assessed (Kumar
2010), the document did not particularly mention the economic impact of the dolphin
watching industry to the local villages. Clearly, more efforts must be made to examine
the sustainability of the cetacean watching industry in developing countries from
multiple perspectives including the human dimensions. This thesis addresses this gap
by studying dolphin watching at Lovina Bali (Indonesia) from multiple perspectives.
Page 36
Chapter 1 Introduction
14
Governance or management aspects of such industries in developing countries also
need to be examined. Many developing countries (including Indonesia) are renowned
for their rich natural resources. However, management of these resources is
compromised by corruption resulting from many factors including lack of political
will, ineffective compliance, inefficient coordination and poverty (Smith et al. 2003;
Laurance 2004). These factors must be considered in designing wildlife tourism
programs (including cetacean watching tourism) to ensure that the industry is
sustainable; such factors will be discussed in this thesis.
1.3.2 A cross-disciplinary framework for sustainable cetacean watching
tourism
In deciding whether a tourism industry (including wildlife tourism) is sustainable, one
must first examine the concept of sustainable tourism. In 1987, the World
Commission on Environment and Development (also known as the Brundtland
Commission) defined sustainable development as „development that meets the needs
of the present without compromising the ability of future generations to meet their
own needs‟ (WCED 1987). In 1992, the United Nations Conference on Environment
and Development (Earth Summit) in Rio de Janeiro referred to the term „sustainable
tourism development‟ for the first time; this concept was further explored in the 1995
World Conference on Sustainable Tourism, the charter of which recognised 18
principles of sustainable tourism.
The first principle of sustainable tourism stated in the charter was that „tourism
development shall be based on criteria of sustainability, which means that it must be
Page 37
Chapter 1 Introduction
15
ecologically bearable in the long term, as well as economically viable, and ethically
and socially equitable for local communities‟ (World Conference on Sustainable
Tourism 1995; France 2002, p. 13). Sustainable tourism should also involve
ecological maintenance, tourist satisfaction and the local community in its strategic
approach (France 2002). In this sense, ecotourism (Page & Dowling 2002; Newsome
et al. 2005) can be seen as a type of sustainable tourism. Wildlife tourism that meets
the criteria of ecotourism (Section 1.1, Figure 1.2) can also be considered sustainable.
The concept of sustainable tourism was important in deciding the nature and
framework of my research in Lovina. Sustainable tourism inherits a comprehensive
context, i.e., it must be examined from several viewpoints instead of being scrutinised
solely from a particular scientific discipline (France 2002). This view is in line with
the Precautionary Principle that also demands a cross-disciplinary approach (Kriebel
et al. 2001). The International Whaling Commission also acknowledged the merits of
integrated assessments of biological, social and economic information and the
implementation of the Precautionary Principle in the management of a cetacean
watching industry (IWC 2009). For these reasons, I decided to conduct a
comprehensive study (instead of just focusing on, for instance, the impacts of the tour
boats on the animals). I then proceeded to identify a sustainability framework for my
research.
Sustainability frameworks have progressed significantly over the last 100 years. The
first classical „bottom line‟, or indicator, that an activity is sustainable was the
economic bottom line. This concept dates back as far as the late 19th
century around
the time when Walras wrote his influential „Elements of Pure Economics‟ and stated
Page 38
Chapter 1 Introduction
16
that „In fact, the whole world may be looked upon as a vast general market made up
of diverse special markets where social wealth is bought and sold‟ (Walras 1874, p.
84). In the 1970s, a second element of „success‟ was added: social or human capital.
In this concept, an industry is considered sustainable if it can be held accountable for
its economic and human capital (Marlin & Marlin 2003; Crowther & Rayman-
Bacchus 2004). Then in the 1987s, in response to an increasing environmental
awareness at a global level, the Brundtland Commission acknowledged that „the
interventions needed to achieve sustainable development must be conceived and
executed by processes that integrate environmental, social and economic
considerations‟ (WCED 1987, p. 5). In 1994, Elkington coined the term „triple bottom
line‟ to describe a sustainability framework that encapsulated these three elements
(„people, planet and profits‟) into the definition of sustainable development
(Elkington 1997; Elkington 2004, p. 2).
For more than a decade, the triple bottom line concept was used to measure the
sustainability of an activity/industry (Rogers & Ryan 2001; Pope et al. 2004). In the
early 21st century, good governance (which was already mentioned in the Brundtland
Commission document), institution or an appropriate management framework was
added as the fourth element of sustainable development. The sustainability concept in
which good governance is seen as a necessary condition or tool to achieve the
sustainability of the triple bottom line is called „the prism of sustainability‟ (Valentin
& Spangenberg 2000; Spangenberg 2002a; Spangenberg 2002b; Spangenberg 2004).
The prism of sustainability is „a means to visually represent not only the four
dimensions, but also all their interlinkages‟ (Spangenberg 2002a, p. 298). Here
governance or institution is „defined as in political science, including not only
Page 39
Chapter 1 Introduction
17
organizations, but also mechanisms and orientations, etc‟ (Valentin & Spangenberg
2000, p. 382).
Other authors termed the combination of the four dimensions (i.e., the triple bottom
line plus governance) as the „quadruple bottom line‟, focusing on „the dynamic
interaction between components which cover financial, socioeconomic, and
environmental concerns, as well as governance and regulatory concerns‟ (Horrigan
2002, p. 518). However, some authors also see the fourth element of the quadruple
bottom line as „culture‟ (Dalziel et al. 2006; Allenby et al. 2007), which may confuse
those who view culture as included in the „people‟ or social (socio-cultural) element
(Horrigan 2002; Bendell & Kearins 2005; Durden & Pech 2006).
Both sustainability concepts have their merits. All literature on the prism of
sustainability agrees that institution/governance is the fourth element (Valentin &
Spangenberg 2000; Spangenberg 2002b; Meadowcroft et al. 2005). Governance in the
prism literature is seen as the means that is required to achieve the three goals of
improved people, planet and profits.
Unlike the prism concept, scholars who used the quadruple bottom line framework of
sustainability advocate the fourth element in parallel with the first three elements
(Horrigan 2002; Bendell & Kearins 2005; Dalziel et al. 2006; Durden & Pech 2006;
Allenby et al. 2007). The term „quadruple bottom line‟ indicates that it is derived from
the triple bottom line concept. The term „quadruple‟ assists the readers to understand
its link to the earlier triple bottom line concept. The quadruple bottom line concept
has also been used in the dwarf minke whale research in the northern Great Barrier
Page 40
Chapter 1 Introduction
18
Reef in Australia, in which studies on whale population estimates and behaviours are
combined with findings on tourist experiences, economic impacts and the
management of the industry to achieve a comprehensive sustainable tourism regime
(Birtles et al. 2002b; Valentine et al. 2004; Stoeckl et al. 2010; Curnock 2011;
Mangott et al. 2011; Sobtzick 2011).
A comprehensive four-dimensional approach for the sustainability framework has
been adopted in this thesis. Both quadruple bottom line sustainability and prism of
sustainability are used to show that the sustainability framework in this thesis is
derived from the triple bottom line concept, adding governance/institution as the
fourth element. I will indicate with appropriate citation whenever an idea that is
specifically derived from one of these concepts is used. The term „four elements of
sustainability‟ is used to indicate the use of both sustainability concepts in this thesis.
Figure 1.3 is a conceptual diagram that represents the use of four elements of
sustainability as used in this thesis. The visual representation is taken from of the
prism of sustainability (Valentin & Spangenberg 2000). The basic triangle uses the
triple bottom line concept (Elkington 1997; Elkington 2004) that was later adapted to
the quadruple bottom line approach (Horrigan 2002; Durden & Pech 2006).
Page 41
Chapter 1 Introduction
19
Figure 1.3 The four elements of sustainability used in this thesis which will be
adapted to the situation at Lovina, Bali, Indonesia (visual representation was adapted
from Valentin & Spangenberg (2000) combined with Elkington‟s „people, planet and
profits‟ (2004)).
1.4 Life, tourism and sustainability in Bali
1.4.1 Economic aspect
Bali is arguably the most famous island in the Indonesian Archipelago and one of the
world‟s most renowned tourism destinations. Located east of Java, Bali supported a
local population of more than 3.4 million people in 2008 (http://bali.bps.go.id) in an
area about 143 km long and 87 km wide. Tourism is the most important source of
income for the people of Bali. Tourism was initiated by the Dutch in 1924 when
weekly steamships took tourists from Batavia (Jakarta during the colonial period) to
Singaraja in Buleleng (North Bali) (Picard 1997). Post-independence, tourism in Bali
was established in the southern region of the island in the 1970s (Gouyon 2005).
Subsequently, Bali tourism experienced a sustained increase, reaching 1.5 million
visitors in 2001 (BBC 2002). International tourist arrivals plummeted 20% from 2002
Page 42
Chapter 1 Introduction
20
to 2003 after the first Bali terrorist bombing in October 2002 (Putra & Hitchcock
2006), but bounced back in 2004 with more than 1.2 million visitors (from January to
October) (Baker & Coulter 2007). The second Bali bombing in October 2005 also
reduced international tourist visitation and local income (Baker & Coulter 2007).
However, tourism is still the prime source of Gross Domestic Product (GDP for Bali,
contributing c.29% of the GDP in 2006-2008 (BPS 2009a).
Bali caters for various tourism intensities. North and east Bali are still comparatively
pristine, dotted with small-scale accommodation facilities. However, south Bali is
bedlam for paradise seekers who still wish to experience the same romantic image of
Bali that travellers in the 1970s described in their travel notes (Picard 1996; Berkmoes
et al. 2009). After recovering from the most recent bomb attack in 2005, Bali received
more than 1.9 million foreign visitors in 2008, mostly from Asia (51.5%), Europe
(26.3%) and Australia (15.7%) (BPS 2009b). Bali is targeting 2.6-2.8 million foreign
visitors in 2011 and claims that it does not need more accommodation facilities (Bali
Discovery Tours 2011). However, the likelihood of this small island being able to
accommodate visitors at a level almost equivalent to its resident population is
arguable.
1.4.2 Social aspect
Bali is essentially a patriarchal society where males dominate the social structures
(Parker 1997). A Balinese woman typically marries into her husband‟s family and
prays for his ancestors instead of hers. Although a woman could be adopted as the
family heir in the absence of sons, she generally inherits nothing when her father
passes away. Village-level governance („banjar‟) involves married men and not
Page 43
Chapter 1 Introduction
21
married women. Women are expected to be obedient and not pro-active; an
independent Balinese woman is likely to invite scrutiny.
The majority of Balinese adhere to a form of Hinduism that is similar to but distinct
from the Hindu traditions in other Asian nations, e.g., India, Sri Lanka, Laos and
Cambodia (see also Hall 1981). The Hindu tradition places particular emphasis on
caring for nature and this concept is specifically addressed in Bali as the Tri Hita
Karana. Based on the ancient text of Bhagavad Gita („The Song of God‟), Tri Hita
Karana literally means „the three ways to prosperity‟ (Tri = three, Hita = prosperity,
Karana = cause) and is unique to Balinese Hinduism (Wall 1993; Babad Bali 2000;
Krishna 2008). Tri Hita Karana promotes harmony among humans, humans and
nature, and humans and the Divine. In practice, Tri Hita Karana is a traditional
concept of sustainability that embraces the Quadruple Bottom Line/Prism of
Sustainability and adds a fifth element of sustainability - spirituality (see Inayatullah
2005 who promoted spirituality as a separate element from the socio-cultural
dimension). Tri Hita Karana can also be seen as a product of the Balinese culture,
which is accommodated in both the Quadruple Bottom Line and Prism of
Sustainability as part of the social element of sustainability.
1.4.3 Governance aspect
From a governance perspective, the Balinese people have an organised society, as
Geertz (1972, p. 37) eloquently explained: “The Balinese have a passion – that is the
only word for it – for organizing everything into specifically focused, highly
corporate, structurally articulate, mutually independent, autonomous groups and then
seeking to adjust relations among them in terms of a highly developed ritual system‟.
Page 44
Chapter 1 Introduction
22
This way of „doing things‟ runs through the entire society, from kinship and village
organization to temple worship and state structure”. The Balinese codification
system is an example of this passion. The product of this codification is called awig-
awig, written and verbal rules and norms set by members of a traditional organisation
(Suradisastra et al. 2002) or a Balinese customary charter/regulations (Davidson &
Henley 2007).
Awig-awig gives the „how-to‟ guidance to Balinese society confined within the
boundaries of a customary (adat) unit. A typical example is the awig-awig of the
Balinese subak (the traditional irrigation system known as subak), where water for
paddy field irrigation is divided into meticulous technical and organisational divisions
to ensure that every farmer who works in a watershed receives the same amount of
water (Geertz 1972; Suradisastra et al. 2002). The organisation of subak (and by
extension, its detailed awig-awig) is renowned at an international level, such that it
has been discussed alongside the traditional irrigation management systems in
Morocco and Nepal (Geertz 1972; Ramaswami et al. 2007). However, the use of
awig-awig in Balinese society is not only limited to water management. Awig-awig
can be found in many aspects of life in Bali, including residency status, microfinance,
townscape design and the traditional election system, from hamlet to customary
village level (Samadhi 2001; Arsyad 2005; Warren 2007).
Although the early awig-awig were generally written on lontars (palm leaf
parchments) (Geertz 1972), any modern day non-governmental rules in Balinese
society can be an awig-awig in their own right. Because awig-awig is essentially an
agreed rule among members of an organisation, it is technically possible to
Page 45
Chapter 1 Introduction
23
incorporate this type of traditional governance system into the cetacean watching
management in Bali. However, external intervention should not be the main reason
for this inclusion, because it can lead to a low sense of ownership among the local
communities (Satria et al. 2006).
1.4.5 Sustainable tourism in Bali
Although Bali was traditionally an agricultural society (Mitchell 1994; Robinson &
Meaton 2005), its main attraction to outsiders is its unique culture (Picard 1996).
From the early days of colonisation, the Dutch orientalists viewed Bali as the only
living museum that preserved the Hindu-Javanese civilisation in Indonesia (Picard
1996; Picard 1997). The 1920s publications of the Tourist Bureau about Bali were full
of cultural attractions, including visits to temples, holy springs and native art
performances (Picard 1996). However, it was not until the early 1970s that Bali was
officially designated as a cultural tourism destination (Picard 1995).
Cultural tourism is „passive, active and interactive engagement with culture(s) and
communities, whereby the visitor gains new experiences of an educational, creative
and/or entertaining nature‟ (Smith 2009, p. 17). Its scope ranges from visiting
heritage sites, religious sites, rural environments, festival and special events, to the
enjoyment of visual arts, creative activities and gastronomy (Smith 2009). Cultural
tourism is not a synonym for sustainable tourism (Smith 2002). However, Bali‟s
culture is inherently connected with nature, as expressed in the indigenous
sustainability of Tri Hita Karana and infused in the traditional Balinese way of life
(Wall 1993; Gouyon 2005; Krishna 2008; Berkmoes et al. 2009). Thus, one would
Page 46
Chapter 1 Introduction
24
expect cultural tourism in Bali to be conducted with respect for the island‟s carrying
capacity and other environmental considerations.
Unfortunately, tourism in Bali has not been conducted in a sustainable manner. In
reality, tourism operators and policy makers in Bali have practised mass tourism. The
opening of Bali‟s Ngurah Rai International Airport in 1969 marked the beginning of
mass tourism, which eventually eroded, or at least altered, the genuine culture of Bali
(Picard 1995; Barker et al. 2006). Sustainable tourism in Bali has been a particular
concern of many authors (Wall 1993; Warren 1998; Gouyon 2005; Krishna 2008). As
an indigenous Balinese woman, I share these concerns. Changing land use from
agriculture to tourism infrastructure (hotels and restaurants) and other services (e.g.,
office building and malls), freshwater supplies, grey water and solid waste
management, agricultural run-off, deforestation and destructive fishing are only a few
of the environmental concerns.
Modern Bali has become extremely dependent on tourism, such that when a series of
terrorist bombs hit Bali in October 2002 and October 2005, tourism – and by
extension the economy of Bali – collapsed (Putra & Hitchcock 2006). Post the 2002
and 2005 bombings, discourses focused on restoring the spiritual balance of Bali,
reclaiming the island‟s unique cultural identity, identifying appropriate types of
tourism and developing livelihood alternatives to tourism (Robinson & Meaton 2005).
The past decade has witnessed an emergence of many non-governmental
organisations that attempt to address various environmental issues in Bali. However,
before the start of this research project, no research had examined the sustainability of
the cetacean watching industry in Lovina, or in Indonesia in general.
Page 47
Chapter 1 Introduction
25
Cetacean watching in Indonesia began in the late 1980s in Lovina (Buleleng Regency,
Bali) (Gouyon 2005) and in 1991 in southern Bali (Hoyt 2001). Cetacean watching is
nowadays an attractive wildlife watching activity in Bali, rivalling bird and monkey
watching tourism in popularity (Gouyon 2005; Berkmoes et al. 2009). However,
insufficient information exists on the extent of cetacean-watching in Bali. Southern
Bali waters and Lovina (northern Bali) remain the only tourism destinations with
dolphin watching programs. In southern Bali, Bali Hai Cruises
(http://www.balihaicruises.com/) is the only marine-based tourism company that
widely advertises dolphin watching as one of its major attractions. Although the
southern Bali dolphin watching tourism presented interesting questions, the
complexity of issues that I witnessed during my first visit in January 2007 prompted
my decision to focus the examination on the dolphin watching industry in Lovina. I
use a cross-disciplinary approach using the quadruple bottom line and the prism of
sustainability concepts for my doctoral study.
1.5 Thesis objectives
This project addresses the following overall question:
Is the dolphin watching tourism industry in Lovina Bali sustainable from
biological, social, economic and managerial perspectives?
This objective was achieved by:
1. Describing and quantifying the encounters between tourist vessels and the
cetacean community off Lovina.
Page 48
Chapter 1 Introduction
26
2. Examining the evidence of the biological sustainability of the industry by
comparing the local situation with internationally accepted best practices.
3. Describing the profile and experiences of the tourists and documenting their
suggestions for the industry.
4. Determining the attractiveness of the industry to local villagers as a source of
income as an indicator of industry expansion pressures.
5. Determining the economic impact of this industry on Lovina‟s local economy
and its most prominent stakeholders / beneficiaries.
6. Examining the management aspects of the industry, including national laws
and regulations, local management arrangements and their implementation
(including on-water management), the boatmen‟s1 profile and suggestions for
improvement.
1.6 Thesis outline
This thesis is presented as a series of chapters that have been written in a format that
facilitates publication in peer-reviewed journals. Figure 1.4 provides the general
structure of this thesis.
1 All boatmen in Lovina are male.
Page 49
Chapter 1 Introduction
27
Figure 1.4 Outline of this thesis.
Chapter 1 (this chapter) describes the introduction to this thesis, including the
concepts and a brief overview of the problems of wildlife tourism (cetacean watching
tourism) in developing countries.
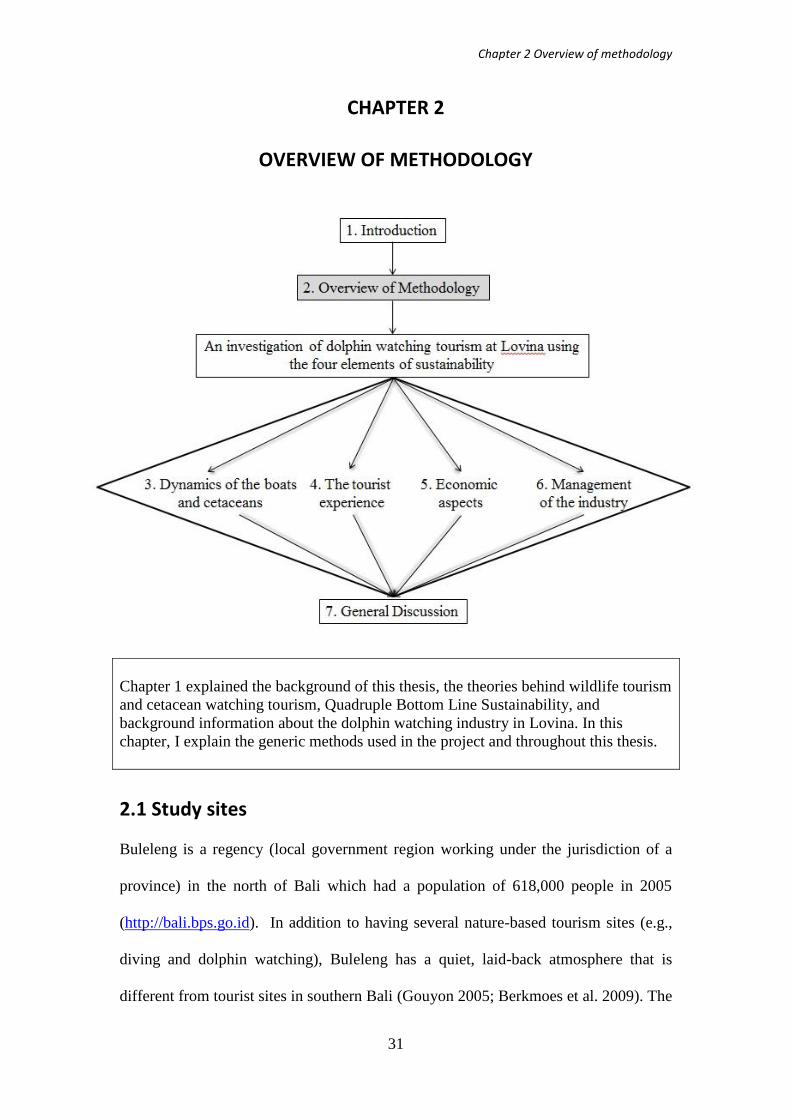
Chapter 2 outlines the methodology used in the thesis, including a general
description of the dolphin watching industry in Lovina.
Chapters 3-6 detail the investigations of the Lovina dolphin watching industry from
the four perspectives of the quadruple bottom line sustainability and the prism of
sustainability. Elements of sustainability applicable for each chapter will be stated in
the introduction to the specific chapter.
Page 50
Chapter 1 Introduction
28
Chapter 3 explains the dynamics of tour boats and the cetacean populations in
Lovina. This chapter will be submitted to the Journal of Cetacean Research and
Management. I analysed the data and wrote the chapter. Prof Helene Marsh (marine
mammal scientist), Dr Alastair Birtles (wildlife and marine tourism expert) and Dr
Yvette Everingham (statistician) variously assisted with designing the study,
interpreting the results and editing my writing. Statistical advice was provided by Dr
Yvette Everingham. GIS advice was provided by Dr Alana Grech.
Chapter 4 examines the experiences, satisfactions and suggestions of tourists who
attended the dolphin tours. This chapter is in review in the Journal of Sustainable
Tourism. I analysed the data and wrote the chapter. Prof Helene Marsh, Dr Alastair
Birtles and Dr Yvette Everingham variously assisted with designing of the study,
developing the questionnaire, interpreting the results and editing my writing.
Statistical advice was provided by Dr Yvette Everingham. Prof Phillip Pearce
(tourism expert) provided comments on the paper version of this chapter.
Chapter 5 presents the economic aspects of dolphin watching tourism in Lovina, in
terms of visitor direct expenditure and the economic impacts of this industry to the
boatmen and the village. This chapter is in review in the Journal of Ecological
Economics. I analysed the data and wrote the chapter. Prof Helene Marsh, Dr Alastair
Birtles and Dr Riccardo Welters (economist) variously assisted with designing the
study, interpretation of the results and editing my writing. Economic advice was
provided by Dr Riccardo Welters. Prof Natalie Stoeckl (environmental economist)
provided comments on the paper version of this chapter.
Page 51
Chapter 1 Introduction
29
Chapter 6 discusses the management of the industry from the boatmen‟s perspectives
and the processes and results of the stakeholder workshops. This chapter will be
submitted to the Journal of Cetacean Research and Management. I analysed the data
and wrote the chapter. Prof Helene Marsh and Dr Alastair Birtles assisted in
developing the approach, developing the semi-structured interviews and stakeholder
meeting arrangements, interpreting the results and editing. They also attended the
stakeholder meetings in Bali. Dr Alison Cottrell (human geographer with extensive
Indonesian experience) provided comments on the paper version of this chapter.
Chapter 7 synthesises the four main chapters (3-6), provides insights for future
management of the Lovina dolphin watching industry and discusses challenges in
implementing those ideas. This chapter also presents insights learned from Lovina for
the betterment of marine wildlife tourism in developing countries. This chapter will be
submitted to the Journal of Marine Policy. I analysed the data and wrote the chapter.
Prof Helene Marsh, Dr Alastair Birtles and Dr Mark Hamann (sea turtle and marine
conservation scientist) assisted in developing the approach, interpreting the results and
editing my writing.
In the following chapter, I will introduce the generic methods used for the research
and general information on Lovina.
Page 52
Chapter 1 Introduction
30
Page 53
Chapter 2 Overview of methodology
31
CHAPTER 2
OVERVIEW OF METHODOLOGY
Chapter 1 explained the background of this thesis, the theories behind wildlife tourism
and cetacean watching tourism, Quadruple Bottom Line Sustainability, and
background information about the dolphin watching industry in Lovina. In this
chapter, I explain the generic methods used in the project and throughout this thesis.
2.1 Study sites
Buleleng is a regency (local government region working under the jurisdiction of a
province) in the north of Bali which had a population of 618,000 people in 2005
(http://bali.bps.go.id). In addition to having several nature-based tourism sites (e.g.,
diving and dolphin watching), Buleleng has a quiet, laid-back atmosphere that is
different from tourist sites in southern Bali (Gouyon 2005; Berkmoes et al. 2009). The
Page 54
Chapter 2 Overview of methodology
32
regency government has focused on ecotourism and agritourism since 2007, with
Lovina as one of the key areas.
Lovina is the collective name of several villages 20 minutes drive westward from
Singaraja (the capital of Buleleng). A tourist that leaves from Denpasar will reach
Lovina after 2.5 hours driving north through a scenic but winding route across the
mountainous region of central Bali. As a tourist arrives in the village, he or she
experiences a different cultural phenomenon to what he/she experienced in south Bali.
Modern day Lovina is akin to south Bali (particularly Kuta) in the 1970s, where early
explorers were treated to a quiet life and relatively pristine environment. Unlike
modern Kuta, no traffic congestion exists in north Bali. The air is fresh, the sky is
clear and the stars are visible at night. The night life on the beach is quiet, although
music from cafes and restaurants can be heard from a distance. Walking along the
footpath in the daylight, a tourist can enjoy unique local delicacies sold on the beach
while watching the fishers fix their fishing nets and the boatmen clean the boat‟s long
tailed engines.
The pace of life in Lovina is slow, even slower than the generally slow pace of life in
Bali (Berkmoes et al. 2009). However, Lovina is close enough to modern facilities
such as ATMs, internet cafes, travel agents and hospitals to ensure that their daily or
emergency needs of the tourists are met. The restaurants offer excellent food with
reasonable prices for foreign tourists, including recommended grilled fish stalls along
the main road. Although many things can be done in Lovina, the underlying themes
are rest and relaxation. A tourist can walk along the black sandy beach or the small
lanes, looking for typical Balinese souvenirs. S/he can also rent a car to go to adjacent
Page 55
Chapter 2 Overview of methodology
33
waterfalls, temples or vineyards. When terrestrial attractions are exhausted, the tourist
can always turn the attention to the sea.
Lovina does not have excellent waves; it is not the nature of north Bali shores.
However, small reef patches in front of Lovina offer an excellent snorkelling
experience for beginner snorkelers. Local diving shops are also ready to escort divers
to enjoy the local reefs off Lovina or to better diving sites at the nearby Bali Barat
National Park (approximately one hour‟s drive westward). Undoubtedly however,
Lovina‟s main marine attraction is its dolphin watching tourism.
Kalibukbuk and Kaliasem are the two major coastal villages in Lovina. The local
authorities recorded that approximately 9,800 people resided in these villages in 2007.
Dolphin watching tourism in Lovina is hosted by these two villages. Kalibukbuk has
three beach departure locations for dolphin trips (Banyualit, Aneka and Kalibukbuk)
while Kaliasem has one (Kaliasem). Throughout the thesis, a beach departure location
will be referred to as a „port‟. A three km sandy beach stretches between the Kaliasem
and Banyualit ports (Figure 2.1) where traditional outriggered wooden boats
(„jukung‟) are beached on the shore. An iconic dolphin statue, which was built in
1996, stands at the end of the main lane that takes visitors to the Kalibukbuk departure
port (Figure 2.2).
Page 56
Chapter 2 Overview of methodology
34
Figure 2.1 The four dolphin associations in the Kaliasem and Kalibukbuk villages of
Lovina
Dolphin tourism in Lovina has operated year round since 1987. International visitors
informally alerted local artisanal fishers to the tourism opportunities offered by the
diverse cetacean community close to shore. Local small-scale fishers formed self-
regulated dolphin watching cooperatives operating from the four major departure
ports mentioned above. Each cooperative is managed by a dolphin guide association;
from west to east, they are Kaliasem, Kalibukbuk, Aneka and Banyualit Associations.
Dolphin tours are conducted using jukungs (8-10 m long and 60-90 cm wide with two
5m outriggers – Figure 1) which take up to four passengers (IDR 60,000 or USD 6.6
per passenger per trip). When the boat is afloat, the freeboard is typically 30-40 cm
higher than the water surface. There are at least 184 jukungs along the coast of the
Kaliasem and Kalibukbuk villages, plus another 58 fishing jukungs at Temukus
village at the western border of Kaliasem. All these vessels have the potential to take
tourists to see the dolphins. The majority of jukungs (179) are dedicated tour boats
Page 57
Chapter 2 Overview of methodology
35
which are kept clean and have colourfully painted hulls and outriggers and
increasingly powerful engines (currently approximately 12 HP). The remaining
jukungs are regular fishing boats that fish daily and can take tourists for dolphin
watching during the high visitation season. Each jukung is typically owned and
captained by one boatman who is licensed by his dolphin association. The industry is
otherwise unregulated.
Anecdotal information from the local boatmen indicated that the high visitation
season („High Season‟) lasts from June to October; the low visitation season („Low
Season‟) from November to May. As the baseline data on the local dolphin population
dynamics were not available, my field season was designed around the pattern of
tourist visitation. The Low Season coincides with the Balinese rainy season with
strong winds and rough seas being more frequent. The High Season coincides with the
dry season in Bali when the wind and the sea are generally calmer.
Data collection was conducted to enable some seasonal comparisons. The data were
collected over four field trips: October 2007 to January 2008 (preliminary data
collection), June to September 2008, February to April 2009, December 2009 and
April 2010. My research was mostly focussed on the two major villages of Lovina:
Kalibukbuk and Kaliasem (Figure 2.1). However, I extended the vessel survey area to
cover Kalisada village (about 40min drive westward of Kalibukbuk) and the capital
town of Singaraja (about 20min drive eastward of Kalibukbuk) because my pilot
study indicated that the tourist vessels searched in this region in the Low Season.
Singaraja was also the location for the final stakeholder meeting in April 2010.
Page 58
Chapter 2 Overview of methodology
36
Figure 2.2 The iconic dolphin statue at the end of the main lane in Kalibukbuk,
Lovina
2.2 The field team
The field work team consisted of three research assistants (two female students from
the Diponegoro University, Semarang, Central Java and a male native Balinese) who
assisted me in data collection and data entry in Bali. The two university students used
a portion of my data for their honours theses. In June 2008 and February 2009, Ocean
Park Conservation Foundation in Hong Kong sent two teams of volunteers to help me,
each of two students. Several other volunteers also assisted me in 2007/2008; all of
whom are acknowledged in the Acknowledgements section of this thesis. All research
assistants were trained to the same standard for data collection and data entry,
particularly in distance estimation, species identification and boat and dolphin
counting. A laser range finder Leupold BC800C (8 x 32) was used for distance
estimation. Marine mammal identification books (Reeves et al. 2002; Shirihai &
Jarrett 2006) were used for species identification. The research assistants were also
Page 59
Chapter 2 Overview of methodology
37
trained in the proper methods of conducting interviews and questionnaire distribution
and were given official identification cards to assist those processes.
2.3 General methods
The four elements of sustainability encapsulated in the quadruple bottom line
sustainability and the prism of sustainability concepts formed the basic framework of
this thesis (Chapter 1). Thus, my research used two major approaches: 1) boat
surveys; and 2) land-based human-dimension surveys. The boat surveys mainly aimed
to answer Goals 1 and 2 (the biological element – recapitulated in Chapter 1),
although some data (e.g., the number of boats) were also used for the economic
element. The boat surveys involved line and point surveys, scan samplings, focal boat
follows, GPS tracking and ad libitum observations. Details of these methods and
analyses of the data will be explained in Chapter 3.
The land-based, human-dimension surveys were designed to answer Goals 3-6 (the
social, economic and managerial elements – see Chapter 1). However, some
information from the boatmen was later used to verify our boat-related findings. The
land-based surveys included tourist questionnaires (Chapters 4 and 5), interviews with
the boatmen (Chapter 6) and stakeholder meetings (Chapter 6). Details of these
methods and analyses of the data are explained in the various thesis chapters. This
research also aimed to suggest practical management actions. Hence, several
principles of participatory action research were used in this research, i.e., aiming for
action instead of just an understanding of the phenomenon, where action on the
findings is integral to the process (Ramaswami et al. 2007).
Page 60
Chapter 2 Overview of methodology
38
Animal ethics (A1247) and human ethics (H2769) approvals have been obtained prior
to the commencement of data collection. As required by my Human Ethics Approval,
interviews and questionnaires were conducted as follows: 1) prior to the interviews,
respondents were asked for their written informed consent; and 2) questionnaire
respondents (i.e., the tourists) were provided with a written statement ensuring data
confidentiality. They were also given options to provide their names or email
addresses for me to inform them about the research products (e.g., thesis and papers).
For convenience, I used the term „dolphin tourist‟ to describe tourists who undertook
dolphin tours in Lovina.
2.4 Thesis format
As explained above, Chapters 3 to 6 of this thesis were originally written as papers
which were co-authored with Prof Helene Marsh, Dr Alastair Birtles, Dr Yvette
Everingham and Dr Riccardo Welters as indicated in the introduction of each chapter
(see also „Statement of Contribution by Others‟). To make this document reader-
friendly, I have reformatted each paper into a chapter. To improve the readability of
the thesis, I removed any redundancies and added the links or cross references
between chapters.
2.5 Currency
Although I am based in an Australian university, to increase the accessibility of this
thesis to international readership, all financial costs have been expressed in US dollars
(averaging 2008 and 2009) and in Indonesian rupiah whenever necessary.
Page 61
39
CHAPTER 3
THE DYNAMICS OF THE BOATS AND THE CETACEANS
This chapter2 will be submitted to the Journal of Cetacean Research and Management
as follows: “Mustika, PLK, Birtles, A., Everingham, Y. and Marsh, H. Encounters
between cetaceans and tourist vessels in Lovina, Bali (Indonesia): is this industry
biologically sustainable?”
Although this research examines the sustainability of dolphin watching tourism in
Lovina using the four elements of sustainability, the original question which prompted
my thesis was whether the tour boats posed any threat to the dolphins in Lovina.
Therefore, I have decided to start the sustainability analyses from the biological
viewpoint of the quadruple bottom line and the prism of sustainability concepts. In
this chapter, I quantify the dynamics between the tour boats and the cetaceans and the
potential problems the boats might pose to the animals.
2 Starting from Chapter 3 to Chapter 6, I would occasionally use the plural first person narrative
(„we‟). However, the „we‟ refers to „my team and I‟, „my supervisors and I‟ or the general audience,
instead of „my co-authors and I‟.
Page 62
Chapter 3 The dynamics of the boats and the cetaceans
40
3.1 Introduction
3.1.1 Traditional methods of measuring how cetaceans are affected by
tourism
This chapter examines the sustainability of the dolphin watching industry in Lovina
from the perspective of the biological element of sustainability. The International
Whaling Commission recognised the benefits of cetacean watching as a type of non-
lethal use of cetaceans (IWC 2009). However, as briefly stated in Chapter 1, while the
cetacean watching industry benefits the local economy, its possible negative effects
on the local cetacean populations must also be examined. Cetacean watching boats
may harm the environment by discharging pollution, emitting noise or changing the
behaviour or composition of the target cetaceans (Bejder & Samuels 2003; Warnken
& Byrnes 2004). Several studies have demonstrated that cetacean watching can harm
the target populations (Bejder et al. 1999; Constantine 2001; Lusseau 2003;
Constantine et al. 2004; Orams 2004; Lusseau 2006; Christiansen et al. 2010).
However, the possible impacts of the cetacean watching industry on the local cetacean
populations in Lovina have never been examined.
Researchers have attempted to measure possible impacts of viewing (and swim-with)
tourism on cetacean populations. Bejder and Samuels (2003) summarised three
analytical designs commonly used: 1) within effect comparison; 2) control versus
impact comparison; and 3) before/during/after (BDA) comparison. The definitions
and examples of the three designs are presented below.
Page 63
Chapter 3 The dynamics of the boats and the cetaceans
41
Within effect comparison is designed to examine how tourism activity affects
cetaceans at a particular site where a control is virtually impossible to establish
(Bejder & Samuels 2003), for instance when there is a high level of tourism activity.
Controls may also be difficult to establish when the platform of opportunity (i.e., the
tourist vessel) used by researchers potentially disturbs the animals. Because no control
unit is available for data comparison, researchers compare the effects of several
intensities or types of tourism (e.g., the number of swimmers, the number of boats or
the permit status of the boats) on the animals. Because of the absence of controls, a
within effect comparison requires longitudinal data. Constantine et al. (2004) used
within effect comparison to examine the effects of tour boats with and without permits
on the behaviours of bottlenose dolphins in New Zealand from December 1996 to
February 2000. They observed a decreased frequency of dolphin resting behaviours as
the number of tour boats increased. Timmel et al. (2008) compared the effect of
swimmers on the behaviours of spinner dolphins in Hawaii from March 2000 to May
2002 with the 25 years of results that Norris et al. (1994) collected from the late 1940s
to the 1960s. They suggested that an increased level of anthropogenic activities was
associated with the likelihood and frequency of the local spinner dolphins altering
their travel direction.
Researchers may choose control versus impact comparisons when control units can be
established. This approach is conducted to measure the effect(s) of a treatment (e.g., X
number of tour boats or Y interaction times) on the local cetacean populations (Bejder
& Samuels 2003). Williams & Ashe (2007) used this design to examine the responses
of Orcinus orca to boats in British Columbia using experimental manipulations. They
found that the killer whales showed evasive movements in the presence of a certain
Page 64
Chapter 3 The dynamics of the boats and the cetaceans
42
number of tour boats. However, when there were more than three tour boats, the
whales‟ travel paths became more direct. Williams & Ashe (2007) attributed this
change of behaviour to non-linear relationships between variables, e.g., the whale‟s
lack of horizontal escape space due to an excessive numbers of boats. Nowacek et al.
(2001) compared the inter-breathing interval of Florida Tursiops truncatus with and
without tour boats (i.e., the boats were >100m away). They found that the dolphin‟s
inter-animal distance decreased, the travel direction changed and swimming speed
increased as a tour boat approached, particularly in shallow water.
Researchers can also examine the different responses of the cetaceans before, during
and after treatment (before/during/after (BDA) comparisons). This approach measures
the variables in three combinations: before/during treatment, during/after treatment or
before/after treatment (Bejder & Samuels 2003). This design is similar to „control
versus impact‟ because the before and after treatment can be considered as controls
although residual effects might influence the after-treatment measurements. For
example, Lusseau (2003) compared the behaviours of Tursiops spp before tour boats
approached, during encounters with tour boats and after the boats departed and found
that the dolphins were more likely to travel after contact with the tour boats.
Christiansen et al. (2010) also used this approach to examine the effects of tour boats
on Tursiops aduncus behaviours in Zanzibar and found similar conclusions to those of
Lusseau (2003).
In addition to choosing the appropriate research design, researchers must also
consider: 1) whether the measured activities contribute to short term or long term
changes in the population; and 2) possible confounding factors that may not
Page 65
Chapter 3 The dynamics of the boats and the cetaceans
43
necessarily be included in the original design. Short term impacts, e.g., changes in
surface times, dive patterns, and behavioural states, are generally easier to measure
than longer-term impacts (Bejder & Samuels 2003). However, long-term data
(preferably experimental data) are required to confirm that the anthropogenic
activities directly contribute to long-term changes in a local cetacean population (e.g.,
habituation, habitat utilisation and reproductive success). Timmel et al. (2008) and
Courbis & Timmel (2009) used historical data and analyses of the Hawaiian spinner
dolphins (Stenella longirostris longirostris) since the early 1990s as evidence that the
swimmers and vessels had made a measurable contribution to the behavioural changes
observed.
Confounding factors are more difficult to measure, particularly when historical data
are not readily available (Bejder & Samuels 2003). Although experimental design can
minimise the effects of confounding variables, if experimental manipulations with
different treatment scenarios are not possible, researchers must be open to such
effects. Under such circumstances, a line of evidence approach may be appropriate.
Currey et al. (2009) and Rowe et al. (2010) used a line of evidence approach to
deduce that a hydroelectric power station in Doubtful Sound, New Zealand, was an
important contributor to the decline in calf survival of bottlenose dolphins (Tursiops
sp.). Before these studies, tourism was thought to be the major source of significant
anthropogenic impact. Therefore, researchers must take extra care to consider many
environmental factors before concluding that a tourism activity harms local cetacean
populations.
Page 66
Chapter 3 The dynamics of the boats and the cetaceans
44
3.1.2 Challenges in Lovina
Pilot studies were conducted in Lovina during November-December 2007 and
January 2008 (22 days) to obtain initial data to inform the design of our subsequent
data collection methods. A „before/during/after comparison‟ was first planned, aimed
at understanding cetacean behaviours before the first tour boats arrived offshore.
However, during the preliminary study some tour boats were observed to leave the
beach well before dawn. These boats usually encountered the dolphins before first
light, making the before/during comparison impossible. Also, my team and I could not
ascertain whether the cetaceans that remained in the survey areas after the boats had
returned to the beach belonged to the same group as the first animals that we
encountered that day. Thus, the logistical challenges of „before/during/after
comparisons‟ were considered insurmountable for subsequent data collection stages.
The preliminary study indicated that the tour boats generally operated from 6am to
8am in spatially localised areas. A „control versus impact‟ study was therefore chosen
because it enables the examination of cetacean behaviours without the presence of
tour boats and outside the general encounter areas. However, the number of tour
vessels at Lovina complicated this approach. Researchers studying tourist cetacean
encounters in other parts of the world have reported the effects of approximately nine
tour boats per encounter (mean 8.9 se+2.2, range 1-20) (Bejder et al. 1999; Hastie et
al. 2003; Constantine et al. 2004; Allen et al. 2007; Courbis 2007; Williams & Ashe
2007; Duprey et al. 2008; Christiansen et al. 2010). This number was about half the
average number of boats around a school of cetaceans in Lovina (pilot study mean
18.4 boats, se+2.6, range 4-41). Alternatively, some researchers have used post-hoc
categories with two or three boats per encounter as „few‟ and beyond two or three as
Page 67
Chapter 3 The dynamics of the boats and the cetaceans
45
„many‟ (Stensland & Berggren 2007; Williams & Ashe 2007). This definition is
almost never applicable in Lovina because a category of „few‟ rarely applies.
Consequently, I considered „within effect comparison‟ as the main design with which
to examine the possible association between the tour fleet and the local cetaceans in
Lovina, while continuing to explore the „control versus impact‟ approach as planned.
Many variables confound the analysis of the situation in Lovina. The number of tour
boats, weather, sea state, currents and prey availability could contribute to observed
differences in cetacean behaviours. A power plant eastward of Lovina is often visited
by oil tankers, which may also influence the behaviour of local cetaceans. These
factors were not examined during data collection, but I had to be mindful that they
might present non-linear influences on the variables measured.
I did not conduct a larger scale ecological survey on the cetacean population in
Lovina (e.g.,a more comprehensive study based on line transects, focal animal
follows or photo-identificatoin) because of safety reasons and limited project funds.
My jukung capsized in July 2008 when I was trying to do a line transect in a Beaufort
3-4 weather. A safer and slightly larger boat would have cost approximately USD 500
per day. I spent 36 days doing point surveys and 48 days doing line transects.
Assuming that only 30 days were required for the larger scale ecological survey, an
additional USD 15,000 would have been required (which I did not have).
As stated in the introduction to this chapter, this chapter examines evidence of the
biological sustainability of the dolphin watching industry in Lovina, which
corresponds to the biological element of sustainability („planet‟) described in Figure
Page 68
Chapter 3 The dynamics of the boats and the cetaceans
46
1.3. Given the logistical challenges explained above, the biological sustainability of
this industry is examined through three steps: 1) describing and quantifying the
encounters between tourist vessels and the cetacean community off Lovina; 2)
investigating the association between the tour fleet and the cetaceans; and 3)
comparing Lovina with internationally accepted best practices for cetacean tourism.
The results are discussed later from the perspectives of the industry‟s general
operation and encounters with the animals, whether the practice is biologically
sustainable and the implications of such conclusions.
3.2 Methods
Boat surveys in offshore Lovina were conducted by two researchers using a hired
jukung (see also Chapter 2). To meet various objectives of this chapter, the data
collection during the boat surveys was designed to include six types of sampling: 1)
line transects; 2) point surveys; 3) scan sampling; 4) focal boat follows; 5) ad libitum
sampling; and 6) GPS vessel tracking (Figure 3.1).
Page 69
Chapter 3 The dynamics of the boats and the cetaceans
47
Figure 3.1 Research design framework used to understand the dynamics between
cetaceans and tour boats in Lovina
As explained in Chapter 2 (Section 2.1), the field season was designed around the
pattern of seasonal tourist visitation. Data were collected over four field trips:
October 2007 to January 2008 (preliminary visit), June to September 2008 (High
tourist season; focal follows, scan sampling, ad libitum sampling; GPS vessel
tracking); February to April 2009 (Low tourist season; point surveys, focal follows,
scan sampling, ad libitum sampling) and April 2010 (Low Season; point survey).
Thus for the scan sampling and focal follows, season was confounded with year.
Hence, the inferences that could be made about some temporal effects are limited.
A „survey day‟ was defined as a day on which my team and I conducted a survey. To
reduce the ambiguity associated with the term „number of boats‟, I distinguished
between: 1) the total fleet size: the number of boats in the fleet, in this case 179
Page 70
Chapter 3 The dynamics of the boats and the cetaceans
48
licensed boats; 2) the daily fleet size: the maximum number of boats going out on any
given day; 3) the encounter fleet size: number of boats around a school of dolphins
(see Carlson 2010); and 4) the observed fleet size, i.e., the observed number of boats
on the water at any given time (including vessels travelling between schools and
vessels observed on the horizon).
Dolphin tour boats are more likely to threaten a cetacean population if the animals
belong to a resident population (Shirakihara et al. 2002; Berghan et al. 2008). A
systematic photo-identification study is the usual method of determining the residency
pattern of a cetacean population (Wursig & Jefferson 1990; Shirakihara et al. 2002).
Ideally, capture probabilities should be homogeneous. This situation is always
difficult to achieve for marine mammals because some animals are more boat-shy
than others (Wursig & Jefferson 1990), such as in Lovina. The limited timeframe for
an AusAID sponsored PhD project also meant that the inclusion of photo-
identification would resulted in reduced time in the data collection and analyses of
other research components. Thus, my supervisors and I decided that photo-
identification was beyond the scope of this project. Accordingly, I used spatial and
temporal analyses of the sighting frequency of the target species to provide some
insights into the residency pattern of various species of cetaceans in Lovina.
3.2.1 Data collection
The complexity of the dolphin watching industry in Lovina demands several types of
data collection methods as described in Figure 3.1. A detailed explanation of each
method follows.
Page 71
Chapter 3 The dynamics of the boats and the cetaceans
49
Line transect surveys
Based on Buckland et al. (2004) and Barlow et al. (2001), this sampling protocol was
to provide descriptive information on the spatial distribution of the cetaceans and
boats and was designed to enable control versus impact comparisons (Figure 3.1). The
objectives of the survey were to: 1) understand the species‟ composition, distribution
and abundance of the dolphins in the area; and 2) quantify the proportion of cetaceans
off Lovina targeted by dolphin watching tourism. My team and I conducted an initial
series of line transects in the waters between Kalisada village (8.189° S and 114.89° E
on the beach to 8.111°S and 114.86°E offshore) and Singaraja (8.103° S and 115.089°
E on the beach to 8.026° S and 115.062° E offshore), a total area of approximately
364 km2 (28 km x 13 km) (Figure 3.2). Surveys were conducted in June, July and
September 2008, along nine transect lines from the shore to the 800m isobath, which
is between 9 and 13km offshore depending on the bathymetry. The distance between
two adjacent transect lines was 3 km. Each survey was completed in three days at a
vessel speed of 7 knots (~ 13 km/h); the maximum travel time between lines was
about 20 min. With an estimated effective strip width of 500 m, the total transect area
was 97 km2 or 26.65% of the total study area (sampling fraction). This design
minimised the likelihood of double counting the same school of dolphins on any one
day. I replicated the survey four times over 15 weeks from June to September 2008.
The resultant sighting rate was too low to provide useful quantitative information.
Hence a finer scale point survey was implemented, as described below.
Page 72
Chapter 3 The dynamics of the boats and the cetaceans
50
Figure 3.2 Morning sightings (before 8am) of cetaceans during the 2009 and 2010
point surveys (36 days) off Lovina, overlaid with the 2008 line transect sightings.
Point surveys
The basic design of this survey followed the point transect sampling technique of
Buckland et al. (2004). Point survey protocol also provided descriptive information on
the spatial distribution of cetaceans and vessels and was designed to enable control
versus impact comparisons (Figure 3.1). The point surveys had the following
objectives:
1. To obtain a robust index of the pattern of spatial distribution of cetaceans in
the coastal waters of Lovina (survey area) between 6 am – 8 am (the time of
day when the cetacean watching occurs).
2. To determine whether the relative density of cetaceans was the same in the
core cetacean watching area as in the remainder of the survey region.
Page 73
Chapter 3 The dynamics of the boats and the cetaceans
51
3. To quantify the differences in cetaceans' behaviours when they were
surrounded/not surrounded by the tour boats (i.e., the control versus impact
comparison, sensu Bejder and Samuels (2003))
The point surveys assumed: 1) that the spatial distribution of the cetaceans did not
change systematically between 6 and 8 am; and 2) that the spatial distribution of the
cetaceans between 6 am and 8 am was independent of the behaviour of boats.
Point surveys were conducted in two Low Seasons (February – April 2009 and April
2010) (Figure 3.2). The survey region was the coastal waters off Lovina between
Kalisada and Singaraja. Following Buckland et al. (2004), sampling points were
placed randomly within sectors in a stratified design along the shores of Lovina and
adjacent villages and across the depth gradient stratified by water depth.
The coastline of Lovina was divided into 8 x 3 km wide sectors along the shore. Each
sector extended from the 15 m isobath to the 500m isobath and was divided into an
offshore and an inshore zone delineated by the 200 m isobath (Figure 3.2). The
rationale for choosing these boundaries was as follows: 1) the 15 m isobath is inshore
of the shallowest cetacean sightings suggested by the previous fieldwork I had
conducted in July 2008 (the most inshore sightings of Stenella attenuata were in the
vicinity of 20m isobath); 2) the 200m isobath is recognised by the UN Convention on
the Laws of the Seas as one of the delineators of a continental shelf; and 3) the 500m
isobath was the usual outer boundary of the area accessed by tour boats.
Page 74
Chapter 3 The dynamics of the boats and the cetaceans
52
Each sector was divided into 300 m x 300 m grids. Each survey sampled
approximately 10% of the total number of randomly chosen grids in each zone in each
sector, typically five to six locations or „points‟ per sector zone or 9-11 points per
sector. The sector and zone surveyed each day were randomly chosen without
replacement, taking weather conditions into account i.e., offshore sectors were not
sampled in Beaufort > 4. A total of 80 randomised points were covered per survey.
The survey was replicated three times during each of the years 2009 and 2010 for a
total of six replications over 36 days over nine weeks. The target grids were re-
randomised each time. Two sampling points in the 2009 survey and seven sampling
points in the 2010 survey were abandoned because of bad weather. The two years of
surveys yielded 471 surveyed points.
The research boat (equipped with a GPS) was positioned at the middle of the
randomised point inside the target grid. The engine was switched off and the vessel
allowed to drift. A protocol to note an event whereby the vessel drifted to another
randomised point was made; however, such an event never took place. The compass
bearing of the long axis of the boat was noted. Two observers scanned the
surrounding waters (360° in total; 180° each observer) for a distance of 150 m for 10
minutes and recorded the presence and species of cetaceans and tour boats: 1) both
within the 150 m radius sampling circle; and 2) outside the 150 m radius). After 10
minutes, the boat moved to the next target grid on the sampling schedule. The 150 m
radius was set as the distance at which my team and I were confident that we would
not miss any dolphin surfacing regardless of the sea state.
Page 75
Chapter 3 The dynamics of the boats and the cetaceans
53
Prior to the survey, the observers were trained to estimate the outer boundary of the
focal search area by practising distances calibrated using laser distance-estimating
binoculars. The length of each observation period was chosen to be substantially
longer than the maximum recorded dive times for Hawaiian spinner dolphins in the
morning (3.5 minutes) as estimated by Norris et al. (1994).
The following data were recorded: 1) cetacean species, number, behavioural state (11
categories, Table 3.1), position and distance from research boat (laser binoculars); 2)
number of vessels, the activity of each vessel (nine categories, Table 3.2) and its
position relative to the research vessel; 3) number of passengers per vessel; and 4) the
drifting direction. The term „boat behaviour‟ or „behaviour of the boats‟ used in this
chapter onwards reflects the activity of each vessel or the behaviour of boatmen who
drove the boats.
Page 76
Chapter 3 The dynamics of the boats and the cetaceans
54
Table 3.1 Categories of cetacean behaviours* used in the dolphin research off Lovina
(modified from Constantine et al. 2004)
Category Explanation
Aerial^ Aerial displays, including spinning – post-hoc „undisturbed‟ (see
Section 3.2.2)
Bow riding^ Cetaceans bow riding at the bow or side of boats, using boat wakes
Diving Cetaceans performing steep dives, arching their backs at the surface
to increase speed of descent – post-hoc „avoidance‟ (see Section
3.2.2)
Milling Individuals idling, facing different directions, school often changes
directions, dive intervals variable but short – post-hoc „undisturbed‟
(see Section 3.2.2)
Resting Cetaceans in slow movements as a tight group, no active component
of other behaviours, dive interval relatively constant, synchronous
and short
Socialising Leaping, chasing, engaging in body contact with each other
(including mating and playing) and slapping (including head slap)
Slow travel Cetaceans moving in persistent directional movement < 3 knots –
post-hoc „undisturbed‟ (see Section 3.2.2)
Travel Cetaceans moving steadily in a constant direction, > 3 knots, but not
porpoising (leaping clear out of water descent – post- hoc
„avoidance‟, see Section 3.2.2)
Fast travel Cetaceans porpoising in a persistent, directional movement descent
– post-hoc „avoidance‟ (see Section 3.2.2)
Feeding Cetaceans capturing and consuming prey, evidenced by chasing fish
on the surface, coordinated deep diving with loud exhalations, and
rapid circle swimming – post-hoc „undisturbed‟ (see Section 3.2.2)
Swimming underneath
boat
Cetaceans diving then swimming underneath the boat
* the list includes behavioural states (behaviours with appreciable durations) and behavioural
events (instantaneous behaviours) after Altmann (1974) and Mann (1999). Behavioural events
are marked with ^
Page 77
Chapter 3 The dynamics of the boats and the cetaceans
55
Table 3.2 Categories of boat behaviours used in the dolphin research off Lovina
(modified from Allen et al. (2007))
Category Explanation
Chase with speed faster
than the cetaceans
Boat heads straight at cetacean school at a speed that
exceeds that of the cetaceans but stops before the
school
Approach with speed
slower or the same as the
cetaceans
Boat approaches cetacean school but stops before
the school, not speeding
Circle to the front of the
cetacean school
Boat travels to the front of the cetacean school in a
semi-circling movement
Parallel with the cetacean
school
Boat runs parallel within 150 m of the cetacean
school
Driving or cutting through
the cetacean school
Boat speeds straight to and then through the
cetacean school
Following the cetaceans
Boat follows the cetaceans from behind
Stationary with engine on
(neutral gear)
Boat relatively stationary within 150 m of the
cetacean school, engine on
Stationary with engine off Boat relatively stationary within 150 m of the
cetacean school, engine off
Searching for cetaceans Boat searches for cetaceans
Scan sampling
This sampling type provided descriptive information on the spatial distribution of the
vessels and the cetaceans and was designed to enable within effect comparisons
(Figure 3.1). Scan sampling takes „a „point‟ or „instantaneous‟ sample of an
individual‟s behaviour or location before moving to the next animal and doing the
same‟ (Mann 1999, p. 113). Scan sampling may begin when „a particular behaviour
occurs (e.g. whenever a particular pair of individuals interact, or whenever the
Page 78
Chapter 3 The dynamics of the boats and the cetaceans
56
animals enter a particular habitat)‟ and may end „after a particular class of
behaviours or interactions has terminated‟ (Altmann 1974, p. 234).
In Lovina, scan sampling (based on Altmann 1974) was used to provide a systematic
standardised snapshot of the activities of boats and cetaceans to understand the fleet‟s
behaviours when a cetacean(s) was sighted. Sampling started whenever at least one
cetacean was sighted and there was at least one boat responding to the animal(s). The
data were typically recorded over a period of up to two minutes (referred to as a „scan
effort‟). However, in the rare cases where the dolphin school stayed on the surface for
more than two minutes (6.9% or 12 out of 175 efforts), data were recorded until the
cetacean(s) disappeared or the boat(s) changed their behaviours. The first data
collected in the morning were usually via scan sampling. However, when no
cetaceans were sighted in the first 30 min after our boat departed from the beach, a
focal boat follow (see the next section below) was initiated.
Data collected for scan sampling included: 1) coordinates of the research vessel; 2)
time a scan started and ended (real time of cetacean presence on the surface, to the
nearest second); 3) encounter fleet size (maximum 150 m radius); 4) cetacean species;
5) the number of animals in each cetacean school; 6) the number of calves in each
school; 7) the behaviour of the cetaceans (Table 3.1); 8) the behaviours of the five
closest boats (Table 3.2); 9) the distances between each of the five closest boats and
the cetaceans; 10) the identity of the five closest boats; and 11) the number of
observed boats adjacent to the focal school (excluding encounter fleet size). A calf
was defined as an animal „2/3 or less the length of an adult, regularly accompanying a
larger animal presumed to be the mother‟ (Karczmarski et al. 2005). Newborn calves
Page 79
Chapter 3 The dynamics of the boats and the cetaceans
57
(1/2 or less the length of an adult animal, Karczmarski et al. 2005) were included in
this definition.
As presented in Table 3.1, behavioural data were divided into states (with measurable
duration) or events (instantaneous behaviours). Only two behaviours in Table 3.1
were considered events (aerial and swimming underneath boat; the latter only applied
in the southern waters of Bali, the result of which were not presented here).
Traditionally, researchers record the duration of any behavioural state and the
frequency of any behavioural event (Altmann 1974; Mann 1999). However, for the
purpose of this research, I only recorded the categories of the cetacean behavioural
states or events, instead of their duration or frequency.
Distances were estimated using the span of the boat‟s two outriggers (5 m) or boat
length (10 m) as the standard. If two encounters occurred simultaneously, my team
and I also recorded the distance of the second encounter from the research vessel, the
number of tourist boats and the number of cetaceans detected. The research vessel
typically remained stationary with its engine off during scan sampling, unless the sea
state was above Beaufort 3 (very rare occurrence).
Focal boat follow
This sampling protocol provided descriptive information on the spatial distribution of
the vessels and dolphins and was designed to enable within effect comparisons
(Figure 3.1). A focal follow protocol is usually conducted (Mann 1999) when a
researcher wants to examine the behavioural changes of the focal animal (or a group
of animals) during a course of observation (e.g., Lusseau (2003), Nowacek et al.
Page 80
Chapter 3 The dynamics of the boats and the cetaceans
58
(2001) and Christiansen et al. (2010)). However, as previously mentioned, tour boat
traffic in Lovina hampered attempts to conduct focal animal follows because I often
could not determine if the composition of a group of cetaceans remained constant. In
the face of such constraints, Bejder and Samuels (2003) suggested that the source of
the disturbance (in this case the tour boats) should be the object of the focal follow
rather than the disturbance target. I followed their recommendation.
Focal boat follows, which were typically conducted after a scan sampling, were
implemented to quantify the behaviour of a tour boat over a fixed period of time (5
min), irrespective of the presence of the cetacean(s). During the focal follow, my team
and I followed a tour boat for five minutes. The focal vessel was chosen by assigning
random numbers to the boats closest to the research vessel. My team and I then picked
a random number from a list and observed the relevant boat. My team and I recorded
all of the boat‟s activities in the order of occurrence (sequence sampling) over each
minute. A five-minute focal follow was referred to as an „effort‟. Each effort was
divided into five „sequences‟, each lasting one minute to facilitate data collection as
the situation was dynamic .
Each time a cetacean was detected within 150 m of the focal boat, I recorded that
sequence as „positive‟ and recorded most of the data listed for scan sampling (see
previous section) with the exception of the distance, behaviour and identity of the five
closest boats and the real time of cetacean presence on the surface. In addition, I
recorded the behaviour of the focal boat and its distance to the nearest cetacean.
Current direction and sea state were not usually recorded during a focal follow, unless
Page 81
Chapter 3 The dynamics of the boats and the cetaceans
59
the weather changed suddenly. The observation was cancelled if the focal boat
returned to the beach.
Scans and focal follows were alternated during each day‟s observations. There were
more focal follows than scans if there were few dolphins sighted because scans were
only conducted when there was at least one cetacean and one boat. The scan sampling
and focal boat follows were conducted until the last observable tourist jukung returned
to the beach. The scan sampling and focal boat follows were conducted over a total of
39 days (over 14 weeks) in 2008 and 2009.
Opportunistic recording of boatmen’s tracks
This sampling type provided descriptive information and spatial information on the
paths of the tourist jukungs (Figure 3.1). To understand the searching patterns and
length of encounter of the tourist vessels, I provided 15 boatmen with a GPS, each for
one (different) day in the High Season of 2008. However, the boatmen became
concerned that this research was aimed at shutting down their industry. Several
months of constant interactions were required before the boatmen again accepted the
benign nature of this research, i.e., our goal was not to terminate the industry. I chose
to discontinue asking the boatmen to use GPS tracking during this time.
I compared the boatmen‟s tracks with the tracks of the research vessel, which always
attempted to follow the majority of tour boats to confirm whether the boatmen‟s High
Season tracks were representative of the fleet. The tracks of the research vessel from
both seasons were used (21 days in High Season and 15 days in Low Season) as an
index of the boatmen‟s search behaviour during the low visitation months.
Page 82
Chapter 3 The dynamics of the boats and the cetaceans
60
To better estimate the encounter time in a typical dolphin tour day, I analysed the
tracks of 14 boatmen in 2008 (one track was excluded due to an incomplete data log).
The dolphin encounter time of each boat was estimated based on the path shape: a
tangled, bundled or circular path was considered to be indicative of an encounter. I
calculated the initial searching time for each tracked boat, i.e., the elapsed time
between departure and the point where the tracks indicated the first dolphin encounter
occurred.
Ad libitum
This sampling type provided descriptive information on the spatial distribution of
vessels and cetaceans and qualitative information on the behaviour of the fleet (Figure
3.1). Ad libitum data collection (Mann 1999) was conducted as a part of the
reconnaissance visit (November 2007 to January 2008) and throughout the survey
periods (June-September 2008, February-April 2009 and April 2010). The data
collected included encounter fleet size. The maximum encounter fleet size per day
estimated from the ad libitum data was then combined with data from other methods
to estimate the daily fleet size. Ad libitum data collection of the boatmen‟s behaviour
while searching for the dolphins was also conducted. These data enabled me to
interpret the behaviour of the focal vessels.
Page 83
Chapter 3 The dynamics of the boats and the cetaceans
61
3.2.2 Data analysis
Statistics
Independent samples t-tests, nonparametric tests for independent samples,
nonparametric median tests, linear regression, cross tabulation and general log linear
analyses were used to examine the behaviour of tour boats and cetaceans (Zar 1999;
Field 2009). Seasonal differences were checked but if the differences were not
significant, I combined the data across seasons. I used Pearson Chi Square for testing
the homogeneity of large samples of count data and Fisher‟s exact test for small
samples of count data (maximum 30) (Field 2009). IBM SPSS version 19 was used to
generate the statistical results.
Analyses in this chapter used several sampling units. Most analyses of the encounters
between vessels and dolphins were taken from scan samplings and focal boat follows
that were not independent within days. To avoid pseudo-replication, measures of
central tendency per day (mean or median) or data from the first sightings of the day
were used whenever appropriate. In analysing whether the approach distances of the
five closest boats to the cetaceans conformed to the Australian standard (see the next
section after the ArcGIS section), only data from boats that were moving around were
used, as opposed to data from stationary boats. The nature of each sampling unit is
reported in the statistical results.
To simplify some analyses, I conducted a post-hoc categorisation of the behaviours of
the target cetaceans when analysing the cetacean behaviours in the presence and
absence of the tour boats: undisturbed (i.e., spinning, milling, travelling slower than 3
Page 84
Chapter 3 The dynamics of the boats and the cetaceans
62
km or feeding) and avoidance (travel, fast travel or diving) (based on Constantine
2001; Williams et al. 2002; Schaffar et al. 2009).
ArcGIS
I quantified the search area of individual boatmen using the GPS tracks (Garmin Etrex
Vista) collected in the High Season (see Section 2.1.5). Kernel density estimation was
used to quantify the maximum search area (Spencer & Angeles 2007). Fixed kernel
density estimation with percent volume contour was used to calculate the density
probability of the core activity areas (Worton 1989; Sveegaard et al. 2011). Projection
UTM Zone 50S for Indonesia 1974 was used to produce the maps.
Kernel density estimation quantifies the spatial distribution of a population or feature
using the geographic centre, distance from the centre and a density distribution
(Spencer & Angeles 2007). I used a 500 m kernel size (radial distance from the
population centre) in the fixed kernel density estimation tool of the Spatial Analyst
extension of ArcGIS 9.3.1 because 500m was the maximum distance over which it is
possible for a boatman to reliably identify the presence of a cetacean. I used the fixed
kernel density estimation with percent volume contour and a 10 m grid size (Worton
1989; Sveegaard et al. 2011) in Hawth‟s Analysis Tool 3.27 in ArcGIS 9.3.1 to
calculate the density probability of the boatmen‟s search area.
A smoothing factor (h statistic) is important in fixed kernel density estimation
because it „controls the amount of variation in each component of the estimate‟
(Worton 1989, p. 165). The h value is uniform in the fixed kernel method. A smaller h
value enables the observation of more detailed data and the finer shapes of volume
Page 85
Chapter 3 The dynamics of the boats and the cetaceans
63
contour. Two methods are available for calculating the h statistic: href estimate and
least-squares cross validation (Worton 1989). The appropriate method is case-specific
and is ultimately determined by „expert knowledge and careful inspection of the
resulting kernel density estimate‟ (Beyer 2004; see also Sveegaard et al. 2011). The
results of several smoothing factor scenarios (250, 500 and 1,000) were visually
compared with the result of the kernel density estimation from Spatial Analyst. I
decided to use the 250 smoothing factor to achieve a detailed percent volume contour
similar to the 500m kernel size produced by the Spatial Analyst tool.
The percent volume contour in fixed kernel density estimation provides several
density probabilities (Sveegaard et al. 2011) and enables the calculation of individual
boatmen‟s and the researcher‟s general searching areas, core searching areas and
possible encounter areas. I defined the core search areas as within 50% volume
contour (i.e., half of the boatmen's track points) based on visual inspection of the
original track points.
Comparison with international best practices
I compared the Lovina situation as revealed by scan sampling with accepted
international best practice using the Australian standard which accords with 75% of
the international standards on dolphin watching tourism (Carlson 2010). The
Australian standard bans all vessels from a No Approach Zone, defined as the zone
within 50 m in front of, parallel to or behind a school of cetaceans. The regulation
permits up to three boats in the Caution Zone, defined as the zone within 50 to 150 m
from the dolphin school (Figure 3.3). I grouped the boats into those with and without
„behaviours of concern‟, or those that interfered with the animals‟ activities or did not
Page 86
Chapter 3 The dynamics of the boats and the cetaceans
64
interfere with the animals‟ activities (sensu the Australian National Guidelines for
Whale and Dolphin Watching 2005 in Carlson 2010). A boat exhibiting „behaviours
of concern‟ was one that sped towards the school, cut through or blocked the animals‟
line of travel within 150 m from the cetaceans. Boats that followed the animals from
behind were not included in the analysis of „behaviours of concern‟ because of the
difficulties in measuring the angles between the animals and the boats.
Figure 3.3 The Australian national guidelines for dolphin watching used to analyse
dolphin watching off Lovina (Carlson 2010)
3.3. Results
3.3.1 Dolphin watching off Lovina
The target cetaceans and their behaviour
Eight species of cetaceans were recorded off Lovina over 108 survey days between
November 2007 and April 2010 using scan sampling, focal follows, line and point
surveys and ad libitum observations. The species observed were: Stenella longirostris
Page 87
Chapter 3 The dynamics of the boats and the cetaceans
65
(spinner dolphins; dwarf S.l. roseiventris and Hawaiian S.l. longirostris subspecies),
Grampus grisseus (Risso‟s dolphins), Lagenodelphis hosei (Fraser‟s dolphins),
Stenella attenuata (Pan-tropical spotted dolphins), Tursiops truncatus (common
bottlenose dolphins), Globicephala macrorhynchus (short-finned pilot whales),
Balaenoptera edeni (Bryde‟s whales) and Pseudorca crassidens (false killer whales).
Figures 3.4a and 3.4b illustrate both subspecies of the spinner dolphins off Lovina.
My team and I followed the tour boats on 61 days using scan sampling, focal follows
and ad libitum methods. The boatmen found cetaceans on 58 out of 61 days (95%).
Dwarf spinner dolphins were the most commonly sighted species; they were observed
on more than 91% of the High Season days and 81% of the Low Season days (Table
3.3). There were no significant seasonal difference in the likelihood of spinner
dolphin encounters; spinners were always the main species sighted (Pearson Chi
Square p=0.140, n = 61 days). I concluded that the dwarf spinner dolphins were likely
to be resident in the area in contrast to the other cetaceans sighted (Table 3.3).
Page 88
Chapter 3 The dynamics of the boats and the cetaceans
66
Figure 3.4 (a) A dwarf spinner dolphin (Stenella longirostris roseiventris) in Lovina.
No scalable item is available in this picture. However, in the ocean the adult version
this species is small (often less than 2m). (b) The Hawaiian subspecies (Stenella
longirostris longirostris) that is found offshore of Lovina (photo courtesy of an
unidentified tourist by way of Mr Made Rudita).
A school of dwarf spinner dolphins comprised an average of 10.2 animals (se+1.36;
scan sampling with no significant seasonal difference in group size at α 0.05 (Mann-
Whitney two-tailed independent test p=0.073, n1 = 16 days, n2 = 14 days, Table 3.4).
About 40% of the spinner schools observed included at least one mother and calf pair
(n = 213 schools, 95% confidence interval 34.1% to 47.58%, se+0.03).
Page 89
Chapter 3 The dynamics of the boats and the cetaceans
67
Table 3.3 The likelihood of encountering a cetacean species off Lovina on any given
day in the High and Low Tourist Seasons
Species (n day) High Season Low Season
Dwarf spinners 91.7% (22) 81.1% (30)
Cetaceans other than dwarf spinners 8.3% (2) 10.8% (4)
More than one species simultaneously 0% (0) 0% (0)
No encounter 0% (0) 8.1% (3)
Total 100% (24) 100% (37)
The line and point surveys indicated that the cetaceans were usually found with tour
boats (75%) in locations in front of or slightly northeast of the main ports (Figure 3.2),
possibly because these locations were closer to the ports and more accessible to the
tour boats. Cetaceans were more frequently sighted without tour vessels in locations
westward of the main ports (84.6% of 13 points where the cetaceans were seen
without boats).
When first sighted in the morning with scan sampling, 77.8% of the dwarf spinners
were travelling while the remainder were either conducting aerial behaviours (i.e.,
spinning, 11.1%), diving (5.6%) or bow-riding (5.6%). Subsequent scan samplings
suggested that the spinner dolphins surfaced for an average of 1.7min (se+0.11)
without significant seasonal difference (Mann-Whitney two-tailed independent test
p=0.835, n1 = 16 days, n2 = 14 days, Table 3.4).
The behaviour of the tour fleet
As described in Chapter 2 (Section 2.1), the fleet was based at four beach locations or
„ports‟ (each managed by a dolphin association). The „ports‟ were spaced at 500 m to
1 km intervals along a 3km beach strip. In April 2010, the total fleet size was 179. My
team and I recorded the daily fleet size over seven months from 2007 to 2009 with
Page 90
Chapter 3 The dynamics of the boats and the cetaceans
68
scan sampling, focal follows and ad libitum sampling. The counts of daily fleet size
were weighted to account for the different fleet sizes between weekends and
weekdays. The weighted average daily fleet size across the entire survey period was
34.5 vessels (se+6.29, n = 57 days, Table 3.4) or 19% of the total fleet size. The
maximum daily fleet size was 98; these data were obtained in the High Season. In the
High Season, the average daily fleet size was 49.8 vessels (se+4.56, range 23-98),
significantly larger than in the Low Season 26.1 vessels (se+2.95, range 4-73) (two-
tailed independent sample T-test p<0.0005, df=55).
The ad libitum data indicated that most vessels left their home ports at first light,
around 6am Bali time (GMT +8:00). The scan samplings, focal follows and ad libitum
data showed that the observed number of boats sighted at first light averaged ~24
(se+2.56, range 2-53, n = 32 days, Table 3.4) with no significant seasonal difference
(independent sample t-test p=0.961, df=30). The boatmen usually scanned the horizon
with their naked eyes to locate dolphins. They also used clues such as birds (feeding
dolphins are usually found in association with birds), jumping fish or camera flashes
from passengers in the front boats. As the morning progressed, the boatmen kept a
close watch on the behaviour of other groups of tour boats. The boatmen behaved
differently when they were searching for the dolphins compared with when they were
actually watching the dolphins (see also Chapter 6 Section 6.3.1). When a group of
boats was watching dolphins, they would either move around or make zig-zag
movements. While searching, the boats moved straight ahead as a group usually in
parallel formation.
Page 91
Chapter 3 The dynamics of the boats and the cetaceans
69
Table 3.4 Summary statistics of the cetaceans and the tour fleet off Lovina
Information Sampling type Result Statistics Sampling
unit
Dwarf spinner dolphin‟s group size
Scan sampling About 10 animals per group Mean 10.2 animals, se+1.36, n=30 Day
Dwarf spinner dolphin‟s surface time
Scan sampling Less than two minutes Mean 1.7min, se+0.11, n=30 Day
Daily fleet size Ad libitum, scan sampling,
focal boat follow
Almost 35 boats Weighted mean 34.5, se+6.29, n =57 Day
Observed number of boats at first
light
Ad libitum, scan sampling,
focal boat follow
About 24 boats Mean 24.2 boats, se+2.56, n=32 Day
Boatmen‟s initial searching time
(High Season only)
GPS track About half an hour Mean 34 min, se+ 4 min 54sec, n =14 Day
Behaviour of tour boats when the
cetaceans surfaced
Focal boat follow Steadily approaching the animals Pearson Chi Square two-tailed test
p=0.009, n1 = 14 efforts, n2 = 63 efforts
Effort
Daily cumulative encounter time
GPS track Almost 40min (conservative scenario) Mean 37min 49 sec (se+ 4min 1sec, n =14) Day
Association between the daily
cumulative encounter time and the
number of encounters per day
GPS track Significant; short encounters triggered
the boatmen to have more encounters
Linear regression of conservative data,
p=0.013, df=13, Pearson correlation
coefficient = -0.646, R2=41.7%)
Day
Observed fleet size Scan sampling More boats observed during High Season
as opposed to Low Season
High Season mean=27, se+3.26, n =22
Low Season mean=18.6, se+3.82, n=15
Mann-Whitney independent sample test
p=0.029, n1=22 days, n2=15 days
Day
Association between dwarf spinner
dolphin‟s surface time, encounter
fleet size and school size
Scan sampling School size was the only variable
associated with surface time
Linear regression R2=27.7%, one tailed
p=0.003, df=29
Day
Page 92
Chapter 3 The dynamics of the boats and the cetaceans
70
A
B
Page 93
Chapter 3 The dynamics of the boats and the cetaceans
71
Figure 3.5 The spatial activity pattern of: (a) 15 tourist vessels in High Season 2008;
(b) the research vessel on 21 days in High Season 2008; (c) the research vessel on 15
days in Low Season 2009
The High Season GPS tracks of the boatmen suggested that the boatmen searched for
the dolphins from Tukad Mungga in the east to Pengastulan in the west (Figure 3.5a),
a core searching and encounter area of 4.4 km2 (Banyualit to Temukus village). The
combined search and encounter area (95% contour) was 19.7 km2, from Tukad
Mungga (in the east) to Seririt (in the west).
In the High Season, the search area of the research vessel was similar to that of the
boatmen (Figure 3.5 a-b: core area 5.04 km2;
95% contour for search and encounter
area 27.61 km2;
scan sampling and focal follow data). The search pattern of the
research vessel indicated that the fleet behaved differently in the Low Season (Figure
C
Page 94
Chapter 3 The dynamics of the boats and the cetaceans
72
3.5c). The core searching area was larger (9.08 km2) and was distributed over several
locations; the 95% contour extended westward to Pengastulan (39.68 km2).
We used the GPS tracks, the scan sampling, focal follows and ad libitum data to
estimate the search time before the first cetaceans were sighted. The GPS tracks
suggested that a tour boat travelled and searched for about half an hour before finding
its first cetaceans for the day (mean 34 min, se+ 4 min 54sec, n = 14 days, Table 3.4).
This result is confirmed by our independent observations. In the High Season, the
research vessel took an average of 32 min from first light to find its first dolphins
(se+2.5 min, n days=21). This figure is significantly shorter than the initial searching
time in the Low Season (mean 43.5 min, se+3.6 min, n = 15 days, Mann-Whitney
two-tailed test p=0.013, n1=21 days, n2=15 days).
The behaviour of the tour boats changed when the cetaceans surfaced within 150 m of
the boats and this response depended on whether a boat was moving or stationary
(Pearson Chi Square two-tailed test p=0.009, n1 = 14 efforts, n2 = 63 efforts; focal
boat follow data, Table 3.4). When the boats were actively searching for cetaceans,
the boatmen approached the animals steadily rather than rapidly (odds ratio 6.4).
However, when the boatmen scanned for cetaceans from a stationary boat, they were
equally likely to remain stationary or approach the animals. No stationary boats were
observed to respond with „behaviours of concern‟ when they detected the animals.
The daily cumulative encounter time between a tour boat and the cetaceans was
estimated using two interpretations of the GPS tracks. In the conservative scenario,
only extremely tangled GPS tracks were interpreted as encounters; the liberal scenario
Page 95
Chapter 3 The dynamics of the boats and the cetaceans
73
also included moderately tangled tracks (see Section 2.1.5). The conservative scenario
suggested a median daily cumulative encounter time of 37min 49 sec (se+ 4min 1sec,
range 10 min 4sec – 1 hour 7.5 min, n = 14 days, Table 3.4); the corresponding figure
for the liberal scenario was 55min 45 sec (se+4min 7sec, range 31min 4sec – 1 hour
20.3min, n = 14 days).
I found a strong, significant association between the daily cumulative encounter time
and the number of encounters a boat experienced per day for both scenarios
(regression of conservative data, p=0.013, df=13, Pearson correlation coefficient = -
0.646, R2=41.7%; regression of liberal data p=.03, df=13, Pearson correlation
coefficient = -0.58, R2=33.7%). A boatman who achieved only short encounters
clearly attempted to obtain more encounters to please his tourists (Table 3.4). Tourists
who experienced only one or two encounters spent 15 to 35 min with the dolphins.
Encounters between the boats and the cetaceans
Only 11 groups of cetaceans (45% were dwarf spinner dolphins) were sighted over
30.8 hours of line transect surveys over 11 days; six schools were sighted between
6am - 8am (Figure 3.2). Only 16 cetacean schools were located during almost 145
hours of point surveys over 36 days in the Low Seasons of 2009 and 2010 between 6
am and 8 am. A total of 43.5% of these schools (7/16) were within 150 m of tour
vessels (Figure 3.2). The combined data from line transects and point surveys
indicated that a minimum of 44.4% of cetacean schools off Lovina were encountered
by tour boats before 8am (binomial confidence interval 21.01% to 67.87%, also check
Figure 3.2). These results suggest that a high proportion of the cetaceans in the survey
region were involved in encounters with tourist vessels over a maximum of two
hours‟ tour time each day.
Page 96
Chapter 3 The dynamics of the boats and the cetaceans
74
Sixteen schools of dwarf spinner dolphins were seen during the point surveys; 11
without tour boats. Eight of these schools appeared undisturbed while three schools
demonstrated avoidance behaviours (Figure 3.6, also see Section 3.2.2 for the post-
hoc categorising). Five schools were sighted in the presence of tour boats; of these,
three displayed avoidance behaviours; the remainder appeared undisturbed. No
significant difference was detected between the behaviours of dolphins in the presence
of tour boats and without tour boats (two-tailed Fisher‟s exact test p=0.299, n1 = 10
points, n2 = 6 points), but the sample size was small.
Figure 3.6 Dolphin behaviours in relation to the presence of tour boats during the
point surveys for dolphins conducted in 2009-2010 from 6am to 10am (n1 = 10 points,
n2 = 6 points, undisturbed=spinning, milling, travelling slower than 3 km or feeding,
avoidance=travel, fast travel or diving)
Page 97
Chapter 3 The dynamics of the boats and the cetaceans
75
A targeted cetacean school was typically surrounded by a large number of tourist
boats, especially in the High Season when the maximum encounter fleet per effort
was on average higher than in the Low Season (83 versus 73 vessels, respectively;
focal boat follow). The median daily encounter fleet size for both seasons was 15.35
(range 2-49, n = 37 days, scan sampling) with no significant difference between
seasons (independent sample median two tailed test p=0.842, n = 37 days). The
observed encounter fleet size was generally higher than the number of dwarf spinner
dolphins per encounter (spinner-to-boat ratio per encounter was 0.81:1). Scan
sampling data suggested that the observed fleet size, i.e., encounter fleet size
combined with the number of boats aggregating in adjacent areas was significantly
greater during the High Season (mean=27, se+3.26, range 10-69, n = 22 days)
compared with the Low Season (mean=18.6, se+3.82, range 2-49, n days=15)(Mann-
Whitney two tailed independent sample test p=0.029, n1=22 days, n2=15 days).
I used stepwise regression to examine the relationship between median surface time
for the dwarf spinners (independent variable), median school size and median
encounter fleet size (dependent variables) based on the scan data. As there was no
significant difference in median surface time between seasons (Mann-Whitney
independent two-tailed p=0.835, n = 30 days), the data from both seasons were
combined for this analysis. The regression identified school size as the only
significant dependent variable (R2=27.7%, one tailed p=0.003, df=29, Table 3.4). This
figure indicates that mean surfacing time was not associated with encounter fleet size
(p=0.101). School size also did not correlate with the encounter fleet size, either for
all cetaceans combined (one tailed p=.916, df=35) or for dwarf spinner dolphins alone
Page 98
Chapter 3 The dynamics of the boats and the cetaceans
76
(one tailed p=0.912, R2=0.000, df=29; scan sampling). Thus, the tour boats seemed to
approach the cetaceans regardless of the number of animals present.
3.3.2 Comparison with Australian standards
The tourist vessels came very close to the cetaceans, especially in the High Season
(Figure 3.7). The median distance of the closest boats was 10 m (range 0-100 m, n
=89 efforts; scan sampling) in the High Season and 30 m (range 5-100 m, n =73
efforts) in the Low Season. There was a significant seasonal difference; the closest
boats were much nearer the dolphins in the High Season (nonparametric median test
two-tailed p<0.0005, n1=89 efforts, n2=73 efforts). Almost 30% of these boats were
stationary; 21.1% of the moving boats exhibited „behaviours of concern‟ (n efforts
=161).
In both seasons, the median of the five closest boats were within the „No Approach
Zone‟ defined by Australian regulations (High Season median 25 m, range 0-125 m, n
= 89 efforts; Low Season median 50 m, range 10-150 m, n = 73 efforts; scan data;
Figure 3.7). The median distance of the five closest boats was significantly closer to
the cetaceans in the High Season than in the Low Season (nonparametric median test
two-tailed p<0.0005, n1=89 efforts, n2=73 efforts).
In the High Season, the furthest of the five closest boats was in the Australian „No
Approach Zone‟ (median 40 m, range 5-150 m, n = 89 efforts; scan data). However,
this situation was different in the Low Season where the furthest of the five closest
boats was not within the „No Approach Zone‟ (median 80 m, range 10-150 m, n
efforts =73) (Figure 3.7). The difference between seasons was significant
Page 99
Chapter 3 The dynamics of the boats and the cetaceans
77
(nonparametric median test two-tailed p<0.0005, n1=89 efforts, n2=73 efforts). Both
these results suggest that the boats tended to approach closer to the dolphins in the
High Season than the Low Season. About 20% of the five closest boats boats were
stationary while 31.1% of the remainder exhibited „behaviours of concern‟ (n efforts
=161).
Figure 3.7 Comparison of the approach distances of the tourist boats off Lovina with
the Australian National Guidelines for Whale and Dolphin Watching 2005. The data
are based on scans of the five tourist vessels closest to cetaceans encountered off
Lovina. (High Season n = 83 efforts, Low Season n =72 efforts)
Most boats mostly engaged in benign behaviours; e.g., approaching (48% of such
behaviours) or following the cetaceans at a speed not greater than the animal‟s speed
(14%). Nonetheless, some of the five closest boats were seen speeding towards the
cetacean school (69.5% of „behaviours of concern‟), cutting through (24.2%) or
blocking the cetacean‟s line of travel (6.3%). Fewer than one out of five closest boats
were seen conducting such behaviours (median=0.8, mean=0.9, se+0.16, n = 36 days).
Page 100
Chapter 3 The dynamics of the boats and the cetaceans
78
No significant difference was detected between seasons (two-tailed Mann-Whitney
independent sample test p=0.188, n = 36 days).
I investigated repeat offenders from the scan data. During 175 scan sampling efforts
over 36 days I identified 64 individual boats that displayed „behaviours of concern‟ at
least once. A total of 37.5% (24) were observed exhibiting „behaviours of concern‟
more than once. One persistent offender exhibited behaviours of concern six times in
six different efforts on four different days. The number of boats that exhibited
„behaviours of concern‟ was positively correlated with encounter fleet size (p=0.001,
df=35, R2=29.1%), suggesting that the drivers were competing with each other to gain
access to the dolphins. Although only the five closest boats were examined, the
sampled boats were observed to display contrasting behaviours. The furthest of five
boats was more likely to display „behaviours of concern‟ compared with the closest
boat (odds ratio 5.4; Pearson Chi-Square p=0.004, df=4, n effort=161).
I examined the data from the scan samplings to see how many boats actively
approached cetaceans in the „No Approach Zone‟ (0-50 m) and „Caution Zone‟ (50-
150 m) of the Australian regulation. Slightly more boats were observed to actively
approach the animals into the „No Approach Zone‟ in the High Season (2.3 boats,
se+0.17, range 0-5, n efforts=97) compared with the Low Season (1.9 boats, se+1.66,
range 0-5, n=78, Mann Whitney Independent sample two-tailed test p=0.071, n1 = 97
efforts, n2 = 78 efforts).
Fewer boats were observed to actively venture into the „Caution Zone‟ in the High
Season (0.3 boats, se+0.06, range 0-3, n = 97 efforts) compared with the Low Season
Page 101
Chapter 3 The dynamics of the boats and the cetaceans
79
(1.4 boats, se+0.16, range 0-5, n = 78 efforts)(Mann Whitney Independent sample
two-tailed test p<0.0005, n1 = 97 efforts, n2 = 78 efforts). Less than one in five boats
was observed to engage in „behaviours of concern‟ in the „No Approach Zone‟ (mean
0.6, se+0.07, range 0-4, n = 175 efforts). No significant differences were detected
between seasons (Mann Whitney independent sample two-tailed test p=0.687, n = 175
efforts). These data are underestimates as they were based on the five closest boats
only.
The median encounter fleet size at Lovina was about 15, which makes the observed
number of boats (passive and active) in the „Caution Zone‟ about 10. This figure
means that the number of boats in the „Caution Zone‟ in Lovina was at least three
times higher than the Australian standard of three vessels per encounter.
3.4. Discussion
3.4.1 Overview of the industry
With a total fleet size of 179, Lovina may have the second largest dolphin tour boat
fleets in the world, outnumbering Port Stephens in Australia (17 operators, Allen et al.
2007), Taiwan (25 operators in 2008, Chen 2011), the Philippines (30 boats,
Sorongon et al. 2010) and Zanzibar (44 boats, Christiansen et al. 2010). The only
dolphin watching location of which I am aware where the total fleet size outnumbers
Lovina is Chilika Lagoon in India where the total fleet size is ~450 (Sutaria 2009).
With more boats than dolphins per encounter (spinner-to-boat ratio of 0.81:1), Lovina
offered less than what Kizimkazi in Zanzibar offered (dolphin-to-boat ratio of 2.7:1
(Stensland & Berggren 2007; Christiansen et al. 2010)).
Page 102
Chapter 3 The dynamics of the boats and the cetaceans
80
Tourist encounters with offshore cetaceans have occurred off in Lovina for more than
20 years. The scan and focal follow data indicate that in 2008-9 encounters were
typically limited to one hour per day (see Section 3.3.1). Nonetheless during that
hour, the cetaceans were usually hemmed in by 20-30 tourist vessels, and up to almost
100 jukungs could be observed searching for the animals during the High Season.
Although other cetacean species were encountered only occasionally and are likely
transient, dwarf spinner dolphins were encountered almost every day by the tourist
fleet, suggesting that they are resident. The absence of historical data prevents
investigation of whether the cetacean community size or composition off Lovina has
changed since the industry began. Nonetheless, anecdotal information from the
boatmen suggested that more cetacean species were readily found off Lovina in the
early 1990s, before the boatmen replaced their sails with outboard engines.
The fleet of tourist boats operates as a highly effective and co-ordinated dolphin-
searching machine. Dolphins were typically found within half an hour of leaving the
beach in the High Season; in the Low season the initial search took about 11 minutes
longer as the animals tended to be found further west. The estimated 44.4% of dolphin
groups exposed to tour boats each morning is certainly an under-estimate.
Instantaneous point surveys were only conducted for 10 minutes per location; hence
my team and I presumably missed interactions at other unsurveyed points. Encounters
at surveyed points that happened before or after our arrival were also not included.
The statistics on the behaviours and distance of five closest boats to the dolphins are
an index of the overall behaviours of the fleet and indicate that the situation is far
from international best practice: 1) almost all of the five closest boats, particularly in
Page 103
Chapter 3 The dynamics of the boats and the cetaceans
81
the High Season, were observed in the equivalent of the Australian „No Approach
Zone‟; 2) at least one of the five closest boats were observed to display „behaviours of
concern‟; 3) the number of boats in the equivalent of the „Australian Caution Zone‟
was much higher than the allowable three vessels per encounter in Australia; and 4)
about 20-30% of the farthest of the five boats at Lovina were likely to display
„behaviours of concern‟ upon detecting the cetaceans. Collectively, these observations
raise concern about the likely impacts on the dolphins and hence on the biological
sustainability of the Lovina dolphin watching industry.
As outlined below, the situation at Lovina also fails to accord with the voluntary
guidelines for cetacean watching tourism adopted both in the Philippines and
Tanzania. Traditional boats with similar dimensions and style to those used at Lovina
are also used for dolphin watching tourism targeting spinner dolphin (Stenella
longirostris) in Balicasag and Pamilacan Islands in Bohol in the Philippines
(Sorongon et al. 2010) and the Indo-Pacific bottlenose dolphin (Tursiops aduncus) in
Kizimkazi, Zanzibar (Tanzania, Stensland & Berggren 2007; Christiansen et al.
2010).
3.4.2 Is dolphin watching at Lovina biologically sustainable?
I examined international studies to investigate the likely consequences of the situation
I had found at Lovina. Constantine et al. (2004) studied common bottlenose dolphins
(Tursiops truncatus) in the Bay of Islands in New Zealand. Significantly reduced
resting time was associated with exposure to four or more vessels, or less than 17% of
the average encounter fleet size at Lovina, even in the Low Season. Coincidentally,
three was also the maximum number of vessels around a school of cetaceans endorsed
Page 104
Chapter 3 The dynamics of the boats and the cetaceans
82
by New Zealand‟s Marine Mammal Protection Regulations in 1992 (Carlson 2010).
The regulation also endorses a minimum approach distance of 50 m, which was also
not practised in Lovina.
The voluntary guidelines at Bohol in the Philippines recommend an encounter fleet
size of four and a minimum approach distance of 50 m (the average approach distance
was 26.6 m). The average observed encounter fleet size was seven (range 1-16), less
than half that at Lovina; the total fleet size at Bohol was 30 (Sorongon et al. 2010).
Sorongon et al. (2010) found that a higher encounter fleet size generated undesirable
boat behaviour at Bohol, such as a direct approach towards the animals, even though
the guidelines recommended a parallel approach or following the dolphins from
behind the school. However, most boats approached the cetaceans directly or blocked
their path and waited in front of the animals. This result confirms my findings that a
high encounter fleet size was associated with more boats displaying „behaviours of
concern‟ that interfered with the dolphins (Section 3.3.2).
In 1998, a dolphin watching guideline for Zanzibar was proposed to place a limit of
maximum of two boats per school of bottlenose dolphins for a maximum 30 min
encounter (Stensland & Berggren 2007; Carlson 2010); the guideline was silent on
minimum approach distances. Surveys indicated that violations of the guidelines and
increased tourism activities resulted in the dolphins spending more time travelling and
less time resting, foraging and socialising (Stensland & Berggren 2007; Christiansen
et al. 2010). Female bottlenose dolphins in Zanzibar travelled more when the
encounter fleet size exceeded two boats per dolphin school (Stensland & Berggren
2007). This finding suggested that two boats per encounter was the tolerable level for
Page 105
Chapter 3 The dynamics of the boats and the cetaceans
83
that dolphin population and that travelling was a response to disturbance from the
tourist boasts. The Zanzibar results provide a possible explanation for the constant
travelling (and lack of resting behaviour) of the dwarf spinner dolphins off Lovina.
No evidence was found that the large encounter fleet size at Lovina influenced the
surface time of the dwarf spinner dolphin‟s school. The number of boats in Bohol was
also not correlated with the dolphin surface times (mean 2.2min, se+0.202, n=175,
correlation coefficient= -0.16; p=0.94, df=174; Sorongon et al. 2010). I found no
other literature to support an alternative hypothetical explanation of the short
surfacing time of the dwarf spinner dolphins off Lovina. However, because I could
not measure the dwarf spinner‟s diving time at Lovina, I suggest that surface time is
retained as a variable to measure in future research, coupled with improved sample
size.
Dwarf spinner dolphins were encountered almost every day on the waters off Lovina,
suggesting that it is possible that they belong to a resident population. This hypothesis
needs to be confirmed with rigorous photo-identification and mark-recapture surveys
(Wursig & Jefferson 1990). If these animals are resident then the data suggest that
local dwarf spinner dolphins are constantly exposed to tourism activities, with likely
negative impacts on behaviours or the dynamics of this population (Shirakihara et al.
2002; Berghan et al. 2008). Other cetacean species were not frequently encountered
off Lovina, which suggested that they were transients and that cumulative impact of
dolphin tourism might be less.
Page 106
Chapter 3 The dynamics of the boats and the cetaceans
84
I am not yet able to come to a definitive conclusion about the biological sustainability
of dolphin watching tourism in Lovina. However, comparisons with the studies
summarised above suggests that the large encounter fleet size, short approach
distances and high incidence of boats showing „behaviours of concern‟ may contribute
to the high levels of travelling of the dwarf spinner dolphins off Lovina and thus are
of potential concern.
3.4.3 Are the dwarf spinners at Lovina habituated to vessels?
Data on sighting frequency suggest that the dwarf spinner dolphins in Lovina belong
to a resident population which, according to previous studies (Shirakihara et al. 2002;
Berghan et al. 2008), is likely to experience more impacts from tourism activities than
a transient species or population. I failed to detect any significant correlation between
tour boats and short term responses (i.e., the surface time and behaviours of the dwarf
spinner dolphins). I acknowledge that this result might indeed reflect the absence of
an effect. However, the lack of significant correlation between an anthropogenic
activity and cetacean responses does not warrant an assumption that the animals are
not disturbed (Bejder et al. 1999; Bejder & Samuels 2003). The encounter fleet size in
Lovina may have reached saturation point, beyond which daily fleet size has no
obvious effect on dolphin travel path, as was hypothesized for killer whales in
southern British Columbia (Williams & Ashe 2007).
Unfortunately, changes in the travel trajectories of a particular dolphin school, which
might have provided an association with encounter fleet size, were not thoroughly
recorded during boat surveys. Dolphin travel trajectories were only recorded during
scan sampling, which was designed to focus on the boats rather than the dolphins. I
Page 107
Chapter 3 The dynamics of the boats and the cetaceans
85
could not analyse the association between the travel trajectory of a dolphin school
with the trajectory of the dolphins in the previous school because I was focusing on
the boats instead of following the dolphins.
In addition, the topography of Lovina did not provide the option of using a point look-
out to examine possible change of travel direction of the dolphins during the
encounters (see Williams & Ashe 2007); an approach that could potentially provide
important additional insights on possible effects of encounter fleet size on the local
dolphin population.
Another explanation for the observed lack of a significant correlation between
encounter fleet size and the surface time of the dwarf spinner school is that the Lovina
dwarf spinner dolphins have been habituated by repeated contacts with the local
tourism industry (see Watkins 1986). Timmel et al. (2008) demonstrated possible
habituation of Hawaiian spinner dolphins (Stenella longirostris longirostris) to
swimmers and vessels. Habituation was also suggested for several species of great
whales that came into contact with anthropogenic activities off Cape Cod (Watkins
1986) and for killer whales that were encountered by tour boats in northern British
Columbia (Williams et al. 2002). Cultural transmission may be part of this habituation
(see Harwood et al. 1996; Krutzen et al. 2005). The dwarf spinner dolphins in Lovina
may possibly have been taught by their mothers to use the waters off Lovina and not
to search for potential replacement sites despite changes in anthropogenic activities.
Should a habituated population be excluded from conservation efforts? Traditionally,
habituated species were thought to be relatively immune to anthropogenic activities
Page 108
Chapter 3 The dynamics of the boats and the cetaceans
86
(Gill et al. 2001). However, Gill et al. (2001) also argued that habituated species
might not be the fittest of all. Instead, these species might adapt and continue living in
a region simply because they have nowhere else to go, or are unaware of alternative
places (due to matrilineal learning). Without suitable replacement habitat (or the
knowledge thereof), a target population may choose to remain in a disturbance region,
even if doing so reduces their reproductive rate or survival.
In this case, the dwarf spinner dolphins might be the most vulnerable of the local
cetacean species off Lovina. Their continued exposure to dolphin watching activities
might have altered their behaviours before the commencement of our study. What we
see now might be the unmeasurable cumulative impact of long-term exposure.
Chapter summary
Up to almost 100 tour boats search for dolphins each morning.
A group of dolphins can be surrounded by an average of 15 boats, while 18 to
27 vessels could be observed at any given time.
More boats than dolphins were observed in an encounter (spinner-to-boat ratio
0.81:1).
Dolphins typically surfaced for only two minutes and were usually observed
travelling during first sightings.
Two out of five closest boats per encounter were observed to approach the
cetaceans closer than 50 m; one of them exhibiting „behaviours of concern‟
(n=175), such as speeding towards the school, cutting through the schools or
Page 109
Chapter 3 The dynamics of the boats and the cetaceans
87
blocking the animals‟ line of travel.
The number of boats in the Caution Zone (50-150 m; sensu the Australian
regulation) in Lovina was at least three times higher than the Australian
standard of three vessels per encounter.
The Lovina encounter fleet size was also at least five times larger than the
number of boats that precluded the dolphins‟ resting behaviours in New
Zealand and Tanzania (three and two boats, respectively).
Although the analyses failed to find significant association between encounter
fleet size and the surface time of the dwarf spinner school, other indications
suggest that the biological sustainability of this industry is questionable.
Page 111
89
CHAPTER 4 THE TOURIST EXPERIENCE
This chapter is in review in the Journal of Sustainable Tourism as follows: “Mustika,
PLK, Birtles, A., Everingham, Y. and Marsh, M.. The need for increased research on
the human dimensions of wildlife tourism in developing countries: dolphin watching
in Lovina as a case study”
Chapter 3 quantified the dynamics between the tour boats and the cetaceans and the
potential problems the boats might pose to the animals. But were the tourists aware of
these problems? What did they think about the dolphin watching industry in general?
In this chapter, I describe the experience of tourists who attended the dolphin tours in
Lovina, including their satisfaction levels, most liked and disliked aspects of the tour
and their management suggestions. This chapter covers the one of the social elements
of this industry based on the quadruple bottom line and the prism of sustainability
concepts.
Page 112
Chapter 4 The tourist experience
90
4.1 Introduction
The level of tourist satisfaction is often considered an index of the service level of a
tourist attraction and the likelihood of tourists returning or recommending a site to
others (Ryan 1998; Kozak & Rimmington 2000; Turner et al. 2001; Akama & Kieti
2003). By extension, tourist satisfaction is also an indicator of social, economic and
managerial sustainability. Other such indicators include visitor expectations, the most
liked and disliked aspects of the experience and the general opinions and comments of
tourists (Kazmierow et al. 2000; Birtles et al. 2002a; Higham & Carr 2003; Valentine
et al. 2004). Satisfaction is a post-purchase attitude that can provide an evaluation of
the purchased product (Pearce 2006). Visitor satisfaction is not a one-dimensional
indicator. It is influenced by many variables (Ryan 1998; Orams 2000), including
gender (Ryan & Harvey 2000; Musa 2002), education level (Hughes 2001; Reynolds
& Braithwaite 2001), environmental conditions (e.g., weather and sea state in the case
of whale watching (Birtles et al. 2002a)); emotional connection and comfort (Okello
& Yerian 2009), and over-crowding (Orams 2000; Birtles et al. 2002a; Musa 2002).
Visitor nationality also influences satisfaction (Pizam & Sussmann 1995; Akama
1996; Choi & Chu 2000; Kozak 2001; Turner et al. 2001). However, the basis of the
satisfaction levels of wildlife visitors of different nationalities or ethnic groups (e.g.,
Western visitors versus Asian visitors) is poorly understood. The cetacean watching
industry often attracts international travellers as well as local tourists (Hoyt 2001;
O'Connor et al. 2009; Sutaria 2009). However, only limited data exist on the
composition of the ethnic mix of cetacean watching tourists or on the demography,
experience and satisfaction of tourists participating in cetacean watching tourism,
Page 113
Chapter 4 The tourist experience
91
particularly in developing countries that have experienced an increased interest in the
industry (Hoyt 2001; O'Connor et al. 2009, also see Chapter 1).
Although the tourists are not locals (see the definition of a tourist at the beginning of
Chapter 1), their concerns must be taken into account because they are also part of the
stakeholders involved in this industry. In this case, the tourists in Lovina are viewed
as clientele as well as the community that the company (i.e., the dolphin boatmen as a
group) serves. Thus, in this thesis, the tourists are included in the social element
(„people‟, also see Figure 1.3).
Anecdotes from Lovina in north Bali suggested that the local dolphin watching
industry largely catered to Western tourists (defined as tourists coming from Europe,
United States, Canada, Australia or New Zealand (Van Egmond 2007, p. 6)), many of
whom complained about the boatmen chasing the dolphins or being too close to the
animals. Pre-empted by this anecdotal information, in this chapter I aim to: 1)
describe the tourist experience and profile of the dolphin watching industry in Lovina;
and 2) provide information relevant to the industry‟s sustainability. To address these
aims, I investigated: 1) whether the variables contributing to satisfaction levels of
Western tourists were different to those affecting Asian tourists; and 2) whether these
variables could be a catalyst for future management suggestions for dolphin watching
in Lovina.
Page 114
Chapter 4 The tourist experience
92
4.2 Methods
In Chapter 2, I described the general methods used to achieve the overall objectives of
this research project. The following section details the specific methods I used to
understand the experience and satisfaction of dolphin tourists in Lovina.
4.2.1 Data collection
A combination of qualitative and quantitative social research methods was used to
document tourists‟ perceptions of, and satisfaction with, dolphin watching trips in
Lovina. As described in Chapter 2 (Section 2.3), I designed data collection around the
pattern of tourist visitations. The Low Season (i.e., lower number of tourists visiting)
usually lasts from November to May; the High Season from June to October (northern
hemisphere summer holiday). Direct observation from a jukung was used to capture
the qualitative experience of a tourist on a typical dolphin trip in Lovina. In-depth
interviews with tourists were conducted during a preliminary visit from October 2007
through January 2008 (Low Season). Based on the results of the reconnaissance visit,
questionnaires were constructed in English and Indonesian and distributed from June
to September 2008 (High Season) and February-April and December 2009 (Low
Season).
The High Season questionnaire (Appendix 1) comprised 28 questions covering some
demographic information about the respondents; their reasons for going dolphin
watching; details of the trip including the weather conditions, boats and passengers;
the features of the experience that respondents liked the best and disliked the most;
satisfaction level (scales 1-10) and suggestions for improvement. A performance-only
approach was used to measure satisfaction: i.e., I did not include questions about
Page 115
Chapter 4 The tourist experience
93
respondents‟ expectations prior to joining the dolphin trip because people could still
be satisfied despite their expectations not being met (Pearce 2006).
Following preliminary analysis of the initial High Season questionnaire, the
questionnaire was expanded for the Low Season surveys to 34 questions (Appendix
2). Respondents were asked to rank their opinions about several additional features of
their trip including their boat‟s distance from the dolphins („How do you feel about
how close your boat got to the dolphins?‟; 5 level Likert scale), the way the boatman
managed the encounter („How do you feel about the way your boatman managed your
encounter with the dolphins?‟; 5 level Likert scale) and the time spent with the
dolphins („Was the amount of time you spent with the dolphins…‟; 5 level Likert
scale). Each questionnaire took the respondent about 10 to 15 minutes to complete.
My team and I usually administered the questionnaires in Kalibukbuk, the largest of
the four dolphin watching ports (see Chapter 2 Section 2.1). Depending on the number
of tourists, we occasionally moved to other ports. The team was rarely split to cover
two ports on the same day for safety reasons. Most of my team members were young
women who more than once were verbally harassed by young male villagers.
The questionnaires were administered in the morning after the guests returned from
their dolphin trip. In the High Season, my team sometimes encountered difficulties in
soliciting respondents, usually because the tourists were: 1) tired and hungry after the
boat trip and needed to return to their hotels for breakfast; 2) disturbed by the many
souvenir sellers (we usually waited until the beach vendors finished offering their
items to tourists); 3) needed to check out from their hotels; or 4) had other
Page 116
Chapter 4 The tourist experience
94
commitments. In the Low Season, my team asked tourists to take the questionnaires
back to the hotels for us to pick up later. This strategy helped increase the number of
completed questionnaires.
To understand the demography of dolphin tourists in Lovina, my team also conducted
a beach attendance survey to obtain an overview of tourist attendance at the ports
where my team was collecting data. In the High Season, we asked each tourist who
had just completed a dolphin tour about their nationality and year of birth. This
strategy was simplified for the Low Season survey to provide more time for
questionnaire collection; my team simply counted the number of tourists taking the
dolphin trips and recording their gender.
4.2.2 Quantitative data analysis
Descriptive statistics, nonparametric tests (Kruskal-Wallis and Mann-Whitney,
α=0.05), cross tabulation and general log linear analyses (with Pearson Chi Square
test and odds ratio)(Zar 1999) were used to analyse the data (software SPSS 16.0).
Multiple regression trees (De'ath 2002; Faraway 2006) using the software package R
2.10.1, and stepwise regressions (SPSS 16.0) were also used, as summarised in Figure
4.1. In line with other authors, I have assumed that the response variable (i.e.,
respondent‟s satisfaction level) is interval data (Knapp 1990; Clason & Dormody
1994; Choi & Chu 2000; Kozak 2001; Chen et al. 2010).
A three-staged selection strategy (called „feature selection‟) was implemented to
identify the most important variables associated with respondents‟ satisfaction (Figure
4.1). The first stage used nonparametric tests to identify the variables associated with
Page 117
Chapter 4 The tourist experience
95
satisfaction levels. The second stage used multiple regression trees as a feature
selection technique because of their ability to detect and visually present complex
interactions between the dependent variable (satisfaction level) and the independent
predictor variables (the number of dolphins, preferred number of surrounding boats,
reason for joining the trip, distance management, time management and encounter
management (i.e., the way the boatmen managed the encounter with the cetaceans)).
The regression trees gave a visual representation of the variables of interest (Figure
4.3). The variables identified in the regression tree were supplied to a stepwise
regression procedure (third stage) to identify the final model. The advantage of the
stepwise regression procedure was that it allowed for significance testing of the final
model, as well as testing the significance of the individual terms in the model.
I analysed the regression trees separately for each season (High/Low Season) because
questions about encounter, distance and time management were not included in the
High Season survey. To investigate possible effects of nationality type, I treated the
seasonal data as follows: 1) combined nationalities; 2) Western respondents; and 3)
Asian respondents. To simplify the design, I used all significant variables across all
three nationality combinations (Table 4.5).
The „rpart‟ command was used to generate the regression trees which were
subsequently „pruned‟ to optimal tree size as described in Therneau et al. (2010). The
final result was a tree with a number of „splits‟ that described the interactions between
the important variables (in the splits) and the response (tourist satisfaction in this
case).
Page 118
Chapter 4 The tourist experience
96
The variables selected in the regression tree and the interactions between the variables
were supplied as input variables to the stepwise regression. The final regression model
was assessed on the basis of cross-validated R2 (Faraway 2006).
Figure 4.1 An outline of the statistical methods used to analyse the quantitative data
from Lovina
Page 119
Chapter 4 The tourist experience
97
Supplementary information on statistical methodology
I originally used multi regression trees as the only method to find satisfaction patterns
among respondents in Lovina. Although the trees produced good explanatory trends,
the predictive trends were ineffective, requiring further use of stepwise regression to
confirm the „VIP‟ variables. I also had to exclude analysis from High Season data
collection (stepwise R2 < 15%, n=68), hence limiting the discussion of satisfaction
patterns only to Low Season data.
The High Season data did not generate good trees, possibly because the three
management questions (encounter, distance and time) were not yet included.
However, because stepwise regression used feedback from CART analysis, I suspect
that low R2 were the result of the CART‟s need for a larger dataset (De'ath &
Fabricius 2000 had 373 cases; Davis & Elder 2002 had 482 cases), and that the my
dataset from High Season was too small. Experimental data analysis indicated that I
required at least 120 valid responses (with all significant questions completed) to
generate robust multi regression trees (tree R2 > 25%, stepwise R
2 > 35%).
4.2.3 Qualitative data analysis
I analysed the qualitative data using coding and thematic analysis. Answers to open
ended and qualitative questions were coded and grouped into several themes. Some
coded responses were later treated as quantitative data and analysed statistically. The
best and worst aspects of the tours were coded and later analysed with general log
linear analysis to investigate possible associations with other variables (e.g.,
nationality and previous experience with dolphin watching tourism).
Page 120
Chapter 4 The tourist experience
98
4.3 Results
In accordance with my research aims explained in Chapter 1 Section 1.5, I have
structured the results section to reflect the tourist profile of the dolphin watching
industry in Lovina and information relevant to the sustainability of the industry.
4.3.1 Lovina dolphin tourist experience and profile
A typical tourist experience of the dolphin encounter in Lovina
After a tourist jukung leaves the beach at 6am (see Chapter 3 Setion 3.1.2), it typically
heads north to a location about 4 km offshore from Kalibukbuk and Kaliasem villages
and congregates with other jukungs which are also searching for dolphins. If after 30
minutes of searching at this location no dolphins have been seen, the vessels go
further afield as the occupants search for dolphins with their naked eyes.
Once dolphins are sighted, the vessel approaches them and positions as close as
possible to the animals until they disappear or the guests have to return to the beach
(see Chapter 3). Most boats return around 8am. A boatman typically conducts one
dolphin trip per day. However, he may take other guests on another dolphin trip or to
a small adjacent reef for snorkelling. Dolphin trips are not usually conducted in the
afternoon due to the strong sea breeze. Tourists sometimes experience bad weather in
the morning (e.g., strong rain, wind or swell) and this may cause sea sickness.
Characteristics of the tourists
Throughout 23 survey days in the 2008 High Season, 572 tourists from 26 countries
were recorded using the beach attendance survey in Kalibukbuk, the major departure
Page 121
Chapter 4 The tourist experience
99
port. Almost 72% of them were Westerners, followed by 27% Asians. More females
than males (54% to 46%) participated. Most tourists were aged 16 to 35 years (51%).
However, the industry also attracted older people (>65 years old, 7%) and children
(12%). The average length of stay in Lovina was 2.9 nights per respondent.
Over 36 survey days in the Low Season, 1,472 tourists were recorded using the beach
attendance survey method in Kalibukbuk and Aneka, the two major departure ports.
More than 88% of them (1,299) were foreigners; domestic tourists comprised only
11.8% (173) of the total. As in the High Season, there were more females than males
(54.3% to 45.7%) during the beach attendance survey.
A total of 533 potential respondents were approached to undertake the tourist
questionnaire survey, of whom 72.6% agreed to participate. A total of 123
questionnaires were completed during the High Season (June-September 2008); 98 in
English, 25 in Indonesian. In the Low Seasons (February-April 2009 and December
2009), a further 264 questionnaires (208 in English and 56 in Indonesian) were
collected, making a total of 387 completed questionnaires (306 in English and 81 in
Indonesian). I obtained more completed questionnaires during the Low Season than in
High Season because the beach attendance survey method was simplified giving my
team extra time for questionnaire distribution. The tourists were asked to fill in the
questionnaires regardless of whether they saw dolphins during the trip. More than
90% of total respondents stated that they had seen dolphins during their dolphin trips
in Lovina.
Page 122
Chapter 4 The tourist experience
100
Table 4.1 Summary details of the respondents to the dolphin tourism surveys
administered in Lovina, Bali.*
High Season
Value (%)
Low Season
Value (%)
Total
Value (%)
n respondents
(Response rate)
123 (31.8) 264 (68.2) 387 (100.0)
Language of the questionnaire
n 123 264 387
English 98 (79.7) 208 (78.8) 306 (79.1)
Indonesian 25 (20.3) 56 (21.2) 81 (20.9)
Gender
n 108 242 350
Female 58 (53.7) 116 (47.9) 174 (49.7)
Male 50 (46.3) 126 (52.1) 176 (50.3)
Age (year)
n 109 224 333
Mean individual
age
34.5 36.3 35.7
Modal age group 26-35 (38.5) 26-35 (37.1) 26-35 (37.5)
Range 13 – 69 14-71 13-71
Highest education level
n 112 244 356
Pre and high school 28 (25.0) 62 (25.4)) 90 (25.3)
College and
university
62 (55.4) 121 (49.6) 183 (51.4)
Postgraduate 22 (19.6) 61 (25.0) 83 (23.3)
Nationality types
n 116 252 368
Western
countries** 81 (69.8) 165 (65.5) 246 (66.8)
Asian countries *** 34 (29.3) 87 (34.5) 121 (32.9)
Latin American 1 (0.9) 0 1 (0.3)
Previous interaction with wild dolphins
n 116 248 364
Yes 66 (56.9% of n) 122 (49.2% of n) 188 (51.6% of n)
Western 53 (80.3% of „Yes‟) 91 (74.6% of „Yes‟) 144
(76.6% of „Yes‟)
Asian 12 (18.2 % of „Yes‟) 35 (28.7% of „Yes‟) 47 (25% of „Yes‟)
Latin American 1 (1.5% of „Yes‟) 0 1 (0.5% of „Yes‟)
Note:
* Response rate = 72.61% for both seasons combined
** Western countries: Australia, Austria, Belgium, Bosnia, Canada, Czechoslovakia, Denmark,
Finland, France, Germany, Ireland, Lithuania, Netherlands, New Zealand, Norway, Poland, Russia,
Sweden, Switzerland, United Kingdom, United States
*** Asian countries: China, India, Indonesia, Japan, Malaysia, Singapore, Taiwan, Thailand
Latin American country: Peru
Page 123
Chapter 4 The tourist experience
101
Consistent with the beach attendance survey, slightly more females responded to my
questionnaires than males (Table 4.1). The respondents ranged in age from 13 to 71
years, although almost 40% were 26-35 years old. The respondents came from 30
countries, with more than two-thirds of them Westerners and the rest Asians. Almost
90% of the Westerners came from European countries; 60% of them were Dutch,
French, German or British. More than 65% of Asian tourists were domestic; the
remaining 25% were Malaysian, Chinese and Singaporean. More than half the
respondents had had previous interactions with dolphins prior to coming to Lovina;
more than 75% of these were Westerners.
Respondents learned about the dolphin tours in Lovina from various sources. Word of
mouth (friends, family, the locals, etc.) was the main source (more than 35% of
respondents), although printed information (e.g., guide books and brochures – 31.8%),
and internet (15.2%) also played an important role. Word of mouth was a more
important source of information for Asian respondents (65%, n=103) than Western
respondents (n=197) who mostly learned about the dolphin tours from the internet
(12.7%) and printed information (42.6%). However, 33% of Western respondents still
received their initial information about the dolphin tours in Lovina by word of mouth,
indicating that this method was a powerful tool for information dissemination.
Almost 40% of respondents joined the dolphin trip because they wanted to see the
animals up close (65.7% Westerners, 31.5% Asians), while another 29% joined out of
curiosity (55.9% Westerners, 37.9% Asians). A small proportion (8.4%) of
respondents joined the trip because they had seen dolphins in captivity, and now
wanted to see them in the wild. General log linear analysis found no significant
Page 124
Chapter 4 The tourist experience
102
association between the reasons for joining the trip and nationality type (Pearson χ2
p= 0.313, df=5, α=0.05).
Almost 75% of respondents were tertiary educated (undergraduate and postgraduate)
(Table 4.4). General log linear analysis showed a significant association between
nationality type and education level (Pearson χ2 p = 0.008, df=2, α=0.05).
Significantly more Asian respondents had or were undertaking undergraduate degrees
compared with Western respondents (odds ratio 2.24).
4.3.2 Information relevant to industry sustainability
Tourist Satisfaction
Satisfaction benchmarking
Satisfaction scores were analysed in the context of the international satisfaction
benchmarking study of Pearce (2006), whereby average scores < 7.1 are considered
less than satisfactory (low), average scores 7.1 - 7.8 are moderate/medium, and
average scores > 7.8 are good. Pearce (2006) also used the categorisation of Hanan
and Karp (1989) who considered the satisfaction level high when 85-90% of the
scores were > 8. When 70-80% of scores are 8 - 10, satisfaction is considered
medium; when 60% or fewer responses were 8, 9 or 10, satisfaction is considered low.
The average satisfaction level of dolphin tourists in Lovina was 7.1 (se+0.11, on a
scale of 1-10) and about 51% of respondents provided a score of 8 to 10 (n=354).
These values place the satisfaction of the dolphin tourists between low and medium
on the Pearce and Hanan-Karp scales (Pearce 2006). The opinions of Western
Page 125
Chapter 4 The tourist experience
103
respondents were diverse (Figure 4.2) scores ranged from 1-4 (9.2% of respondents)
to 8 to 10 (40.2%).
Nonparametric analyses (Table 4.2) showed that the satisfaction level was unaffected
by field season, gender, education group, sea state, number of actual boats around,
whether the respondent had seen or interacted with the dolphins before, and whether
the tourist came from a developing or developed country. No significant difference
was found between the satisfaction of Western and Asian respondents.
Figure 4.2 Distribution of satisfaction levels with dolphin watching tourism at
Lovina, Bali according to nationality type.
Page 126
Chapter 4 The tourist experience
104
The Kruskal Wallis tests (Table 4.2) showed that encounter management was the only
one of these variables that was significant for both Western and Asian respondents.
However, subsequent analyses indicated that the underlying variables that made the
encounter management important for Westerners may be different from those that
influenced Asian tourists. However, I could not ascertain the effects of nationality
types due to the small number of Asians sampled (n=121).
Multiple regression tree analyses revealed that encounter management and the number
of dolphins seen during the trip were the most important variables for Western
respondents and all respondents combined (Table 4.3, Figure 4.3). However, as with
the univariate Kruskal-Wallis analyses, encounter management per se was the only
variable important for Asian respondents.
Stepwise regression (18% < R2
CV < 43.3%) suggested that encounter management
was the most important variable for all respondents (Table 4.3). An increase in the
number of dolphins can prevent the satisfaction of all respondents from declining too
much. However, a separate analysis of Western respondents showed that respondents
who felt uncomfortable with the way the boatmen managed the encounters had lower
satisfaction levels despite the high number of dolphins observed. Conversely,
Westerners‟ satisfaction level was higher even if a low number of dolphins were
observed, provided that they felt comfortable with the way the boatmen managed the
encounters.
Page 127
Chapter 4 The tourist experience
105
Table 4.2 Variables significantly associated with the satisfaction level of tourists who went dolphin watching at Lovina (data from Low and
High Seasons combined)
Nationality of
Respondent
Dolphin-related variables
(Kruskal-Wallis (KW) α=0.05 & Mann-Whitney post-hoc)
Aspects of the trip (Kruskal-Wallis & Mann-Whitney α=0.05)
Number of dolphins preferred number of
surrounding boats
Distance
management
Reason for
joining the trip
Time management Encounter management
All KW p<0.0005, df=4, n=337 KW p=0.002, df=2,
n=324
KW p=0.011,
df=4, n=228
KW p=0.04, df=5,
n=340
KW p<0.0005, df=4,
n=232
KW p<0.0005, df=3, n=231
Satisfaction increased with
dolphin group size
Satisfaction decreased
if respondents‟
preferred number of
surrounding boats were
10 or less
Satisfaction
highest when the
distance was
„about right‟
Those who wanted
to see dolphins at
close distances
were most satisfied
Satisfaction highest
when respondents felt
the right amount of
time was spent
watching the
dolphins
Satisfaction increased as comfort
level increased, highest when
respondents were very
comfortable with the way the
boatmen managed the encounter
Westerners KW p=0.02, df=3, n=156
KW p=0.002, df=2,
n=204
KW p=0.066,
df=4, n=146
KW p=0.005, df=5,
n=218
KW p=0.009, df=4,
n=149
KW p<0.0005, df=3, n=148
Satisfaction increased with
dolphin group size
Satisfaction decreased
if respondents‟
preferred number of
surrounding boats were
10 or less
Not significant Those who wanted
to see dolphins at
close distances
were most satisfied
Satisfaction highest
when respondents felt
the right amount of
time was spent
watching the
dolphins
Satisfaction increased as comfort
level increased; highest when
respondents were very
comfortable with the way the
boatmen managed the encounter
Asians KW p=0.109, df=3, n=88 KW p=0.299, df=2,
n=106
KW p=0.056,
df=4, n=73
KW p=0.114, df=5,
n=107
KW p=0.157, df=4,
n=74
KW p=0.009, df=3, n=74
Not significant Not significant Not significant Not significant Not significant Satisfaction increased as comfort
level increased, highest when
respondents were very
comfortable with the way the
boatmen managed the encounter
Note 1: Shaded areas refer to significant variables
Note 2: Variable groups:
Number of dolphins : 1-10; 11-20; 21-30; 31-40; >40
Preferred number of surrounding boats : 1-5; 6-10; > 10
Reason for joining : curiosity; friend/family/spouse asked me; just looking for something to do; wanted to see the dolphins at close distance;
wanted to see the dolphins in the wild; others
Distance management : -2, -1, 0, 1, 2 („far too close‟ to „not nearly close enough‟)
Time management : -2, -1, 0, 1, 2 („much too much‟ to „much too little‟)
Encounter management : -1, 0, 1, 2 („very uncomfortable or uncomfortable‟ to „very comfortable‟)
Page 128
Chapter 4 The tourist experience
106
Figure 4.3 Details of the analysis of the variables associated with the satisfaction of dolphin watching in the Low Season at Lovina using multi regression
trees
The numbers at the end of each branch represent average satisfaction for the relevant respondents
The High Season questionnaire was excluded because it did not contain the question on encounter management (Q26 in Appendix 2)
Encounter management: > 0.5 ~ comfortable and very comfortable; > 1.5 ~ very comfortable
Number of dolphins seen: > 2.5 ~ more than 20 dolphins; > 3.5 ~ more than 30 dolphins
Page 129
Chapter 4 The tourist experience
107
Satisfaction drivers: thematic analysis
I asked the tourists to identify the features of the experience that they liked the most;
many respondents gave more than one answer (Table 4.7). The respondents most
often identified the dolphins (55% responses from Westerners, 62.8% responses from
Asians). A female Western tourist described the highlight of her dolphin experience as
“Seeing them swim around freely, in captivity they act differently”. A male Westerner
liked the active behaviours of the dolphins (“The sound of the dolphins as they jump
out of the sea”). A male Asian respondent said Lovina was the best location for
dolphin watching (“I have [gone to] many countries, it is #1 in the world”).
The positive feature next most likely to be mentioned was the scenery, e.g., the
sunrise, the sea and the hills (12.5% responses from Westerners, 9.3% responses from
Asians), and the traditional boats (12.5% responses from Westerners, 5.8% responses
from Asians). Others liked the serenity of the experience (“The way the dolphins
swim, quietly, easily, like the boats aren't there”; “The peacefulness of being in the
little boat early in the morning”). A female Western respondents particularly liked the
authentic experience of the traditional boat (“The boat ride, I love the authentic
fishing boats”). In addition to the boat and the dolphins, the breakfast served on the
boat also impressed a male Westerner (“The boat trip, dolphins and the tea we got”).
The respondents were also asked to comment on what they disliked most about the
trip (Table 4.4). Again, many respondents gave more than one answer. Respondents
disliked: 1) the mismanagement of boats in Lovina, e.g., the many boats around, the
boats chasing the dolphins, boats coming too close to the dolphins (61.6% responses
from Westerners, 11.9% responses from Asians); and 2) the often prolonged time,
Page 130
Chapter 4 The tourist experience
108
travel distance and effort taken to find the dolphins (5.5% responses from Westerners,
32.2% responses from Asians). Western respondents particularly were displeased by
the noisy boats and boats that came too close to the dolphins. Some respondents
considered that the dolphins were disappointing (e.g., too few, not playful, or even not
seen at all). Garbage in the sea and on the beach was a problem for tourists from both
nationality groups. Other features disliked by respondents were bad weather, waking
up early in the morning, sea sickness, persistent souvenir sellers on the beach and the
long and uncomfortable trip.
General log linear analysis showed no association between respondents‟ nationality
type (Westerners vs Asians) and the aspects of the experience that they liked the best
(Pearson χ2 p=0.271, df=3, α=0.05). However, the aspects that respondents disliked
the most varied with nationality type (Table 4.3). Western respondents were more
likely to dislike the mismanagement of boats in Lovina (i.e., boats coming too close
to the dolphins, chasing the animals, the engine too noisy, or too many boats –
Westerner to Asian odds ratio 8.33:1). On the other hand, Asian respondents were
more likely to dislike the difficulties of finding the dolphins or when the animals were
not plentiful or playful (Asian to Westerner odds ratio 3.3:1).
Page 131
Chapter 4 The Tourist experience
109
Table 4.3 The most important variables associated with satisfaction with the dolphin tourism experience at Lovina and the aspects of the
experience that respondents disliked the most.
Nationality Most important variables associated with tourist satisfaction
(Low Season only)
Aspects of the trip that respondents
disliked the most (general log linear
α=0.05) Multiple regression tree
(see also Figure 4.3)
Stepwise regression
All Encounter management and
the number of dolphins seen
Satisfaction = 4.757 + (0.503 × dolphin) + (1.086 × encounter)
Encounter management was the most important variable. A
respondent who felt uncomfortable with the way the boatman
managed the encounter would have a lower satisfaction level.
However, an increase in the number of dolphins can prevent the
satisfaction from declining too much (R2
CV =
35.6%, p<0.0005).
Pearson χ2 < 0.0005, df=2, n=223. See
cells below for the most significant
variable(s) and the odd ratio for both
nationality groups.
Westerners Encounter management and
the number of dolphins seen
Satisfaction = 3.053 – (0.387 × dolphin × encounter) + (0.956 ×
dolphin) + (2.593 × encounter)
Encounter management was the most important variable. A
respondent who felt uncomfortable with the way the boatman
managed the encounter would have a lower satisfaction level even if
a high number of dolphins were observed. Conversely, the
satisfaction level was higher even if a low number of dolphins were
observed, provided that the respondent was comfortable with the
way their boatmen managed the encounters (R2
CV =
43.3%,
p<0.0005).
Boat mismanagement (i.e., coming too
close to dolphins, chasing the animals,
engine too noisy, too many boats
around).
Odds ratio Westerners: Asians = 8.33
Asians Encounter management Satisfaction = 6.324 + (0.842 × encounter)]
Tourists were more satisfied when they felt comfortable with the
way their boatmen managed the encounters (R2
CV =18%, p=0.002)
Difficulty finding the dolphins or
dolphins not behaving as expected
Odds ratio Asians : Westerner = 3.33
Page 132
Chapter 4 The Tourist experience
110
Table 4.4 Preferred and disliked features of the dolphin watching trips in Lovina
Features of the trip Westerners Asians
n % n %
Preferred features
The dolphins 119 55.1 54 62.8
Sunrise, the sea and the
surroundings
27 12.5 8 9.3
The boat (incl the trip &
boatman)
27 12.5 5 5.8
Others 43 19.9 19 22.1
Total 216 100 86 100
Disliked features
Boat mismanagement (too many
boats, boats chasing the dolphins
noisy boats, boats too close to the
dolphins)
101 61.6 7 11.9
Few, none, or not playful
dolphins, or difficult to find
9 5.5 19 32.2
Others 54 32.9 33 55.9
Total 164 100 59 100
Willingness to rejoin and recommend the trip
A respondent‟s satisfaction level was significantly associated with their willingness to
experience dolphin watching in Lovina again (Kruskal-Wallis p<0.0005, df=9,
α=0.05) and the willingness to recommend the Lovina dolphin trip (Kruskal-Wallis
p<0.0005, df=9, α=0.05).
The scores for the question concerning how respondents felt about the way their
boatmen managed the encounters were divided into two groups: 1) very
uncomfortable to uncomfortable; and 2) neutral to very comfortable. When examined
against the nationality type, the associations between encounter management and the
willingness to recommend the trip were significant (Figure 4.4). Western respondents
who felt neutral to very comfortable with the way their boatmen managed the
Page 133
Chapter 4 The Tourist experience
111
encounters were significantly more likely to promote the tour3. My data are
insufficient to conclude any significant association between willingness to
recommend and encounter management for Asian respondents.
Figure 4.4 Association between respondents‟ willingness to recommend a dolphin
watching trip at Lovina to others and how they felt about the way the boatmen
managed their encounters (modified from 3-way log linear table). The number in each
square is the number of respondents.
I also separated respondents who did not want to rejoin the trip and who did not want
to recommend the trip to others (n=28) from those who were willing to rejoin and
recommend the trip to others (n=124). General log linear analysis gave no significant
association between nationality types and encounter comfort levels for the first group.
However, all Western and Asian respondents who were willing to rejoin and
recommend also rated their feelings on how their boatmen managed the encounters as
neutral to very comfortable (Pearson χ2 p< 0.0005, df=1, α=0.05).
3 I have considered combining respondents who were neutral with those who were uncomfortable to
very uncomfortable with the way the boatmen managed their encounters to redistribute the cell sizes.
However, the result remained significant (i.e. Western respondents who felt comfortable to very
comfortable with the way their boatmen managed the encounters were significantly more likely to
promote the tour to others, Pearson χ2 p=0.002). Exclusion of neutral respondents would distort the
interpretation. Hence, I chose to present Figure 4.4 as it is.
Page 134
Chapter 4 The Tourist experience
112
4.4 Discussion
Although Lovina is not yet an established ecotourism destination, my respondent
profile was consistent with that of ecotourists (Eagles 1992; Wight 2001; Tao et al.
2004). Dolphin watching tourism at Lovina mostly attracts highly educated tourists
who join the dolphin trips because they want closer interactions and learning
experiences with the animals in a natural setting. The environmental values of dolphin
watching tourists in Lovina are also reflected in their satisfaction with the experience,
which ranged from low to medium (Pearce and Hanan-Karp scales (Pearce 2006)). In
comparison with seven terrestrial wildlife attractions in West Africa and two marine
wildlife attractions in Southeast Asia (Table 4.5), Lovina visitor satisfaction was in
the lower range, although it outranked visitor satisfactions at two other developing
country destinations Mt Kilimanjaro and Arusha National Parks in Tanzania.
Although there was no significant difference between the satisfaction levels of
Western and Asian respondents, there were important similarities and differences in
the variables contributing to the satisfaction of these groups. The way the boatman
managed the encounter was of concern to both Westerners and Asians. Additional
management and trip-related variables were associated with the satisfaction levels of
Western tourists only, such as the number of dolphins they saw and the number of
boats they would have liked around them.
The Westerners were also concerned about what they perceived as mismanagement of
the dolphin watching vessels (see also Chapter 3). Examples of mismanagement
included their tendency to speed (23.8% of Western respondents) and the dolphins
being surrounded by a large number of boats (29.3% of Western respondents). This
Page 135
Chapter 4 The Tourist experience
113
result accords with the increased sensitivity of Western tourists to overcrowding
compared with their Asian counterparts (Gillis et al. 1986; Yagi & Pearce 2007) and a
generally higher awareness of animal welfare among Western societies (Shani &
Pizam 2008). In Lovina, the number of boats in an encounter generally exceeded the
number of dolphins (Chapter 3). The data may also explain the low to medium
satisfaction level.
Although the observed number of boats was not significantly associated with the
satisfaction level of Western respondents, the preferred number of surrounding boats
was. Western respondents‟ satisfaction levels were lower when their preferred number
of surrounding boats was 10 or less (Table 4.2); more than 80% of them preferred
having a maximum of 10 boats around. Because on any given day a tourist has a 95%
chance of seeing 22 to 47 boats (mean 34.5 + se 6.29, see Chapter 3 Section 3.3.1),
the likelihood of a Western tourist being satisfied with this situation is low.
Overall, Western respondents were more concerned about the environmental
management of the dolphin watching industry in Lovina than their Asian counterparts.
(Akama 1996) also found Western tourists were more concerned about environmental
issues associated with wildlife tourism in Kenya than their local counterparts. Despite
these findings, Tao et al. (2004) and Jin (2009) both observed increasing
environmental awareness among Asian visitors participating in nature-based tourism,
suggesting that Asian tourists are likely to be increasingly sensitive about these issues.
Page 136
Chapter 4 The Tourist experience
114
Table 4.5 Comparison of satisfaction levels of visitors to nine wildlife viewing attractions in developing countries.
Name Location Western
visitors (%)
Original satisfaction Standardised
satisfaction
(score out of 10)
Satisfaction level according to the
qualitative scale developed by
Pearce (2006)
Ngorongoro Conservation Area Tanzania
(Okello & Yerian
2009)
64 8.75 of 10 8.75 High
Bali Hai Cruises dolphin
watching
Bali, Indonesia
(Bali Hai Cruises
official data,
pers.comm to the
Director of
Operations)
57.9 87.4% („good‟ on
Bali Hai rank)
8.74 High
Serengeti National Park Tanzania
(Okello & Yerian
2009)
64 8.68 of 10 8.68 High
Tsavo West National Park Kenya
(Akama 1996)
60 76.9% between 6 and
7 (scales 1-7)
76.9% scoring between
8.6 and 10
High
Lake Manyara National Park Tanzania
(Okello & Yerian
2009)
64 8.05 of 10 8.05 High
Sipadan diving sites Malaysia
(Musa 2002)
24.5 87.8% between 4 and
5 (scales 1-5)
87.8% scoring between 8
and 10
High
Tarangire National Park Tanzania
(Okello & Yerian
2009)
64 7.84 of 10 7.84 High
Lovina dolphin watching Bali, Indonesia
(this publication)
70 7.1 of 10 7.1, with 51% scoring 8
to 10
Low to medium
Arusha National Park Tanzania
(Okello & Yerian
2009)
64 7.00 of 10 7.00 Low to Medium
Mt. Kilimanjaro National Park Tanzania
(Okello & Yerian
2009)
64 6.60 of 10 6.60 Low
Page 137
115
The satisfaction level of Western respondents was significantly associated with their
willingness to recommend the dolphin trip to others: the more comfortable they felt with
the way their boatmen managed the encounters, the more likely that they would
recommend the trip. This tendency is important because more than 65% of visitors come
from Western countries; many of whom had learned about the dolphin tour in Lovina
from word of mouth. For all respondents, high levels of comfort with how their
encounters were managed were also significantly associated with their willingness to
repeat the visitation or recommend the trip. This propensity should be an incentive for the
boatmen to drive their boats considerately around the dolphins, even if they are not
concerned about the possible impact on the target species. Consequently, knowledge of
the tourist experiences (including satisfaction levels and corresponding factors) is
important in designing future management interventions in Lovina (see Chapters 6 and
7).
Chapter summary
Most dolphin tourists in Lovina come from Western countries, although the
industry also attracts Asian visitors.
Most visitors are tertiary-educated.
Tourist satisfaction ranges from low to medium.
While there was no significant difference between the average satisfaction of
Western and Asian tourists, the associated variables were different.
The satisfaction of Western tourists was associated with encounter
Page 138
116
management, preferred number of surrounding boats and the number of
dolphins seen.
Encounter management was the only variable associated with the satisfaction
of Asian tourists.
Satisfaction was positively associated with willingness to recommend the tour:
Western respondents who felt neutral to very comfortable with the way their
boatmen managed the dolphin encounters were more likely to promote the
tour.
Knowledge of tourist experience is useful in designing future management
interventions based on the quadruple bottom line and prism of sustainability
concepts
Page 139
117
CHAPTER 5
ECONOMIC ASPECTS OF THE DOLPHIN WATCHING TOURISM
This chapter is in review in the Journal of Ecological Economics as follows: “Mustika,
PLK, Birtles, A., Welters, R. and Marsh, H. The economic influence of community-based
dolphin watching on a local economy in a developing country: implications for
conservation.”
Chapter 4 described the experiences of tourists attending the dolphin watching tours
in Lovina. The dolphin tourists were not very satisfied with their experience,
particularly because of the way the boatmen managed the encounters with the
cetaceans. Eventually, this dissatisfaction may lead to reduced promotion for this
industry, which – if the industry brings significant benefits to the boatmen and the
village – may lead to negative economic consequences. Therefore, in this chapter I
describe the economic aspects of this industry and what is at stake if the dolphin
tourist visitation declines. This chapter covers the economic element of this industry
based on the quadruple bottom line and the prism of sustainability concepts.
Page 140
Chapter 5 Economic aspects of the dolphin watching tourism
118
5.1 Introduction
Although the cetacean watching tourism industry is becoming more important to the
economies of developing countries (Hoyt 2001; O'Connor et al. 2009), surprisingly little
is known about the distribution of the money that flows into the local communities
surrounding the industry. Only one detailed study on the economic impact of cetacean
watching tourism focusing on a developing country (see Orams 2002b) was available, in
addition to Hoyt‟s (2001) and O‟Connor et al.‟s (2009) worldwide economic calculation.
Gaining insight into the distribution of money flowing from the industry reveals the
financial beneficiaries of the industry and subsequently the major stakeholders in the
industry. Identifying the major beneficiaries / stakeholders is important in the event of
risks to the sustainability of the industry (be it the economic, biological or social aspects
of sustainability – see Chapter 1 Section 1.3).
This chapter therefore explores the economic impact of the cetacean watching industry in
Lovina (the economic bottom line or „profit‟ in Figure 1.3). This chapter has three
separate aims: 1) determine the attractiveness of the industry to the boatmen as a source
of income, which indicates industry expansion pressures, 2) determine the economic
impact of dolphin watching tourism on the local economy of Lovina and its most
prominent stakeholders / beneficiaries; and 3) develop potential initiatives to ensure that
the industry operates within the paradigm of the quadruple bottom line and the prism of
sustainability (see Chapter 1), which includes the biological, social and managerial
imperatives in addition to sustainable economic growth.
Page 141
Chapter 5 Economic aspects of the dolphin watching tourism
119
5.2 Methods
5.2.1 Tourist expenditure in the context of total economic value
The tourist expenditure approach was used to examine the influence of the dolphin
watching industry on the Lovina economy. This approach is useful to understand the
direct economic impact of a tourism industry and estimate various tourism-induced
impacts (Fritz et al. 1984). A total economic valuation analysis of the dolphins in Lovina
was not conducted since it was beyond the aims of this study. Total economic value is the
annual net benefit generated from a resource, in this case the dolphins (Samonte-Tan et
al. 2007). Total economic value is determined by the total of the use and non-use values
(which include pure existence value, option value and bequest value) (Tisdell & Wilson
2004). Tourist expenditure is a proxy for just one of the use values of a resource, which
includes both direct and indirect values (Samonte-Tan et al. 2007). In wildlife tourism,
the direct economic value is divided into consumptive and non-consumptive use value
(Tisdell & Wilson 2004). The use value of the dolphin watching industry in Lovina falls
into the category of non-consumptive direct use value; this is what I concentrate on in
this chapter. As such the estimates generated here are unambiguous under-estimates of
the total economic value of the dolphins. Figure 5.1 describes the overall context of the
total economic value of an industry, in this case the dolphin watching tourism in Lovina.
Expenditure is a measure of the financial benefits of an industry (in this case dolphin
watching tourism) (Duffield 1982). In wildlife tourism, tourist expenditure is usually
analysed in two ways: direct expenditure and indirect expenditure (Hoyt 2001; Orams
2002b; O'Connor et al. 2009). Direct expenditure is a proxy of direct gross revenue of
Page 142
Chapter 5 Economic aspects of the dolphin watching tourism
120
tourism (Samonte-Tan et al. 2007). Hence, direct expenditure involves the direct ticket
price (O'Connor et al. 2009) which, after deducting boat trip related costs, can be used to
determine boatmen‟s income levels generated by this industry (Figure 5.1). Comparison
of these income levels to per capita regional income indicates whether the industry is a
lucrative employment option for the boatmen, which in turn signals the pressure on the
industry to expand.
Figure 5.1 Total economic value and its association with direct tourist expenditures in
Lovina
* pers.comm. Coralie D‟Lima 2010 for dolphin-fisheries interaction in Chilika Lagoon,
Orissa, India
Page 143
Chapter 5 Economic aspects of the dolphin watching tourism
121
Indirect expenditure is a proxy for the indirect gross revenue of tourism (Samonte-Tan et
al. 2007). Many economists define indirect expenditure as a part of the multiplier effect:
the money spent by the business provider in support of their service (Duffield 1982;
Dwyer et al. 2000; Orams 2002b). However, Hoyt (2001) and O‟Connor et al. (2009)
define indirect expenditure as other expenditures that can be attributed to participation in
wildlife tourism, e.g., accommodation, food, communication, souvenirs and domestic
travel costs (Hoyt 2001; O'Connor et al. 2009; Cisneros-Montemayor et al. 2010). The
benefit of this definition is that one can distinguish the real beneficiaries of the industry:
the boatmen or other business sectors (e.g., hotelier, restaurants and transport services).
However, such a definition may confuse economic practitioners (Stoeckl et al. 2005).
To identify the industry‟s true beneficiaries while adhering to the definitions generally
used by economists, the ticket/admission price was defined as primary direct
expenditure. Consequently, tourist expenditure on other items attributable to the dolphin
tour (i.e., accommodation, food, communication, souvenirs and domestic travel costs)
was defined as auxiliary direct expenditure. This approach should reveal the wider
economic benefits of the dolphin watching tourism industry in Lovina while still
exploring the direct benefit of the industry to the boatmen. The term „indirect
expenditure‟ was not used here because estimating the multiplier effect is beyond the
scope of this research.
Page 144
Chapter 5 Economic aspects of the dolphin watching tourism
122
5.2.2 Data collection
My data collection involved: 1) direct observation and the use of secondary data; 2)
distribution of questionnaires to the tourists; and 3) interviews and meetings with the
dolphin boatmen in Lovina.
Official records of the number of dolphin tourists (see Chapter 2 Section 2.3 for
definition) are not available, hence I estimated them onsite through direct observation.
The estimation of the maximum number of observed boats was based on the data
obtained during 57 survey days from November 2007 to May 2009 from a jukung
(traditional tour boat). Although the tour boats departed from the four Lovina ports, they
tended to aggregate in adjacent locations, making it possible to undertake a total count. I
used the average passenger capacity from my boat surveys (3.2 passengers per boat) and
secondary data from the local government agencies to estimate the number of visitors
who joined the dolphin tours in comparison to the number of overnight visitors in Lovina
with appropriate adjustments for data seasonality.
I conducted an associated study into visitor satisfaction (see Chapter 4) over 70 survey
days in 2008 (June, July and September) and 2009 (February-April and December). The
tourist questionnaires were distributed to 533 tourists immediately after they had returned
from their dolphin trips. One of the questions was designed to understand respondents‟
auxiliary direct expenditures on accommodation, meals, communication (internet and
phone), and local transports (Q= “Approximately, what is your expenditure PER DAY in
Lovina? (This will help us to understand the contribution of dolphin watching to the local
Page 145
Chapter 5 Economic aspects of the dolphin watching tourism
123
communities)”). Interviews with 28 boatmen were used to estimate the costs involved in
operating the boat trips (see Chapter 6 for the detailed methods and results of the
interviews).
5.2.3 Data analysis
Dolphin tourist visitation
There were significant daily and monthly fluctuations in the number of boats, as well as
monthly and yearly fluctuations in the number of tourists staying overnight in Lovina.
The empirical data were therefore used to weight these factors when estimating the
annual number of dolphin tourists. The weekly fluctuations were weighted to achieve an
average number of boats per day in a month. Here it was assumed that each boat
conducted only one trip per day. Although I have occasionally observed boatmen
conducting two or more trips per day, multiple trips a day are very rare. The number of
passengers per boat was estimated based on the boat surveys. The average number of
dolphin tourists per month was obtained based on the actual number of operational days
per month. I assumed that the boatmen operate all year round (except for the Balinese
Silent Day or Nyepi in April), even during bad weather (which often occurs in December
and January). This assumption is in line with my field observations that documented trips
in very bad weather. Based on the 2009 questionnaire data, the number of overnight
dolphin tourists is 88.6% of the overall number of tourists conducting the dolphin trips. I
used this percentage to estimate the number of overnight dolphin tourists in 2007 and
2008.
Page 146
Chapter 5 Economic aspects of the dolphin watching tourism
124
The number of monthly overnight dolphin tourists was then compared with the number of
monthly overnight visitors (regardless of whether they undertook the dolphin trips) in
Lovina. The data of monthly overnight guests in Lovina from 2007 to 2009 are available
(courtesy of the Cultural and Tourism Agency of Buleleng). These data were used to
produce the percentage of overnight guests conducting the dolphin trips for a designated
month.
The above steps were replicated to obtain the respective percentages for other months and
years. I assumed that the overnight dolphin tourist to overnight tourist ratio is applicable
for the same month of different years. The percentages for months without data were
obtained from the average seasonal data. Here low season was defined from November to
May and high season was defined from June to October (which includes the national
school holiday and northern hemisphere summer holiday). The flow of tourist visitation
throughout my survey period confirms this seasonal pattern. Once all the estimated
percentages of overnight dolphin tourists in 2007-2009 were available, I calculated my
estimates of the number of overnight and day dolphin tourists in a year based on the
official records of overnight tourists.
Direct dolphin tourist expenditure
The questionnaires were distributed in 2008 and 2009. Hence the expenditure of
overnight and day tourists was analysed using the estimated number of dolphin tourists in
Lovina in those two years. In the Results (Section 5.3), all expenditures were expressed
in 2009 US Dollars. That is, the appropriate monthly Indonesian Rupiah (IDR) – US
Page 147
Chapter 5 Economic aspects of the dolphin watching tourism
125
Dollar (USD) exchange rates were used to convert the survey findings expressed in IDR
into USD. Subsequently I corrected for inflation to express 2008 USD expenditures into
their 2009 equivalents.
Primary direct expenditure is the admission fee of all tourists joining the dolphin trips
(day-tourists and overnight tourists). I use IDR 60,000 per tourist per visit for the
admission fee.
Annual primary direct expenditure (admission fee)
= # tourists per annum × admission fee
Boatmen’s net benefit
The net benefit received by the boatmen equals their direct gross revenue (i.e., total
ticket/admission revenues) minus related costs (fuel, boat depreciation, outrigger
replacement, boat repainting). Average fuel usage is 3.5 liters per day (IDR 5,000 or less
than 50 US cents per liter). A boat costs IDR 15 million (USD 1,600 including the
engine) and was assumed to last for 18.5 years (information collected from 10
respondents, ranging from 10 to 30 depreciation years). On average, a pair of bamboo
outriggers is replaced every two years, costing IDR 400,000 (less than USD 45) per pair.
Boat mortgage was not included in the cost because about 70% of my interview
respondents have paid off their boat mortgage and on average, those who still had to pay
by December 2009 only had to pay the mortgage for another 1.6 years (stdev+0.94 year).
The fees the boatmen must contribute to their associations were also not included,
Page 148
Chapter 5 Economic aspects of the dolphin watching tourism
126
because monthly fees varied across association (Kalibukbuk and Banyualit USD 1 per
guest, Aneka less than 50 US cents per guest and Kaliasem less than 20 US cents per
guest). In addition, the monthly fee (which was voluntarily agreed upon by the members)
was placed into a trust fund that could be used for the member‟s benefit (e.g., for boat
repair, school fees for the children or medical emergencies). Breakfast was not included
for not all boatmen served the tourists breakfast while onboard. The boatmen were not
subjected to income tax, hence tax was excluded from the analysis.
All associations operate licensing systems whereby a boatman is allowed to operate as an
association member after purchasing his membership (this membership is the equivalent
of an internal licence). The membership fee varied across the association: USD 27
(Kalibukbuk), USD 165 (Kaliasem), less than USD 1 (Aneka) and USD 110 (Banyualit).
Because the membership fee was a one-off rather than an annual fee and because it varied
greatly across association, including this fee would make only trivial difference to the
cost.
Boatmen‟s net benefit = primary direct expenditure – cost
An individual boatman‟s net financial benefit is the total boatmen net benefit divided by
179 (total dedicated boatmen offering dolphin tours in Lovina).
Auxiliary dolphin tourist expenditures
The total tourism expenditure associated with dolphin watching in Lovina is the gross
revenue that the industry injects into the local economy. These expenditures include
Page 149
Chapter 5 Economic aspects of the dolphin watching tourism
127
money spent on accommodation, meals, internet/communication, souvenirs and local
transport over a period of stay (i.e., 2.95 nights per overnight tourists based on the
questionnaires). For each expenditure item, tourists were provided with five options of
expenditure range (IDR 1-100,000; IDR 101,000-200,000; IDR 201,000-300,000; IDR
301,000-400,000; and > IDR 400,000). I modified the methods used by Stoeckl et
al.(2005) by using the mid point of each expenditure range for the first four categories,
resulting in the following expenditures: IDR 50,000; IDR 150,000; IDR 250,000; and
IDR 350,000. To make the range equal, the last expenditure range was fixed at IDR
450,000. The expenditure of each range was multiplied by the number of respondents in
that category to achieve the total expenditure of an item (e.g., meals) for that expenditure
category (e.g., IDR 50,000 per day). Average length of stay in 2009 was used to estimate
the auxiliary direct expenditure (AE) of overnight dolphin tourists in 2008 and 2009.
Daily dolphin tourists had a length of stay equal to one.
total
tourist
AE itemAE item = ×average length of stay
#respondents item
To understand the relative contribution of this industry to the economy of Lovina, the
auxiliary direct expenditures were compared to the Buleleng Gross Regional Domestic
Product, i.e., the sum of the added values of various economic sectors within the region
for a particular year (BPS Buleleng 2009). This calculation only includes hotels and
restaurants as the indicators for tourism growth. Hotel gross added value was obtained
from several production indicators, i.e., the number of rooms, beds, hotels, employees
and overnight tourists. The price indicators are the average rate per room, average output
(production value) per bed, average output per hotel, average output per employee and
Page 150
Chapter 5 Economic aspects of the dolphin watching tourism
128
average output per overnight tourist (BPS Buleleng 2009). As a result of the difficulty in
calculating the income of small unregistered restaurants, only gross added value of hotels
was used. I particularly focused on Banjar and Buleleng districts, which are the districts
that cover Kaliasem and Kalibukbuk villages respectively.
Auxiliary direct expenditures solely attributed to the dolphin watching
industry
The proportion of local tourism income attributable to the dolphin watching industry is an
index that demonstrates the significance of the industry to the region. To estimate this
variable, I needed to estimate how many tourists come to Lovina because of the industry
(coded as „dedicated dolphin tourists‟). These are the tourists who would not come to
Lovina if the dolphin watching tourism did not exist.
I did not directly ask the tourists whether they would still have come to Lovina in the
absence of dolphin watching tourism. Therefore, the responses to three questions in the
tourist questionnaires were triangulated to estimate the number of dolphin tourists who
specifically visited Lovina because of the dolphin watching industry. The three
triangulation questions were as follow:
- 'Ha[d] you heard of the dolphin watching tour in Lovina before arriving here?‟
- „Was dolphin watching on your list of holiday activities in Bali before coming here?‟,
and;
- „What influenced you to go dolphin watching?‟
Page 151
Chapter 5 Economic aspects of the dolphin watching tourism
129
The first two questions have binary answers („No‟ or „Yes‟). The third question has six
possible answers which were later grouped into two themes: 1) intrinsic values (e.g.,
affinity with the dolphins and the desire to see the dolphins in their natural habitat) and 2)
extrinsic values (e.g., recommendation by others, trying to find something to do, and
accompanying others).
Tourists who had (1) heard of dolphin watching in Lovina, (2) had „dolphin watching‟ on
their list of holiday activities before arriving there and (3) intrinsic pulling factors to the
dolphins, were coded as „dedicated dolphin tourists‟. The remaining tourists were coded
as „non-dedicated dolphin tourists‟. To identify members of the two groups, I used a
three-way contingency table (SPSS 19.0) among the three questions. The first was later
coded as „Prior knowledge‟, the second as „Wish list‟ and the third as „Reason to join‟
(Figure 5.2). The auxiliary direct expenditures of dedicated dolphin tourists and non-
dedicated dolphin tourists were later analysed separately.
Page 152
Chapter 5 Economic aspects of the dolphin watching tourism
130
Figure 5.2 A decision tree that explains the characterization of the respondents to the
2008 and 2009 surveys as dedicated and non-dedicated dolphin tourists.
Total dolphin tourist expenditures
The total tourist expenditure on the dolphin watching industry in Lovina is the total
primary direct expenditure (i.e., tickets) and the weighted means of total auxiliary direct
expenditures (five items: accommodation, meals, internet/communication, souvenirs and
local transport).
Total expenditures = total primary direct expenditure + total auxiliary direct expenditures
Page 153
Chapter 5 Economic aspects of the dolphin watching tourism
131
The total expenditure was compared with the expenditures of similar wildlife watching
tourism in other developing countries to understand the situation at Lovina compared to
other places.
5.3. Results
As detailed in Chapter 4, a total of 387 questionnaires were completed (306 in English
and 81 in Indonesian), making a 72.6% response rate. A total of 265 respondents filled in
the expenditure sections (results below). The number of questionnaires may seem small
compared with the total estimated visitors for this industry. The data were collected over
70 days and stratified across both high and low visitation seasons (low visitation season
from November to May and high visitation season from June to October – see Chapter 2
Section 2.1). I cannot confirm or reject whether my data were statistically representative
of tourists who joined the dolphin tours in Lovina because no such information is
officially available. However, the high response rate and the stratified sampling ensured
that I had done my best to achieve representativeness.
5.3.1 Dolphin tourist visitation in Lovina
The official number of overnight visitors in Lovina has more than doubled in the past
seven years (Figure 5.3). Although the visitation stagnated between 2004 and 2006, it
experienced a steady growth over the last four years (from 2007 to 2010). Because the
dolphin tourist data were collected from 2007 to 2009, I focused on the 2007-2009
visitation data only. During these years, the visitation numbers increased nearly 1.75
times (Figure 5.3). Of these visitors, about 30,800 to 53,200 visitors were estimated to
Page 154
Chapter 5 Economic aspects of the dolphin watching tourism
132
join the annual dolphin tour in 2007-2009 (average 42,000 dolphin visitors per annum).
The questionnaire data were used to estimate the proportion of dolphin visitors that
stayed overnight in Lovina (88.6%). By extrapolation, it means that between 27,300 to
47,200 dolphin visitors per annum (2007/09) stayed overnight in Lovina (average 37,190
overnight dolphin visitors per annum). The local tourism agency recorded a total of
179,635 tourists visiting Lovina from 2007 to 2009 (about 59,900 tourists per annum).
The calculation suggests that dolphin watching tourism in Lovina attracted at least 60%
of annual overnight visitors to Lovina (i.e., guests staying overnight in Lovina for various
reasons) in order to participate in the dolphin tours over the period of 2007-2009.
Figure 5.3 Number of overnight tourists in Lovina from 2004-2010 (Source: Cultural and
Tourism Agency of Buleleng)
Page 155
Chapter 5 Economic aspects of the dolphin watching tourism
133
More than 80% of the 56 accommodation facilities distributed along the coast of
Kaliasem and Kalibukbuk have less than 20 rooms per facility, which is in accord with
the average number of rooms per hotel in Banjar and Buleleng districts (17.5 and 17.9
rooms per hotel, respectively) as recorded by the Cultural and Tourism Agency of
Buleleng (2009). More than 80% of the accommodation facilities are home-stay facilities
or non-classified hotels (commonly termed „hotel melati‟ or „jasmine hotels‟). Most
facilities are located in Kalibukbuk (Figure 5.4).
Figure 5.4 The distribution of accommodation facilities in Lovina (insert shows Bali and
the position of Lovina on the north coast)
Page 156
Chapter 5 Economic aspects of the dolphin watching tourism
134
5.3.2 Total expenditure
Primary direct expenditure
I estimate that the overnight and day tourists spent USD 267,000 and USD 285,700 on
admission fees to dolphin tours in 2008 and 2009, respectively (Table 5.2). This is the
annual direct gross revenue for the whole dolphin watching industry in Lovina (179
active boatmen), which implies that the average boatman in Lovina received gross
revenue between USD 1,490 to USD 1,600 per annum. When the related costs (fuel, boat
depreciation, outrigger replacement, boat repainting) were deducted, the net benefit for a
boatman is reduced to USD 1,240 to USD 1,390 per annum, or between 1.3 to 1.8 times
the annual per capita Gross Regional Domestic Product of an average Balinese in
Buleleng Regency (USD 938 per annum for 2007 and 2008, using the 2008 rate (BPS
Buleleng 2009)).
Auxiliary direct expenditure
The auxiliary direct expenditures of dedicated dolphin tourists and non-dedicated dolphin
tourists (see Method) were analysed separately. The three-way contingency table between
the three questions demonstrated a significant association among them (Pearson Chi-
Square p < 0.0005 for intrinsic values and p = 0.003 for extrinsic values). I found 159
respondents (43.4%) who had prior knowledge about dolphin tours in Lovina, had wanted
to see the dolphins during their holiday and held intrinsic values about the dolphins.
These respondents were the dedicated dolphin tourists who might not have visited Lovina
in 2008 and 2009 in the absence of the dolphin watching industry. When their length of
stay was analysed, I found that 40.3% of total overnight dolphin tourists and 26.9% of
Page 157
Chapter 5 Economic aspects of the dolphin watching tourism
135
total day dolphin tourists in 2009 came to Lovina because of the dolphins. I used this
percentage to analyse the 2008 data. Based on the 2009 data, an overnight dedicated
dolphin tourist spent on average 3.56 nights in Lovina, while an overnight non-dedicated
dolphin tourist spent on average 3.29 nights in the same area.
I estimated that a dolphin tourist spent an average of USD 58 on auxiliary direct
expenditures per day in 2008 and 2009 (detailed items explained in Table 5.1). Based on
my personal experience and observation, the estimated expenditures are plausible.
Auxiliary direct expenditure on accommodation suggests that the typical dolphin tourist
stayed in a non-classified accommodation facility as opposed to a star-rated one.
Auxiliary direct expenditure on transportation suggests that these tourists/respondents
rent cars to explore Lovina and surroundings (instead of using public transport e.g., bus).
Table 5.1 Estimated daily auxiliary direct expenditures* of dolphin watching tourists in
Lovina from tourist questionnaires in 2008 and 2009.
Auxiliary direct
expenditures
USD 2008
(in 2009 prices)
USD 2009 Average
Food 16.9 12.6 14.7
Accommodation 11.5 16.4 14
Internet and
telephone
6.7 4.4 5.5
Souvenirs 13.0 6.1 9.6
Local
transportation
16.5 12.1 14.3
Total 64.6 51.6 58.1
* Tourist expenditures on non-ticket items attributable to the dolphin tour (i.e.,
accommodation, food, communication, souvenirs and domestic travel costs)
Page 158
Chapter 5 Economic aspects of the dolphin watching tourism
136
With almost 41,700 day and overnight visitors per annum, the auxiliary direct
expenditure of dolphin tourists in Lovina reached at least USD 9 million per annum
(Table 5.2). At least 46% of this expenditure (USD 4.1 million) was solely attributed to
the dolphin watching industry; i.e., this was the auxiliary direct expenditure of the
dedicated dolphin tourists who comprised 43.4% of the total tourists going on dolphin
trips in Lovina.
The total dolphin tourist expenditure in Lovina in 2008 and 2009 was USD 9.5 million
and USD 9.3 million, respectively (Table 5.2). Almost 60% of the 2008 total expenditure
and more than 45% of the 2009 total expenditure was spent by dedicated dolphin tourists
(USD 5.6 million and USD 4.3 million respectively – Table 5.2). About 3% of the total
expenditure went to the dolphin boatmen (primary direct expenditure) and the rest went
to supporting tourism services (auxiliary direct expenditures). The total attributable
expenditure to the dolphin industry (i.e., auxiliary direct expenditures of dedicated
tourists and total ticket expenditure) was USD 4.5 million in 2008 and USD 5.7 million
in 2009.
Page 159
Chapter 5 Economic aspects of the dolphin watching tourism
137
Table 5.2 Total expenditures of dedicated and non-dedicated dolphin tourists in Lovina
from tourist questionnaires in 2008 and 2009.
2008 (in 2009 USD) 2009 (USD)
Day Overnight Total Day Overnight Total
Primary direct
expenditures*
Dedicated 11,144 122,133 133,277 8,760 102,001 110,761
Non-dedicated 19,287 114,376 133,663 23,806 151,103 174,909
Total primary direct
expenditures 30,431 236,509 266,941 32,566 253,103 285,670
Auxiliary direct
expenditures**
Dedicated 88,886 5,353,925 5,442,811 43,802 4,143,623 4,187,424
Non-dedicated 185,730 3,662,569 3,848,299 148,126 4,759,068 4,907,194
Total auxiliary direct
expenditures
274,616 9,016,494 9,291,110 191,928 8,902,691 9,094,619
Total expenditures 305,047 9,253,003 9,558,050 224,494 9,155,794 9,380,289
* tourist expenditures on dolphin tour ticket
** tourist expenditures on non-ticket items attributable to the dolphin tour (i.e.,
accommodation, food, communication, souvenirs and domestic travel costs)
5.4. Discussion
5.4.1 Dolphin watching industry in Lovina is a lucrative business
The dolphin watching industry is very important for the Lovina economy. Approximately
60% of the annual overnight tourists in Lovina were estimated to participate in local
dolphin tours, much higher than Hoyt‟s (2001) estimate of 20%. When compared to the
annual per capita income of Buleleng, the direct net benefit for the boatmen shows that
the business is more profitable than most other earning opportunities. Because of the
higher opportunity costs (i.e., „the best alternative sacrificed for a chosen alternative‟
Page 160
Chapter 5 Economic aspects of the dolphin watching tourism
138
(Layton et al. 2009, p. 37)), the boatmen are unlikely to be willing to quit the industry.
On the contrary, the higher net benefit is likely to attract other villagers into becoming
dolphin boatmen, hence adding pressure to the industry.
The dolphin tourists‟ total annual expenditure of more than USD 9.3 million is more than
ten times higher than the 1999 annualised expenditure of whale watching tourists in
Tonga (adjusted inflation), another developing country with a significant whale watching
industry as reported by Orams (2002b). The total annual expenditure of dolphin tourists
in Lovina is also three times higher than the 2000 total annualised visitor expenditure of
sea turtle tourism in Mon Repos and 27% of the 2000 total annualised visitor expenditure
of humpback whale tourism in Hervey Bay, both in Australia (adjusted inflation, Tisdell
& Wilson 2004). Unlike the year-round dolphin tourism in Lovina, each wildlife tourism
venture in Tonga, Mon Repos and Hervey Bay is conducted for only four months (Orams
2002b; Wilson & Tisdell 2003). Therefore the expenditures for these three destinations
are reported as annualised totals (i.e., the expenditures are distributed throughout the
year).
The gross revenue (i.e., tourists‟ total expenditure) of dolphin watching tourism in Lovina
is generated by the activity of only 3% of the total Kalibukbuk and Kaliasem population.
The 3% composition was obtained from 179 dedicated boatmen out of the 5,800 village
work force (calculated based on the village‟s population of 9,800 people and 59.52%
work force of Balinese population in 2008 (BPS 2011)). This number indicates the
importance of dolphin watching tourism to the broader community. The auxiliary direct
Page 161
Chapter 5 Economic aspects of the dolphin watching tourism
139
expenditure of dedicated dolphin tourists is also considerable. Suppose the dolphin
watching industry ceased to exist (e.g., because dolphins were no longer found off
Lovina), Lovina would lose at least 46% of its auxiliary direct tourist income
(accommodation, food, internet/phone, souvenirs and local transport). Table 5.1 shows
the main beneficiaries of the industry (restaurateurs, hoteliers and transport agents) and
therefore the main economic stakeholders in preserving the industry.
The dedicated dolphin tourists spent an average of USD 1.3 million on accommodation
facilities in Lovina in 2008 and 2009 (the average accommodation expenditures for all
dolphin tourists was USD 2.6 million). This number was slightly higher than the hotel
Gross Domestic Regional Product (GRDP) in Banjar and Buleleng districts in 2008 (USD
1 million, BPS Buleleng 2009). Assuming average hotel maintenance cost of 70% (which
was later deducted from the USD 1.3 million), the dedicated dolphin tourists contribute at
least USD 403,000 (38%) to the local hotel GRDP.
The dolphin watching industry at Lovina has many of the positive characteristics of
locally-managed alternative livelihoods (local boats owned by local boatmen, small scale
hotels, restaurants and other businesses) which fit the definitions of micro and small scale
tourism enterprises (Shaw 2004). The rate of overnight visitations of dolphin tourists in
Lovina is within the normal range of overnight visitation in Bali. The ownership of hotels
in Lovina was not investigated. However, most hotels are not star-classified and do not
belong to international hotel chains. Some accommodation facilities and restaurants are
owned by expatriates who have married locals or formed joint ventures with local
Page 162
Chapter 5 Economic aspects of the dolphin watching tourism
140
business people. I thus suspect that Lovina suffers little economic leakage from the
dolphin watching industry and its related tourism services, which suggests that the
multiplier effects of the expenditure patterns I found are substantial. However, further
research is needed to draw firm conclusions about such multiplier effects.
5.4.2 Concerns over the sustainability of the industry
The economy is usually perceived as „a driving force behind most of the problems, but it
could also be a force for the better, contributing to the solution of problems by creating
enough wealth to solve them‟ (Spangenberg 2004, p. 75). In the section above, I have
examined the economic implications of Lovina dolphin watching from this perspective. I
conclude that the high profit the industry generated could also be the downfall of dolphin
watching in Lovina.
Despite the positive impacts of dolphin watching tourism on the local economy in
Lovina, my associated study on tourist satisfaction in Lovina (Chapter 4) suggested that
tourists are concerned about dolphin encounter management which may be causing
adverse biological impacts on the dolphin population. Increasing visitation to Lovina
(Figure 5.3) would presumably increase the number of dolphin tourists in the future and
the number of tour boats operating daily.
Figure 5.5 illustrates the need to manage the number of boats in this context. Suppose X
is the number of boat trips per day (tourism intensity), which is the daily fleet size (or
maximum boats conducting dolphin trips per day) in Lovina multiplied by the number of
Page 163
Chapter 5 Economic aspects of the dolphin watching tourism
141
daily trips per boat (I assumed the latter to be one). Line D-E-F represents the
conservation value of the dolphins. That is, if tourism intensity remains below X1, there is
no biological damage to the dolphin population, which implies its conservation value
remains constant. However, tourism intensity beyond X1 adversely impacts the dolphin
population, which implies a declining conservation value.
Curve A-E-B-C represents the net revenue from dolphin watching tourism, which reaches
a peak at point B, where tourism intensity is X2. Beyond point B, tourism intensity is, for
example, too high for the liking of the tourists who no longer enjoy the trips and hence do
not recommend the trips to others, which will harm the industry over time. Point E (with
X1 daily fleet size) represents the maximum tourism intensity that poses minimum
disturbance to the dolphins.
The total conservation value of dolphins is essentially the non-use economic value of the
animals (Figure 5.1). This value can be substantially higher than the net revenue from the
tourism industry (Figure 5.5). However, economic pressures drive tourism intensity
towards point B (X2 intensity). Consequently, if point X1 (the biologically-acceptable
daily fleet size) is to the left of point X2 (the daily fleet size with maximum economic
revenue), a conflict zone will occur between X1 and X2. However, it is worth noting that
my analyses in Chapter 3 could not give insights as to whether X2 exceeds X1.
Page 164
Chapter 5 Economic aspects of the dolphin watching tourism
142
Figure 5.5 The potential conflict between the economically optimum daily fleet size (X2)
and the biologically acceptable daily fleet size (X1) (adapted from Tisdell and Wilson
2004, p. 153)
Other related studies in cetacean watching tourism in several developed and developing
countries have shown that excessive numbers of boats have detrimental effects on the
target species viewed (Bejder et al. 1999; Constantine et al. 2004; Evacitas 2005; Courbis
2007; Christiansen et al. 2010, see also Chapter 3). These studies suggested that the
described conflict zone exists in similar industries elsewhere.
Page 165
Chapter 5 Economic aspects of the dolphin watching tourism
143
If Figure 5.5 is applicable to the Lovina dolphin watching industry, such a conflict zone
should be avoided so that the industry does not cause biological damage to the dolphin
population (which in return would lead to financial damage to the tourism industry in the
future). However, since the industry as a whole will try to maximize its profits (strive
towards X2 daily fleet size, instead of X1) and no individual boatman has an incentive to
leave the industry, X2 will be the outcome in the absence of sound conservation
management.
5.5 Concluding remarks
This chapter has demonstrated that dolphin watching tourism in Lovina is lucrative for
the boatmen involved, as it provides them with above average regional income levels,
which implies it is unlikely that boatmen will leave the industry voluntarily.
Though the boatmen derive above average earnings from the industry, the main
benefactors are outside the dolphin watching industry. The Lovina economy would lose
about 4.5 million USD in annual auxiliary direct expenditures in the event that the
dolphin watching industry ceased to exist, and the unexpected victims would include
restaurants, hoteliers and transport agents. They are therefore the substantial beneficiaries
of the dolphin watching industry and subsequently should join the boatmen as partners to
achieve and maintain the sustainability of the industry.
Earlier in this chapter, I presented Spangenberg‟s (2004, p. 75) argument that although
the economy is the driving force behind most environmental problems, it can also be used
Page 166
Chapter 5 Economic aspects of the dolphin watching tourism
144
as a part of the solution. The results of this chapter suggest that the individual boatmen
lack the incentives to reduce the intensity of the industry in the event that biological
sustainability is at risk. Thus, sustainable management of the industry must involve not
only the boatmen but also related tourism industries (e.g., hoteliers, restaurants and
transport agents).
Chapter summary
The dolphin watching industry in Lovina attracts at least 37,000 overnight
visitors per annum (~60% of the region‟s overnight tourists).
The industry contributes USD 9.5 million p.a. to the local economy.
At least USD 4.5 million p.a. may be lost if the industry ceases to exist.
The 179 boatmen enjoy an above average income.
However, trip fees constitute only 3% of the total expenditures generated by
dolphin watching tourism; the remainder is spent on local businesses e.g.,
accommodation, restaurant and transport which become the substantial
beneficiaries.
The number of boats should be regulated to address concerns over their
impacts on the dolphins and on visitor satisfactions (see Chapter 3).
Other beneficiaries, e.g., hoteliers, restaurateurs and transport agents, must
also be included in future management decisions due to the share of income
they receive from this industry.
Page 167
145
CHAPTER 6
MANAGEMENT OF THE INDUSTRY
This chapter will be submitted as a paper to the Journal of Cetacean Research and
Management as follows: “Mustika, PLK, Birtles, A., and Marsh, H. The importance of
community-based involvement for managing whale watching in a developing country
with decentralised management of marine resources.”
Chapter 5 described the economic aspects of the dolphin watching industry and how
much is at stake if the dolphin tourist visitation were to decline. The dolphin watching
industry in Lovina is very lucrative and attracted 60% of Lovina‟s overnight tourists. A
boatman‟s annual income was higher than the income of an average Balinese. Thus,
although previous analyses suggested that this industry was unlikely to be biologically
sustainable (Chapter 3) and the tourists were not always satisfied with their encounters
(Chapter 4), the boatmen are unlikely to refrain from their current activities. This industry
needs management options that consider the welfare of the animals, the tourists‟
satisfaction and the boatmen‟s source of income. Understanding boatmen‟s demography,
opinions, suggestions and current management arrangements is a prerequisite for the
development of such a management option; all of which will be detailed in this chapter.
This chapter covers some of the social and managerial elements of this industry based on
the quadruple bottom line and the prism of sustainability concepts.
Page 168
Chapter 6 Management of the industry
146
6.1. Introduction
Chapter 1 briefly explained that the number of countries (particularly from the
developing world) participating in cetacean watching tourism has expanded in the last
decade (Hoyt 2001; O'Connor et al. 2009). Garrod and Fennell (2004) examined 58 codes
of practice4 for whale watching and found that almost 47% were developed by relevant
government agencies at various levels. Non-governmental organisations and research
institutes also played a very important role in developing these instruments (22%).
However, only 7% of the codes were developed by the tourism operators. This finding
suggests that top-down management (initiated by state/provincial governments such as in
Argentina and national governments such as in Australia, New Zealand, South Africa,
Brazil and Mexico (Carlson 2010)) had played an important role in the development of
whale watching codes of practice.
The sustainability of wildlife tourism in developing countries is often hindered by
governmental regulations, lack of political will, enforcement and/or corruption (Smith et
al. 2003; Laurance 2004). Governments in many developing countries initially adopted a
top-down approach to conservation that privileged national agendas over the needs and
aspiration of local peoples (Carr 2002; Andersson et al. 2006). Many studies have pointed
out the problems of this approach and have argued that bottom-up conservation initiatives
are more effective because top-down management often undermines community
aspiration and involvement and overlooks the potential for locals to manage their own
resources (Ostrom et al. 1999; Carr 2002; Ostrom 2009).There is an increasing awareness
4 Garrod and Fennell (2004) used the 2001 version of Carlson‟s data. However, their analyses were based
on the number of codes rather than the number of countries where the codes were applied.
Page 169
Chapter 6 Management of the industry
147
that sustainable environmental stewardship requires the involvement of both community
groups and government agencies, particularly when dealing with programs that require
effective facilitation and complex networks of stakeholders (Carr 2002; UNEP 2006).
Devolved governance or decentralisation is an increasingly common method of balancing
the top-down and bottom-up approaches, particularly when the decentralisation seeks to
devolve the property rights of natural resources to local communities (Andersson et al.
2006).
Top-down and bottom-up agents may vary according to time and context. A central
government‟s instruction to a local government is a top-down approach. Once the central
government devolves its authority to the local government, it decentralises its governance
and no longer practises a top-down approach. However, when a local government officer
conveys a policy to local villagers, he/she is still conducting a top-down approach. Non-
governmental organisations and researchers who come to a village to assist the villagers
with some conservation management initiatives can also be considered as part of the top-
down approach (Carr 2002, p. 228). This understanding is important because many non-
governmental organisations and university researchers often consider their roles as agents
of a bottom-up management approach, although in reality the locals still view them as
outsiders coming to implement a top-down initiative.
Through Law 22/1999 and Law 31/2004, Indonesia is committed to devolved
(decentralised) marine resource management (Table 6.1). Both provincial and regency
governments are legally responsible for environmental conservation in their jurisdictions.
Page 170
Chapter 6 Management of the industry
148
Regency governments have the right to manage their marine resources to four nautical
miles offshore (Table 6.1). Cetacean biodiversity is protected by a number of national
instruments, rather than regency or sub-national instruments (Table 6.1). All marine
mammals are protected and cannot legally be harvested, killed or traded. However,
Indonesian law is silent on wildlife tourism including cetacean watching.
Top-down approaches (led by government at various levels, research institutes and even
non-government organisations (see Carr 2002, p. 228) has been pivotal in the
development of whale watching codes of practice in many countries (Garrod & Fennell
2004). I expect this pattern to be repeated in Indonesia. Nonetheless, the decentralisation
of environmental management in Indonesia to the regency level is often compromised by
a lack of local capacity and the imperative for local authorities to maximise their income
(Aden 2001), further exacerbating the lack of capacity and funding. Thus, a top-down
approach (albeit decentralised) for the development of cetacean watching guidelines in
Indonesia would need to be combined with bottom-up initiatives.
This chapter explores the boatmen‟s demography and perspectives (the „people‟ in Figure
1.3) and the industry‟s managerial aspects (the „governance‟ in Figure 1.3). This chapter
aims to 1) understand the boatmen‟s demography, opinions, suggestions and current
management schemes; and 2) provide insights into the challenges associated with
developing sustainable whale watching in developing countries by analysing the strengths
and limitations of the management of the Lovina dolphin watching industry. These
insights were obtained from interviews with the boatmen before they learned of the
Page 171
Chapter 6 Management of the industry
149
results of our research and subsequently during workshops convened to share the results
of the other components of this research (Chapters 3-5).
6.2 Methods
6.2.1 Overview of approach
Qualitative research in Lovina was conducted in two stages (Figure 6.1) to develop, as
Marshall (1996, p. 523) put it, „an understanding of complex issues relating to human
behaviour‟ associated with the dolphin watching industry in Lovina. The first stage
comprised two rounds of interviews: 1) with the dolphin association coordinators and 2)
with association members. Interview questions were informed by the results of a tourist
survey (Chapter 4), although I did not inform the respondents of the survey results.
Purposeful sampling was used for both rounds of interviews. Interviews were continued
until data saturation was reached, i.e., when „new categories, themes or explanations stop
emerging from the data‟ (Marshall 1996, p. 523) or when, as Mead put it, researchers are
„bored‟ from hearing the same thing time and again (Morse 1995).
Two types of purposeful sampling were used in this research. Key informant semi-
structured interviews (Marshall 1996) were chosen for the first round of interviews
because the association coordinators were considered as people with special expertise.
Maximum variation sampling (Sandelowski 1995; Marshall 1996) was used to choose
respondents for the second round of interviews, with dolphin boatman‟s age (younger and
older) and experience (new in the business or have been in the business for a long time)
as criteria for stratifying the sampling of members within each dolphin association. In
Page 172
Chapter 6 Management of the industry
150
the second stage of the research, the results of the interviews were presented to
stakeholder workshops (Figure 6.1) which aimed to: 1) inform the boatmen of some of
the results of our research (Figure 6.2); 2) obtain additional insights after the boatmen
learned about our results; and 3) keep their faith in our research by sharing the results
with them.
Page 173
Chapter 6 Management of the industry
151
Table 6.1 List of Indonesian regulations relevant to cetaceans and species conservation
Legal basis for species/environmental conservation in Indonesia
Law 5/1990 Conservation of living natural resources and
their ecosystems
Law 23/1997 Environmental Management
Law 22/1999 Local Autonomy
Law 32/2004 Local Governance
Law 31/2004 Fisheries
Law 27/2007 Coastal and Small Islands Management
Law 32/2009 Environmental Protection and Management
Government Regulation 35/1975 Protection of wildlife
Government Regulation 68/1998 Nature Reserves and Protected Areas
Government Regulation 19/1999 Pollution or Marine Contamination Control
Government Regulation 27/1999 Environmental Impact Assessment
Presidential Decree 43/1978 Ratification of Convention on International
Trade in Endangered Species of Wild Flora and
Fauna (CITES)
Presidential Decree 32/1990 Management of protected areas
Ministerial Decree 30/2010 Management plan and zoning of MPA
Local Government Regulation 16/2009 Bali Spatial Planning
Legal basis for cetacean conservation in Indonesia*
Law 17/1985 Ratification of „Principles of the Archipelagic
Concept‟ and the United Nations Convention
on the Law of the Sea – UNCLOS (first chapter
of the UNCLOS document, Section 1.1)
Law 5/1994 Ratification on the United Nations Convention
on Biological Diversity (fourth chapter of the
Convention)
Government Regulation 327/1978 Protection of wildlife (addendum)
Government Regulation 716/1978 Protection of wildlife (addendum)
Government Regulation 7/1999 Preservation of Flora and Fauna (fifth chapter
of the regulation)
Government Regulation 8/1999 Exploitation of Wild Flora and Fauna
(complimentary regulation to Government
Regulation 7/1999)
Ministerial Decree 802/2011 The prohibition of dolphin harvesting in
Indonesia * Cetaceans are mentioned in brackets
Source: Hoyt 2004; Indoregulation (2005), Ministry of Environment (2011), Ministry of
Marine and Fisheries Affairs (2011)
Page 174
Chapter 6 Management of the industry
152
Figure 6.1 Organisation of the interviews and stakeholder workshops in Lovina (the numbers in brackets in Stage One refers to the
number of people interviewed)
Page 175
Chapter 6 Management of the industry
153
Figure 6.2 Details of the information presented during the community and stakeholder workshops (the participants identified the
topics in bold for further discussion during the workshops)
Page 176
Chapter 6 Management of the industry
154
6.2.2 Interviews
Interviews with the association coordinators
In April and May 2009, my team and I interviewed the coordinators of the four dolphin
associations in Lovina: Kaliasem, Kalibukbuk, Aneka and Banyualit (Figure 6.1). We
intended to conduct separate semi-structured interviews with each association leader.
However, Kalibukbuk asked for a group interview that involved their leader, secretary,
treasurer and field coordinator. The interview with Aneka was conducted with the field
coordinator because he was the most knowledgeable and active person in the association. He
was joined by the leader of the organisation half-way through the interview.
To avoid taking too much of each respondent‟s time, I planned to discuss 65 questions
(Appendix 3) over three meetings as follows: 15 questions (first interview), 36 questions
(second) and 14 questions (third). Each meeting was expected to last for less than an hour.
Nonetheless, all the associations except for Kaliasem (which adhered to the original plan)
decided to limit the interview to one meeting, which lasted for about 1.5 hours. All
respondents were Balinese residents. I conducted the interviews in Indonesian, the national
language in which all respondents and I were fluent. The interviews were recorded with a
digital recorder after obtaining the respondents‟ written consent. No respondents declined this
request.
This first phase of the interview(s) covered the history of each respondent‟s time in Lovina
and their involvement in the industry, their opinions about why the dolphins were present and
the changes they had seen in the dolphins, the tourists, the industry and the information given
to the tourists. The second phase covered the dolphins (abundance, behaviour, distribution,
areas of use and changes in areas of operation), the background of the association and its
Page 177
Chapter 6 Management of the industry
155
members, the origin of their boats, pricing, other sources of income, boat ownership,
organisational structure, interactions with other groups, marketing strategies, membership
rules, strengths and weaknesses of the industry, the importance of the industry to the village
(scale 1 to 10) and the importance of the industry to the individual boatman (scale 1 to 10).
The third phase discussed the concerns of the industry and possible scenarios if dolphin
abundance or behaviour changed in a manner that would negatively impact the industry.
Questions about boat accidents at sea and other safety matters and suggestions for better
management were also asked.
Interviews with association members
After completing the interviews with the association leaders, a subset of the members of each
association were interviewed (Figure 6.1). The semi-structured interview questions were
modified by: 1) omitting the questions about the management of the association(s) and 2)
adjusting the other questions to make them appropriate for a single boatman respondent. The
second interview covered 64 questions (Appendix 4). One of the management questions
invited the interviewee to suggest operational changes to improve dolphin watching tourism
in Lovina. After the eleventh respondent suggested limiting the number of boats around a
group of dolphins, I developed a follow up question that asked interviewees to indicate the
number of boats that he felt comfortable with when around a group of dolphins. To avoid
prompting the respondents, this supplementary question was only asked when the respondent
mentioned regulating the number of boats.
These interviews were conducted in December 2009 with 28 respondents (nine from
Kalibukbuk, six from Kaliasem, seven from Aneka and six from Banyualit). Respondents
Page 178
Chapter 6 Management of the industry
156
often asked to be interviewed in pairs. However, because I wanted to capture each boatman‟s
opinions without peer influence, my team and I conducted two interviews at the same time.
Two teams of two researchers interviewed two boatmen at the same place and at a
comfortable distance apart (so no one could hear the other‟s conversation). The interviews
were conducted in Indonesian. The interviews were recorded after obtaining each
respondent‟s written consent. Two of the 28 interviewees did not consent to recording; their
responses were written down during the interviews.
6.2.3 Stakeholder workshops
In April 2010, I presented the summary information obtained from the above interviews, our
tourist questionnaires and boat surveys to: 1) three community workshops with the dolphin
boatmen (i.e., Kalibukbuk, Kaliasem and Aneka), and 2) a multi-stakeholder workshop in the
Regency capital Singaraja that also included local government representatives (Figures 6.1
and 6.2). The workshops were conducted in Indonesian. The interviews were recorded using
digital recorders after obtaining the participants‟ oral consent.
The community workshops were conducted in beach locations. To optimise participants‟
involvement, the use of computer-based tools was deliberately avoided. I adopted the
Metaplan Method (Habershon 1993) and presented the results verbally in Indonesian, guided
by thematically coded colour cards that were attached individually to a wall or whiteboard.
After the presentation, each participant was invited to identify three topics per theme (Figure
6.2) that he wished to discuss further using colour-coded stickers (four stickers for three
themes, totalling 12 stickers per boatman). The five topics identified as of greatest interest for
Page 179
Chapter 6 Management of the industry
157
each theme were then discussed further. Details of this technique are explained in Appendix
5.
My supervisors (Prof Helene Marsh and Dr Alastair Birtles) came to Lovina to assist with the
stakeholder workshops. To accommodate schedules, we conducted the workshops in the
following order: Kalibukbuk, Kaliasem and the government-facilitated workshop. During the
workshops, I summarised the conversation in English to assist my supervisors who in turn
helped the workshop processes by giving encouraging overviews and comments on the
participants‟ ideas and the overall workshop processes. The workshop with the Aneka
boatmen was conducted a few days after my supervisors returned to Australia.
6.2.3 Data analyses
Interviews
The interviews with both the association coordinators and the boatmen were transcribed
verbatim in Indonesian. Ten transcripts were translated from Indonesian to English to assist
Marsh and Birtles‟ comprehension of their content. Because I am fluent in Indonesian and
English, I analysed all transcripts in both languages using both quantitative and qualitative
methods. Descriptive statistics (SPSS ver 19.0) were used to analyse the quantitative data,
e.g., the boatmen‟s demography, contribution of the dolphin industry to the boatmen‟s
monthly income, the importance of dolphin watching to the village and the importance of
dolphin watching to the individual boatmen. Thematic analysis was used to analyse the
qualitative data. This process involved creating categories through coding focusing on the
context of the information during analysis (Joffe & Yardley 2004). As appropriate to the
nature of the data, I conducted inductive coding, i.e., drawing themes from the raw
information itself instead of from established theoretical ideas (Joffe & Yardley 2004). Small
Page 180
Chapter 6 Management of the industry
158
codes were merged into a theme and, if required, clustered with other themes to form a
broader theme.
In line with the concept of thematic analysis (Joffe & Yardley 2004), I identified both popular
themes (i.e., mentioned by many respondents) and infrequent themes (i.e., mentioned only
once or twice). Respondents were de-identified to protect their privacy. However, to assist in
management discussions, I retained the identity of their association in reporting the results of
the interviews.
Workshops
Thematic analysis was used to analyse the workshop results. Upon the completion of the last
workshop with the Aneka boatmen (Figure 6.1), the workshop results were transcribed
verbatim in Indonesian. The coding and thematic analyses were conducted in English. In the
final analyses, management concerns and suggestions were thematically grouped following
the themes resulting from the boatmen interviews. To promote data integrity (Caelli et al.
2003), any themes that had not been identified during the previous interview process were
treated as new themes, unless they were combinable with previous themes.
Data integrity
The validity of qualitative research does not rely on sample size per se, although too small a
sample might, in some cases, sacrifice data richness (Sandelowski 1995). Instead, qualitative
research should stop when the data are saturated (Morse 1995; Sandelowski 1995; Marshall
1996; Caelli et al. 2003). In line with data saturation theory (Morse 1995; Caelli et al. 2003),
I selected several management-related questions to determine whether the responses had
reached saturation. These questions included questions about: 1) the dolphin searching
Page 181
Chapter 6 Management of the industry
159
strategies adapted by the boatmen, 2) changes in the behaviours of dolphins since the
boatman joined the industry, 3) suggestions to improve the industry and 4) his reaction to
dolphin watching codes of practice. Generally, I reached saturation after the 23rd interview or
after I interviewed the members of three (out of the four) dolphin associations. After the 25th
interview, no new themes that could not be combined with previous themes were found. My
supervisors examined the data coding for the verification process.
6.3. Results
6.3.1 Insights into the industry
The Kaliasem Association (official name: Sinar Bahari or „The Ocean Light‟), which was
established by artisanal fishers in 1987, is the oldest among the four dolphin associations in
Lovina. The Kalibukbuk Association (official name: Catur Karya Bhakti Segara or „Four
Devotional Works for the Ocean‟) was established in 1989. The Aneka Association (official
name: Wisata Tirta Aneka or „The Aneka Marine Tourism‟) was established in 1991,
followed four years later by the Banyualit Association (official name: Bhakti Segara or
„Devotion to the Ocean‟). The association coordinators advised that their membership usually
reflected a potential member‟s home address. For instance, the members of Kalibukbuk
association usually live in Kalibukbuk village. However, in recent years, some boatmen from
other villages have joined the Kalibukbuk association because of their preference for its
marketing system (see below).
In 2008/2009, the dolphin watching industry in Lovina had 179 dedicated tour boats
distributed among the associations as follows: Kaliasem 49 boats, Kalibukbuk 58 boats,
Aneka 48 boats and Banyualit 24 boats (see Figure 6.1). The number of boats did not always
match the number of association members: Kaliasem had 49 members, Kalibukbuk 58,
Page 182
Chapter 6 Management of the industry
160
Aneka 53 and Banyualit 21. The association coordinators explained that these discrepancies
occur because several boatmen operated the same boat (Aneka) or several members own
more than one boat (Banyualit). As explained in Chapter 5 Section 5.2.3, all associations
operated licensing systems whereby a boatman was allowed to operate as an association
member after purchasing his membership which also serves as an internal licence. The
membership fee varied across the association: USD 27 (Kalibukbuk), USD 165 (Kaliasem),
less than USD 1 (Aneka) and USD 110 (Banyualit). All associations had a moratorium on
membership and no longer accepted new members. However, existing members could sell
their membership for prices ranging from USD 270 (Aneka) to USD 890 (Kalibukbuk).
Interviews with the association members in April 2010 indicated that the average boatman
had been operating for 14.3 years (se +1.7, range 3 months to 31 years). The boatmen‟s
average age was 37.7 years (se +1.7, range 21 to 55). Generally, the boatmen had joined the
industry when they were in their early 20s (mean 23.6 years, se +1.4, range 11 to 41). A
quarter of respondents had secondary school education (12-15 years old, the equivalent of
Year 7 – Year 9 in Australia), while almost 40% of them did not complete or attend
secondary school. About 32% of respondents had high school as their highest education level
(16-18 years old, the equivalent of Year 10 – Year 12 in Australia).
Dolphin watching was the primary occupation of almost 60% of the boatmen. About 25% of
them also fished for a living, while 18% of them had other jobs, e.g., teaching, farming and
guiding or driving tourists. Almost 35% of respondents had previously worked in other
tourism sectors; almost 18% used to be fishers. Almost 75% of respondents either changed
their occupation or added dolphin watching to their existing job(s) because of the prospect of
increasing their income.
Page 183
Chapter 6 Management of the industry
161
During the interview, the association leaders were asked to identify the strengths of their
industry („In your opinion, what are the strengths/good things about the dolphin watching
industry in Lovina?‟). Members of all four dolphin associations identified the sunrise, seeing
the dolphins close to the boats and the calm sea. Different strategies were used to market
these strengths in the dolphin tour package. Kalibukbuk and Banyualit preferred a „free-
marketing‟ strategy which gave every member the freedom to find his own guests by actively
offering his services to any tourist. This strategy allowed a boatman to keep marketing until
6:30am on the day of the trip. In contrast, Kaliasem and Aneka applied a roster system which
gave a rotating subset of members an equal chance of obtaining guests on any given day. On
average, this system meant that Aneka boatmen went out only about once a week. The roster
system also enabled a boatman to know if he would take guest(s) the next morning, because
bookings were usually finalised at least a day ahead. These two associations also allowed
their members to conduct free-marketing occasionally, particularly when the boatmen
conducted trips for repeat customers.
Some boatmen waited at the entrance gates to the beaches and offered their services to
approaching vehicles. Anecdotal information suggested that this habit annoyed some tourists;
the boatmen could be very persistent in their attempts to secure a trip. A Kalibukbuk
respondent who did not approve of this method explained that he left the industry and became
a full time fisher because of this dissatisfaction. At the time of interview (December 2009),
this boatman took tourists to see the dolphins only during the high tourist season.
The association members were asked about the methods they used to find the dolphins („How
do you find the dolphins‟ and „What other clues or indications do you use to find dolphins?‟).
Scanning the horizon with their naked eyes was the most common method. The boatmen also
Page 184
Chapter 6 Management of the industry
162
used clues such as birds (feeding dolphins are usually found in association with birds),
jumping fish or the flashes of tourist cameras. The boatmen also kept a close watch on the
behaviour of groups of tour boats, which tended to behave differently when watching rather
than searching for dolphins (see Chapter 3 Section 3.3.1). When a group of boats was
watching dolphins, they would either move around or make zig-zag movements. While
searching, the boats moved straight ahead in parallel.
Each boatman was asked how important the dolphin industry was to his village on a scale of
10 („How important is the dolphin industry for your village?‟). On average, the boatmen rated
the importance of the industry to the village at 8.8 (se +0.34, range 4-10); > 85% rated 7 - 10.
The most popular reason for this high rating was the additional income to the village (93%).
When asked about the importance of dolphin watching to them individually, the boatmen
averaged 9.2 (se +0.36; range 1-10, 93% 8 - 10). The most popular reason (93% of
respondents) for rating the industry as very important was because it provided them with
income (additional or sole).
The Aneka dolphin association was the only association that formally collaborated with
major travel guides and agents to attract visitors. Their capacity to do this was enhanced by
their rotating roster system that enabled travel agents to deal with the coordinator who offered
them a fixed price. The travel agents usually prepared a tight schedule for their tourists, thus
the dolphin tourists taken by the Aneka boatmen usually had to return to the beach by
7:30am. Assuming an average initial search time of 36 min from 6am (Chapter 3 Section
3.3.1), the tourists and the boatmen had a maximum of 30-45 min to watch dolphins before
they headed back to the beach. This schedule only worked if the dolphins were located
quickly. However, there were days when the boatmen had to spend almost an hour before
Page 185
Chapter 6 Management of the industry
163
they found the animals, after which the pressure to maximise encounter time before returning
to the beach forced some boatmen to prioritise the opportunity for the visitors to interact with
the dolphins over the dolphins‟ welfare (see Chapter 3 Section 3.3.1).
Although the other dolphin associations also worked with travel agents, negotiations tended
to be conducted with individual boatmen. For instance, Kalibukbuk boatmen had their own
contacts with independent small travel agents who typically developed individualised tour
packages that were not so tightly scheduled, and were thus more accommodating of the
variable time required to locate the dolphins.
6.3.2 Management concerns
Managing encounters with the dolphins
The association members were asked to identify any problems they had encountered with
other boatmen during their dolphin trips. „Collisions with other boats‟, „boats cutting across
the dolphins‟ route‟ and „speeding boats‟ were the most frequent complaints. A few boatmen
also complained about „other boats cutting across their boats‟. One boatman was particularly
concerned with the habit of „boats cutting in front of the dolphins‟:
„Sometimes a boat cut my way, or hit my boat. I often reminded them to turn off the
engine or lift the propeller. Some listened, some just didn‟t care.‟
My team and I asked about the possibility of limiting the number of boats („Should there be
any limit on boat numbers at Lovina? What do you think that limit should be? Higher, about
the same as now, or less?‟). The coordinators of all associations responded that this option
Page 186
Chapter 6 Management of the industry
164
would be difficult to implement, although the coordinator of Kaliasem agreed that they must
limit the number of boats:
„If there are too many boats, it‟s possible that the dolphins won‟t visit Lovina
anymore. We must limit the number of boats; no more additions. It will also avoid too
much competition‟.
The Kaliasem leader also stated that it would be difficult to reduce the number of boats
because each boatman had purchased a licence to obtain association membership. This
sentiment was echoed by coordinators of the other associations. However, all associations
reported that they had no intention of expanding their membership because of the lack of boat
parking space on the beach. The coordinator of Kalibukbuk questioned whether the number
of boats influenced dolphin behaviour because of the short daily interactions with the
animals:
„I don‟t think that the boats influence a lot. The boats are not there for too many
hours anyway.‟
The association coordinators were asked about the approach distances between the boats and
the dolphins and asked if this distance should be limited („Should there be any limit on the
distance between boats and dolphins at Lovina? What do you think that limit should be?‟).
The Banyualit and Kalibukbuk coordinators admitted that they had „no rules on a minimum
approach distance‟. Kaliasem was the only association to advocate the desirability of limiting
how close the boats should approach the dolphins. Nonetheless, the coordinator explained
that the rationale for such a limitation would be to remove any advantage associated with
Page 187
Chapter 6 Management of the industry
165
engine power rather than to address animal welfare concerns. The Aneka coordinator claimed
that the boats crowded closely around the dolphins only when a small number of dolphin
groups could be located and that the boats spread out if they found dispersed groups of
dolphins.
Association coordinators were given several questions about the potential maximum viewing
duration and the possibility of having staggered departure times („Do you think it would be
appropriate to limit the viewing duration? What about different times of departure for
dolphin watching? e.g., some boatmen depart at 6am, some at 7am, and some departing at
8am?‟). Generally, the associations allowed their boatmen to extend the viewing time if they
found the dolphins late into the morning. The heat of the morning sun in Lovina was a natural
limitation; by 9am the heat was considered too harsh for most tourists. „Splitting the
departure time‟ (e.g., 6am and 7am) was not an acceptable option for some boatmen who
wished to promote the sunrise as a feature of their dolphin tour. However, others were
indifferent about „split departure times‟ provided they were acceptable to their guests.
Other matters
„Concerns about safety at sea‟ often emerged during interviews. Both association
coordinators and boatmen lamented that many boatmen could not swim. They also
complained about the absence of an officially trained Search and Rescue team for Lovina.
Life jackets were rarely observed in Kalibukbuk prior to June 2009 when the equipment was
purchased at the instigation of that association‟s new coordinator who was concerned about
the increased incidence of maritime accidents. When I visited Lovina in April 2010, almost
all Kalibukbuk boats had been equipped with life jackets. However, when I left Lovina in the
Page 188
Chapter 6 Management of the industry
166
same month, the region still had no dedicated Search and Rescue (SAR) team. No boatman
had received formal first aid or life-saving training.
Interviews with association members revealed that they were concerned about the „persistent
beach vendors‟ who attempted to force their products on dolphin tourists. They also disliked
„the sea and the beach being littered with garbage‟ delivered by the rivers from upstream
villages or left on the beach.
Some Kaliasem boatmen (all were also fishers) complained about the „decline in fish catch‟
over the years, but no records were available to substantiate their concerns. However, these
fishers explained that they were not involved in dolphin tourism because of declining fishing
stocks. They diversified into dolphin watching tourism because it was a more lucrative
business than fishing.
6.3.3 Management suggestions
The association members were asked about how they envisioned dolphin tourism in Lovina
in 10 years‟ time. About half of the respondents predicted that „there would be more boats‟.
As a consequence, they were concerned that they would have to „search further to find the
dolphins‟ because the increased boat traffic might deter the dolphins. However, other
boatmen did not think that the changes would affect the dolphins, or did not anticipate any
changes. Some boatmen feared that „fewer tourists would visit Lovina‟, thereby reducing
their income.
During interviews with association coordinators, my team and I explained that dolphins in
other parts of the world had reacted negatively to boat-based tourism (Constantine et al.
Page 189
Chapter 6 Management of the industry
167
2004; Bejder et al. 2006; Stensland & Berggren 2007; Christiansen et al. 2010). We asked the
coordinators if they anticipated such changes in Lovina. The coordinator of Aneka did not
think that it would happen off Lovina because:
„Lovina is the home for the local dolphins.‟
The leader of Banyualit accepted that „tour boats could alter dolphin behaviour‟. However, he
was still of the opinion that the dolphins would not leave Lovina.
The association coordinators were asked for suggestions to improve their industry. The
Kaliasem coordinator suggested that:
„[they] improve [their] behaviours around the dolphins; not too close, don‟t chase
them, don‟t disturb the animal‟s journey‟.
The respondents also recognised „the need to improve boat behaviours‟ by, for example
keeping to a minimum distance, not chasing the dolphins, slowing down, turning off the
engine or lifting the propeller when the dolphins were around and not cutting across the
dolphin‟s route or the path of other boats.
Each association member was asked to specify the number of boats that he felt comfortable
with when around a group of dolphins as a means of identifying a possible limit for a code of
conduct. The boatmen‟s answers suggested that they were most comfortable with an average
of 13.6 boats around a group of dolphins (sd +7.6, range 5 to 30, n=9), which is substantially
less than the mean daily fleet size (34.5, see Chapter 3 Section 3.3.1). However, this number
Page 190
Chapter 6 Management of the industry
168
still exceeded the number of surrounding boats the tourists generally preferred (10 or less,
Chapter 4, Table 4.5).
My team and I also discussed the possibility of the dolphin associations developing and
adopting a code of practice for dolphin watching in Lovina. Most boatmen supported the idea
of developing and implementing such a code. Some respondents emphasized „the importance
of coordination among boat associations‟ in Lovina while others argued that „the boats should
be divided into several observation areas‟. When asked about „compulsory training‟ for new
boatmen, the majority of respondents agreed that it would be a good idea. Some respondents
specifically asked for training in swimming, safety and Search and Rescue. Marketing, the
need for a dedicated Search and Rescue team and the development and implementation of a
dolphin tourism code of practice were the common themes identified when the interviewees
were invited to make open ended closing statements.
6.3.4 Stakeholder workshops
The stakeholder workshops enabled the respondents to discuss these issues further in the
context of some of the results in Chapters 3-5 (Figures 6.1 and 6.3). During the four
workshops, the issue most frequently-identified for further discussion was „encounter
management‟, i.e., „approach distance‟, „driving behaviour‟, „speeding and cutting across the
dolphins‟ route‟.
During the workshops, some discussion occurred about the distance between the boats and
the dolphins. Kalibukbuk boatmen explained that when there was a large number of boats
around the dolphins, the boats competed to get their guests as close as possible to the
Page 191
Chapter 6 Management of the industry
169
dolphins (sometimes at the guests‟ request), even though this behaviour tended to reduce each
vessel‟s interaction time with the dolphins.
In a discussion about speeding, some boatmen from Kaliasem explained that even if a
boatman wanted to stay calm and quiet while watching the dolphins, the behaviour of the
other boatmen would induce him to speed in order to provide his tourists with the opportunity
to observe the dolphins (see Chapter 3).
All participants agreed that a code of practice for dolphin watching in Lovina must be
„approved and adhered to by all dolphin tour associations‟. Three important initiatives were
suggested during the meeting with Kaliasem: 1) turning off the engine (or, if this is
impractical, lifting the propeller), 2) keeping their distance from the dolphins and 3) avoiding
cutting across the dolphin‟s route. Participants at the four meetings (Figure 6.2) agreed in
principle to turn off the engine and that compliance with the dolphin tourism code of practice
was necessary. The participants also agreed in principle to keep the boats at a safe distance
from the dolphins, although the actual minimum distance was not discussed. However,
despite the boatmen‟s increased understanding that excessive numbers of boats resulted in
less interaction time and less satisfied tourists, the participants did not appear to support a
quota on the number of boats because of various reasons discussed in Section 6.4.1.
At the Aneka workshop (the last workshop), the participants raised two additional issues: 1)
„the role of travel agents‟ in the reduced observation time (see Section 3.1), and 2) „the
problem of old boat engines‟. Many boatmen had old engines with a fragile starter rope. A
boatman who attempted to turn off the engine while watching the dolphins was frequently
concerned that he would not be able to start the engine again because the rope might break.
Page 192
Chapter 6 Management of the industry
170
Several boatmen had experienced this problem, preventing their tourists from enjoying the
dolphin tour. The boatmen eventually abandoned the practice of turning off the engine and
minimised acceleration instead.
„Garbage‟ was the most frequently identified non-dolphin issue during the workshops. „The
absence of a designated, trained Search and Rescue (SAR) team in Lovina‟ was another
concern. The participants stressed the need for training for boatmen in search and rescue
techniques, codes of practices, basic English and swimming.
The government-facilitated workshop was designed to generate broad stakeholder feedback.
Thus, it was attended by the four dolphin associations, the village leaders and government
officers from the Cultural and Tourism Agency and the Marine and Fisheries Agency. The
topics discussed in this workshop were similar to those identified at the association
workshops. The presence of the two government agencies provided the opportunity for
information exchange between the boatmen and the government officers. The Head of the
Tourism Agency underlined the importance of dolphin tours in Lovina to other stakeholders
(e.g., accommodation and restaurants), while the Fisheries officer acknowledged the
importance of conserving the local cetacean resources. The event also provided a rare
opportunity for members of the four associations to meet.
The villagers agreed with our explanation that the dolphins and the visitors could not
associate a boat with a village, thus it was important that all ports/associations established an
agreed dolphin tourism code of practice. After the workshop, the Kalibukbuk coordinator
informed us that he was ready to collaborate with the Kaliasem and Aneka coordinators to
better coordinate dolphin watching in Lovina.
Page 193
Chapter 6 Management of the industry
171
Figure 6.3 Dolphin boatmen deciding on topics they would like to discuss during the
stakeholder meeting in Kalibukbuk, April 2010
6.4 Discussion
The interviews and stakeholder workshops confirmed that the Lovina dolphin watching
industry is very important both for the villages and individual boatmen. However, the
boatmen considered the personal benefit to be higher than the community benefit. I conclude
that the boatmen were not aware of the wider economic significance of their industry to their
regency (see Chapter 5).
The boatmen were concerned about the long-term sustainability of their industry, especially
encounter management and other operational issues such as garbage and safety. Although the
boatmen agreed in-principle to better encounter management (including driving behaviour,
speed limits, a minimum approach distance and not to cross the dolphins‟ route), they resisted
the concept of limiting the number of boats.
Page 194
Chapter 6 Management of the industry
172
As briefly discussed in Section 6.1, no formal cetacean watching guidelines exists in Lovina
or other parts of Indonesia. Passenger capacity (maximum four passengers per jukung) is the
only condition applicable in Lovina; the dolphin watching cooperatives agreed on this
restriction for reasons of safety and profit equity. The maximum allowable numbers of boats
or minimum approach distance to a school of dolphins are not regulated.
Protocols for driving behaviour and minimum approach distances feature in most national
codes of practice or regulatory measures for cetacean watching; the number of boats and the
maximum interaction time are often not limited. All the guidelines, regulations and
international agreements reviewed by Carlson (2010; see also Table 6.2) stipulated approach
protocols and driving behaviour that included reduced speed (mean 6.6 knots (se+0.7, mode
5) for developed countries and mean 4 knots (se+0.4, mode 5) for developing countries) or
turning off vessel engines in the vicinity of the cetaceans. Although most Lovina boatmen
agreed to limit their speed, some boatmen are likely to find it challenging to adhere to such a
requirement because the fragile starter ropes of their old engines made it risky to turn off their
engine when in proximity to the animals.
All developed countries also include a minimum approach distance in their regulations or
guidelines (mean 70 m (se+6.6, modal 100)); only one developing country (Tanzania) did not
specify a minimum approach distance (Carlson 2010, Table 6.2, see also Chapter 3). From an
operational perspective, implementing a minimum approach distance should be possible in
Lovina with appropriate training. Initially, I had a problem in convincing the Lovina boatmen
of the practicality of the Australian standard (50 m, Department of the Environment and
Water Resources Australia 2005); the boatmen claimed that 50 m was too far for the tourists
to see the dolphins properly. When I let them use my digital range finder, they realised that
Page 195
Chapter 6 Management of the industry
173
this distance was appropriate for viewing dolphins (see also Chapter 7 Section 7.3.2). This
finding is not novel as many people find it difficult to judge distances over water; boat
captains that took tourists on whale watching trips in Hawaii also experienced significant
errors in distance estimation (Baird & Burkhart 2000).
Thirteen of the countries or territories (31%; 9 developed and 5 developing countries)
reviewed by (Carlson 2010, Table 6.2) did not limit the interaction time between tour boats
and cetaceans. The countries that imposed a time limit generally recommend a maximum of
30 min interaction time (average 32 min (se +5.1) for developed countries and average 29.1
min (se + 2.2) for developing countries). The surface time for dwarf spinner dolphins at
Lovina is already short (on average less than two minutes; Chapter 3 Table 3.4). Thus
stipulating maximum interaction times is probably less urgent than the other aspects of
encounter management. However, as previously discussed in Section 6.3, the need to return
visitors to the beach by 7:30am often caused the dolphin boatmen to speed and to position the
tourists as close as possible to the dolphins to increase tourist satisfaction. Thus, I consider
that speed and distance management are the most crucial aspects of encounter management at
Lovina (see also Chapter 3).
Page 196
Chapter 6 Management of the industry
174
Table 6.2 Matters included in cetacean watching codes of practice by Carlson (2010)
Themes Number of developed countries
(total=20)
Number of developing countries
(total=22)
No
(n)
Yes (n) Mean of
variable limit
No (n) Yes (n) Mean of
variable limit
Driving
behaviour
(with average
speed limit in
knots)
0 20 6.6 (se+0.7,
mode 5, n=13)
0 22 4 (se+0.4,
mode 5, n=7)
Approach
distance (m)
0 20 70 (se+6.6,
mode 100,
n=20)
1 21 138.9 (se+9.5,
mode 50,
n=19)
Encounter
time limit
(minutes)
9 11 32 (se+5.1,
mode 30, n=10)
5 17 29.1 (se+2.2,
mode 30,
n=17)
Number of
encounter fleet
size vessels
8 12 2.6 (se+0.2,
mode 3, n=12)
5 17 1.9 (se+0.18,
mode 2, n=15)
6.4.1 Management of fleet size
The term „number of boats‟ is ambiguous in the cetacean watching industry. As has been
explained in Chapter 3 Section 3.2, the term may variously refer to: 1) total fleet size: the
number of boats in the fleet, in this case 179 licensed boats; 2) daily fleet size: the maximum
number of boats going out at any given day; 3) encounter fleet size: number of boats around a
school of dolphins (see Carlson 2010) and 4) the observed fleet size, i.e., the observed
number of boats on the water at any given time (including vessels travelling between schools
and vessels observed on the horizon). The International Whaling Commission considers that
limiting the encounter fleet size is an important component of encounter management (see
Carlson 2004). Regulations generally specify a maximum encounter fleet size of three vessels
(mean 2.6 (se +0.2)) for developed countries and two (mean 1.9 (se +0.18)) for developing
countries (Table 6.2). I have chosen to consider all four aspects of the fleet together here as
they are not independent.
Page 197
Chapter 6 Management of the industry
175
Nonetheless, because we only talked about „the number of boats‟ during the workshop, it is
likely that the boatmen were confused by this ambiguity. In view of the importance of this
industry to the local economy and to themselves (Chapter 5), the reluctance of the boatmen to
consider a fleet size reduction is understandable. Because the number of boats has been
shown to negatively alter dolphin behaviour (Berrow & Holmes 1999; Constantine et al.
2004; Stensland & Berggren 2007; Williams & Ashe 2007), I regard controlling the
encounter fleet size in Lovina as central to sustainable dolphin watching.
Inspection of dolphin watching guidelines and regulations (Table 6.2) suggest that limits on
actual fleet size, daily fleet size or encounter fleet size are less accepted worldwide than
encounter controls. A total of 13 countries or territories (31%) did not include a quota on the
fleet size (8 developed and 5 developing countries). Such a limit would be particularly
difficult to implement at Lovina. Lovina has a very large daily fleet size (up to 100 on a busy
day) compared with other cetacean watching operations. Limiting the daily fleet size would
reduce a boatman‟s chance to operate on any given day and, by extension, his takings
(Chapter 5). Nonetheless, there is clearly considerable latent effort in the fleet. The maximum
number of boats I counted on the water was 98 out of a potential 179 (201 if fishing boats are
included. The average number of boats on the water per day (34.5 – Chapter 3 Section 3.3.1)
was only 19% of the dedicated fleet.
Limiting the number of dolphin tour boats at Lovina may have to be addressed in a staged
process. Limiting the encounter fleet size should be more difficult to regulate than the daily
fleet size or the total fleet size due to the boatmen‟s desire to provide their guests with
maximum interactions with the dolphins. The maximum encounter fleet size could
presumably be stipulated as part of a voluntary code of conduct focused on encounter
Page 198
Chapter 6 Management of the industry
176
management. In accordance with the mean encounter fleet size acceptable to the boatmen we
interviewed (mean 13.6, sd +7.6, range 5 to 30), approximately 15 boats per group of
dolphins is suggested in this thesis (see also Chapter 7 Section 7.3.2 for the detailed
calculation).
A shared licencing and tradeable daily permits may be options for limiting the daily fleet size.
A shared licence system would require the profit to be divided between the licence owners
according to an agreed system. For instance, a number of boatmen (two is suggested) share a
boat licence and, by consequence, share the boat as well (the same jukung used every day in
Lovina). From the boatmen‟s perspective, having only one boat to manage (instead of two)
could reduce the cost of boat maintenance. However, because the aim of a shared licence is to
reduce the daily fleet size, two boatmen who share the same licence cannot take tourists on
the same day. To compensate for their loss, the following strategies are recommended: 1) the
admission fee is increased to cover the „loss‟; 2) the two boatmen must not have a large
overlap between their usual schedule (e.g., one is usually active only every first and third
week and the other every second and fourth week, or one person is only active on the first
half of the week and the other the second half of the week). Having both boatmen from the
same association would simplify this arrangement.
A tradeable permit is „a transferable right to a common pool resource‟ (Ellerman 2005),
which is commonly applicable in pollution control (Tietenberg 1995) or in fisheries as
Individual Transferable Quota (Grafton 1996; Ellerman 2005). One of the most commonly
used type of tradeable permit is „allowance trading‟ (Ellerman 2005), which can be modified
for Lovina. A system of tradeable daily permits could operate as a daily queue ticket for
Lovina. In this system, a boatman may own the right to operate on a particular day based on
Page 199
Chapter 6 Management of the industry
177
„first come, first served‟ basis. Only a limited number of tickets (allowable permits) would
be available, encouraging the boatman to book at least one night in advance for the following
day‟s departure. Such a system would require consequential changes to the marketing
systems that would presumably be more easily accommodated by Kaliasem and Aneka‟s
roster systems than the systems of the other associations. The introduction of such systems
would be demanding, particularly for illiterate boatmen and would require considerable
investment in building the leadership capacity of the associations.
The total fleet size in Lovina is already capped by limited landing space on the beach.
However, should it deemed necessary in the future, reducing the total fleet size would almost
certainly be the most challenging and expensive change to implement, although examples
from developed countries e.g., whale shark tourism in Ningaloo, Australia (Davis et al. 1997)
are available. Gjertsen and Niesten (2010) provided examples of economic incentives for
marine conservation efforts operating in several developing countries including: 1) cash
incentive payments; 2) scholarships in exchange for changed behaviour; 3) grants to develop
alternative livelihoods; and 4) purchase and/or lease of licences or permits. The last one
seems the most applicable to Lovina and would require a third party (government or, very
likely, non-government organisation) to purchase the licence (and the rights to conduct
dolphin tours) of some tour boats thus reducing the effective fleet size. The adoption of this
approach would be facilitated by the considerable latent effort in the fleet and may produce
little change on the water except in peak periods. There would need to be associated caps on
the number of boats to prevent boatmen returning to the industry.
Page 200
Chapter 6 Management of the industry
178
6.4.2 A Way Forward
The challenges discussed above need to be considered in the context of: 1) the lack of
information on the status of the dwarf spinner dolphins (Data Deficient according to the 2010
IUCN Red List, (IUCN 2010)), 2) the decentralised nature of resource management in
Indonesia that often has the unintended consequence of encouraging local governments to
excessively exploit their natural resources (Aden 2001) and 3) the consequent lack of
capacity and control at local level in Indonesia (Aden 2001).
Experience (Alder et al. 1994; Gjertsen & Niesten 2010) suggests that Indonesia would elect
to adopt a top-down management approach in which the government or non-government
organisations play an important role in the establishment of voluntary guidelines and
subsequent regulation. A consequence of the decentralised management system is that the
local environmental agencies are short of capital and capacity, which makes it unlikely that
they would be able to take the lead in industry restructuring.
As of December 2010, the Buleleng Marine and Fisheries Agency, the government agency in
charge of marine conservation in Buleleng Regency, was in the process of establishing the
Central Buleleng Marine Protected Area at Lovina, focusing on the conservation of the
regency‟s coral reefs and dolphins. This process potentially provides a vehicle for working
with the boatmen to design dolphin watching codes of practice and to address the safety
issues raised by the boatmen. Indonesia has an established national marine Search and Rescue
Team (SAR) in Jakarta, with branches in provincial cities e.g., Denpasar. However, the
government needs to invest in training appropriate personnel for a Lovina Search and Rescue
team.
Page 201
Chapter 6 Management of the industry
179
This chapter demonstrates that the core stakeholders (the boatmen and their associations)
already recognise that there is a problem and are in-principle willing to improve their
encounter management. The regency government (which should be able to garner support
from the national level government) also knows there is a problem as do non-government
organisations and at least one research institution. These stakeholders need to work together
towards a sustainable dolphin watching industry in Lovina; the potential development of
which will be discussed in Chapter 7.
Chapter summary
The interviewees confirmed that the industry has some sustainability issues.
The industry is essentially unregulated.
The boatmen were concerned about the industry‟s long-term sustainability,
especially the encounter management practices and other operational issues such
as garbage and safety.
Although the boatmen agreed in-principle to improved encounter management,
they resisted the concept of limiting fleet size.
Insights from primary stakeholders have the potential value in formulating
operational marine resource management options in developing countries.
Page 203
181
CHAPTER 7
GENERAL DISCUSSION
In Chapters 3-6, I described among other things the nature of the encounters between tour
boats and cetaceans, tourist experiences, economic aspects of the industry and how the
boatmen currently manage the industry. The sustainability of the Lovina dolphin watching
industry has also been examined from the viewpoint of the four elements of sustainability. In
this chapter, I synthesise the key findings of the four data chapters and discuss the
implications of my study on the cetacean watching industries at Lovina and elsewhere in the
world, particularly in developing countries. The theoretical frameworks of quadruple bottom
line concept and the prism of sustainability are also revisited; actions are recommended based
on the Precautionary Principle.
Page 204
Chapter 7 General discussion
182
7.1 How I achieved the research objectives of my study
Chapters 3-6 describe the results of my comprehensive investigations into the sustainability
of dolphin watching off Lovina. I investigated whether dolphin watching tourism at Lovina
was sustainable from the biological, social, economic and managerial perspectives , threby
addressing the overall objective of this thesis. I attempted to seek some answers by
examining the industry from all four viewpoints. From the biological perspective, the
encounters between the tour boats and the animals were described and quantified (Chapter 3;
Objective 1). I also compared the Lovina operations with international best practice (sensu
the Australian National Guidelines for Whale and Dolphin Watching 2005, Chapter 3;
Objective 2). From the social perspective, the tourists‟ and boatmen‟s experiences and
profiles were described in two separate chapters (Chapters 4 and 6, respectively; Objectives 3
and 4). Chapter 5 outlined the economic impacts of the industry on the boatmen and the
village communities to improve understanding of economic sustainability (Objective 5).
Finally, Chapter 6 examined the managerial perspective including the boatmen‟s opinions on
the management of their main livelihood (Objective 6). In this final chapter I will briefly
summarise my findings and, most importantly, discuss their implications for Lovina and the
cetacean watching tourism industry both in Bali and other parts of the world, particularly
developing countries. Figure 7.1 shows the flowchart of this chapter.
Page 205
Chapter 7 General discussion
183
Figure 7.1 Flowchart of the general discussion
Page 206
Chapter 7 General discussion
184
7.2 Synthesis of results
My examination of boat and cetacean data indicated that the biological sustainability of the
dolphin watching industry in Lovina is highly questionable (Chapter 3). A school of dwarf
spinner dolphins (approximately 10 animals per school) was usually hemmed in by at least 15
tourist vessels that were often at distances of less than 50 m from the animals. In an
encounter, the number of boats generally outnumbered the number of dwarf spinner dolphins
(median spinner-to-boat ratio = 0.8:1). Almost 100 tour boats could be observed searching for
the animals during the high tourist visitation season. Their targets, dwarf spinner dolphins
(Stenella longirostris roseiventris), were seen almost every day in predictable locations
adjacent to the villages, suggesting that this species is likely resident in the area., although a
photo-identification study is required to prove this assertion. The animals were always
travelling when first sighted in the morning, and I did not observe any resting behaviour by
the dolphins, although this may have been because of the restricted period of the day when
observations were made. The surface time of a school of dwarf spinner dolphins at this study
site was two minutes. Comparisons with the Australian regulations (Carlson 2010) and
studies from New Zealand, Tanzania and the Philippines (Constantine et al. 2004;
Christiansen et al. 2010; Sorongon et al. 2010) suggested that the boatmen‟s „behaviours of
concern‟ and crowding by boats may contribute to the constant travelling and the presumable
habituation of the dwarf spinner dolphins to tourist vessels, although more research is needed
to confirm this.
I also examined the questionnaires distributed to the tourists who attended the dolphin tours
to understand their experiences, including satisfaction level, opinions and suggestions for the
industry (Chapter 4). Dolphin watching tourism in Lovina generally attracted tertiary-
educated international visitors. Two-thirds of the dolphin tourists came from Western
Page 207
Chapter 7 General discussion
185
countries; the rest were from Asia. Tourist satisfaction ranged from low to medium. While
there was no significant difference between the average satisfaction of Western and Asian
tourists, the associated variables differed. The satisfaction of Western tourists was associated
with encounter management, their preferred number of surrounding boats and the number of
dolphins seen. Encounter management was the only variable associated with the satisfaction
of Asian tourists. Western respondents disliked the mismanagement of the dolphin tourism
(e.g., too many boats with „behaviours of concern‟ (see Chapter 3 Section 3.2.2 for
definition) and approach distances that were too close). Satisfaction was positively associated
with the willingness to recommend the tour: Western respondents who felt neutral to very
comfortable with the way their boatmen managed the dolphin encounters were more likely to
promote the tour to others. As a consequence, the low to medium satisfaction levels of
Western dolphin tourists could attract negative publicity to Lovina dolphin tourism from
word of mouth and other sources.
Given the nature of the dynamics between the boats and the cetaceans, the low to medium
visitor satisfaction level was to be expected. The analyses of impacts of this industry on the
individual boatmen and the local economy were conducted to understand the extent of
financial damage should visitors cease to join the dolphin tours (Chapter 5). The industry
attracts at least 37,000 overnight visitors per annum (~60% of the Lovina‟s overnight
tourists) who contributed up to USD 9.5 million p.a. in total direct expenditures (i.e., tickets,
accommodation, meals, transportation, communication and souvenirs). At least 46% of the
total direct expenditure was attributable to dolphin watching tourism in 2009/2010. The
boatmen have an above average income but trip fees constituted only 3% of the total income
generated by dolphin watching tourism; the remainder was spent on local businesses e.g.,
accommodation, restaurants and transport which are the substantial beneficiaries. As a
Page 208
Chapter 7 General discussion
186
consequence of the economic importance of this industry to the boatmen and the villages, the
boatmen must improve their dolphin encounter management to meet the expectations of
highly educated international visitors. Because the industry also brings significant economic
benefits to other business sectors, the sustainability of the overall industry is important to
them. Hoteliers, restaurateurs and travel agents must also be included in future management
strategies in Lovina. These beneficiaries could also assist the boatmen in improving their
service (further discussed in Section 7.4.3).
Chapter 6 addressed various issues in the industry‟s current management practices and the
processes the boatmen and my team undertook to reach common ground. My interviews with
the boatmen confirmed that the industry was essentially unregulated. The boatmen were
concerned about the industry‟s long-term sustainability, especially the encounter management
practices and other operational issues such as garbage and safety. Although the boatmen
agreed in-principle to improve their encounter management, they resisted the concept of
limiting the size of the fleet. The general challenges, opportunities and possible solutions for
Lovina and marine wildlife tourism in developing countries arising from the study are
discussed below.
7.3 Challenges and opportunities for Lovina
7.3.1 Embracing the Balinese culture
Chapter 1 described the nature of awig-awig (the traditional Balinese codification system) in
the governance of the Balinese society. Because awig-awig is essentially an agreed rule
among members of an organisation, the norms/rules of each dolphin association in Lovina
consiitute an awig-awig, which regulates various aspects of its operations ranging from
member admission, membership fee, money lending business and sanctions. Thus, it is
Page 209
Chapter 7 General discussion
187
technically possible to incorporate cetacean watching guidelines into a dolphin association‟s
awig-awig, although I did not explicitly investigate this aspect.
In Chapter 1, I also briefly discussed Tri Hita Karana as the traditional Balinese
sustainability framework. In the context of Lovina, Tri Hita Karana would require the
harmonious relationship between the people (i.e., the boatmen and the tourist) and nature
(i.e., the dolphins) to be promoted to foster the prosperity of humans (i.e., the boatmen, the
tourists and other stakeholders such as hoteliers, travel agents and restaurateurs) based on the
gratitude or responsibility to safeguard the resources that Nature/God has bestowed upon
them (referring to the relationship between human and the Divine). Inclusion of Tri Hita
Karana as a philosophical background in future discussions on better management of dolphin
watching tourism in Lovina may become an effective cultural strategy. However,
consideration of this aspect is beyond the scope of this thesis.
Nonetheless, awig-awig and Tri Hita Karana may not be applicable to all dolphin
associations in Lovina. By tradition, the terms „awig-awig‟ and „Tri Hita Karana‟ apply only
to a Balinese community that adheres to Hinduism. These concepts, therefore, are not
applicable to the Kaliasem boatmen, all of whom embrace Islam. The Kaliasem boatmen are
not original Balinese; they are descendants of the Bugis fishers in South Sulawesi (however,
they do speak fluent Balinese and respect the local cultures). Far from practising destructive
fishing that the Bugi fishers are famous for (Halim 2002), the Kaliasem fishers and boatmen
were in fact the first association to formally embrace the idea of cetacean watching
guidelines, to the extent that they proposed the three in-principle operational rules themselves
(Chapter 6 Section 6.3.4). This positive inclination may most likely be attributed to the
Kaliasem boatmen‟s main occupation as fishers. These boatmen are aware that speeding
Page 210
Chapter 7 General discussion
188
towards dolphins would just make the animals disappear. An elderly Kaliasem fisher who had
been a dolphin boatman for more than 20 years explained that „New captains like to speed
and cut through the dolphin‟s route, making the dolphins disappear‟. On the other hand,
members of the Kalibukbuk, Aneka and Banyualit associations are original Balinese and
were not fishers before joining the tourism industry. Instead, their former occupations were as
tour guides or drivers, which encouraged them to put „tourist satisfaction‟ (or at least what
they thought as factors important to tourist satisfaction) before animal welfare considerations.
7.3.2 Management practices
Would a bigger boat be better?
Management of the fleet size is not a simple matter in Lovina. Analyses in Chapter 3 (boats)
did not show a significant association between the encounter fleet size and the dwarf spinner
dolphin‟s surface time or behaviour. Comparisons with other studies and with Australian
regulations (Chapter 3) and Western respondents‟ negative attitudes towards excessive fleet
size (Chapter 4) warrant the management of fleet size. During interviews with the boatmen,
my team and I asked for their suggestions for managing the number of boats (Chapter 6).
Nine boatmen suggested limiting the number of boats to an average of 13.6 around the
dolphins (range 5-30). However, during stakeholder workshops, the boatmen did not agree to
limit the number of boats. The possible economic reasons for this reluctance were explained
in Chapter 5.
In Chapter 6, I explained the possible confusion surrounding the „number of boats‟ concept
that might have led to the boatmen‟s reluctance to manage the fleet size due to because this
term is ambiguous (Section 6.4.1). I also explored several economic incentives for reducing
daily and total fleet size in Chapter 6 (Section 6.4.1). However, encounter fleet size remains
Page 211
Chapter 7 General discussion
189
the most complicated aspect to manage in Lovina. This concern is shared by expatriates in
Lovina (mostly hoteliers, restaurateurs and shop owners) with whom I often interacted during
my stay in the village. Replacing jukungs with larger5 boats that carry more tourists was often
suggested during my informal conversations with the expatriates. This idea seemed
reasonable, because the deployment of larger-capacity boats may actually reduce encounter,
daily and total fleet sizes in Lovina.
However, increasing the size of boats could have many other consequences such as massively
reduced employment and a complete change to the nature of the experiences towards less
authentic mass tourism, which is already available in many parts of the world. Dolphin
watching tourism with a larger vessel exists elsewhere in Bali. The Bali Hai Cruises (Chapter
1 Section 1.4) is the only company that actively markets its dolphin cruise in the southern
waters of Bali, although 14 other companies occasionally take visitors to view the dolphins in
the same area. The Bali Hai Cruises operates a 12 m long Ocean Rafting (24 passengers
capacity), which explores the choppy waters around the Bukit Peninsula using three 250 HP
Yamaha engines. In terms of passenger satisfaction, the company‟s performance is better than
Lovina. With approximately 3,500 visitors in 2008/9, the average visitor satisfaction level in
Bali Hai was 8.74 out of 10 (n=5,715, see also Chapter 4 Table 4.5). Encounter fleet size in
southern Bali is small compared with Lovina. During opportunistic observations with Ocean
Rafting over 62 days, I once observed six vessels in a single encounter, although I usually
only saw two other boats in addition to Ocean Rafting.
5 For the sake of argument, „large‟ here refers to a boat larger than a jukung, or more than 10m long, but still
comfortable enough to maneuver around the cetaceans
Page 212
Chapter 7 General discussion
190
With Bali Hai Cruises in mind, the suggestion that Lovina replace the jukungs with larger
boats seems reasonable. However, several considerations make this suggestion impractical or
undesirable without further investigation:
1) Altering the dimensions of tourist boats in Lovina involves a significant amount of
funding that is unlikely to be available for all the boatmen unless external institutions
(i.e., foreign aid) are involved. Without external support, only financially-capable
boatmen would be able to convert the dimension of their boats, depriving the
financially-disadvantaged boatmen of their livelihood.
2) Funding permitted; there is no guarantee that expanding boat dimension would reduce
encounter fleet size. Instead, increased carrying capacity of the tourist vessel might
trigger an increasing encounter fleet size because of the temptation for increased
profit.
3) A possible solution to problem #2 would be limiting the encounter fleet size of the
larger vessels. This suggestion is possible if each of the larger boats is co-owned by
two to three boatmen. Although the boat dimension would be larger, the basic strategy
for the boat sharing would be similar to the strategies for shared licences (Chapter 6
Section 6.4.1).
4) The introduction of larger boats is likely to diminish the significance of jukungs in the
tour package. The dimensions of the jukung have been carefully designed for
aesthetics and balance, such that if the size were enlarged, the balance would be
disturbed. If the boatmen agreed to use larger boats, it is unlikely that they would
Page 213
Chapter 7 General discussion
191
build a larger jukung for fear of compromising the balance and the difficulty in
launching the boat from the beach. Instead, they would build ordinary boats (without
outriggers) that would require a jetty or a mooring system. These boats, although
made of wood, would lack authenticity. Such a lack of authenticity would defeat the
purpose of extending the dolphin tour to include the cultural aspects (as described in
the previous section). Mr Bahruddin (former leader of the Kaliasem dolphin
association) explained why using boats of larger dimension would be counter-
productive: “It is to conserve the traditional value of the jukung that we make
ourselves.”
The idea of a larger boat was once proposed in Lovina. A few years ago, the managers of a
local hotel attempted to operate a larger tour boat to cater for their own guests. The boatmen,
who were not previously informed, did not like the plan. They conducted a rally against the
hotel‟s decision, and eventually the hotel cancelled the plan. This case corroborates the
arguments against installing larger boats as discussed above, because in essence the boatmen
argued that they might suffer a possible loss of income and employment if the hotel‟s plan
was embraced by other hoteliers. This experience also illustrates how the failure to include
the boatmen in the decision making process would inevitably lead to project annulment. As
this section shows, replacement of the jukungs with larger boats is considered impractical and
undesirable.
Distance estimation
Despite the difficulties discussed above, indirectly managing encounter fleet size may be
possible through approach distance management. Here I would like to acknowledge the
process that the boatmen and I shared in distance estimation (see also Chapter 6 Section 6.4).
Page 214
Chapter 7 General discussion
192
During my initial conversations with the boatmen, I explained that dolphin watching
industries in other parts of the world applied a minimum approach distance of 50 m.
Although I did not suggest that this was the specific distance that should be implemented in
Lovina, many boatmen immediately objected because they considered 50 m to be too far
away for their tourists to see the dolphins properly. I did not pursue the matter further; I
realised that any code of practice would only be successful with the boatmen‟s support.
However, one day when I was conducting one of my boat follow protocols, I lent my
Bushnell digital range finder binoculars to my boatmen. I asked him to measure the distance
between our boat and another boat. He was left in awe. Until then, he had not realised that
distance perception at sea is different from distance perception on land, such that the animals
were easily observed at 50 m approach distance.
Other researchers have acknowledged the differences between terrestrial and nautical
distance estimation (Baird & Burkhart 2000). However, for this research, the experience
recounted above was very important. It was the moment when I realised that the boatmen and
I could actually work together; that the previous misunderstandings between us were mostly
due to different perceptions of scientists and seamen.
Whenever possible during the remaining days of my boat surveys in Lovina, I continued
lending my range finder binoculars. I did not manage to circulate the gear to many boatmen.
However, I witnessed how those who used the binoculars informed their colleagues that
approach distance management was actually achievable. During the government-facilitated
stakeholder workshops in Singaraja in April 2010 (Chapter 6 Section 6.3.4), three out of four
dolphin associations agreed in principle to limit their approach distance to the dolphins. I
Page 215
Chapter 7 General discussion
193
believe that the simple act of lending the boatmen my binoculars may have paved the way to
that particular agreement.
In 1994-1995, whale shark researchers in Ningaloo (Western Australia) conducted research
on the satisfaction of visitors who joined whale shark tours (Davis et al. 1997). They found
that the visitors were not very satisfied with their encounters due to the frequent fin-kicking
among snorkelers, which was triggered by the close approach distance to the shark (about one
meter away). Davis et al. (1997) then suggested the perimeter be expanded from one to three
meters to reduce the crowding of swimmers around the perimeter, less fin-kicking and higher
satisfaction rate among snorkelers. Most importantly, this strategy also resulted in less
touching and disturbance to the animals, which was the primary objective of the suggested
management revision.
The same principles can be applied in Lovina. Although during the stakeholder workshops
(Chapter 6 Section 6.3.4) the Lovina boatmen had agreed to limit the distance from the
dolphins, no definitive distance was agreed upon. If the boatmen were willing to formally
adopt a 50 m minimum approach distance, this compliance would result in a closest tour boat
perimeter of 314 m (a circle‟s perimeter formula is 2π r). The jukung‟s end-to-end length is
10 m; which means that a 314 m perimeter would allow 31 boats along the perimeter. Space
is important for making the tourists feel comfortable (Gillis et al. 1986; Yagi & Pearce 2007).
In addition, space between each boat improves the safety to both the boatmen and the
passengers (some boatmen did admit that too close an approach distance had caused some
boat collisions, Chapter 6). I suggest that one boat body length (10 m) distance be placed
between each boat. The 314 m perimeter would thus accommodate 15 boats around the
dolphins. This number is, coincidentally, similar to the average number of boatmen‟s
Page 216
Chapter 7 General discussion
194
description of an acceptable encounter fleet size (mean 13.6, range 5 to 30, n=9, see Chapter
6 Section 6.3.3). If the 50 m approach distance and one boat body length distance between
boats were adhered to, the fleet would have to split into several encounter groups of
approximately 15 boats per encounter, as opposed to aggregating just around one school of
cetaceans. If only one cetacean school were available, the boatmen could also wait for their
turn to view the animals outside the immediate circle of vessels. Thus, approach distance
management would be an indirect approach to managing encounter fleet size and viewing
duration.
7.4 A way forward for Lovina
7.4.1 Implementing a dolphin tourism code of practice in Lovina
The three in-principle agreements achieved during stakeholder meetings in Lovina and
Singaraja provide a good starting point for better management of this industry (Chapter 6).
For the benefit of this discussion, I reiterate the three principles: 1) turning off the
engine/lifting the propeller; 2) keeping the boat‟s distance from the dolphins; and 3) avoiding
cutting across the dolphin‟s route. I estimate that these agreements would need at least one
year of constant community engagement and training before they are practised by all
boatmen in Lovina.
The stakeholder meetings elaborated in Chapter 6 did not discuss the exact minimum
approach distance. Thus, this matter needs to be addressed in the future, preceded by training
the boatmen on distance estimation to obtain a collective sense of several distance scenarios
(e.g., 30 m, 40 m and 50 m). Involving a high number of boatmen will be important to create
collective understanding about estimating the distance, particularly because no boat is yet
equipped with a digital range finder.
Page 217
Chapter 7 General discussion
195
Before the boatmen can agree upon improving their encounter management, they must be
properly informed. Speed limit estimation can be included in the distance estimation training
to enable the boatmen to attribute the sound of their engines to a particular speed. In a way
similar to the agreement on limiting approach distance, an understanding of the impacts of a
particular speed on the animals may pave the way for an agreement about speed limits.
Considerations behind the elimination of „behaviours of concern‟ must be explained properly
during training. The boatmen must receive sufficient information about why certain approach
strategies are detrimental to the dolphins.
Given that no boat is equipped with digital range finders or speedometers, investment on
tools such as a Global Positioning Systems (GPS) and digital laser range finders for each
dolphin association could be beneficial for ongoing training. However, the association
coordinators must be committed to regularly circulating these tools among their members.
Once the three in-principle agreements are in place and practised, the next step in Lovina
would be to expand the agreements into a more comprehensive dolphin tourism code of
practice. Once again, internal and combined association meetings should be conducted to
report on the progress of boatmen training and whether the three agreements could be
expanded further. An example of a dolphin tourism code of practice that might be developed
from the three in-principle agreements is as follows:
1) Turn off the engine/lift the propeller while waiting for the cetaceans to surface
and in the presence of the animals;
Page 218
Chapter 7 General discussion
196
2) Keep the boat at a minimum active distance of [insert agreed number] from the
dolphins (only for boats that cannot turn off their engines for practical reasons,
e.g., the old starter rope or to avoid seasickness);
3) Limit the boat speed to [insert agreed number] knots;
4) Avoid the following behaviours: a) cutting across the dolphin‟s route; b)
following the cetacean school from behind; and c) the J approach (the „boat
blocks the path as it goes in front of the individual or the pod‟ (Sorongon et al.
2010, p. 84));
5) Limit the encounter fleet size of [insert agreed number] boats around the
perimeter of the No Approach Zone at any given time; and
6) Keep the interaction time to a maximum of [insert agreed number] minutes.
During the meetings, each association could be asked to codify the agreed guidelines in their
internal rules or awig-awig (sensu Chapters 1 and 2) Inter-association meetings could also
be conducted to communicate these codifications. During such meetings, the associations
could assign a person or two as a „sheriff‟ who would monitor the dolphin tourism code of
practice implementation. A possible way to fund the monitor is described in Section 7.4.2.
The code of practice could be adopted at national level by applying it to emerging cetacean
watching sites (such as in Raja Ampat and Kaimana, West Papua). With the consent of the
boatmen, the local Lovina guidelines could also be legally codified at regency level. It may
take a few years, but hopefully Indonesia will eventually adopt national guidelines or laws on
cetacean watching tourism. Figure 7.2 describes a staged approach for the implementation of
a dolphin tourism code of practice in Lovina and its strategies for adaptation at local and
Page 219
Chapter 7 General discussion
197
national level and incorporation into legal codification. Changes like this are not immediate; a
sense of ownership and a broader acceptance by stakeholders in these processes is important.
Figure 7.2 Staged approach for a dolphin tourism code of practice in Lovina and the
adaptation strategy at national level
7.4.2 Economic incentives
Economic incentives will play an important role in creating a better managed dolphin
watching industry in Lovina. For instance, an incentive could be created for every association
that agrees to codify the guideline in its internal rules or awig-awig. These associations could
be granted new starter ropes for all members to encourage turning off the engines in the
presence of dolphins without experiencing engine disruption afterwards because of fragile old
starter ropes (see Chapter 6 Section 6.3.4). Additional funding could be directed to providing
the association with several laser range finders and GPSs to be circulated among members for
practical distance and speed limit estimation. Funding6 for such endeavours might be sought
6 It will require approximately $19,000 as follows:
$600 x 4 association x 5 range finders per association = $12,000
Page 220
Chapter 7 General discussion
198
from Indonesia-based international non-governmental organisations that are interested in
marine conservation.
Economic incentives could be introduced to reduce the daily fleet size. In Chapter 6 (Section
6.4.1), I discussed several management tools for regulating the daily fleet size (i.e., shared
licences and tradeable daily permits) and total fleet size; those arguments are not reiterated
here. The daily fleet size could also be managed by increasing the tour admission fee (ticket)
over several stages. In the first stage, the daily fleet size would be limited to an agreed
number by way of tradeable daily permits or a rostering system (Chapter 6 Section 6.4.1),
making a boatman unlikely to take tourists over two consecutive days. Tour admission fees
could be raised to offset the boatman‟s possible income reduction. In the second stage, a
rigorous willingness-to-pay study (see e.g., Walpole et al. 2001 for a study on the
willingness-to-pay of tourists in Komodo National Park in eastern Indonesia) and consent
from all associations would precede the raising of admission fees. The last stage would be the
implementation of increased admission fees with a price discrimination policy, i.e., the higher
fees would only apply to foreign tourists. Domestic tourists and expatriates would be
exempted from the fee rise. In theory, a price discrimination policy is useful for encouraging
the participation of tourists from lower income classes (Walpole et al. 2001; Cohen 2002).
However, Walpole et al. (2001) warned against too large an increase in admission fees as
they could cause a decline in visitation. Thus, any rise of tour admission fees in Lovina
should be calculated as the optimum increase that would still benefit the boatmen (who would
otherwise have experienced reduced income) while heeding the result of the willingness-to-
pay study and the consent of the boatmen.
$100 x 4 association x 5 GPS per association = $2,000
Starter rope for 180 boats (3-4 ropes per boat) = $5,000
Page 221
Chapter 7 General discussion
199
A conservation fund could be included in the willingness-to-pay study. The study in the
Komodo National Park suggested that setting aside a portion of the hypothetical increased fee
for conservation initiatives would encourage visitors to pay a higher entrance fee (Walpole et
al. 2001). Tourists‟ willingness to pay into a conservation fund could be included in the
willingness-to-pay study, perhaps with a particular mention that the funding would be used,
for example, to pay a designated person to monitor the implementation of the dolphin tourism
code of practice in Lovina (see Section 7.4.2).
7.4.3 Vision of sustainable dolphin watching tourism in Lovina
Figure 7.3 summarises possible management steps that could be implemented with a view to
achieving sustainable dolphin watching industry in Lovina. The five elements are: 1) the
development of a dolphin tourism code of practice; 2) encouraging involvement of hoteliers,
restaurateurs and travel agents; 3) management of daily and total fleet size (see Chapter 6); 4)
expansion of tours by promoting jukung and other aspects of the tours; and 5) research.
Various research components employing the quadruple bottom line and prism of
sustainability concepts were used to formulate recommendations in this research. It is thus
proper that the same framework should be used again to conduct research that will inform
future management decisions (see last section of this chapter).
Page 222
Chapter 7 General discussion
200
Figure 7.3 Management steps towards sustainable dolphin watching tourism in Lovina
Figure 7.4 Management options to improve the dolphin watching industry in Lovina (each
number represents a management option that directly links two elements of sustainability)
Page 223
Chapter 7 General discussion
201
The sustainability framework of this thesis was visually represented in Chapter 1 (Figure
1.3). I now present my results in a summary diagram (Figure 7.4) which is very similar to
Figure 1.3. As discovered in Chapter 5, „other stakeholders‟ in Figure 7.4 now specifically
include non-boatmen stakeholders who also receive benefits from the industry, e.g., hoteliers,
restaurateurs, travel agents etc. The locals who work for these businesses are also included.
Each number in Figure 7.4 represents a management option that directly links two elements
of sustainability, although it would eventually benefit other elements as well.
7.5 Insights for developing countries
To my knowledge, this project is the first to examine the sustainability of cetacean watching
tourism (either cetacean watching or swim-with-cetaceans) in a developing country from the
viewpoints of the quadruple bottom line and the prism of sustainability concepts (see Chapter
1). Despite the importance of sound biological data collection and interpretation of those data
(the problems of which were discussed in Chapter 3), more research is needed to understand
the human dimensions of cetacean tourism, especially in developing countries. Research on
the tourist experience (e.g., tourist satisfaction and opinions – Chapter 4) coupled with
research on the economic (Chapter 5) and managerial aspects of the industry (Chapter 6) are
likely to be significantly cheaper than ecological research. These types of research are also
likely to be seen as more relevant to local stakeholders. Involving social scientists in cetacean
tourism research will greatly increase its potential to influence managers and decision
makers.
Throughout this research project, I have demonstrated that the quadruple bottom line and the
prism of sustainability concepts are suitable frameworks for conservation efforts that are in
Page 224
Chapter 7 General discussion
202
line with the Precautionary Principle (see Chapter 1). These frameworks are particularly
suited, but not limited, to developing countries. Biological or ecological surveys are very
important but typically require significant funding, local capacity and infrastructure, long
term data collection and trained observers (Aragones et al. 1997). As I experienced during my
data collection, those prerequisites can be very challenging in developing countries.
Consequently, a team of cross-disciplinary researchers or a project with an cross-disciplinary
approach would be more effective in addressing the research question as opposed to a project
that applied one particular approach (Kriebel et al. 2001). Developing countries often do not
have strong environmental legislation and compliance (Smith et al. 2003; Laurance 2004).
Accordingly, local support and involvement become essential factors in sound management
intervention.
Cross-disciplinary environmental management coursework is an increasingly popular niche
among postgraduate students in Indonesia. Such programs are offered by many universities,
chiefly among them the University of Indonesia and the Gadjah Mada University, two of the
largest and oldest universities in the country. Launched in 1982, the University of Indonesia
postgraduate environmental science program includes courses on environmental economics,
human ecology and regional economic cooperation (University of Indonesia 2009). The
postgraduate environmental management program of the Gadjah Mada University includes
the socio-cultural aspects of environment, environmental economics and environmental law
and institutions (University of Gadjah Mada 2008). Young scientists produced by these
postgraduate programs will be useful for any cross-disciplinary environmental research in
Indonesia.
Cross-disciplinary research seems to be an increasingly accepted concept among Asian
scientists. During a regional collaborative workshop on threats to Asian coastal cetaceans in
Page 225
Chapter 7 General discussion
203
Kuching, Malaysia in February 2011, I became aware of a heightened appreciation among
Asian marine mammal scientists who combined cross-disciplinary approaches in their
projects. Out of 20 participants, five of them (including myself) presented results of
integrated research projects, or at least projects that included interviews or questionnaires in
their components. Hopefully, this trend will be adopted by marine mammal researchers in
other parts of the world.
During my data collection in Lovina, I also witnessed the growing interest among young staff
members of local government agencies (particularly the local Marine and Fisheries Affairs
office) in assisting our line transect surveys. This new trend has been witnessed elsewhere in
Indonesia (Benjamin Kahn, 2011, pers.comm). This encouraging phenomenon promises more
intrinsically-driven involvement from government staff, as opposed to the traditional top-
down approach where officers were involved in a research project because of instructions
from their supervisors. Whether this trend emerges in other developing countries remains to
be seen and encouraged.
7.6 Future research for Lovina
Several research components and participatory action research approaches are recommended
to assist management processes in Lovina. Research suggestions #1-3 below are relatively
low-budget which may be co-funded by local or national government. Research suggestions
#4-7 require a considerable budget not necessarily available through local or national
government and might require the involvement of foreign aid agencies.
1) Visitor experience surveys to examine differences in experience and satisfaction
during and after my PhD project, whether the three in-principle agreements were
Page 226
Chapter 7 General discussion
204
implemented and whether the inclusion of cultural tourism in the dolphin watching
tour is likely to be feasible;
2) Economic surveys to examine direct expenditures, multiplier, willingness-to-pay extra
for the trip to reduce daily fleet size and for conservation efforts, the total economic
values (use and non-use values) of the local dolphin populations and the feasibility of
tradeable daily permit and shared-licences;
3) Participatory action research to guide the establishment and compliance with the
guidelines;
4) Photo-identification and mark-recapture to understand the spinner dolphin‟s
population size and residency pattern (both sub-species if possible) and whether the
boats target the same dolphins every day (the consequences of violating the
assumption of homogeneous capture probabilities would have to be considered in the
analysis);
5) Aerial or vessel surveys and habitat modelling to provide a regional context for other
sites in Balinese waters where cetaceans predictably occur close to shore. If other
habitats supporting high densities of spinner dolphins are found, they could serve as
control units for the Lovina situation. Management interventions might also be
required to pre-empt unsustainable tourism being developed at such sites.
6) The examination of dolphin school‟s trajectory changes that might be attributed to the
presence of tour boats
7) Research on the oceanography along the Balinese coast may identify the nature and
extent of bio-physical characteristics that make the waters off Lovina a good habitat
for spinner dolphins and other cetaceans.
Page 227
Chapter 7 General discussion
205
The boatmen and government agencies must always be informed and, whenever possible,
involved in these research projects to increase support and a sense of ownership in the
resulting management decisions. In the end, the benefit of these research projects must be
directed at the communities as the primary users and the cetaceans as the primary target.
7.7 Concluding remarks
Over the past four years, through this research I have attempted to obtain a comprehensive
understanding of the sustainability of dolphin watching tourism in Lovina. My supervisors
and I designed the research based on the four elements of sustainability as covered by the
quadruple bottom line and the prism of sustainability theoretical frameworks. Looking back,
this decision was appropriate because it has provided us with a wealth of information from a
rising tourism industry in a relatively unexplored location. I conclude that the biological
sustainability of the dolphin watching industry in Lovina is questionable and the tourists are
not very satisfied. However, because dolphin tourism makes an essential economic
contribution to the boatmen and the villages, the industry must be sustainably managed with
the consent and involvement of all boatmen and other supporting stakeholders. Despite initial
concerns over its sustainability, this industry could be an exemplar of community-based
tourism in a developing country which is successfully co-managed from multiple
perspectives, including the human dimension. The challenge remains to ensure that this
sustainable future is brought to fruition at Lovina.
-xxx-
Page 228
206
Reference
Aden, J. 2001, Decentralization of Natural Resource Sectors in Indonesia: Opportunities and
Risks, World Bank
Akama, J. S. 1996, 'Western environmental values and nature-based tourism in Kenya',
Tourism Management, vol. 17, no. 8, pp. 567-574.
Akama, J. S. & Kieti, D. M. 2003, 'Measuring tourist satisfaction with Kenya's wildlife safari:
a case study of Tsavo West National Park', Tourism Management, vol. 24, no. 1, pp.
73-81.
Alder, J., Sloan, N. A. & Uktolseya, H. 1994, 'A comparison of management planning and
implementation in three Indonesian Marine Protected Areas', Ocean and Coastal
Management, vol. 24, no. 3, pp. 179-198.
Allen, S., Smith, H., Waples, K. & Harcourt, R. 2007, 'The voluntary code of conduct for
dolphin watching in Port Stephens, Australia: is self-regulation an effective
management tool?', Journal of Cetacean Resource Management, vol. 9, no. 2, pp.
159-166.
Allenby, B., Allen, D. & Davidson, C. 2007, 'Sustainable Engineering: From Myth to
Mechanism', Environmental Quality Management, vol. Autumn 2007, pp. 17-26.
Altmann, J. 1974, 'Observational study of behavior: Sampling methods', Behaviour, vol. 49,
no. 3-4, pp. 227-265.
Andersson, K. P., Gibson, C. C. & Lehoucq, F. 2006, 'Municipal politics and forest
governance: Comparative analysis of decentralization in Bolivia and Guatemala',
World Development, vol. 34, no. 3, pp. 576-595.
Aragones, L. V., Jefferson, T. A. & Marsh, H. 1997, 'Marine mammal survey techniques
applicable in developing countries.', Asian Marine Biology, vol. 14, pp. 15-39.
Arsyad, L. 2005, 'An Assessment of Microfinance Institution Performance: The Importance
of Institutional Environment', Gadjah Mada International Journal of Business, vol. 7,
no. 3, pp. 391-427.
Babad Bali, 2000, Tri Hita Karana in Hinduism (Tri Hita Karana dalam Agama Hindu)
[Online], Babad Bali, Available:
http://www.babadbali.com/canangsari/trihitakarana.htm [27 September 2007].
Baird, R. W. & Burkhart, S. M., 2000, Bias and variability in distance estimation on the
water: implications for the management of whale watching [Online], International
Whaling Commission, Available:
http://actionstudio.org/home/orca/baird_distance_estimation.pdf [24 April 2007].
Baker, K. & Coulter, A. 2007, 'Terrorism and Tourism: The Vulnerability of Beach Vendors'
Livelihoods in Bali ', Journal of Sustainable Tourism, vol. 15, no. 3, pp. 249-266.
Bali Discovery Tours, 2011, Bali Targeting 2.6–2.8 Million Foreign Tourists in 2011
[Online], Bali Discovery Tours, Available:
http://www.balidiscovery.com/messages/message.asp?Id=6736 [1 June 2011].
Barker, T., Putra, D. & Wiranatha, A. 2006, 'Authenticity and Commodification of Balinese
Dance Performances', in Cultural Tourism in a Changing World: Politics,
Participation and (Re)presentation, eds M. K. Smith & M. Robinson, Channel View
Publications, Clevedon, pp. 215-224.
Barlow, J., Gerrodette, T. & Forcada, J. 2001, 'Factors affecting perpendicular sighting
distances on shipboard line-transect surveys for cetaceans', Journal of Cetacean
Resource Management, vol. 3, no. 2, pp. 201-212.
Barnes, J., Burgess, J. & Pearce, D. 1992, 'Wildlife Tourism', in Economics for the Wilds:
Wildlife, Wildlands, Diversity and Development, eds T. M. Swanson & E. Barbier,
Earthscan Publications Ltd, London, pp. 136-151.
Page 229
207
BBC 2002, Bali: Tourist magnet unused to violence in BBC News World Edition, BBC
News, London.
Bejder, L., Dawson, S. M. & Harraway, J. A. 1999, 'Responses by Hector's Dolphins to Boats
and Swimmers in Porpoise Bay, New Zealand', Marine Mammal Science, vol. 15, no.
3, pp. 738-750.
Bejder, L. & Samuels, A. 2003, 'Evaluating the Effects of Nature-based Tourism on
Cetaceans', in Marine Mammals: Fisheries, Tourism and Management Issues, eds N.
Gales, M. Hindell & R. Kirkwood, CSIRO Publishing, Melbourne, pp. 229-256.
Bejder, L., Samuels, A., Whitehead, H., Gales, N., Mann, J., Connor, R., Heithaus, M.,
Watson-Capps, J., Flaherty, C. & Krutzen, M. 2006, 'Decline in Relative Abundance
of Bottlenose Dolphins Exposed to Long-Term Disturbance', Conservation Biology,
vol. 20, no. 6, pp. 1791-1798.
Bendell, J. & Kearins, K. 2005, 'The political bottom line: the emerging dimension to
corporate responsibility for sustainable development', Business Strategy and the
Environment, vol. 14, no. 6, pp. 372-383.
Berghan, J., Algie, K. D., Stockin, K. A., Wiseman, N., Constantine, R., Tezanos-Pinto, G. &
Mourao, F. 2008, 'A preliminary photo-identification study of bottlenose dolphin
(Tursiops truncatus) in Hauraki Gulf, New Zealand', New Zealand Journal of Marine
and Freshwater Research, vol. 42, pp. 465-472.
Berkmoes, R. V., Skolnick, A. & Carroll, M. 2009, Lonely Planet Bali & Lombok, Lonely
Planet Publichations Pty Ltd, Melbourne.
Berrow, S. D. & Holmes, B. 1999, 'Tour boats and dolphins: A note on quantifying the
activities of whalewatching boats in the Shannon estuary, Ireland', Journal of
Cetacean Resource Management, vol. 1, no. 2, pp. 199-204.
Beyer, H. L., 2004, Hawth's Analysis Tools for ArcGIS [Online], SpatialEcology.com,
Available: http://www.spatialecology.com/htools. [5 April 2011].
Birtles, A., Valentine, P. & Curnock, M. 2001, Tourism based on free-ranging marine
wildlife: opportunities and responsibilities: CRC for Sustainable Tourism: Wildlife
Tourism Research Series Report No.11, CRC Tourism, Gold Coast Australia.
Birtles, A., Valentine, P., Curnock, M., Arnold, P. & Dunstan, A. 2002a, Incorporating
visitor experiences into ecologically sustainable dwarf minke whale tourism in the
northern Great Barrier Reef, CRC Reef Research Centre Technical Report No 42,
CRC Reef Research Centre Ltd, Townsville.
Birtles, R. A., Arnold, P. W. & Dunstan, A. 2002b, 'Commercial Swim Programs With Dwarf
Minke Whales On The Northern Great Barrier Reef, Australia: Some Characteristics
Of The Encounters With Management Implications', Australian Mammalogy, vol. 24,
pp. 23-28.
BPS, 2009a, Gross Regional Domestic Product (GRDP) of Bali Province at Current Market
Prices by Industrial Origin, 2006 - 2008 (million rupiahs) [Online], Bali Statistical
Buerau, Available:
http://bali.bps.go.id/tabeldetail.php?ed=51001101&od=11&rd=&id=11 [22 February
2010].
BPS, 2009b, Number of Foreign Visitors Arriving Directly by Nationality to Bali, 2006 -
2008 [Online], Bali Statistical Buerau Available:
http://bali.bps.go.id/tabeldetail.php?ed=51000802&od=8&rd=&id=8 [22 February
2010].
BPS, 2011, Number of Population Aged 15 Years and Over Who Worked During Previous
Week by Industrial Origin and Sex in Bali Province, 2008 [Online], Bali Statistical
Buerau, Available:
Page 230
208
http://bali.bps.go.id/tabeldetail.php?ed=51000302&od=3&rd=&id=3 [15 January
2011].
BPS Buleleng 2009, The 2008 Gross Domestic Regional Product of Districts in Buleleng
Regency (Indonesian edition), Buleleng Statistical Bureau Singaraja.
Brownell, R. & Oosthuizen, H., 2004, Report of the Workshop on the Science for Sustainable
Whalewatching [Online], International Whaling Commission, Available:
http://www.iwcoffice.org/_documents/sci_com/workshops/WW_Workshop.pdf [19
February 2010].
Buckland, S. T., Anderson, D. R., Burnham, K. P., Laake, J. L., Borchers, D. L. & Thomas,
L. 2004, Introduction to Distance Sampling, Oxford University Press, New York.
Caelli, K., ray, L. & Mill, J. 2003, ''Clear as Mud': Toward Greater Clarity in Generic
Qualitative Research', International Journal of Qualitative Methods, vol. 2, no. 2, pp.
1-13.
Campbell, L. & Smith, C. 2006, 'What Makes Them Pay? Values of Volunteer Tourists
Working for Sea Turtle Conservation', Environmental management, vol. 38, no. 1, pp.
84-98.
Carlson, C., 2004, A Review of Whale Watch Guidelines and Regulations Around the World:
version 2004 [Online], International Whaling Commission, Available:
http://www.iwcoffice.org/_documents/sci_com/WWregsApril03.pdf [24 April 2007].
Carlson, C. 2010, A review of whale watch guidelines and regulations around the world
(version 2009), International Whaling Commission, Maine.
Carr, A. J. L. 2002, Grass roots and green tape : principles and practices of environmental
stewardship, Federation Press, Sydney.
Ceballos-Lascuráin, H. 1996, Tourism, ecotourism, and protected areas: the state of nature-
based tourism around the world and guidelines for its development, IUCN, Gland,
Switzerland and Cambridge, UK.
Chen, C.-L. 2011, 'From catching to watching: Moving towards quality assurance of
whale/dolphin watching tourism in Taiwan', Marine Policy, vol. 35, pp. 10-17.
Chen, C.-M., Chen, S. H. & Lee, H. T. 2010, 'The destination competitiveness of Kinmen's
tourism industry: exploring the interrelationships between tourist perceptions, service
performance, customer satisfaction and sustainable tourism', Journal of Sustainable
Tourism, vol. 99999, no. 1, pp. 1 - 18.
Choi, T. Y. & Chu, R. 2000, 'Levels of satisfaction among Asian and Western travellers', The
International Journal of Quality & Reliability Management, vol. 17, no. 2, p. 116.
Christiansen, F., Lusseau, D., Stensland, E. & Berggren, P. 2010, 'Effects of tourist boats on
the behaviour of Indo-Pacific bottlenose dolphins off the south coast of Zanzibar',
Endangered Species Research, vol. 11, pp. 91-99.
Cisneros-Montemayor, A. M., Sumaila, U. R., Kaschner, K. & Pauly, D. 2010, 'The global
potential for whale watching', Marine Policy, vol. 34, no. 6, pp. 1273-1278.
Clason, D. L. & Dormody, T. J. 1994, 'Analyzing Data Measured by Individual Likert-type
Items', Journal of Agricultural Education, vol. 35, no. 4, pp. 31-35.
Cohen, E. 2002, 'Authenticity, Equity and Sustainability in Tourism', Journal of Sustainable
Tourism, vol. 10, no. 4, pp. 267 - 276.
Cohn, J. P. 1988, 'Halting the Rhino's Demise', Bioscience, vol. 38, no. 11, pp. 740-744.
Constantine, R. 2001, 'Increased avoidance of swimmers by wild bottlenose dolphins
(Tursiops truncatus) due to long-term exposure to swim-with-dolphin tourism',
Marine Mammal Science, vol. 17, no. 4, pp. 689-702.
Constantine, R., Brunton, D. H. & Dennis, T. 2004, 'Dolphin-watching tour boats change
bottlenose dolphin (Tursiops truncatus) behaviour', Biological Conservation, vol.
117, pp. 299-307.
Page 231
209
Corkeron, P. J. 2004, 'Whale Watching, Iconography and Marine Conservation',
Conservation Biology, vol. 18, no. 3, pp. 847-849.
Courbis, S. 2007, 'Effect of Spinner Dolphin Presence on Level of Swimmer and Vessel
Activity in Hawai'ian Bays', Tourism in Marine Environments, vol. 4, no. 1, pp. 1-14.
Courbis, S. & Timmel, G. 2009, 'Effects of vessels and swimmers on behavior of Hawaiian
spinner dolphins (Stenella longirostris) in Kealake„akua, Honaunau, and Kauhako
bays, Hawai„i', Marine Mammal Science, vol. 25, no. 2, pp. 430-440.
Crowther, D. & Rayman-Bacchus, L. 2004, Perspectives on Corporate Social Responsibility,
Ashgate Publishing, Ltd., Aldershot.
Cultural and Tourism Agency Buleleng 2009, Directory of hotels, home stays, restaurants
and bars in Buleleng Regency in 2009, Cultural and Tourism Agency Buleleng,
Singaraja.
Curnock, M. 2011, Mechanisms for assessing the sustainability of swim-with-whales tourism
in the Great Barrier Reef, PhD thesis. School of Business, James Cook University,
Townsville.
Currey, R. J. C., Dawson, S. M., Slooten, E., Schneider, K., Lusseau, D., Boisseau, O. J.,
Haase, P. & Williams, J. A. 2009, 'Survival rates for a declining population of
bottlenose dolphins in Doubtful Sound, New Zealand: an information theoretic
approach to assessing the role of human impacts', Aquatic Conservation: Marine and
Freshwater Ecosystems, vol. 19, no. 6, pp. 658-670.
Curtin, S. 2006, 'Swimming with dolphins: a phenomenological exploration of tourist
recollections', International Journal of Tourism Research, vol. 8, no. 4, pp. 301-315.
Curtin, S. & Wilkes, K. 2007, 'Swimming with captive dolphins: current debates and post-
experience dissonance', International Journal of Tourism Research, vol. 9, no. 2, pp.
131-146.
Dalziel, P., Matunga, H. & Saunders, C. 2006, 'Cultural well-being and local government:
Lessons from New Zealand', Australasian Journal of Regional Studies, vol. 12, no. 3,
pp. 267-280.
Davidson, J. S. & Henley, D. (eds) 2007, The Revival of Tradition in Indonesian Politics: The
deployment of adat from colonialism to indigenism, Routledge, New York.
Davis, D., Banks, S., Birtles, A., Valentine, P. & Cuthill, M. 1997, 'Whale sharks in Ningaloo
Marine Park: managing tourism in an Australian marine protected area', Tourism
Management, vol. 18, no. 5, pp. 259-271.
Davis, R. E. & Elder, K., 2002, Application of Classification and Regression Trees: Selection
of Avalanche Activity Indices at Mammoth Mountain [Online], Avalanche org,
Available:
http://www.avalanche.org/~moonstone/issw%2094%27/application%20of%20classifi
cation%20and%20regression%20trees-
%20selection%20of%20avalanche%20activity%20indices%20at%20mammoth%20m
ountain.htm [29 March 2010].
De'ath, G. 2002, 'Multivariate Regression Trees: A New Technique for Modeling Species-
Environment Relationships', Ecology, vol. 83, no. 4, pp. 1105-1117.
De'ath, G. & Fabricius, K. E. 2000, 'Classification and Regression Trees: A Powerful Yet
Simple Technique for Ecological Data Analysis', Ecology, vol. 81, no. 11, pp. 3178-
3192.
Delfour, F. 2007, 'Hawaiian spinner dolphins and the growing dolphin activity in Oahu',
Journal of Marine Biology Association of the United Kingdom, vol. 87, no. 1, pp.
109-112.
Page 232
210
Department of the Environment and Water Resources Australia 2005, Australian National
Guidelines for Whale and Dolphin Watching, Department of the Environment and
Water Resources, Canberra.
Dharmaratne, G. S., Yee Sang, F. & Walling, L. J. 2000, 'Tourism potentials for financing
protected areas', Annals of Tourism Research, vol. 27, no. 3, pp. 590-610.
Duffield, B. S. 1982, 'Tourism: the measurement of economic and social impact', Tourism
Management, vol. 3, no. 4, pp. 248-255.
Duffus, D. A. & Dearden, P. 1990, 'Non-Consumptive Wildlife-Oriented Recreation: A
Conceptual Framework.', Biological Conservation, vol. 53, no. 3, pp. 213-231.
Duprey, N. M. T., Weir, J. S. & Würsig, B. 2008, 'Effectiveness of a voluntary code of
conduct in reducing vessel traffic around dolphins', Ocean & Coastal Management,
vol. 51, no. 8-9, pp. 632-637.
Durden, C. & Pech, R. 2006, 'The increasing cost of corporate governance: decision speed-
bumps for managers', Corporate Governance, vol. 6, no. 1, pp. 84-95.
Dwyer, L., Forsyth, P., Madden, J. & Spurr, R. 2000, 'Economic Impacts of Inbound Tourism
under Different Assumptions Regarding the Macroeconomy', Current Issues in
Tourism, vol. 3, no. 4, pp. 325 - 363.
Eagles, P. F. J. 1992, 'The travel motivations of Canadian ecotourists', Journal of Travel
Research, vol. 31, no. 3, pp. 3-7.
Elkington, J. 1997, Cannibals with Forks: the triple bottom line of 21st Century business,
Capstone Publishing Ltd., Oxford.
Elkington, J. 2004, 'Enter the Triple Bottom Line', in The triple bottom line, does it all add
up?: assessing the sustainability of Business and CSR, eds A. Henriques & J.
Richardson, Earthscan, London, pp. 1-16.
Ellerman, A. 2005, 'A Note on Tradeable Permits', Environmental and Resource Economics,
vol. 31, no. 2, pp. 123-131.
Environmental News Service, 2004, China Prepares for Panda Tourism [Online],
Environmental News Service, Available: http://www.ens-
newswire.com/ens/aug2004/2004-08-26-02.asp [5 April 2007].
Evacitas, F. C. 2005, 'Impact of Whalewatching on the Cetaceans and Coastal Populations in
Bais City, Philippines', in Sustainable Tourism: Challenges in the Philippines, ed. R.
B. A. Alampay, Philippine APEC Study Center Network (PASCN) & Philippine
Institute for Development Studies (PIDS), Makati City, pp. 205-237.
Faraway, J. J. 2006, Extending the Linear Model with R, Chapman & Hall/CRC, Florida.
Field, A. 2009, Discovering Statistics using SPSS (Third Edition), Sage Publications Ltd,
London.
Fowler, H. W. & Fowler, F. G. (eds) 1979, Consise Oxford Dictionary of Current English,
8th impression edn, Clarendon Press, Oxford.
France, L. (ed.) 2002, Sustainable Tourism, Earthscan Publications Ltd., London.
Fritz, R. G., Konecny, M. & Stoucas, P. D. 1984, 'Tourism expenditure model -- a functional
planning and policy-making tool', Tourism Management, vol. 5, no. 2, pp. 110-117.
Garrod, B. & Fennell, D. A. 2004, 'An Analysis of Whalewatching Codes of Conduct ',
Annals of Tourism Research, vol. 31, no. 2, pp. 334-352.
Geertz, C. 1972, 'The Wet and the Dry: Traditional Irrigation in Bali and Morocco', Human
Ecology, vol. 1, no. 1, pp. 23-39.
Gill, J. A., Norris, K. & Sutherland, W. J. 2001, 'Why behavioural responses may not reflect
the population consequences of human disturbance', Biological Conservation, vol. 97,
no. 2, pp. 265-268.
Gillis, A. R., Richard, M. A. & Hagan, J. 1986, 'Ethnic Susceptibility to Crowding: An
Empirical Analysis', Environment and Behaviour, vol. 18, no. 6, pp. 683-706.
Page 233
211
Gjertsen, H. & Niesten, E. 2010, 'Incentive-based Approaches in Marine Conservation:
Applications for Sea Turtles', Conservation and Society, vol. 8, no. 1, pp. 5-14.
Gouyon, A. (ed.) 2005, The Natural Guide to Bali, Bumi Kita Foundation, Denpasar.
Grafton, R. Q. 1996, 'Individual transferable quotas: theory and practice', Reviews in Fish
Biology and Fisheries, vol. 6, no. 1, pp. 5-20.
Habershon, N. 1993, 'Metaplan: Achieving two-way communications', Journal of European
Industrial Training, vol. 17, no. 7, pp. 8-14.
Halim, A. 2002, 'Adoption of cyanide fishing practice in Indonesia', Ocean & Coastal
Management, vol. 45, no. 4-5, pp. 313-323.
Hall, D. G. E. 1981, A History of Southeast Asia (4th Edition), Palgrave Macmillan.
Hanan, M. & Karp, P. 1989, Customer Satisfaction, Amacom, New York.
Harwood, L. A., Innes, S., Norton, P. & Kingsley, M. C. S. 1996, 'Distribution and
abundance of beluga whales in the Mackenzie estuary, southeast Beaufort Sea, and
west Amundsen Gulf during late July 1992', Canadian Journal of Fisheries and
Aquatic Sciences, vol. 53, no. 10, pp. 2262-2273.
Hastie, G. D., Wilson, B., Tufft, L. H. & Thompson, P. M. 2003, 'Bottlenose dolphins
increase breathing synchrony in response to boat traffic', Marine Mammal Science,
vol. 19, no. 1, pp. 74-084.
Higginbottom, K. 2004, Wildlife Tourism: Impacts, Management and Planning, Common
Ground Publishing, Melbourne.
Higham, J. E. S. & Carr, A. M. 2003, 'Sustainable Wildlife Tourism in New Zealand: An
Analysis of Visitor Experiences', Human Dimensions of Wildlife: An International
Journal, vol. 8, no. 1, pp. 25 - 36.
Horrigan, B. 2002, 'Fault lines in the intersection between corporate governance and social
responsibility', UNSW Law Journal, vol. 25, no. 2, pp. 515-555.
Hoyt, E. 2001, Whale Watching 2001: Worldwide tourism numbers, expenditures, and
expanding socioeconomic benefits, International Fund for Animal Welfare, Yarmouth
Port, MA, USA.
Hughes, P. 2001, 'Animals, values and tourism -- structural shifts in UK dolphin tourism
provision', Tourism Management, vol. 22, no. 4, pp. 321-329.
Inayatullah, S. 2005, 'Spirituality as the fourth bottom line?', Futures, vol. 37, pp. 573-579.
Indoregulation, 2005, Indonesian Regulations [Online], Indoregulation, Available:
www.indoregulation.com [May 3rd, 2005].
IUCN, 2010, Stenella longirostris [Online], IUCN Red List of Threatened Species,
Available: http://www.iucnredlist.org/apps/redlist/details/20733/0 [9 January 2011].
IWC, 2009, Report of the Intersessional Correspondence Group on Whalewatching
(Argentina, Australia, Brazil, Mexico and South Africa), submitted to the IWC61
Conservation Committee [Online], International Whaling Commission, Available:
http://www.iwcoffice.org/_documents/commission/IWC61docs/61-CC9.pdf [19
February 2010].
Jin, Q. 2009, 'A comparison of tourism crowding management between tourism sites in
Cairns and Xi'an: based on tourism carrying capacity assessment', James Cook
University.
Joffe, H. & Yardley, L. 2004, 'Content and Thematic Analysis', in Research methods for
clinical and health psychology, eds D. Marks & L. Yardley, Sage, London, pp. 56-68.
Johannes, R. E. 1998, 'The case for data-less marine resource management: examples from
tropical nearshore finfisheries', Trends in Ecology & Evolution, vol. 13, no. 6, pp.
243-246.
Kadt, E. d. 1992, 'Making the Alternative Sustainable: Lessons from Development for
Tourism', in Tourism alternatives: potentials and problems in the development of
Page 234
212
tourism, eds V. E. Smith & W. R. Eadington, University of Pennsylvania Press,
Philadelphia, pp. 47-87.
Karczmarski, L., Würsig, B., Gailey, G., Larson, K. W. & Vanderlip, C. 2005, 'Spinner
dolphins in a remote Hawaiian atoll: social grouping and population structure',
Behavioral Ecology, vol. 16, no. 4, pp. 675-685.
Kazmierow, B. J., Hickling, G. J. & Booth, K. L. 2000, 'Ecological and human dimensions of
tourism-related wildlife disturbance: White herons at waitangiroto, New Zealand',
Human Dimensions of Wildlife: An International Journal, vol. 5, no. 2, pp. 1 - 14.
Kessler, M. & Harcourt, R. 2010, 'Aligning tourist, industry and government expectations: A
case study from the swim with whales industry in Tonga', Marine Policy, vol. 34, no.
6, pp. 1350-1356.
Kiss, A. 2004, 'Is community-based ecotourism a good use of biodiversity conservation
funds?', Trends in Ecology and Evolution, vol. 19, no. 5, pp. 232-237.
Knapp, T. R. 1990, 'Treating Ordinal Scales as Interval Scales: An Attempt to Resolve the
Controversy', Nursing Research, vol. 39, no. 2, pp. 121-123.
Kozak, M. 2001, 'Comparative assessment of tourist satisfaction with destinations across two
nationalities', Tourism Management, vol. 22, no. 4, pp. 391-401.
Kozak, M. & Rimmington, M. 2000, 'Tourist Satisfaction with Mallorca, Spain, as an Off-
Season Holiday Destination', Journal of Travel Research, vol. 38, no. 3, pp. 260-269.
Kriebel, D., Tickner, J., Epstein, P., Lemons, J., Levins, R., Loechler, E. L., Quinn, M.,
Rudel, R., Schettler, T. & Stoto, M. 2001, 'The Precautionary Principle in
Environmental Science', Environmental Health Perspectives, vol. 109, no. 9, pp. 871-
876.
Krishna, A. 2008, Tri Hita Karana: Ancient Balinese Wisdom for Neo Humans, Anand
Krishna Global Cooperation, Denpasar.
Krutzen, M., Mann, J., Heithaus, M. R., Connor, R. C., Bejder, L. & Sherwin, W. B. 2005,
'Cultural transmission of tool use in bottlenose dolphins', Proceedings of National
Academy of Science (PNAS), vol. 102, no. 25, pp. 8939-8943.
Kumar, R. 2010, 'Assessing ecosystem services of Chilika', Chilika Newsletter, vol. V
(March 2010), pp. 17-18.
Laist, D. W., Knowlton, A. R., Mead, J. G., Collet, A. S. & Podesta, M. 2001, 'Collisions
between ships and whales', Marine Mammal Science, vol. 17, no. 1, pp. 35-75.
Lanfant, M.-F. & Graburn, N. H. H. 1992, 'International Tourism Reconsidered: the Principle
of the Alternative', in Tourism Alternatives: Potentials and Problems in the
Development of Tourism, eds V. L. Smith & W. R. Eadington, University of
Pennsylvania, Philadelphia, pp. 88-114.
Laurance, W. F. 2004, 'The perils of payoff: corruption as a threat to global biodiversity',
Trends in Ecology & Evolution, vol. 19, no. 8, pp. 399-401.
Layton, A., Robinson, T. & Tucker, I. B. 2009, Economics for Today, Cengage Learning,
Melbourne.
Lusseau, D. 2003, 'Effects of Tour Boats on the Behavior of Bottlenose Dolphins: Using
Markov Chains to Model Anthropogenic Impacts', Conservation Biology, vol. 17, no.
6, pp. 1785-1793.
Lusseau, D. 2006, 'The short-term behavioral reactions of bottlenose dolphins to interactions
with boats in Doubtful Sound, New Zealand', Marine Mammal Science, vol. 22, no. 4,
pp. 802-818.
Mangott, A. H., Birtles, R. A. & Marsh, H. 2011, 'Attraction of dwarf minke whales
Balaenoptera acutorostrata to vessels and swimmers in the Great Barrier Reef World
Heritage Area – the management challenges of an inquisitive whale', Journal of
Ecotourism, vol. 10, no. 1, pp. 64 - 76.
Page 235
213
Mann, J. 1999, 'Behavioral Sampling Methods for Cetaceans: A review and critique', Marine
Mammal Science, vol. 15, no. 1, pp. 102-122.
Mann, J., Connor, R. C., Barre, L. M. & Heithaus, M. R. 2000, 'Female reproductive success
in bottlenose dolphins (Tursiops sp.): life history, habitat, provisioning, and group-
size effects', Behavioural Ecology, vol. 11, no. 2, pp. 210-219.
Marlin, A. & Marlin, J. T. 2003, 'A Brief History of Social Reporting', Business Respect, 9
March 2003, no. 51.
Marshall, M. N. 1996, 'Sampling for qualitative research', Family Practice, vol. 13, no. 6, pp.
522-526.
Meadowcroft, J., Farrell, K. N. & Spangenberg, J. 2005, 'Developing a framework for
sustainability governance in the European Union', International Journal of
Sustainable Development, vol. 8, no. 1/2, pp. 3-11.
Milinski, M. 1997, 'How to Avoid Seven Deadly Sins in the Study of Behavior', Advances in
the Study of Behavior, vol. 26, pp. 160-180.
Ministry of Environment, 2011, Regulations [Online], Ministry of Environment of the
Republic of Indonesia, Available:
http://www.menlh.go.id/home/index.php?option=com_content&view=article&id=107
&Itemid=132&lang=en [9 January 2011].
Mitchell, B. 1994, 'Sustainable development at the village level in Bali, Indonesia', Human
Ecology, vol. 22, no. 2, pp. 189-211.
MMAF, 2011, Ministry of Marine and Fisheries Affairs [Online], Ministry of Marine and
Fisheries Affairs, Available: www.dkp.go.id [9 January 2011].
Morse, J. M. 1995, 'The significance of saturation', Qualitative Health Research, vol. 5, no. 2,
pp. 147-149.
Musa, G. 2002, 'Sipadan: a SCUBA-diving paradise: an analysis of tourism impact, diver
satisfaction and tourism management', Tourism Geographies, vol. 4, no. 2, pp. 195-
209.
Mustika, P. L. K. 2006, Marine Mammals in Savu Sea (Indonesia): Indigenous Knowledge,
Threat Analysis and Management Options, James Cook University, Townsville.
Neves, K. 2010, 'Cashing in on Cetourism: A Critical Ecological Engagement with Dominant
E-NGO Discourses on Whaling, Cetacean Conservation, and Whale Watching',
Antipode, vol. 42, no. 3, pp. 719-741.
Newsome, D., Dowling, R. K. & Moore, S. A. 2005, Wildlife Tourism, Channel View
Publications, Toronto.
Norris, K. S., Wursig, B., Wells, R. S. & Wursig, M. 1994, The Hawaiian Spinner Dolphin,
University of California Press, Los Angeles.
Nowacek, S. M., Wells, R. S. & Solow, A. R. 2001, 'Short-term Effects of Boat Traffic on
Bottlenose Dolphins, Tursiops truncatus, in Sarasota Bay, Florida', Marine Mammal
Science, vol. 17, no. 4, pp. 673-688.
O'Connor, S. 2004, The growth of whale watching tourism in Australia: An IFAW Report
May 2004, IFAW, Surry Hills, Sydney.
O'Connor, S., Campbell, R., Cortez, H. & Knowles, T. 2009, Whale Watching Worldwide:
Tourism numbers, expenditures and expanding economic benefits, Economist at Large
& IFAW, Melbourne.
Okello, M. M. & Yerian, S. 2009, 'Tourist satisfaction in relation to attractions and
implications for conservation in the protected areas of the Northern Circuit, Tanzania',
Journal of Sustainable Tourism, vol. 17, no. 5, pp. 605 - 625.
Orams, M. 2004, 'Why Dolphins May Get Ulcers: Considering the Impacts of Cetacea-based
Tourism in New Zealand', Tourism in Marine Environments, vol. 1, no. 1, pp. 17-28.
Page 236
214
Orams, M. B. 2000, 'Tourists getting close to whales, is it what whale-watching is all about?',
Tourism Management, vol. 21, pp. 561-569.
Orams, M. B. 2001, 'From Whale Hunting to Whale Watching in Tonga: A Sustainable
Future?', Journal of Sustainable Tourism, vol. 9, no. 2, pp. 128-146.
Orams, M. B. 2002a, 'Feeding wildlife as a tourism attraction: a review of issues and
impacts', Tourism Management, vol. 23, pp. 281-293.
Orams, M. B. 2002b, 'Humpback Whales in Tonga: An Economic Resource for Tourism',
Coastal Management, vol. 30, no. 4, pp. 361 - 380.
Ostrom, E. 2009, 'A General Framework for Analyzing Sustainability of Social-Ecological
Systems', Science, vol. 325, pp. 419-422.
Ostrom, E., Burger, J., Field, C. B., Norgaard, R. B. & Policansky, D. 1999, 'Revisiting the
Commons: Local Lessons, Global Challenges', Science, vol. 284, pp. 278-282.
Page, S. J. & Dowling, R. K. 2002, Ecotourism, Pearson Education Limited, Essex.
Parker, L. 1997, 'Engendering School Children in Bali', The Journal of the Royal
Anthropological Institute, vol. 3, no. 3, pp. 497-516.
Pearce, D. G. 1992, 'Alternative Tourism: Concepts, Classifications, and Questions', in
Tourism Alternatives: Potentials and Problems in the Development of Tourism, eds V.
L. Smith & W. R. Eadington, University of Philadelphia Press, Philadelphia, pp. 15-
30.
Pearce, P. L. 2006, 'The Value of a Benchmarking Approach for Assessing Service Quality
Satisfaction in Environmental Tourism', in Managing tourism and hospitality
services: Theory and international applications, eds B. Prideaux, G. Moscardo & E.
Laws, CABI, London, pp. 282-299.
Pet, J. S. & Yeager, C. (eds) 2000, 25 Year Master Plan for Management Komodo National
Park Book 1: Management Plan, 3 vols, Komodo National Park Authority, The
Nature Conservancy, Jakarta.
Picard, M. 1995, 'Cultural Heritage and Tourist Capital: Cultural Tourism in Bali', in
International Tourism: Identity and Change, eds M.-F. Lanfant, J. B. Allcock & E. M.
Bruner, Sage Publications Ltd, London, pp. 44-66.
Picard, M. 1996, Bali: Cultural Tourism and Touristic Culture, Archipelago Press,
Singapore.
Picard, M. 1997, 'Cultural Tourism, Nation-Building, and Regional Culture: The Making of a
Balinese Identity ', in Tourism, ethnicity, and the state in Asian and Pacific societies,
eds M. Picard & R. E. Wood, University of Hawai'i Press, Honolulu, p. 259.
Pizam, A. & Sussmann, S. 1995, 'Does nationality affect tourist behavior?', Annals of
Tourism Research, vol. 22, no. 4, pp. 901-917.
Pope, J., Annandale, D. & Morrison-Saunders, A. 2004, 'Conceptualising sustainability
assessment', Environmental Impact Assessment Review, vol. 24, no. 6, pp. 595-616.
Putra, I. N. D. & Hitchcock, M. 2006, 'The Bali bombs and the tourism development cycle',
Progress in Development Studies, vol. 6, no. 2, pp. 157-166.
Ramaswami, A., Zimmerman, J. B. & Mihelcic, J. R. 2007, 'Integrating Developed and
Developing World Knowledge into Global Discussions and Strategies for
Sustainability. 2. Economics and Governance', Environmental Science & Technology,
vol. 41, no. 10, pp. 3422-3430.
Reeves, R. R., Stewart, B. S., Clapham, P. J. & Powell, J. A. 2002, Sea Mammals of the
World, Alfred A. Knopf, Inc, New York.
Reynolds, P. C. & Braithwaite, D. 2001, 'Towards a conceptual framework for wildlife
tourism', Tourism Management, vol. 22, pp. 31-42.
Robinson, A. J. & Meaton, J. 2005, 'Bali beyond the bomb: disparate discourses and
implications for sustainability', Sustainable Development, vol. 13, no. 2, pp. 69-78.
Page 237
215
Roe, D., Leader-Williams, N. & Dalal-Clayton, B. 1997, Take Only Photographs, Leave Only
Footprints: The Environmental Impacts of Wildlife Tourism, International Institute for
Environment and Development, London.
Rogers, M. & Ryan, R. 2001, 'The Triple Bottom Line for Sustainable Community
Development', Local Environment, vol. 6, no. 3, pp. 279 - 289.
Rowe, L. E., Currey, R. J. C., Dawson, S. M. & Johnson, D. 2010, 'Assessment of epidermal
condition and calf size of Fiordland bottlenose dolphin Tursiops truncatus populations
using dorsal fin photographs and photogrammetry', Endangered Species Research,
vol. 11, pp. 83-89.
Ryan, C. 1998, 'Saltwater Crocodiles as Tourist Attractions', Journal of Sustainable Tourism,
vol. 6, no. 4, pp. 314 - 327.
Ryan, C. & Harvey, K. 2000, 'Who Likes Saltwater Crocodiles? Analysing Socio-
demographics of Those Viewing Tourist Wildlife Attractions Based on Saltwater
Crocodiles', Journal of Sustainable Tourism, vol. 8, no. 5, pp. 426 - 433.
Samadhi, T. N. 2001, 'The urban design of a Balinese town: placemaking issues in the
Balinese urban setting', Habitat International, vol. 25, no. 4, pp. 559-575.
Samonte-Tan, G. P. B., White, A. T., Tercero, M. A., Diviva, J., Tabara, E. & Caballes, C.
2007, 'Economic Valuation of Coastal and Marine Resources: Bohol Marine Triangle,
Philippines', Coastal Management, vol. 35, no. 2, pp. 319 - 338.
Sandelowski, M. 1995, 'Sample Size in Qualitative Research', Research in Nursing & Health,
vol. 18, no. 2, pp. 179--183.
Satria, A., Matsuda, Y. & Sano, M. 2006, 'Questioning Community Based Coral Reef
Management Systems: Case Study of Awig-awig in Gili Indah, Indonesia',
Environment, Development and Sustainability, vol. 8, no. 1, pp. 99-118.
Schaffar, A., Madon, B., Garrigue, C. & Constatine, R. 2009, Avoidance of whale watching
boats by humpback whales in their main breeding ground in New Caledonia, IWC SC
61 WW6.
Shani, A. & Pizam, A. 2008, 'Towards an ethical framework for animal-based attractions',
International Journal of Contemporary Hospitality Management, vol. 20, no. 6, pp.
679-693.
Shaw, G. 2004, 'Enterpreneurial Cultures and Small Business Enterprises in Tourism', in A
Companion to Tourism, eds A. A. Lew, C. M. Hall & A. M. Williams, Blackwell
Publishing Ltd., Melbourne, pp. 122-134.
Shirakihara, M., Shirakihara, K., Tomonaga, J. & Takatsuki, M. 2002, 'A resident population
of Indo-Pacific Bottlenose Dolphins (Tursiops aduncus) in Amakusa, Western
Kyushu, Japan', Marine Mammal Science, vol. 18, no. 1, pp. 30-41.
Shirihai, H. & Jarrett, B. 2006, Whales, Dolphins and Seals, A&C Black London.
Simberloff, D. 1998, 'Flagships, umbrellas, and keystones: Is single-species management
passe in the landscape era?', Biological Conservation, vol. 83, no. 3, pp. 247-257.
Smith, M. K. 2009, Issues in Cultural Tourism Studies (Second Edition), Routledge, Oxon.
Smith, R. J., Muir, R. D. J., Walpole, M. J., Balmford, A. & Leader-Williams, N. 2003,
'Governance and the loss of biodiversity', Nature, vol. 426, no. 6962, p. 67.
Smith, V. L. 2002, 'Introduction to Hosts and Guests: The Anthropology of Tourism (2nd
Edition)', in Sustainable Tourism, ed. L. France, Earthscan Publications Ltd., London,
pp. 122-128.
Sobtzick, S. 2011, An investigation into the biology of dwarf minke whales (Balaenoptera
acutorostrata subsp.) and implications for the sustainable management of the swim-
with whales industry in the Great Barrier Reef, PhD Thesis. School of Business,
James Cook University, Townsville.
Page 238
216
Sorongon, P. M. E., Acebes, J. M., Dolar, L., Hilomen, V. V. & Palomares, M. L. D. 2010,
'The effect of tourism on cetacean populations in southern Philippines', in Marine
Biodiversity in Southeast Asian and Adjacent Seas Part 1, vol. 18, eds M. L. D.
Palomares & D. Pauly, The Fisheries Centre, University of British Columbia,
Vancouver, BC, Canada, pp. 78-96.
Spangenberg, J. H. 2002a, 'Environmental space and the prism of sustainability: frameworks
for indicators measuring sustainable development', Ecological Indicators, vol. 2, no.
3, pp. 295-309.
Spangenberg, J. H. 2002b, 'Institutional sustainability indicators: an analysis of the
institutions in Agenda 21 and a draft set of indicators for monitoring their effectivity',
Sustainable Development, vol. 10, no. 2, pp. 103-115.
Spangenberg, J. H. 2004, 'Reconciling sustainability and growth: criteria, indicators, policies',
Sustainable Development, vol. 12, no. 2, pp. 74-86.
Spencer, J. & Angeles, G. 2007, 'Kernel density estimation as a technique for assessing
availability of health services in Nicaragua', Health Services and Outcomes Research
Methodology, vol. 7, no. 3, pp. 145-157.
Stensland, E. & Berggren, P. 2007, 'Behavioural changes in female Indo-Pacific bottlenose
dolphins in response to boat-based tourism', Marine Ecology Progress Series, vol.
332, pp. 225-234.
Stensland, E., Carlen, I. & Sarnblad, A. 2006, 'Population size, distribution, and behavior of
Indo-Pacific bottlenose (Tursiops aduncus) and humpback (Sousa chinensis) dolphins
off the south coast of Zanzibar', Marine Mammal Science, vol. 22, no. 3, pp. 667-682.
Stoeckl, N., Birtles, A., Farr, M., Mangott, A., Curnock, M. & Valentine, P. 2010, 'Live-
aboard dive boats in the Great Barrier Reef: regional economic impact and the relative
values of their target marine species', Tourism Economics, vol. 16, no. 4, pp. 995-
1018.
Stoeckl, N., Smith, A., Newsome, D. & Lee, D. 2005, 'Regional Economic Dependence on
Iconic Wildlife Tourism: Case studies of Monkey Mia and Hervey Bay', The Journal
of Tourism Studies, vol. 16, no. 1, pp. 69-81.
Suradisastra, K., Sejati, W. K., Supriatna, Y. & Hidayat, D. 2002, 'Institutional description of
the Balinese Subak', Jurnal Litbang Pertanian, vol. 21, no. 1, pp. 11-18.
Sutaria, D. N. 2009, 'Species conservation in a complex socio-ecological system: Irrawaddy
dolphins, Orcaella brevirostris in Chilika Lagoon, India', PhD, James Cook
University.
Sveegaard, S., Teilmann, J., Tougaard, J., Dietz, R., Mouritsen, K. N., Desportes, G. &
Siebert, U. 2011, 'High-density areas for harbor porpoises (Phocoena phocoena)
identified by satellite tracking', Marine Mammal Science, vol. 27, no. 1, pp. 230-246.
Tao, C.-H., Eagles, P. F. J. & Smith, S. L. J. 2004, 'Profiling Taiwanese Ecotourists Using a
Self-definition Approach', Journal of Sustainable Tourism, vol. 12, no. 2, pp. 149 -
168.
Taylor, B. L., Martinez, M., Gerrodette, T., Barlow, J. & Hrovat, Y. N. 2007, 'Lessons from
monitoring trends in abundance of marine mammals', Marine Mammal Science, vol.
23, no. 1, pp. 157-175.
Therneau, T. M., Atkinson, B. & Ripley, B., 2010, Recursive Partitioning [Online], CRAN,
Available: http://cran.r-project.org/web/packages/rpart/rpart.pdf [23 May 2010].
Tietenberg, T. 1995, 'Tradeable permits for pollution control when emission location matters:
What have we learned?', Environmental and Resource Economics, vol. 5, no. 2, pp.
95-113.
Page 239
217
Timmel, G., Courbis, S., Sargeant-Green, H. & Markowitz, H. 2008, 'Effects of Human
Traffic on the Movement Patterns of Hawaiian Spinner Dolphins (Stenella
longirostris) in Kealakekua Bay, Hawaii', Aquatic Mammals, vol. 34, no. 4, p. 402.
Tisdell, C. & Wilson, C. 2004, 'Economics of Wildlife Tourism', in Wildlife Tourism:
Impacts, Management and Planning, ed. K. Higginbottom, CRC Tourism Australia,
Melbourne.
Turner, L. W., Reisinger, Y. V. & McQuilken, L. 2001, 'How Cultural Differences Cause
Dimensions of Tourism Satisfaction', Journal of Travel & Tourism Marketing, vol.
11, no. 1, pp. 79 - 101.
UNEP 2006, Indonesia: Integrated Assessment of the Poverty Reduction Strategy Paper, with
a case study on sustainable fishery initiatives, United Nations Environment
Programmes.
University of Gadjah Mada, 2008, Postgraduate Program on Environmental Management
[Online], University of Gadjah Mada, Available:
http://www.pasca.ugm.ac.id/id/stprogram_view.php?pr_id=8 [10 May 2011].
University of Indonesia, 2009, Postgraduate Program on Environmental Science [Online],
University of Indonesia, Available:
http://www.pps.ui.ac.id/new/index.php?option=com_content&task=view&id=16&Ite
mid=69 [10 May 2011].
Valentin, A. & Spangenberg, J. H. 2000, 'A guide to community sustainability indicators',
Environmental Impact Assessment Review, vol. 20, no. 3, pp. 381-392.
Valentine, P. & Birtles, A. 2004, 'Wildlife Watching', in Wildlife Tourism: Impacts,
Management and Planning, ed. K. Higginbottom, CRC Sustainable Tourism,
Melbourne, pp. 15-34.
Valentine, P. S., Birtles, A., Curnock, M., Arnold, P. & Dunstan, A. 2004, 'Getting closer to
whales--passenger expectations and experiences, and the management of swim with
dwarf minke whale interactions in the Great Barrier Reef', Tourism Management, vol.
25, no. 6, pp. 647-655.
Van Egmond, T. 2007, Understanding Western Tourists in Developing Countries, CABI,
Wallingford, Cambridge.
Wall, G. 1993, 'International Collaboration in the Search for Sustainable Tourism in Bali,
Indonesia', Journal of Sustainable Tourism, vol. 1, no. 1, pp. 38 - 47.
Walpole, M. J. & Goodwin, H. J. 2000, 'Local economic impacts of dragon tourism in
Indonesia', Annals of Tourism Research, vol. 27, no. 3, pp. 559-576.
Walpole, M. J., Goodwin, H. J. & Ward, K. G. R. 2001, 'Pricing Policy for Tourism in
Protected Areas: Lessons from Komodo National Park, Indonesia', Conservation
Biology, vol. 15, no. 1, pp. 218-227.
Walpole, M. J. & Leader-Williams, N. 2002, 'Tourism and flagship species in conservation',
Biodiversity and Conservation, vol. 11, no. 3, pp. 543-547.
Walras, L. 1874, Elements d'economie politique pure: Ou, Theorie de la richesse sociale
Lausanne.
Warnken, J. & Byrnes, T. 2004, 'Impacts of Tourboats in Marine Environments', in
Environmental Impacts of Ecotourism, ed. R. Buckley, CABI Publishing, Brisbane,
pp. 99-115.
Warren, C. 1998, 'Tanah Lot: the cultural and environmental politics of resort development in
Bali', in The politics of environment in Southeast Asia: resources and resistance,
Routledge, London, pp. 229-261.
Warren, C. 2007, 'Adat in Balinese discourse and practice: Locating citizenship and the
commonweal', in The Revival of Tradition in Indonesian Politics: The deployment of
Page 240
218
adat from colonialism to indigenism, eds J. S. Davidson & D. Henley, Routledge,
New York, pp. 170-202.
Watkins, W. A. 1986, 'Whale reactions to human activities in Cape Cod waters', Marine
Mammal Science, vol. 2, no. 4, pp. 251-262.
WCED 1987, Our Common Future: Report of the World Commission on Environment and
Development, World Commission on Environment and Development, Tokyo.
Wearing, S. & Neil, J. 2009, Ecotourism Impacts, Potentials and Possibilities (Second
Edition), Butterworth-Heinemann, Melbourne.
Weber, W. 1993, 'Primate Conservation and Ecotourism in Africa', in Perspectives on
Biodiversity: Case Studies of Genetic Resources Conservation and Development, eds
C. S. Potter, J. I. Cohen & D. Janczewski, AAAS Publication, Washington, pp. 129-
150.
Wight, P. A. 2001, 'Ecotourists: Not a Homogeneous Market Segment', in The Encyclopedia
of Ecotourism, ed. D. B. Weaver, CABI Publishing, Wallingford, pp. 37-61.
Wilkie, D. S. & Carpenter, J. 1999, 'The potential role of safari hunting as a source of
revenue for protected areas in the Congo Basin', Oryx, vol. 33, no. 4, pp. 340-345.
Williams, P. & Soutar, G. N. 2009, 'Value, satisfaction and behavioral intentions in an
adventure tourism context', Annals of Tourism Research, vol. 36, no. 3, pp. 413-438.
Williams, R. & Ashe, E. 2007, 'Killer whale evasive tactics vary with boat number', Journal
of Zoology, pp. 1-8.
Williams, R., Trites, A. W. & Bain, D. E. 2002, 'Behavioural responses of killer whales
(Orcinus orca) to whale-watching boats: opportunistic observations and experimental
approaches', Journal of Zoology, vol. 256, no. 2, pp. 255-270.
Wilson, C. & Tisdell, C. 2003, 'Conservation and Economic Benefits of Wildlife-Based
Marine Tourism: Sea Turtles and Whales as Case Studies', Human Dimensions of
Wildlife, vol. 8, no. 1, pp. 49-58.
World Conference on Sustainable Tourism, 1995, Charter for Sustainable Tourism [Online],
World Conference on Sustainable Tourism, Available: http://www.gdrc.org/uem/eco-
tour/charter.html [18 April 2007].
Worton, B. J. 1989, 'Kernel Methods for Estimating the Utilization Distribution in Home-
Range Studies', Ecology, vol. 70, no. 1, p. 164.
Wursig, B. & Jefferson, T. A. 1990, Methods of Photo-Identification for Small Cetaceans in
Report of the Intenational Whaling Commission (Special Issue 12), International
Whaling Commission.
Yagi, C. & Pearce, P. L. 2007, 'The Influence of Appearance and the Number of People
Viewed on Tourists‟ Preferences for Seeing Other Tourists', Journal of Sustainable
Tourism, vol. 15, no. 1, pp. 28 - 43.
Zar, J. H. 1999, Biostatistical Analysis (4th ed), Prentice-Hall Inc., New Jersey.
Page 241
219
Appendix 1 Tourist questionnaire in High Season
QUESTIONNAIRE FOR DOLPHIN-WATCHING TOURIST IN LOVINA
Date questionnaire filled in: D/M/Y Email: (optional) Occupation:
Date of dolphin-watching: D/M/Y Year of birth: Nationality:
Name: (optional) Gender: Male/Female Country of residence:
Highest educational level:
Attended elementary school
Completed elementary
school
Attended secondary school
Completed secondary school
Attended high school
Completed high school
Attended uni/college
Completed uni/college
Undertake postgraduate study
Completed Postgraduate study
1. What spring to mind when I say “dolphin”?
_____________________________________________________________________________________________________
_____________________________________________________________________________________________________
2. Did your perception of the dolphin change after your encounter with them during this trip?
No Yes, please explain
_______________________________________________________________________________
3 Have you seen or interacted with dolphins before?
No Yes, location:
_______________________________
4. Had you heard of the dolphin-watching tour in Lovina
before arriving here?
No Yes
5. If your answer to #4 is “yes”, where did you learn of the Lovina dolphin watching tour from?
Internet Brochures/leaflets Friend/family Others____________
6. Was dolphin-watching on your list of holiday activities in
Bali before coming here?
No Yes
7. What influenced you to go dolphin watching?
Curiosity I wanted to see them at a close distance
My friend/family/spouse asked me to go with him/her I’d seen them in captivity, so I wanted to
see them in the wild
We/I was just looking for something to do here Others, please explain_________________
8. What aspect of your experience with the dolphin trip in Lovina did you like best?
_____________________________________________________________________________________________________
9. What aspect of your experience with the dolphin trip in Lovina did you dislike the most?
_____________________________________________________________________________________________________
10. Did you see any dolphins during your trip?
No Yes
11. If you saw dolphins, how many dolphins approximately did you see?
1 – 10 11 – 20 21 – 30
Page 242
220
31 – 40 more than 40 I didn’t see dolphins; I saw whales,
amount_________________________
12. How many different types (species) of dolphins did you see today?
1, type_______________ 2, types_______________ 3, types_______________
more than 3,
types_______________
I didn’t see dolphins; I saw whales, type______________________________
13. How was the weather during your dolphin watching trip?
Sunny Cloudy Raining Other, please explain______________
14. How was the sea state during your dolphin watching trip?
Calm Choppy (small waves
without white caps)
Rough (big waves,
lots of white caps)
Other, please explain______________
15. Did the weather and sea state influence your
experience with the dolphins?
No Yes, please explain
_______________________
_ ______________________
16. What were you supplied with for your dolphin watching trip ?(you can tick more than one option):
Life jacket Do’s and don’ts (i.e. “code of practice”) during a
dolphin-watching trip
Explanation about the dolphins by your guide/boatman None
Safety briefing
17. Do you consider that you were well-briefed or well-informed about
this dolphin-watching activity?
No Yes
18. Would a brochure about dolphins and dolphin-watching tourism in
Lovina have enhanced your experience?
No Yes
19. What kind of information would you want to be included in such a brochure?
____________________________________________________________________________________________________
____________________________________________________________________________________________________
20. How many people were there on your boat including your boatman? (please include children travelling with you)
2 3 4
5 6 more than 6, how many? ___________________
21. How many other tour boats did you see around your boat during your encounter with the dolphins today?
0 1 – 5 6 – 10 11 – 15
16 – 20 21 – 25 26 – 30 more than 30, how many?
_______
22. If having no other boat around your boat would be difficult to arrange, please indicate number of boats you would have
liked around your boat while watching the dolphins.
1 – 5 6 – 10 11 – 15 16 – 20
21 – 25 26 – 30 More than 30, how many? ________
Page 243
221
23. On a scale of 1-10, how satisfied were you about your dolphin trip? (Circle one appropriate number)
1--------2--------3--------4--------5--------6--------7--------8--------9--------10
24. Would you join the trip again? No Yes
25. Would you recommend the dolphin trip to others? No Yes
26. If you have seen dolphins in oceanariums or other confined environment before, which experience do you prefer:
In captivity, because:
_______________________________
In the natural habitat, because:
_________________________________________
27. Approximately, what is your expenditure PER DAY in Lovina? (to understand the contribution of dolphin-watching to
local tourism)
Item \ Cost per
day
IDR 1 -
100,000
IDR 101,000 –
200,000
IDR 201,000 –
300,000
IDR 301,000 – 400,000 More than IDR
400,000
Food and drinks
Accommodation
Internet & phone
Souvenirs
Transportation
28. Have you any suggestions to improve the quality of dolphin-watching tourism in Lovina?
_________________________________________________________________________________________________________
_________________________________________________________________________________________________________
Absolutely
not satisfied
Very
satisfied
- thank you very much-
Page 244
222
Appendix 2 Tourist questionnaire in Low Season
QUESTIONNAIRE FOR DOLPHIN-WATCHING TOURIST IN LOVINA
Date questionnaire filled in: D/M/Y Year of birth: Country of residence:
Gender: Male/Female Nationality: Occupation:
Highest educational level:
Attended elementary school
Completed elementary
school
Attended secondary school
Completed secondary school
Attended high school
Completed high school
Attended uni/college
Completed uni/college
Undertake postgraduate study
Completed Postgraduate study
1. What aspect of your experience with the dolphin trip in Lovina did you like best?
_____________________________________________________________________________________________________
2. What aspect of your experience with the dolphin trip in Lovina did you dislike the most?
_____________________________________________________________________________________________________
3. Have you seen or interacted with wild dolphins before? No Yes, location:____________
4. Was this a commercial boat tour? No Yes
5. Had you heard of the dolphin-watching tour in Lovina
before arriving here?
No Yes
6. If your answer to #5 is “yes”, where did you learn of the Lovina dolphin watching tour from?
Internet Brochures/leaflets Friend/family Others____________
7. Was dolphin-watching on your list of holiday activities in Bali
before coming here?
No Yes
8. How many nights are you staying in Lovina? _______nights at ____________________(name of hotel/home stay)
9. What influenced you to go dolphin watching?
Curiosity I wanted to see them at a close distance
My friend/family/spouse asked me to go with him/her I’d seen them in captivity, so I wanted to
see them in the wild
We/I was just looking for something to do here Others, please explain_________________
10. Did you see any dolphins during your trip?
No Yes
13. If you saw dolphins, how many dolphins approximately did you see?
1 – 10 11 – 20 21 – 30
31 – 40 more than 40 I didn’t see dolphins; I saw whales.
Number of whales_--------------------------
14. How many different types (species) of dolphins did you see today?
1, type_______________ 2, types_______________ 3, types_______________
more than 3,
types_______________
I didn’t see dolphins; I saw whales, type______________________________
Page 245
223
13. How was the weather during your dolphin watching trip?
Sunny Cloudy Raining Other, please explain______________
14. How was the sea state during your dolphin watching trip?
Calm Choppy (small waves
without white caps)
Rough (big waves,
lots of white caps)
Other, please explain______________
15. Did the weather and sea state influence your
experience with the dolphins?
No Yes, please explain
_______________________
_
17. What were you supplied with for your dolphin watching trip ?(you can tick more than one option):
Life jacket Do’s and don’ts (i.e. “code of practice”) during a
dolphin-watching trip
Explanation about the dolphins by your guide/boatman None
Safety briefing
17. Do you consider that you were well-briefed or well-informed about
this dolphin-watching activity?
No Yes
18. Would a brochure about dolphins and dolphin-watching tourism in
Lovina have enhanced your experience?
No Yes
19. What kind of information would you want to be included in such a brochure?
____________________________________________________________________________________________________
20. How many people were there on your boat including your boatman? (please include children travelling with you)
2 3 4
5 6 more than 6, how many? ___________________
21. How many other tour boats did you see around your boat during your encounter with the dolphins today?
0 1 – 5 6 – 10 11 – 15
16 – 20 21 – 25 26 – 30 more than 30, how many?
22. How do you feel about this (#21)? _____________________________________________________________________
23. Having no other boats around your boat would be difficult to arrange, but please indicate the number of boats you would
have liked around your boat while watching the dolphins.
1 – 5 6 – 10 11 – 15 16 – 20
21 – 25 26 – 30 More than 30, how many? ________
24.. Please explain the reason for your choice #22?
_____________________________________________________________
25. How do you feel about how close your boat got to the dolphins? (please circle the appropriate number )
-2 ------------------------- -1 ---------------------------- 0 ---------------------------- 1-------------------------------- 2
Far too close too close about right not close enough not nearly close
enough
26. How do you feel about the way your boatman managed your encounter with the dolphins?
-2 ------------------------- -1 ------------------------- 0 ---------------------------- 1 --------------------------------- 2
Very comfortable comfortable neutral uncomfortable very uncomfortable
27. Why do you feel this way? ________________________________________________________________
Page 246
224
28. Was the amount of time you spent with the dolphins: (Circle one appropriate number)
-2 ------------------------- -1 ------------------------- 0 --------------------------- 1 -------------------------------- 2
Much too much too much just right too little much too little
29. How satisfied were you about your overall dolphin trip? (Circle one appropriate number)
1--------2--------3--------4--------5--------6--------7--------8--------9--------10
30. Would you join the trip again? No Yes
31. Would you recommend the dolphin trip to others? No Yes
32. If you have seen dolphins in oceanariums or other confined environments before, which experience do you prefer:
In captivity, because:
_______________________________
In their natural habitat, because:
_________________________________________
33. Approximately, what is your expenditure PER DAY in Lovina? (This will help us to understand the contribution of
dolphin-watching to the local communities)
Item \ Cost per
day
IDR 1 -
100,000
IDR 101,000 –
200,000
IDR 201,000 –
300,000
IDR 301,000 – 400,000 More than IDR
400,000
Food and drinks
Accommodation
Internet & phone
Souvenirs
Transportation
34. Have you any suggestions to improve the quality of dolphin-watching tourism in Lovina?
____________________________________________________________________________________________________
____________________________________________________________________________________________________
If you would like more information about the progress of this project, please provide your details here:
Name: ___________________________________________________Email:________________________________________
Absolutely
not satisfied
Very
satisfied
Page 247
225
Appendix 3 Questions for semi-structured interviews with dolphin association coordinators
QUESTIONS FOR SEMI-STRUCTURED INTERVIEWS
DOLPHIN-WATCHING TOURISM IN BALI
Group: fishers/dolphin guides in Lovina
Thank you for participating in our interview about dolphin-watching tourism in Bali. As indicated in the information
letter, the interview will last for approximately 30 minute and I hope will be the first of three interview sessions. Your
identity will be kept confidential during the analysis of data obtained from this interview.
Name: (optional) Gender: Male/Female
Year of birth: Occupation:
Village of residence: Region of origin in Indonesia:
Location of interview:
Latest educational level:
o Attended elementary
school
o Completed elementary
school
o Attended secondary
school
o Completed secondary
school
o Attended high school
o Completed high school
o Attended uni/college
o Completed uni/college
FIRST MEETING
Introduction to my project
(Note for self)I will give a brief description of my project, provide the Indonesian version of the flyer and explain why
their help is so important to my project. I will then ask if the interviewee if he is willing to fill in the informed consent
forms.
History of his time at Lovina and involvement in dolphin tourism
1. How long have you been living in this area?
2. What did you do before becoming in involved in dolphin tourism?
3. How did you get involved in dolphin tourism?
4. How long have you been involved in dolphin tourism?
5. What is your role in the industry?
History of dolphin watching tourism at Lovina and their port
6. Can you tell me how dolphin watching tourism in the Lovina area started?
7. How did dolphin watching tourism start at your port?
The dolphin’s presence in Lovina
8. Why do you think the dolphins are here?
Page 248
226
Changes you’ve seen over the time (dolphin, tourist, industry/boat, info)
The dolphins
9. Could you please tell be about the types of dolphins you see, how they behave, and (if possible) how
their behaviour has changed through time. How abundant were the dolphins when you joined the
industry, or about 10 years ago)? Do you detect changes compared to the current situation? What do
you think caused such changes? (only ask last question if he reports change)
The tourists
10. Could you please tell me about the tourists coming to Lovina (nationality, type of tourists, etc) in the
past (say, about the first time you joined the industry, or about 10 years ago)? Do you detect changes
compared to now? What do you think caused such changes? (only ask last question if he reports
change)
The boats
11. Could you please tell me about the boats used at Lovina (design, materials, size, engine, etc) in the
past (say, about the first time you joined the industry, or about 10 years ago)? Have the boats used
changed over time. What do you think caused such changes? (only ask last question if he reports
change)
12. Can you recall the numbers of dolphin boat in the 80s and 90s? Why do you think the dolphin boat
number have increased to their preesnt levels?
Information for tourists
13. About the first time you joined the industry, or about 10 years ago, what kind of information did the
guides provide to the tourists? Has this information changed over time. What do you think caused
such changes? (only ask last question if he reports change)
Thank and set time for future meeting(s)
14. When would it be convenient to you for us to meet again?
-xxx-
SECOND MEETING
About the dolphins (abundance, behaviour, distribution, areas of use, changes)
1. Tell me your views about the dolphins? What are the reasons for your views?
2. How many dolphins do you usually spot per encounter?
3. In your opinion, how many dolphins are there in Lovina?
4. How far you typically travel during a dolphin watching trip in the wet seasons? How about the dry
seasons? Please explain further?
5. Do you recognise any individuals among the dolphins? Any animals with particular marks or scars?
Income dependency
6. How many people depend on your income as a dolphin guide?
Background of operators at their port
7. Are all the operators at your port dolphin guides? Or are some of them mainly fishers, farmers, etc?
Page 249
227
8. Are the operators at your port all native to Lovina, or do any of them come from another
village/region?
The origin of their boats
9. How do you and your members obtain their boats? Were they made locally? Where do the materials
come from? What about the engines?
10. Do you (or your member) have to borrow money from the bank or other institutions to pay for the
boats?
11. How long does it take a typical member to pay back their loan?
Pricing
12. How is the dolphin watching fee charged by operators in your group determined?
13. If you need to increase/change the price, do you consult with the other groups of operators?
14. How do you avoid being forced to drop your prices by other groups undercutting you?
Other income source
15. What else do the boatmen in your group do for income?
16. How many days per week (or hours per day) are they typically engaged in work other than dolphin
watching?
Boat ownership
17. Are there any members of your group who do not own their own boat?
18. How the revenue shared between boat owners and operators in such cases?
Structure of dolphin guide group
19. How is your group organised? (Leader, secretary, treasurer, etc)
20. How are the office bearers chosen?
21. What is the process of decision making in your group?
How their dolphin co-operative group works/interacts with other groups
22. Does your group meet regularly? How often do they meet?
23. What sorts of matters do you discuss during the meetings?
24. Do you discuss revenue sharing and how?
25. Do you have regular meetings with the other groups of dolphin operators in Lovina?
26. If not, how do you achieve agreements amongst each other with regard to pricing and other matters?
Marketing strategy
27. How does your group handle marketing?
28. Do you receive any help from the government, or just word of mouth?
Joining the group/industry
29. What are the rules for operators that want to join your group?
30. What are the rules for operatorsthat want to leave your group?
31. If the boat driver is different from the boat owner, are both members of your group?
Strengths of your industry
32. In your opinion, what are the strengths/good things about the dolphin watching industry in Lovina?
33. What do the tourists like about the industry here?
Page 250
228
Importance of industry to Lovina/their port
34. How important is the dolphin industry for Lovina/ your port/village?
Importance of the industry to you personally
35. How important is the dolphin industry in Lovina to you personally? What do you value?
Thank and set time for future meeting(s)
36. When would it be convenient to you for us to meet again?
-xxx-
THIRD MEETING
Weaknesses/concerns of the industry
1. Are there any things that worry you about the future of dolphin tourism in Lovina?
The ‘what-if’ scenario for interruption in dolphin abundance/behaviours
2. In other parts of the world, there are instances where the dolphins stop coming, or becoming harder to
find, or move away from the usual spotting points because too many tourists or boats get too close to
the dolphins. Such activities interrupted the dolphin‟s life cycle (e.g. breeding, feeding, etc), hence
the dolphins changed their behaviours and avoid the boats. What do you think would happen in
Lovina if similar things also happened here?
3. Depending on your concerns above, how do you think those concerns can be avoided?
4. How do you think your proposed solutions would help solve the problems?
Accident at sea
5. Do marine accidents happen often at Lovina? (e.g boat capsize, people/ tourists/ fishers lost at sea)
6. What are your strategies to ensure the safety for tourist? (e.g. does Lovina/North Bali have a rapid
search capacity?)
7. Do you have plans to improve the safety measures used by the operators in your group? By you
personally Please tell me about your plans? (only ask last question if he reports plans to change)
Suggestions for management
(Read to the respondents) In other parts of the world, because of the impacts on dolphins, people have been
implementing several regulations/agreements to make sure that the future dolphin guides and tourists still
can enjoy the dolphin watching tourism. This time, what about if we explore some possibilities in Lovina?
8. Should there be any limit on boat numbers at Lovina? What do you think that limit should be?
Higher, about now the same as now, or less?
9. Should there be any limit on the distance between boats and dolphins at Lovina? What do you think
that limit should be?
Page 251
229
10. Should there be any restrictions on where the boats go searching for dolphins in Lovina? Where do
you think such limits should be? (Spatial closure)
11. Should there be any restrictions on when the boats go dolphin watching in Lovina? What do you
think these should be? (Seasonal or daily closure)
12. Do you think it would be appropriate for there to be different times of departure for dolphin
watching? e.g. some boatmen depart at 6 a.m., some at 7 a.m., and some departing at 8 a.m.?
13. Should there be any restrictions on interaction times with the dolphins at Lovina? If so what do you
think these limits should be?
14. Do you have any other suggestions for the management of dolphin watching tourism in Lovina?
- thank you very much-
Page 252
230
Appendix 4 Questions for semi-structured interviews with dolphin boatmen
DOLPHIN-WATCHING TOURISM IN BALI: INTERVIEWS
Group: fishers/dolphin guides in Lovina
Say this:
Thank you for participating in our interviews about dolphin-watching tourism in Bali, which will take about an
hour. Your name will be kept confidential at all times during the analysis and presentation of any data obtained
from this interview. You are an expert on dolphin watching tourism in this village and your help is therefore
very important to us. Your knowledge and ideas will assist us greatly in working for a sustainable future for
dolphin watching in Lovina.
(Note: Icha’s team will fill in this form, which serves as the interview guide)
Name: (optional) Occupation:
Year of birth: Village of origin in Indonesia:
Village of residence:
Highest education level achieved:
o Attended elementary
school
o Completed elementary
school
o Attended secondary
school
o Completed secondary
school
o Attended high school
o Completed high school
o Attended uni/college
o Completed uni/college
About yourself and how to find the dolphins
15. How long have you been living in the Lovina area? _________years
16. What was your occupation before becoming a dolphin boatman? ______________
17. If you had a previous job, why did you change?
__________________________________________________________________
18. How long have you been involved in dolphin tourism? _____years, or from what year______
19. In your opinion, what do the tourists like best about Lovina?
__________________________________________________________________
__________________________________________________________________
20. In your opinion, what do the tourists dislike most about Lovina?
__________________________________________________________________
__________________________________________________________________
21. Why do you think the dolphins are here (off Lovina)?
__________________________________________________________________
Page 253
231
22. I understand that you depart around 6am every morning for a journey lasting about two hours.
When you depart from the port, how do you decide where to go to search for dolphins?
__________________________________________________________________
23. How do you find the dolphins?
__________________________________________________________________
24. What other clues or indications do you use to find dolphins?
__________________________________________________________________
25. When you spot your first dolphins for the day, what do you usually do next with the boat? (Probe
further if needed as follows: Do you start your engine and go towards the dolphins? Or, if you’re
already nearby, do you continue travelling at the same speed as the dolphins? )
__________________________________________________________________
26. Do you think the behaviour of the dolphins has changed since you first became a dolphin tour
guide/boatman?
Yes No
27. If so, how?
__________________________________________________________________
__________________________________________________________________
28. How do you drive/manoeuvre your boat to give your tourists the best possible dolphin experience?
__________________________________________________________________
__________________________________________________________________
29. Do you ever encounter any difficulties with other boats/boatmen?
Yes No
30. What sort of problems do you encounter?
__________________________________________________________________
__________________________________________________________________
31. How do your passengers feel about these problems?
__________________________________________________________________
__________________________________________________________________
32. How do you see the dolphins reacting to these problems?
__________________________________________________________________
__________________________________________________________________
Page 254
232
About your tourists & safety issues
33. Tell me about your tourists. Which countries do they mainly come from?
_________________________________________________________________
34. How do you like tourists to behave on your boat?
_________________________________________________________________
35. Are some tourists more likely to behave like this than others?
Yes No
36. If you can predict their behaviour, what factors do you use to predict tourist behaviour according to
the above question? (probe: their nationalities? Gender? Age? Skip if they said that all tourists
behave the same)
_________________________________________________________________
37. Are there any tourist behaviours on the boat that you don‟t like?
_________________________________________________________________
38. Are some tourists more likely to behave like this than others?
Yes No
39. If you can predict their behaviour, what factors do you use to predict tourist behaviour according to
the above question? (probe: their nationalities? Gender? Age? Skip if they said that all tourists
behave the same)
_________________________________________________________________
40. Please tell me about the best dolphin watching trip you have ever had?
__________________________________________________________________
41. Please tell me about the worst dolphin watching trip you have ever had?
__________________________________________________________________
42. How do you handle safety issues for the tourists?
__________________________________________________________________
43. Do you have any safety equipment in your boats? If yes, what do you carry?
__________________________________________________________________
The Brochure
44. We distributed this dolphin tourism brochure free of charge to the guide association last July (show
them a copy). Have you seen the brochure before?
Yes No
Page 255
233
45. Have you used the brochure with your passengers?
Yes No
46. Have you found it useful?
Yes No
47. What did you like most about it?
__________________________________________________________________
48. What didn‟t you like about it?
__________________________________________________________________
49. Do you need more brochures?
__________________________________________________________________
50. Do you have any suggestions to improve the brochure?
__________________________________________________________________
Dolphins and fishing boats
51. Do you ever go out fishing without tourists?
Yes No
52. If yes, have you ever seen dolphins when fishing?
Yes No
53. If yes, what did the dolphins do?
__________________________________________________________________
54. Do you think the dolphins behave differently with boats when the boats are fishing versus when
there are tourists onboard? Why do you think this is?
__________________________________________________________________
55. Do you notice any changes in the way the dolphins behave when you get close to them while you
are fishing)?
__________________________________________________________________
Now we talk about the economic benefits. Feel free not to answer if this is uncomfortable for you – but
do remember that all responses are kept completely confidential.
56. How many people depend on your income as a dolphin guide (NOT including yourself)?
_____________________________
57. How much time do you usually spend on your dolphin watching activities in an average week?
a. How many trips did you do last week?_____________
b. Over how many days _______________
Page 256
234
58. Aside from being a dolphin tour guide/boatman and occasionally taking people snorkelling, what
else do you do for income? (all dolphin guides offer snorkelling as an additional package)
__________________________________________________________________
59. How much time do you usually spend in doing this other work?
…. days per week; or …. hours per day
How many hours did you spend last week?
Over how many days
60. What percentage of your total monthly income is derived from your dolphin tourism activities?
______
61. Where does the remaining % come from? _____________________________
62. Do you own the boat you use daily for the trip? ________________
63. If you do NOT own your boat, who owns it? How is the revenue shared between the boat owner
and you? _________________________________
64. If you own your boat, where did you buy it? ____________________
65. Did you borrow the money to buy the boat?
Yes No
66. From where did you obtain the money? ___________________________
67. (If you took out a loan) How many years do you still have to pay your loan?
__________________
68. Do you think the dolphin tourism is important for your village? Why?
__________________________________________________________________
69. How important is the dolphin industry for your village? (show flash card)
1--------2--------3--------4--------5--------6--------7--------8--------9--------10
70. Do you think the dolphin tourism is important for you personally? Why?
__________________________________________________________________
71. How important is the dolphin industry in Lovina to you personally? (show flash card)
1--------2--------3--------4--------5--------6--------7--------8--------9--------10
72. What do you think dolphin tourism in Lovina will look like in 10 years time?
__________________________________________________________________
Not at all
important
Very
important
Not at all
important
Very
important
Page 257
235
__________________________________________________________________
73. If there are changes as you predict, do you think the changes you predict will affect the dolphin‟s
behaviour?
Yes No
74. If yes, how?
__________________________________________________________________
__________________________________________________________________
75. Do you have any other suggestions to improve dolphin watching tourism in Lovina? For instance, for
better management of the boats?
__________________________________________________________________
__________________________________________________________________
76. What is your reaction to the suggestion that dolphin operators develop and adopt a Code of Practice?
__________________________________________________________________
__________________________________________________________________
77. What do you think about a request that new boatmen must receive training?
__________________________________________________________________
__________________________________________________________________
78. Is there anything else you would like to tell me?
__________________________________________________________________
__________________________________________________________________
- Thank you very much for your time. You have given me very valuable insights-
Page 258
236
Appendix 5 The card technique for Lovina stakeholder meetings
This method was developed based on the Metaplan Method and was used during the
stakeholder meetings in Lovina where some results of this research were presented as
outlined in Chapter 6. Developed in Germany in 1972, the Metaplan Method (Habershon
1993) aims to facilitate participants brainstorming opinions and ideas in a short period of
time using basic facilitation techniques including large pinboards, butcher‟s papers and
colourful cards. The technique was modified to present ideas, to record issues and to
obtain input from stakeholders during the meetings. Below is the step by step guideline to
the technique that I used.
1. Personnel
At least four people are needed during the meeting to perform the following tasks:
a. talk through the cards,
b. stick the cards to the wall/board,
c. write notes of the meeting (including recording the audio (if agreed by the
participants),
d. deliver the stickers, take photographs and other errands
2. Preparation for the meeting
Decide the aim(s) of the meeting.
Group the cards into several themes, one colour per theme.
Write points or topics in colour cards, one point or topic per card.
Page 259
237
3. Meeting presentation and discussion
Talk through the cards, the first person delivering one topic per card as the second
person attaches each card to the wall/board.
Hold discussions after the conclusion of each theme to prevent people forgetting
their ideas and to focus the discussions on the topic. In Lovina, I asked the
participants to discuss each card. I used cards of the relevant colours (but different
marker colours) to record points/themes of discussion and to park them next to the
topic cards.
Continue the explanations and discussions until all themes have been discussed.
Go through the „take home message‟ cards.
4. Voting and second discussion
Conduct voting during the coffee break. Use voting for participants to identify
three topics per theme they wanted to discuss during the short „panel‟ discussion
(held over the next 30 min). Ask each participant to identify the topics of most
importance to them by placing three coloured stickers per theme (preferably using
the same colour family as the theme cards). In Lovina, I gave each participant 12
stickers for each participant (three per theme) and told them that all stickers must
go (all participants must use their voting chance). This stage tends to be the most
interesting of this method, for all participants have the same chance to vote.
Participants may be involved in internal lobbying (The facilitator decides whether
lobbying is allowed or not).
Page 260
238
At the end of the coffee break and voting time, count the number of stickers per
topic and select the most popular topics (my team discarded topics with less than
5 stickers).
Rearrange the topic cards. Place the most popular cards at top list; park non
popular cards elsewhere. Where there is tie, place tied cards at the same level
After the cards of all themes are rearranged, talk through the voted topics for the
first theme. Ask participants why they think a topic is the most popular one.
After one theme is discussed, give the participants time to give more comments
before moving to the next theme. Continue the same discussion pattern until all
voted cards for all themes are discussed.
Write an account of the discussion (one card per suggestion) and place it next to
the related cards.
5. Concluding activities
Hold a final Question & Answer session after all topics have been explained to
give participants time to ask questions or give additional comments
Wrap up the meeting by summarising the results. The „take home message‟ cards
may be revisited and added with 1-2 more messages, but should be kept simple.
Important feedback can be included as new topic cards for the next meeting
round. Remember to mention that the new topic emerged during the previous
meeting. Include this card in the voting stage and see if the idea is embraced by
other group(s)
Page 261
239
Appendix 6 Short project flyer
Hello there!
My name is Icha (short for Putu Liza Kusuma Mustika). I am a Balinese, and
also a PhD student from James Cook University in Australia. From February
to May 2009, I’m conducting research on dolphin-watching tourism in Bali.
Lovina is one of my study sites.
My projects aims to collect information that will help the local dolphin guides
run their operation in a way which minimises impacts on the dolphins while
taking account of their views and needs. It will help my research project a
great deal if you can fill in this questionnaire, which will take approximately
5 minutes.
The information you provide will be used for research purposes only. You are
welcome to remain anonymous, and if you do give us your name and contact
details, your responses will still be kept completely confidential.
If you cannot complete the questionnaire now, but are interested in
completing it later today, may I or another member of my team come to your
hotel this afternoon or whenever is convenient for you to pick up your
completed questionnaire?
My cell phone (mobile) is: 0815 588 57547 and my email is
[email protected]
Thanks a lot for your help!