11
Business Briefing Towards sustainable packaging materials Examining the relative impact of materials in the natural source water and soft drinks value chain
www.cisl.cam.ac.uk
Business Briefing
Head office 1 Trumpington Street Cambridge CB2 1QA, UK T: +44 (0)1223 768850 [email protected]
Brussels The Periclès Building Rue de la Science 23 B-1040 Brussels, Belgium T: +32 (0) 2 894 93 19 [email protected]
Cape Town PO Box 313 Cape Town 8000 South Africa T: +44 (0)1223 768850 [email protected]
Towards sustainable packaging materialsExamining the relative impact of materials in the natural source water and soft drinks value chain
www.cisl.cam.ac.uk @cisl_cambridge
ContentsRewiring the Economy is our ten-year plan to lay the foundations for a sustainable economy, built on ten interdependent tasks, delivered by business, government, and finance leaders co-operatively over the next decade.
The University of Cambridge Institute for Sustainability Leadership (CISL) is a globally influential Institute developing leadership and solutions for a sustainable economy. We believe the economy can be ‘rewired’, through focused collaboration between business, government and finance institutions, to deliver positive outcomes for people and environment.
For over three decades we have built the leadership capacity and capabilities of individuals and organisations, and created industry-leading collaborations, to catalyse change and accelerate the path to a sustainable economy. Our practitioner orientated research builds the evidence base for action
Publication detailsCopyright © 2020 University of Cambridge Institute for Sustainability Leadership (CISL). Some rights reserved.
Creative Commons The material featured in this publication is distributed under the Creative Commons Attribution-Licence. The details of this licence may be viewed in full at: https://creativecommons.org/licenses/by/4.0
Disclaimer
The opinions expressed here are those of the authors and do not represent an official position of CISL, the University of Cambridge, or any of its individual business partners or clients.
Acknowledgements
This report was written by Beverley Cornaby, with input and support from Eliot Whittington and Serena Liuni. Additional research was carried out by Hannah Van Den Bergh. We would like to thank the businesses supporting this publication: Brecon Mineral Water; Britvic plc; Danone Waters (UK & Ireland); Harrogate Water Brands; Highland Spring Group; Lucozade Ribena Suntory; Montgomery Waters; the Natural Source Waters Association; Nestlé Waters UK; Roxane UK; Shepley Spring; and, Wenlock Spring, for their input and feedback.
Reference
Please refer to this business briefing as: University of Cambridge Institute for Sustainability Leadership (CISL) (2020). Towards sustainable packaging materials: Examining the relative impact of materials in the natural source water and soft drinks value chain. Cambridge, UK: the Cambridge Institute for Sustainability Leadership.
Copies
This full document can be downloaded from CISL’s website: www.cisl.cam.ac.uk/publications
The University of Cambridge Institutefor Sustainability Leadership
Rewiringthe Economy
Foreword 4Executive Summary 4Introduction 5Examining the relative impact of materials 8The implications for what business needs to do 12Appendix: Methodology 14References 18
This CISL project was supported by the following businesses in the natural source water and soft drinks value chain
Towards Sustainable Packaging Materials2 3
When we set out to undertake the work for this report, we, and the businesses we are working with, were operating in what feels like a different world. Now we are all addressing a new, common concern: a global health crisis of unprecedented scale that has led to unimaginable social, economic and political change, as well as some of the most challenging and extraordinary operating contexts for business that we have seen in modern times.
As a result, business-as-usual is no longer an option. While none of the drivers to address the global plastics challenge, (itself termed a ‘crisis’ by the United Nations) are any less strong, it is inevitable that immediate priorities have to focus on protecting lives and maintaining key systems. In this context, important waste and resource management policies and strategies like the introduction of deposit return schemes in parts of the UK, have been put on hold. And existing practice, regulations and behaviour in this area are being challenged, as hygiene and safety reasons have led to a resurgence of plastic packaging as providing a cheap, disposable protective barrier.
Of course, while we quite rightly need to address the immediate health crisis in the short-term, it is important that we do not lose sight of the longer-term goals for a sustainable economy. As we emerge from this crisis period, business and government, will collectively need to reconsider the approaches they are taking to tackling other social and environmental concerns, such as the plastic packaging waste challenge.
We hope that this report can support business and government in this process, and that the recommendations can provide a basis on which to ensure a considered approach is taken by business in their future packaging material decision-making.
Eliot WhittingtonDirector, Centre for Policy and Industrial Transformation
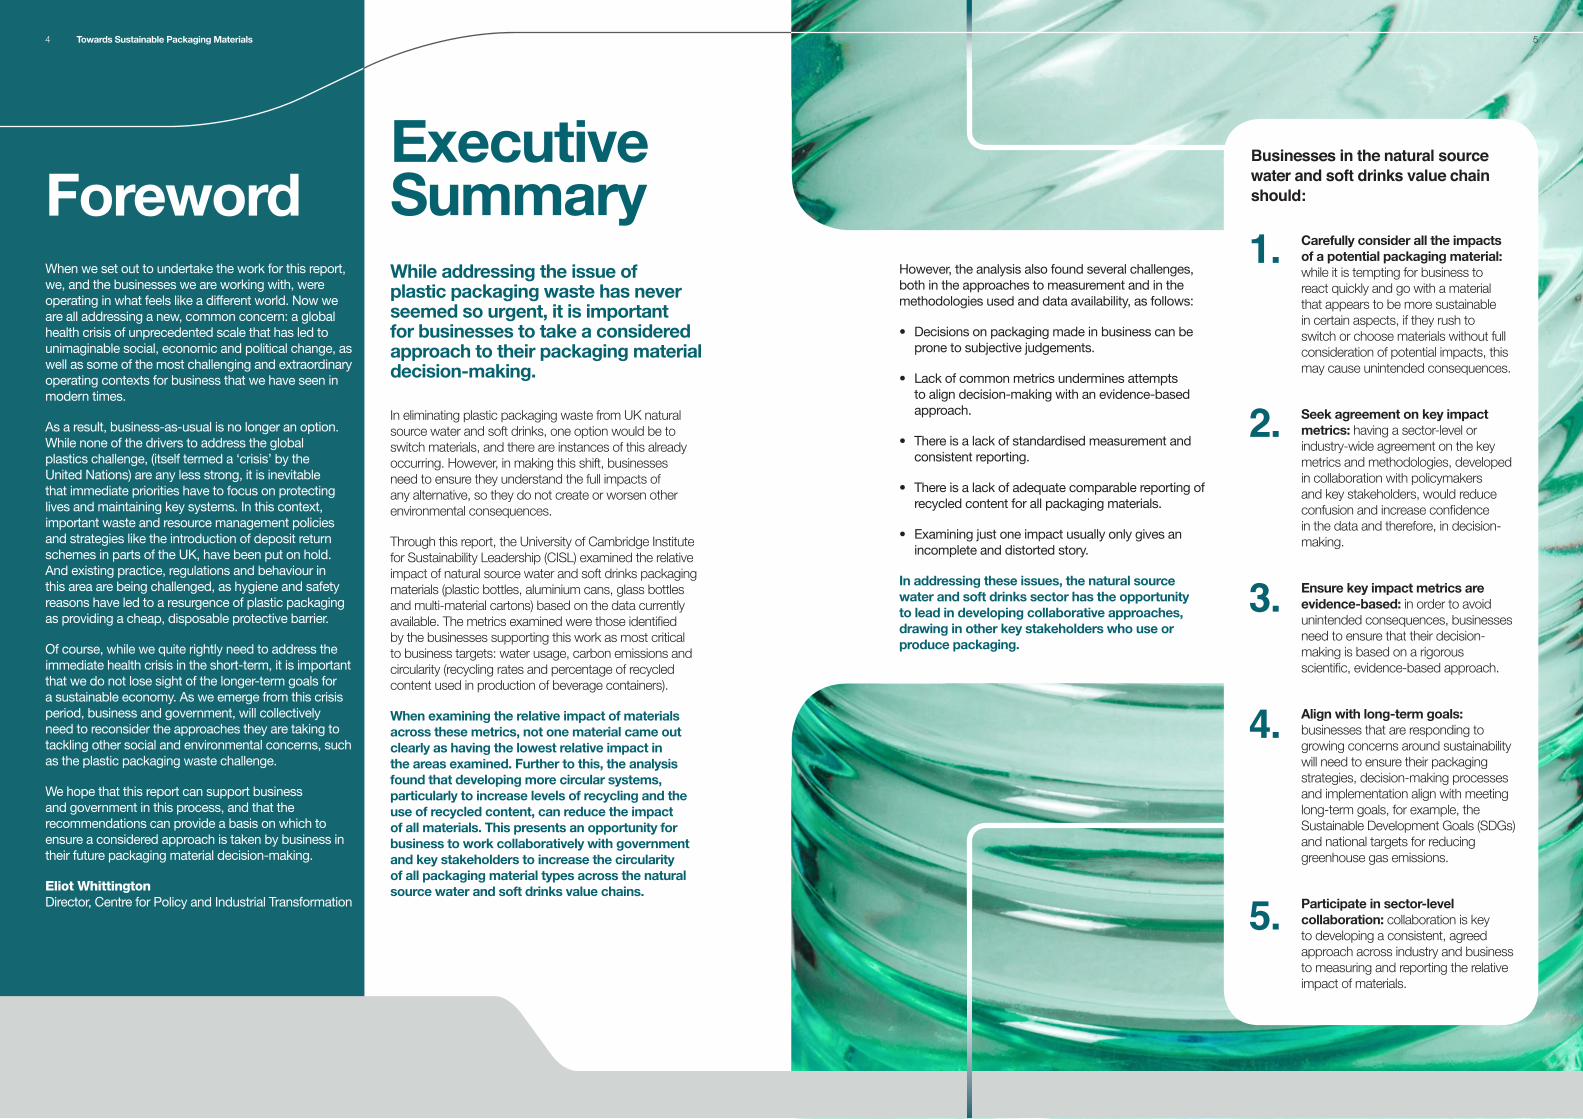
ForewordCarefully consider all the impacts of a potential packaging material: while it is tempting for business to react quickly and go with a material that appears to be more sustainable in certain aspects, if they rush to switch or choose materials without full consideration of potential impacts, this may cause unintended consequences.
Seek agreement on key impact metrics: having a sector-level or industry-wide agreement on the key metrics and methodologies, developed in collaboration with policymakers and key stakeholders, would reduce confusion and increase confidence in the data and therefore, in decision-making.
Ensure key impact metrics are evidence-based: in order to avoid unintended consequences, businesses need to ensure that their decision-making is based on a rigorous scientific, evidence-based approach.
Align with long-term goals: businesses that are responding to growing concerns around sustainability will need to ensure their packaging strategies, decision-making processes and implementation align with meeting long-term goals, for example, the Sustainable Development Goals (SDGs) and national targets for reducing greenhouse gas emissions.
Participate in sector-level collaboration: collaboration is key to developing a consistent, agreed approach across industry and business to measuring and reporting the relative impact of materials.
1.
2.
3.
4.
5.
Businesses in the natural source water and soft drinks value chain should:
In eliminating plastic packaging waste from UK natural source water and soft drinks, one option would be to switch materials, and there are instances of this already occurring. However, in making this shift, businesses need to ensure they understand the full impacts of any alternative, so they do not create or worsen other environmental consequences.
Through this report, the University of Cambridge Institute for Sustainability Leadership (CISL) examined the relative impact of natural source water and soft drinks packaging materials (plastic bottles, aluminium cans, glass bottles and multi-material cartons) based on the data currently available. The metrics examined were those identified by the businesses supporting this work as most critical to business targets: water usage, carbon emissions and circularity (recycling rates and percentage of recycled content used in production of beverage containers).
When examining the relative impact of materials across these metrics, not one material came out clearly as having the lowest relative impact in the areas examined. Further to this, the analysis found that developing more circular systems, particularly to increase levels of recycling and the use of recycled content, can reduce the impact of all materials. This presents an opportunity for business to work collaboratively with government and key stakeholders to increase the circularity of all packaging material types across the natural source water and soft drinks value chains.
ExecutiveSummaryWhile addressing the issue of plastic packaging waste has never seemed so urgent, it is important for businesses to take a considered approach to their packaging material decision-making.
However, the analysis also found several challenges, both in the approaches to measurement and in the methodologies used and data availability, as follows:
• Decisions on packaging made in business can be prone to subjective judgements.
• Lack of common metrics undermines attempts to align decision-making with an evidence-based approach.
• There is a lack of standardised measurement and consistent reporting.
• There is a lack of adequate comparable reporting of recycled content for all packaging materials.
• Examining just one impact usually only gives an incomplete and distorted story.
In addressing these issues, the natural source water and soft drinks sector has the opportunity to lead in developing collaborative approaches, drawing in other key stakeholders who use or produce packaging.
5Towards Sustainable Packaging Materials4
Introduction
The significant challenges presented by plastic packaging waste can only be solved through collaborative actions from business, government and society. CISL’s report, Towards sustainable packaging: A plan to eliminate plastic packaging waste from UK bottled water and soft drinks,1 lay out practically how stakeholders across the natural source water and soft drinks value chain could work together, and more widely with others, to achieve zero plastic packaging waste from UK natural source water and soft drinks by 2030.
A vision to eliminate plastic packaging waste
In 2018, CISL convened a working group of businesses from the natural source water and soft drinks value chains. The companies sought to set out an ambitious vision and roadmap towards eliminating plastic packaging waste from their sectors.
The resulting report setting out the agreed vision (see Figure 1), Towards sustainable packaging1 was published by CISL in September 2018. While the urge to search for quick fixes may be strong, the report recognised the complexities of the plastics challenge and the need to avoid unintended consequences, such as through increasing carbon emissions or diverting land away from food production.
The report also recognised that while government and business are already starting to address the issue, there is still a need to set ambitious goals to push the sector and create a transformational shift to eliminate plastic packaging waste. To create a value chain where zero plastic packaging waste is sent to landfill or escapes into the natural environment, more circular systems must be created. Instead of a primarily ‘end of life’ waste disposal system, resources are managed through the economy, to secure their maximum value and productivity in a way that is easy for consumers and businesses to engage with.
The report further identified the need for industry and government to work together to optimise material choice for soft drinks packaging. Set out within
Pathway B, the desired end point was to ensure
that through agreed goals and dynamic industry standards, soft drinks are only put on the market in the best packaging available that can be recycled or reused, but that also has the lowest
environmental impact overall.
Towards a standardised lowest impact packaging material
In eliminating plastic packaging waste from UK natural source water and soft drinks, one option would be to switch materials, and there are instances of this already occurring.
In recent years, data from the British Soft
Drinks Association1,2,3 shows some slight shifts in
the type of packaging used by soft drinks companies. While the shifts are minimal in terms of overall market shares, it is notable that the percentage in plastic has fractionally decreased, while the percentage in metal and glass has fractionally increased.
In making this shift, businesses need to ensure they understand the full impacts of any alternative, so they do not create or worsen other environmental consequences. For plastic bottles, life cycle analysis has always consistently highlighted its lower carbon footprint, with glass bottles needing to be reused at least 20 times before their carbon emissions become equivalent at current recycling rates for polyethylene terephthalate (PET) bottles.4 However, most current assessment methods and studies do not necessarily account for end-of-life impacts. This includes how an item is disposed of and what impact it can have on the environment if not disposed of properly.
CISL’s report Towards sustainable packaging1 identified the need for independent, publicly available, academically rigorous research comparing the holistic impacts of different material choices to support business and consumer decision-making, both in the current context and to leverage innovations in the future. Undertaking this type of research would also have the potential for identifying what qualities the optimal lowest impact material for a particular use would have, and if that material is not currently available, the standards and policy that would enable its use at scale.
To support further research in this area, in late 2019, CISL undertook a scoping exercise, including desk research and a workshop, to examine the relative impact of natural source water and soft drinks packaging materials based on the data currently available. This report summarises the findings and makes recommendations to support business packaging material decision-making in the natural source water and soft drinks sector.
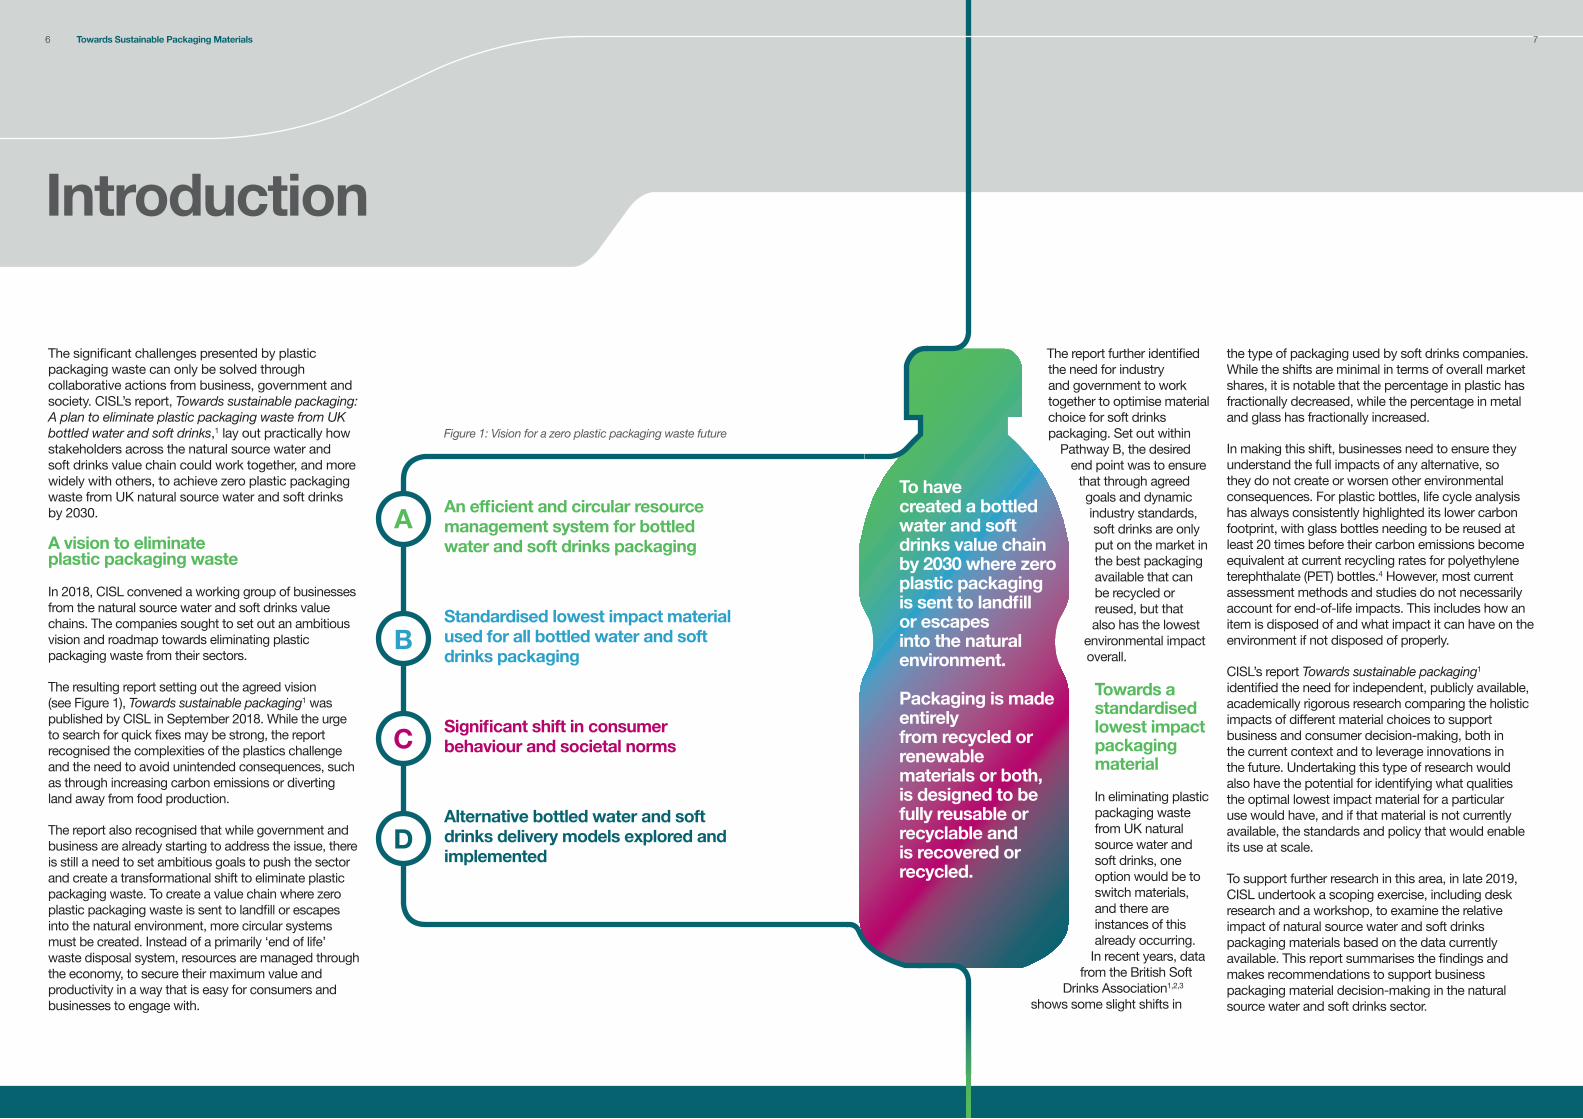
An efficient and circular resource management system for bottled water and soft drinks packaging
Standardised lowest impact material used for all bottled water and soft drinks packaging
Significant shift in consumer behaviour and societal norms
Alternative bottled water and soft drinks delivery models explored and implemented
To have created a bottled water and soft drinks value chain by 2030 where zero plastic packaging is sent to landfill or escapes into the natural environment.
Packaging is made entirelyfrom recycled orrenewable materials or both, is designed to be fully reusable or recyclable andis recovered orrecycled.
A
B
C
D
Figure 1: Vision for a zero plastic packaging waste future
Towards Sustainable Packaging Materials6 7
However, while there is this opportunity, there were also several challenges found both in the approaches to measurement and in the methodologies used and data availability that need to be addressed. These are set out below.
Decisions on packaging made in business can be prone to subjective judgements
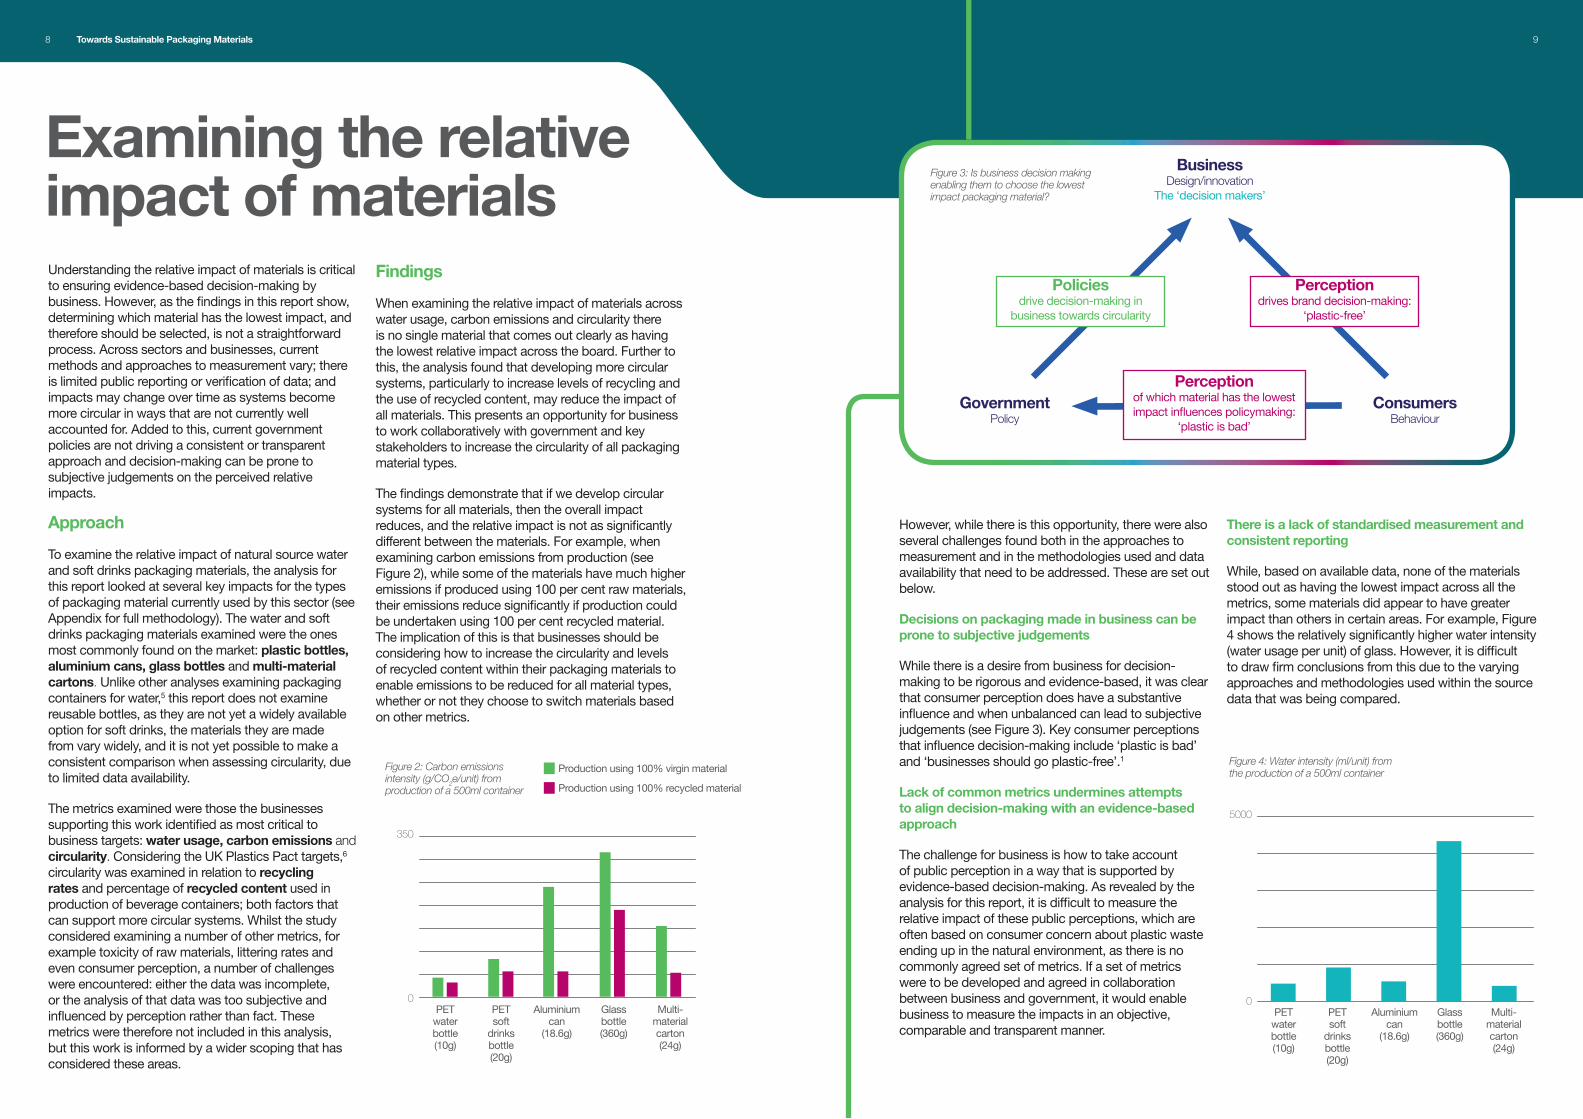
While there is a desire from business for decision-making to be rigorous and evidence-based, it was clear that consumer perception does have a substantive influence and when unbalanced can lead to subjective judgements (see Figure 3). Key consumer perceptions that influence decision-making include ‘plastic is bad’ and ‘businesses should go plastic-free’.1
Lack of common metrics undermines attempts to align decision-making with an evidence-based approach
The challenge for business is how to take account of public perception in a way that is supported by evidence-based decision-making. As revealed by the analysis for this report, it is difficult to measure the relative impact of these public perceptions, which are often based on consumer concern about plastic waste ending up in the natural environment, as there is no commonly agreed set of metrics. If a set of metrics were to be developed and agreed in collaboration between business and government, it would enable business to measure the impacts in an objective, comparable and transparent manner.
There is a lack of standardised measurement and consistent reporting
While, based on available data, none of the materials stood out as having the lowest impact across all the metrics, some materials did appear to have greater impact than others in certain areas. For example, Figure 4 shows the relatively significantly higher water intensity (water usage per unit) of glass. However, it is difficult to draw firm conclusions from this due to the varying approaches and methodologies used within the source data that was being compared.
Understanding the relative impact of materials is critical to ensuring evidence-based decision-making by business. However, as the findings in this report show, determining which material has the lowest impact, and therefore should be selected, is not a straightforward process. Across sectors and businesses, current methods and approaches to measurement vary; there is limited public reporting or verification of data; and impacts may change over time as systems become more circular in ways that are not currently well accounted for. Added to this, current government policies are not driving a consistent or transparent approach and decision-making can be prone to subjective judgements on the perceived relative impacts.
Approach
To examine the relative impact of natural source water and soft drinks packaging materials, the analysis for this report looked at several key impacts for the types of packaging material currently used by this sector (see Appendix for full methodology). The water and soft drinks packaging materials examined were the ones most commonly found on the market: plastic bottles, aluminium cans, glass bottles and multi-material cartons. Unlike other analyses examining packaging containers for water,5 this report does not examine reusable bottles, as they are not yet a widely available option for soft drinks, the materials they are made from vary widely, and it is not yet possible to make a consistent comparison when assessing circularity, due to limited data availability.
The metrics examined were those the businesses supporting this work identified as most critical to business targets: water usage, carbon emissions and circularity. Considering the UK Plastics Pact targets,6
circularity was examined in relation to recycling rates and percentage of recycled content used in production of beverage containers; both factors that can support more circular systems. Whilst the study considered examining a number of other metrics, for example toxicity of raw materials, littering rates and even consumer perception, a number of challenges were encountered: either the data was incomplete, or the analysis of that data was too subjective and influenced by perception rather than fact. These metrics were therefore not included in this analysis, but this work is informed by a wider scoping that has considered these areas.
Findings
When examining the relative impact of materials across water usage, carbon emissions and circularity there is no single material that comes out clearly as having the lowest relative impact across the board. Further to this, the analysis found that developing more circular systems, particularly to increase levels of recycling and the use of recycled content, may reduce the impact of all materials. This presents an opportunity for business to work collaboratively with government and key stakeholders to increase the circularity of all packaging material types.
The findings demonstrate that if we develop circular systems for all materials, then the overall impact reduces, and the relative impact is not as significantly different between the materials. For example, when examining carbon emissions from production (see Figure 2), while some of the materials have much higher emissions if produced using 100 per cent raw materials, their emissions reduce significantly if production could be undertaken using 100 per cent recycled material. The implication of this is that businesses should be considering how to increase the circularity and levels of recycled content within their packaging materials to enable emissions to be reduced for all material types, whether or not they choose to switch materials based on other metrics.
Examining the relative impact of materials
Business Design/innovation
The ‘decision makers’
Consumers Behaviour
Government Policy
5000
350
PETwater bottle(10g)
PETwater bottle(10g)
PETsoft
drinks bottle(20g)
PETsoft
drinks bottle(20g)
Aluminiumcan
(18.6g)
Aluminiumcan
(18.6g)
Glass bottle(360g)
Glass bottle(360g)
Production using 100% virgin material
Production using 100% recycled material
Multi-materialcarton(24g)
Multi-materialcarton(24g)
00
Figure 4: Water intensity (ml/unit) from the production of a 500ml container
Figure 3: Is business decision making enabling them to choose the lowest impact packaging material?
Figure 2: Carbon emissions intensity (g/CO2e/unit) from production of a 500ml container
Perceptiondrives brand decision-making:
‘plastic-free’
Perceptionof which material has the lowest impact influences policymaking:
‘plastic is bad’
Policiesdrive decision-making in
business towards circularity
9Towards Sustainable Packaging Materials8
The common variations in methodology identified include:
• Stages of production covered: not all data covers the full life cycle of a product from production through to end of life. In most instances, the data was captured from the production phases, often referred to as ‘cradle to gate’. Limiting the scope in this way misses the in-use and end-of-life impacts, making it challenging to make a full comparison.
• Base methodology: different sources use different methodologies, which can lead to differing results and make comparison challenging. Developing an approach to consistent measurement, both in relation to current impacts and the modelling of future impacts, would support both short and long-term strategic decision-making in business.
• Level of verification: some of the studies analysed were commissioned by packaging producers and had not been independently verified. Having independent verification of data would support a consistent approach to measurement and reporting by business.
• Level of public reporting: sourcing of data can be challenging due to a lack of public reporting or published academic studies. Even where data has been published, comparisons were not always possible due to inconsistent approaches to measurement. If businesses were required to report on an agreed set of metrics and common methodology, it would be easier for business to make comparative, evidence-based decisions.
There is a lack of adequate comparable reporting of recycled content for all packaging materials
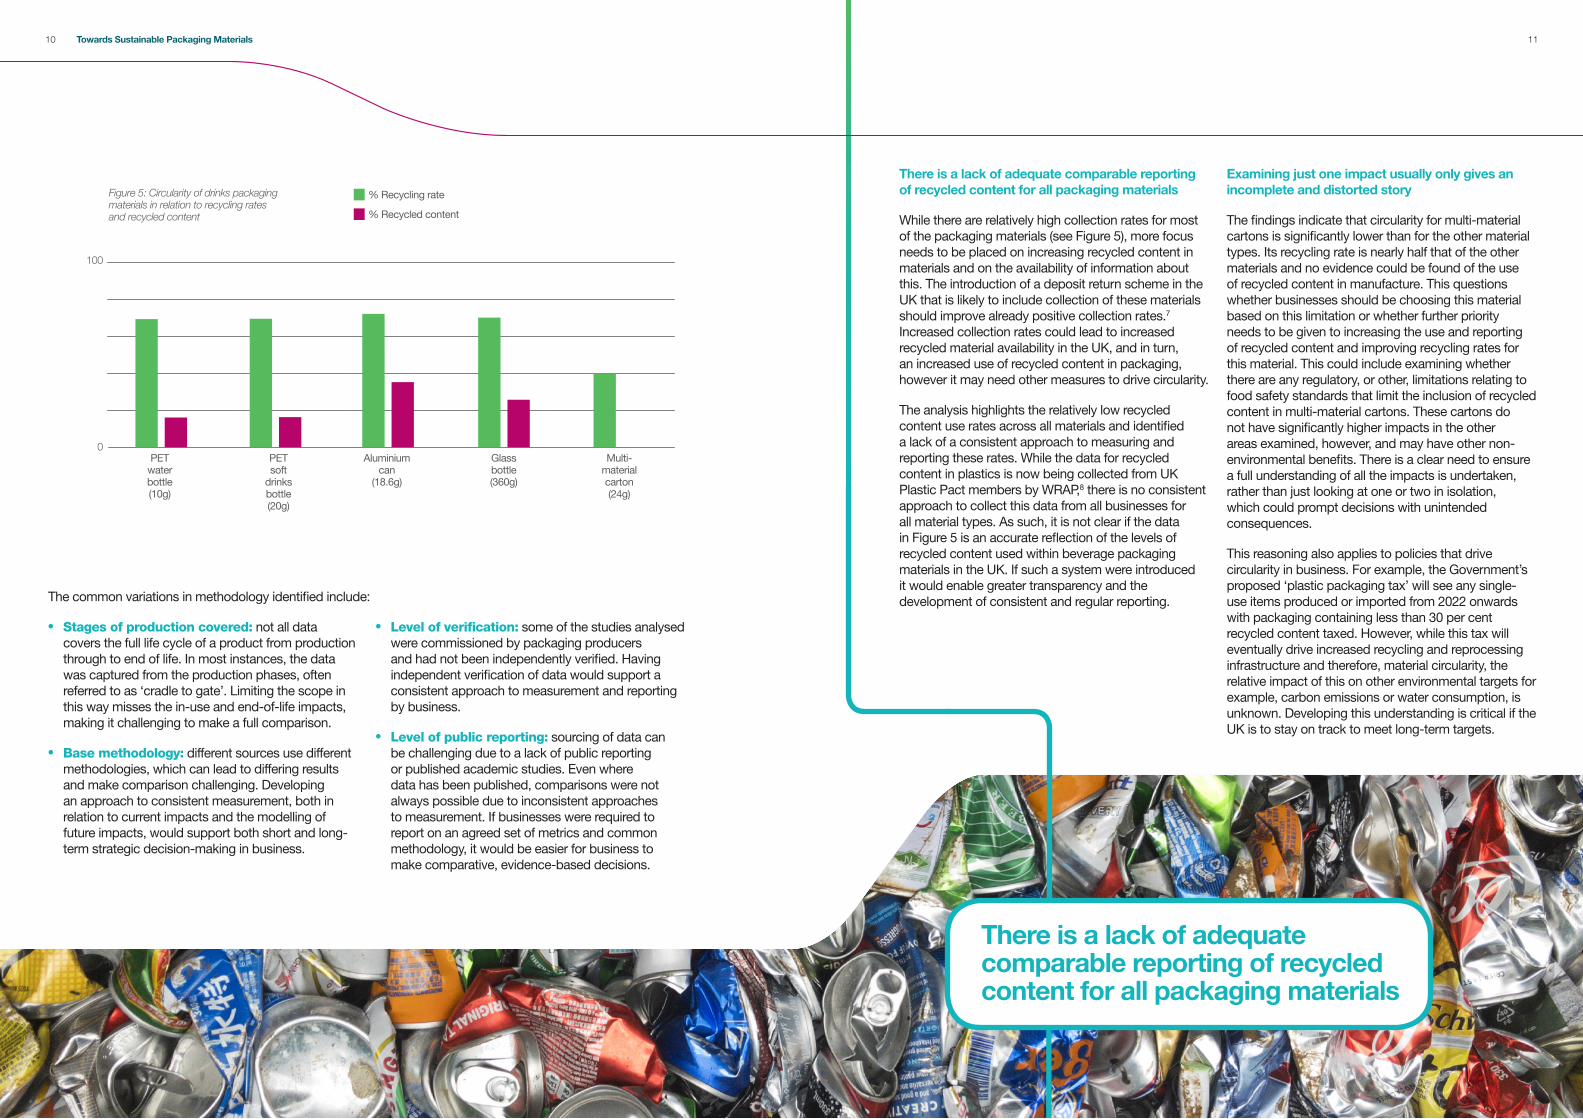
While there are relatively high collection rates for most of the packaging materials (see Figure 5), more focus needs to be placed on increasing recycled content in materials and on the availability of information about this. The introduction of a deposit return scheme in the UK that is likely to include collection of these materials should improve already positive collection rates.7 Increased collection rates could lead to increased recycled material availability in the UK, and in turn, an increased use of recycled content in packaging, however it may need other measures to drive circularity.
The analysis highlights the relatively low recycled content use rates across all materials and identified a lack of a consistent approach to measuring and reporting these rates. While the data for recycled content in plastics is now being collected from UK Plastic Pact members by WRAP,8 there is no consistent approach to collect this data from all businesses for all material types. As such, it is not clear if the data in Figure 5 is an accurate reflection of the levels of recycled content used within beverage packaging materials in the UK. If such a system were introduced it would enable greater transparency and the development of consistent and regular reporting.
Examining just one impact usually only gives an incomplete and distorted story
The findings indicate that circularity for multi-material cartons is significantly lower than for the other material types. Its recycling rate is nearly half that of the other materials and no evidence could be found of the use of recycled content in manufacture. This questions whether businesses should be choosing this material based on this limitation or whether further priority needs to be given to increasing the use and reporting of recycled content and improving recycling rates for this material. This could include examining whether there are any regulatory, or other, limitations relating to food safety standards that limit the inclusion of recycled content in multi-material cartons. These cartons do not have significantly higher impacts in the other areas examined, however, and may have other non-environmental benefits. There is a clear need to ensure a full understanding of all the impacts is undertaken, rather than just looking at one or two in isolation, which could prompt decisions with unintended consequences.
This reasoning also applies to policies that drive circularity in business. For example, the Government’s proposed ‘plastic packaging tax’ will see any single-use items produced or imported from 2022 onwards with packaging containing less than 30 per cent recycled content taxed. However, while this tax will eventually drive increased recycling and reprocessing infrastructure and therefore, material circularity, the relative impact of this on other environmental targets for example, carbon emissions or water consumption, is unknown. Developing this understanding is critical if the UK is to stay on track to meet long-term targets.
There is a lack of adequate comparable reporting of recycled content for all packaging materials
100
PETwater bottle(10g)
PETsoft
drinks bottle(20g)
Aluminiumcan
(18.6g)
Glass bottle(360g)
% Recycling rate
% Recycled content
Multi-materialcarton(24g)
0
Figure 5: Circularity of drinks packaging materials in relation to recycling rates and recycled content
Towards Sustainable Packaging Materials10 11
The findings from this report show it is important for businesses to take a considered approach in their packaging material decision-making. When considering what approach to take, businesses in the natural source water and soft drinks value chain should:
1. Carefully consider all the impacts of a potential packaging material: while it is tempting for business to react quickly and go with a material that appears to be more sustainable in certain aspects, if they rush to switch or choose materials without full knowledge of the impacts, this may cause unintended consequences, such as through increasing carbon emissions or diverting land away from food production. While it is possible to calculate some of these consequences, it is difficult to be confident in the data, given the quality concerns set out in this report.
2. Seek agreement on key impact metrics: having a sector-level or industry-wide agreement on the key metrics and methodologies could reduce confusion and increase confidence in the data and therefore, in decision-making. The current approaches are often driven by business priorities, which may vary, as different businesses may have differing values and therefore, place importance on different areas. The natural source water and soft drinks sectors have the opportunity to lead in developing a consistent set of reporting metrics and measurement methodologies that could be used across all sectors. Businesses need to work collaboratively, and together with policymakers and key sectoral stakeholders, to agree what the critical metrics are to meet long-term goals.
3. Ensure key impact metrics are evidence-based: this research has identified that consumer perception is unsurprisingly an important consideration in both packaging design and policymaking on packaging, but businesses are unclear on how to meet consumer concerns in
a way that is informed or supported by rigorous evidence-based scientific analysis and data. Businesses need to ensure that their decision-making, while taking account of consumer perception in terms of identifying what impacts are important to measure, is based on a rigorous evidence-based approach to ensure they are not creating unintended consequences. In doing so, they have the opportunity to engage their consumer base in identifying which impacts should be measured and the outcomes of any analyses.
4. Align with long-term goals: businesses that are responding to public and government concern around sustainability will need to ensure their packaging strategies, decision-making processes and implementation align with meeting long-term goals, for example, the SDGs and national targets for reducing greenhouse gas emissions. Currently, different companies place different values and importance on differing priorities, and there is no clear understanding of how these targets contribute to meeting these longer-term goals, which may lead to further problems in the future as these impacts go unmanaged. The natural source water and soft drinks sectors have an opportunity to lead in developing a clear, rigorous, evidence-based narrative for how packaging targets and sector actions meet these longer-term goals.
5. Collaboration is key to developing a consistent, agreed approach across industry and business to measuring and reporting the relative impact of materials. The current approaches used are often company specific, resulting in data that is not standardised or independently verified. The natural source water and soft drinks sector has the opportunity to lead in developing this collaborative approach, drawing in other key stakeholders who use or produce packaging.
The implications for what business needs to do
Next steps – taking forward this work
To explore how businesses can work to address some of the challenges and opportunities this report identifies with measuring the relative impact of materials, CISL has identified the following actions:
1. Assess whether current business targets on packaging support long-term targets: this will seek to examine whether current commitments that businesses can sign up to, for example, the UK Plastic Pact targets,6 are sufficient or potentially conflict with enabling us to meet long-term UK-wide or international targets, for example, targets on net zero greenhouse gas emissions, biodiversity and nature, and the SDGs.
2. Support the sector to identify and agree consistent impact metrics: the natural source water and soft drinks sector has the opportunity to lead in developing a consistent set of impact metrics and measurement methodologies that could support long-term targets and create a standardised approach across the industry.
3. Inform academic research that could model future impacts of materials: CISL will share the outcomes of this work with academics at the University of Cambridge and relevant experts to potentially inform research and the development of a methodology to model the future impact of materials that could guide decision-making.
If you are interested in supporting or learning more about CISL’s work on packaging and resource efficiency, please contact us at [email protected].
13Towards Sustainable Packaging Materials12
Appendix: Methodology
The study also sought to examine laminated pouches, given these are used for both single portions and dispensed soft drinks, however, it was not possible to source the required data and therefore they were excluded. Laminated pouches are made from layers of aluminium and plastic, and are preferred due to their lightweight and flexible qualities. However, due to containing more than one material type, they are considered challenging to recycle, although innovative small-scale processing capacity has emerged in recent years.
The study also did not include reusable bottles. They are not yet a widely available option for soft drinks, the materials they are made from vary widely, and it is not yet possible to make a consistent comparison when assessing circularity, due to limited data availability.
When looking across these materials, the study examined the data currently available for three key areas of impact across four metrics:
1. Water usage intensity: measured as the volume of water used in production.
2. Carbon emissions intensity: measured using the production emissions from processing, manufacturing and transporting of either primary or recycled materials.
3. Circularity: examined two aspects:
a. Recycling rates: the percentage of each packaging material that is recycled in the UK.
b. Recycled content: the average percentage of post-consumer recycled material used in the production of new packaging.
To ensure a consistent approach, and to try and create comparable results, the study looked at the data for the first two metrics, for if each packaging material was designed to hold 500ml of drink. The results are therefore relative to the size of the container and not to the number produced on the market. The data for circularity applies to all sizes of beverage packaging, as it was not possible to break this down further to be specific to the container size.
Between September and November 2019, CISL undertook a period of desk research examining the currently available data for the most commonly used types of natural source water and soft drinks packaging materials. The findings were tested at two workshops – one in November 2019 and one in February 2020.
The materials examined were:
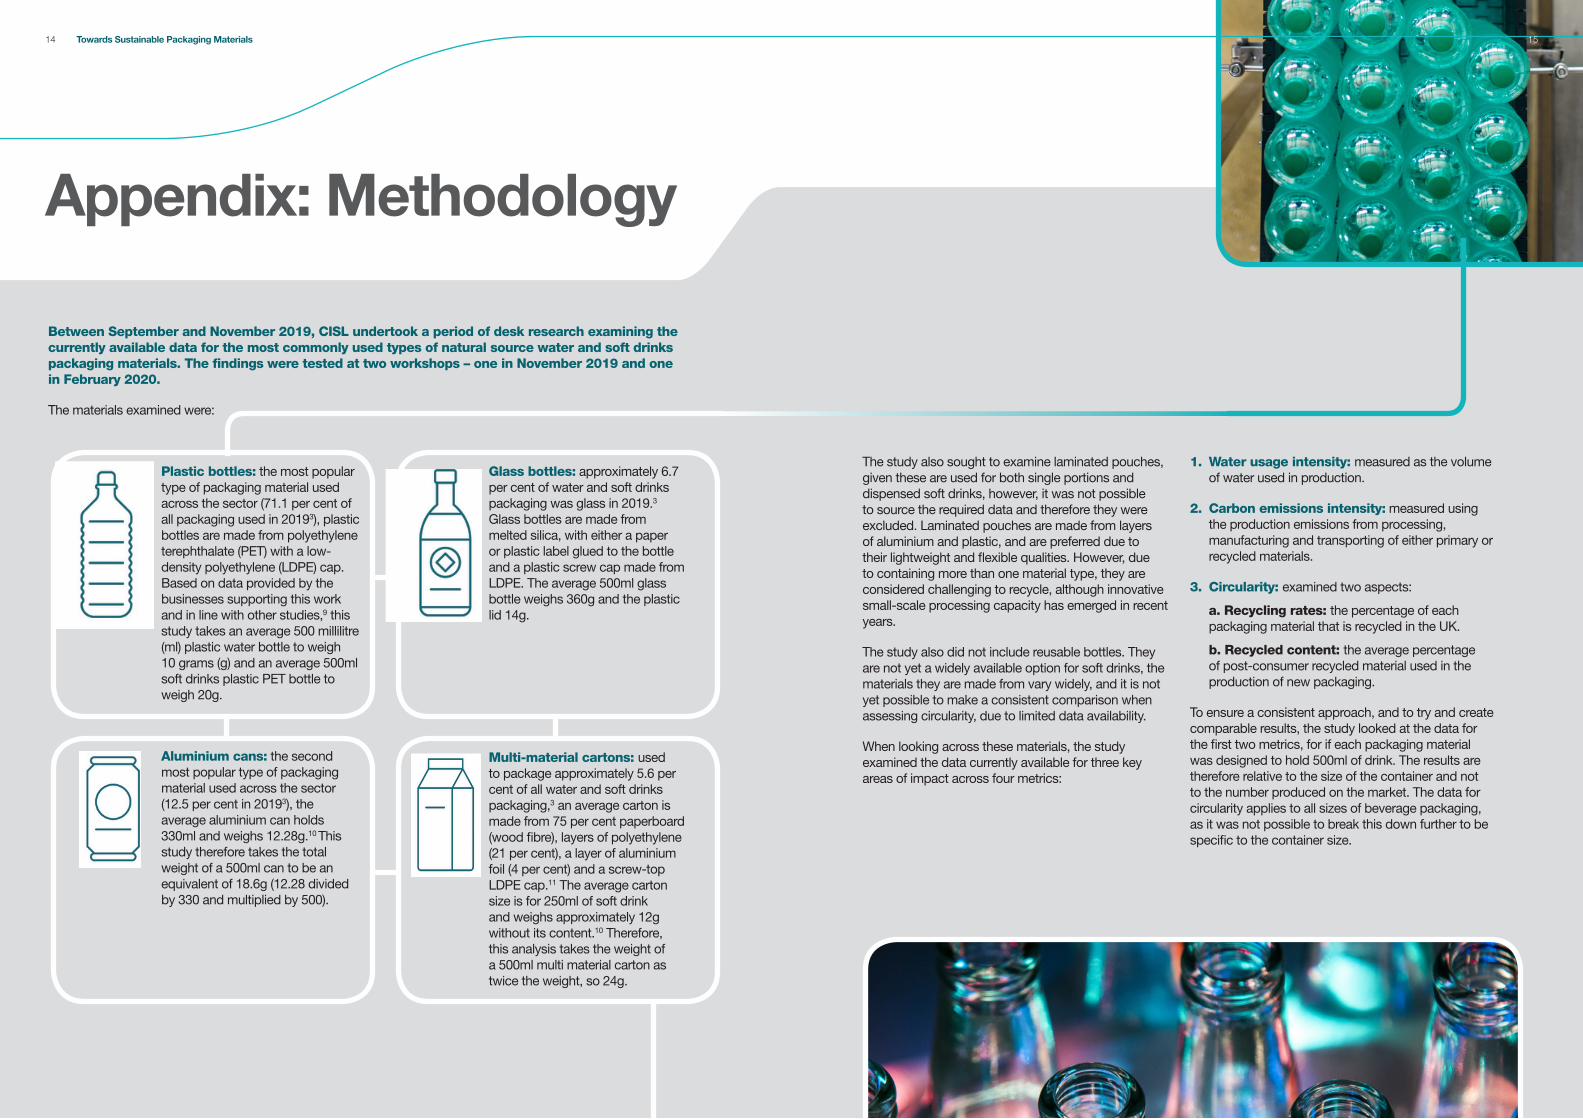
Plastic bottles: the most popular type of packaging material used across the sector (71.1 per cent of all packaging used in 20193), plastic bottles are made from polyethylene terephthalate (PET) with a low-density polyethylene (LDPE) cap. Based on data provided by the businesses supporting this work and in line with other studies,9 this study takes an average 500 millilitre (ml) plastic water bottle to weigh 10 grams (g) and an average 500ml soft drinks plastic PET bottle to weigh 20g.
Aluminium cans: the second most popular type of packaging material used across the sector (12.5 per cent in 20193), the average aluminium can holds 330ml and weighs 12.28g.10 This study therefore takes the total weight of a 500ml can to be an equivalent of 18.6g (12.28 divided by 330 and multiplied by 500).
Glass bottles: approximately 6.7 per cent of water and soft drinks packaging was glass in 2019.3 Glass bottles are made from melted silica, with either a paper or plastic label glued to the bottle and a plastic screw cap made from LDPE. The average 500ml glass bottle weighs 360g and the plastic lid 14g.
Multi-material cartons: used to package approximately 5.6 per cent of all water and soft drinks packaging,3 an average carton is made from 75 per cent paperboard (wood fibre), layers of polyethylene (21 per cent), a layer of aluminium foil (4 per cent) and a screw-top LDPE cap.11 The average carton size is for 250ml of soft drink and weighs approximately 12g without its content.10 Therefore, this analysis takes the weight of a 500ml multi material carton as twice the weight, so 24g.
Towards Sustainable Packaging Materials14 15
Water intensity (ml/unit)
Carbon intensity (virgin material) (g/CO2e/unit)
Carbon intensity(closed loop) (g/CO2e/unit)
Recycling rate(%)
Recycled content(%)
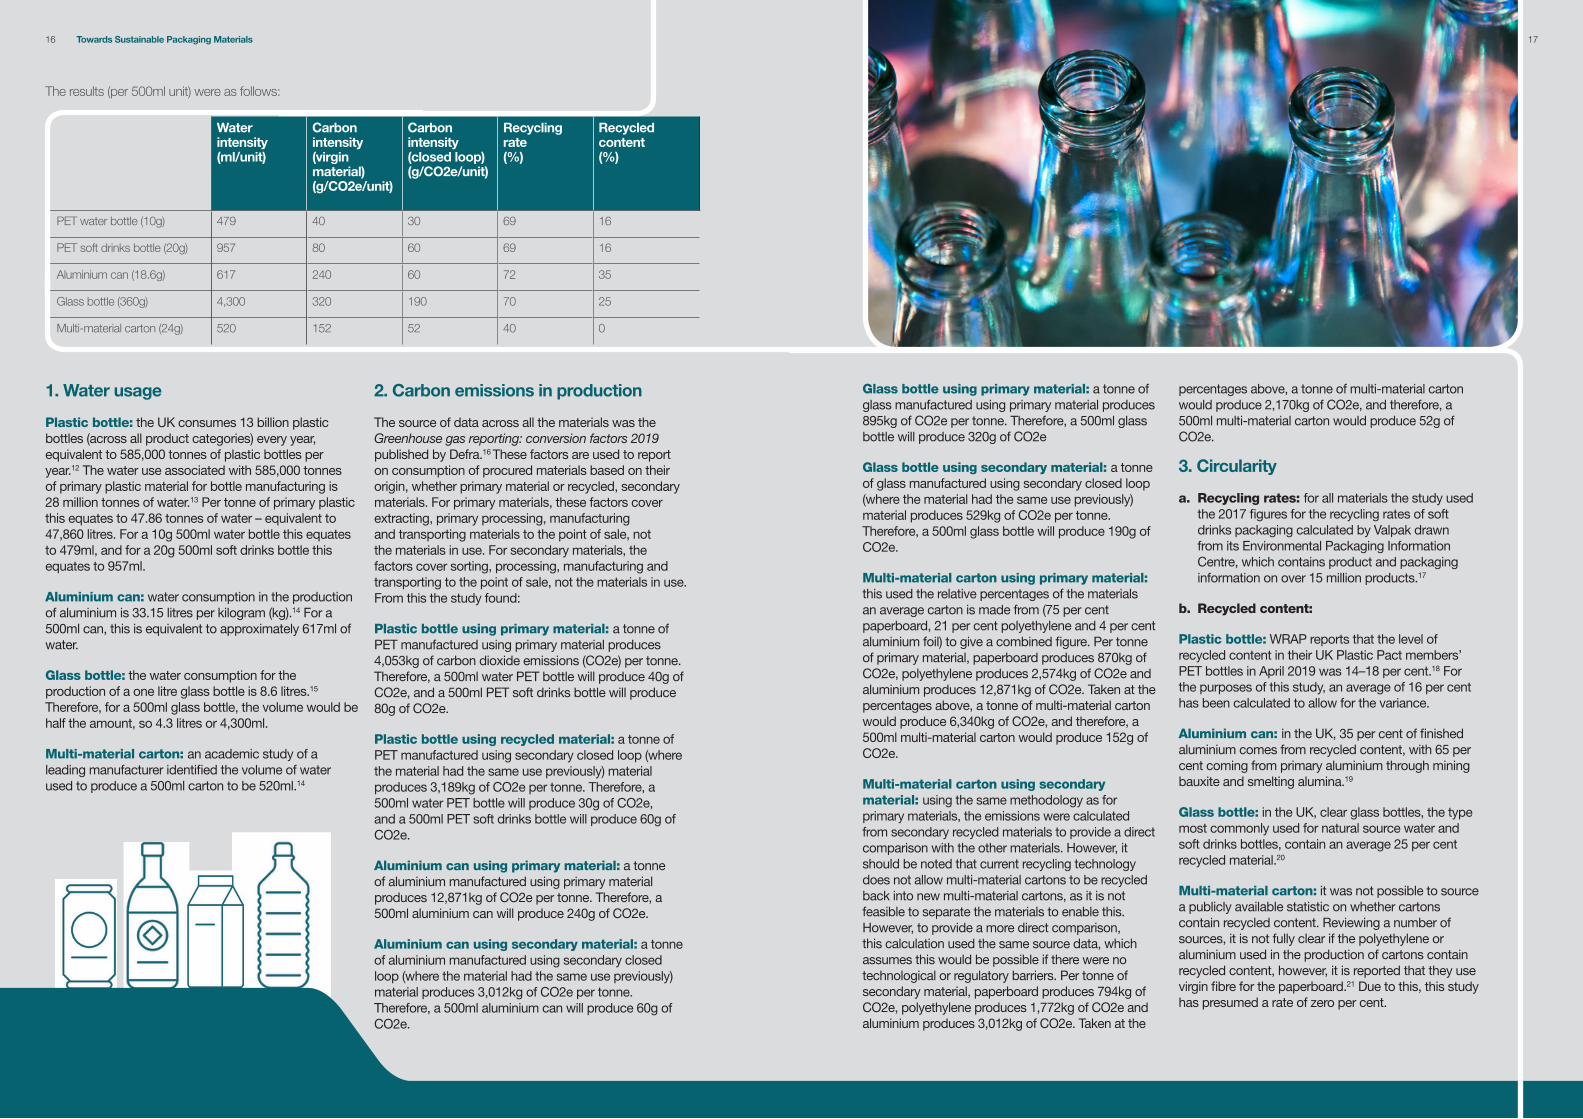
PET water bottle (10g) 479 40 30 69 16
PET soft drinks bottle (20g) 957 80 60 69 16
Aluminium can (18.6g) 617 240 60 72 35
Glass bottle (360g) 4,300 320 190 70 25
Multi-material carton (24g) 520 152 52 40 0
1. Water usage
Plastic bottle: the UK consumes 13 billion plastic bottles (across all product categories) every year, equivalent to 585,000 tonnes of plastic bottles per year.12 The water use associated with 585,000 tonnes of primary plastic material for bottle manufacturing is 28 million tonnes of water.13 Per tonne of primary plastic this equates to 47.86 tonnes of water – equivalent to 47,860 litres. For a 10g 500ml water bottle this equates to 479ml, and for a 20g 500ml soft drinks bottle this equates to 957ml.
Aluminium can: water consumption in the production of aluminium is 33.15 litres per kilogram (kg).14 For a 500ml can, this is equivalent to approximately 617ml of water.
Glass bottle: the water consumption for the production of a one litre glass bottle is 8.6 litres.15 Therefore, for a 500ml glass bottle, the volume would be half the amount, so 4.3 litres or 4,300ml.
Multi-material carton: an academic study of a leading manufacturer identified the volume of water used to produce a 500ml carton to be 520ml.14
2. Carbon emissions in production
The source of data across all the materials was the Greenhouse gas reporting: conversion factors 2019 published by Defra.16 These factors are used to report on consumption of procured materials based on their origin, whether primary material or recycled, secondary materials. For primary materials, these factors cover extracting, primary processing, manufacturing and transporting materials to the point of sale, not the materials in use. For secondary materials, the factors cover sorting, processing, manufacturing and transporting to the point of sale, not the materials in use. From this the study found:
Plastic bottle using primary material: a tonne of PET manufactured using primary material produces 4,053kg of carbon dioxide emissions (CO2e) per tonne. Therefore, a 500ml water PET bottle will produce 40g of CO2e, and a 500ml PET soft drinks bottle will produce 80g of CO2e.
Plastic bottle using recycled material: a tonne of PET manufactured using secondary closed loop (where the material had the same use previously) material produces 3,189kg of CO2e per tonne. Therefore, a 500ml water PET bottle will produce 30g of CO2e, and a 500ml PET soft drinks bottle will produce 60g of CO2e.
Aluminium can using primary material: a tonne of aluminium manufactured using primary material produces 12,871kg of CO2e per tonne. Therefore, a 500ml aluminium can will produce 240g of CO2e.
Aluminium can using secondary material: a tonne of aluminium manufactured using secondary closed loop (where the material had the same use previously) material produces 3,012kg of CO2e per tonne. Therefore, a 500ml aluminium can will produce 60g of CO2e.
The results (per 500ml unit) were as follows:
Glass bottle using primary material: a tonne of glass manufactured using primary material produces 895kg of CO2e per tonne. Therefore, a 500ml glass bottle will produce 320g of CO2e
Glass bottle using secondary material: a tonne of glass manufactured using secondary closed loop (where the material had the same use previously) material produces 529kg of CO2e per tonne. Therefore, a 500ml glass bottle will produce 190g of CO2e.
Multi-material carton using primary material: this used the relative percentages of the materials an average carton is made from (75 per cent paperboard, 21 per cent polyethylene and 4 per cent aluminium foil) to give a combined figure. Per tonne of primary material, paperboard produces 870kg of CO2e, polyethylene produces 2,574kg of CO2e and aluminium produces 12,871kg of CO2e. Taken at the percentages above, a tonne of multi-material carton would produce 6,340kg of CO2e, and therefore, a 500ml multi-material carton would produce 152g of CO2e.
Multi-material carton using secondary material: using the same methodology as for primary materials, the emissions were calculated from secondary recycled materials to provide a direct comparison with the other materials. However, it should be noted that current recycling technology does not allow multi-material cartons to be recycled back into new multi-material cartons, as it is not feasible to separate the materials to enable this. However, to provide a more direct comparison, this calculation used the same source data, which assumes this would be possible if there were no technological or regulatory barriers. Per tonne of secondary material, paperboard produces 794kg of CO2e, polyethylene produces 1,772kg of CO2e and aluminium produces 3,012kg of CO2e. Taken at the
percentages above, a tonne of multi-material carton would produce 2,170kg of CO2e, and therefore, a 500ml multi-material carton would produce 52g of CO2e.
3. Circularity
a. Recycling rates: for all materials the study used the 2017 figures for the recycling rates of soft drinks packaging calculated by Valpak drawn from its Environmental Packaging Information Centre, which contains product and packaging information on over 15 million products.17
b. Recycled content:
Plastic bottle: WRAP reports that the level of recycled content in their UK Plastic Pact members’ PET bottles in April 2019 was 14–18 per cent.18 For the purposes of this study, an average of 16 per cent has been calculated to allow for the variance.
Aluminium can: in the UK, 35 per cent of finished aluminium comes from recycled content, with 65 per cent coming from primary aluminium through mining bauxite and smelting alumina.19
Glass bottle: in the UK, clear glass bottles, the type most commonly used for natural source water and soft drinks bottles, contain an average 25 per cent recycled material.20
Multi-material carton: it was not possible to source a publicly available statistic on whether cartons contain recycled content. Reviewing a number of sources, it is not fully clear if the polyethylene or aluminium used in the production of cartons contain recycled content, however, it is reported that they use virgin fibre for the paperboard.21 Due to this, this study has presumed a rate of zero per cent.
Towards Sustainable Packaging Materials16 17
References
1. University of Cambridge Institute for Sustainability Leadership (CISL). (2018). Towards sustainable packaging: A plan to eliminate plastic packaging waste from UK bottled water and soft drinks. Cambridge, UK: University of Cambridge Institute for Sustainability Leadership. https://www.cisl.cam.ac.uk/resources/circular-economy/towards-sustainable-packaging-a-plan-to-eliminate-plastic-packaging-waste-from-uk-bottled-water-and-soft-drinks
2. British Soft Drinks Association. (no date). Packaging. Retrieved from: http://www.britishsoftdrinks.com/Soft-Drinks/Packaging3. British Soft Drinks Association. (no date). Packaging: UK Soft Drinks packaging types, 2018. Retrieved from: http://www.britishsoftdrinks.
com/Soft-Drinks/Packaging4. Amienyo, D., Gujba H., Stichnothe, H., & Azapagic, A. (2013). Life Cycle Environmental Impacts of Carbonated Soft Drinks. International
Journal of Life Cycle Assessment, 18(1), 77–92, doi:10.1007/s11367-012-0459-y5. Peake, L., Ritson, J., & Petersen, M. (2019). Losing the bottle: Why we don’t need single use containers for water. London, UK. Retrieved
from: https://www.green-alliance.org.uk/losing_the_bottle.php 6. WRAP. (no date). What is The UK Plastics Pact? Retrieved from: https://www.wrap.org.uk/content/the-uk-plastics-pact 7. UK Government. (2019). Introducing a Deposit Return Scheme (DRS) in England, Wales and Northern Ireland: Executive summary and
next steps. Retrieved from: https://www.gov.uk/government/consultations/introducing-a-deposit-return-scheme-drs-for-drinks-containers-bottles-and-cans/outcome/introducing-a-deposit-return-scheme-drs-in-england-wales-and-northern-ireland-executive-summary-and-next-steps
8. WRAP. (2019) The UK Plastics Pact Progress Report. Retrieved from: https://www.wrap.org.uk/sites/files/wrap/Member-progress-report-Dec-2019_1.pdf
9. Peake, L. (2019). Losing the bottle: why we don’t need single use containers for water methodology. Green Alliance. Retrieved from: https://www.green-alliance.org.uk/losing_the_bottle_methodology.php
10. Constellium. (2014). Aluminium for beverage can Life Cycle Assessment summary. Retrieved from: https://www.constellium.com/sites/default/files/lifecycleassessmentdocumentforbeveragecans-v2.pdf
11. Ace-UK. (no date). What is a beverage carton? Retrieved from: http://www.ace-uk.co.uk/about-cartons/what-are-beverage-cartons12. House of Commons Environmental Audit Committee. (2017). Plastic Bottles: Turning Back the Plastic Tide. Retrieved from:
https://publications.parliament.uk/pa/cm201719/cmselect/cmenvaud/339/339.pdf13. House of Commons Environmental Audit Committee. (2017). Plastic Bottles: Turning Back the Plastic Tide – Written evidence submitted
by Eunomia Research and Consulting Ltd. Retrieved from: http://data.parliament.uk/WrittenEvidence/CommitteeEvidence.svc/EvidenceDocument/Environmental%20Audit/Packaging/written/70645.html
14. Li, Cong., & Nwokoli, S. (2010) Investigating the water footprint of Tetra Pak Carton Economy’s beverage portfolio. Lund University. Retrieved from: http://lup.lub.lu.se/luur/download?func=downloadFile&recordOId=1543438&fileOId=1543442
15. Kalleitner-Huber, M., & Pladerer, C. (2014) Recent impact on ancient well – the calculation of the Water Footprint of bottled natural mineral water. Austrian Institute of Ecology. Retrieved from: https://conferences.matheo.si/event/0/contribution/152/material/paper/1.pdf
16. UK Government. (2019). Greenhouse gas reporting: conversion factors 2019. Retrieved from: https://www.gov.uk/government/publications/greenhouse-gas-reporting-conversion-factors-2019
17. Valpak. (no date). Databite number 3. Retrieved from: https://www.valpak.co.uk/docs/default-source/environmental-consulting/databite-no-3-2017-update---drinks-container-recycling-rates.pdf?sfvrsn=37616410_0.
18. WRAP. (2019). The UK Plastics Pact report 2018/19. Retrieved from: https://www.wrap.org.uk/sites/files/wrap/The-UK-Plastics-Pact-report-18-19.pdf
19. OECD. (2010). OECD Global Forum on Environment Focusing on Sustainable Materials Management. Retrieved from: https://www.oecd.org/env/waste/oecdglobalforumonenvironmentsustainablematerialsmanagement.htm
20. Recycling Facts. (no date). Retrieved from Recycling Bins website, https://www.recyclingbins.co.uk/recycling-facts/ 21. Frequently Asked Questions. (no date). Retrieved from Ace-UK website, http://www.ace-uk.co.uk/about-cartons/ace-faqs/
References
Towards Sustainable Packaging Materials18 19
www.cisl.cam.ac.uk
Business Briefing
Head office 1 Trumpington Street Cambridge CB2 1QA, UK T: +44 (0)1223 768850 [email protected]
Brussels The Periclès Building Rue de la Science 23 B-1040 Brussels, Belgium T: +32 (0) 2 894 93 19 [email protected]
Cape Town PO Box 313 Cape Town 8000 South Africa T: +44 (0)1223 768850 [email protected]
Towards sustainable packaging materialsExamining the relative impact of materials in the natural source water and soft drinks value chain
www.cisl.cam.ac.uk @cisl_cambridge


