55
1 Towards Technologically and Competitively Neutral Fiber to the Home (FTTH) Infrastructure Anupam Banerjee, Marvin Sirbu Carnegie Mellon University Pittsburgh, PA 15213 USA

1
Towards Technologically and Competitively Neutral
Fiber to the Home (FTTH) Infrastructure
Anupam Banerjee, Marvin SirbuCarnegie Mellon University Pittsburgh, PA 15213 USA
2
Background
$Telecommunications Act of 1996$Competition in the ‘Last Mile’
$Broadband Access
$Universal Access
$ In the context of FTTH, what does it take to have competition in the ‘last mile’?
3
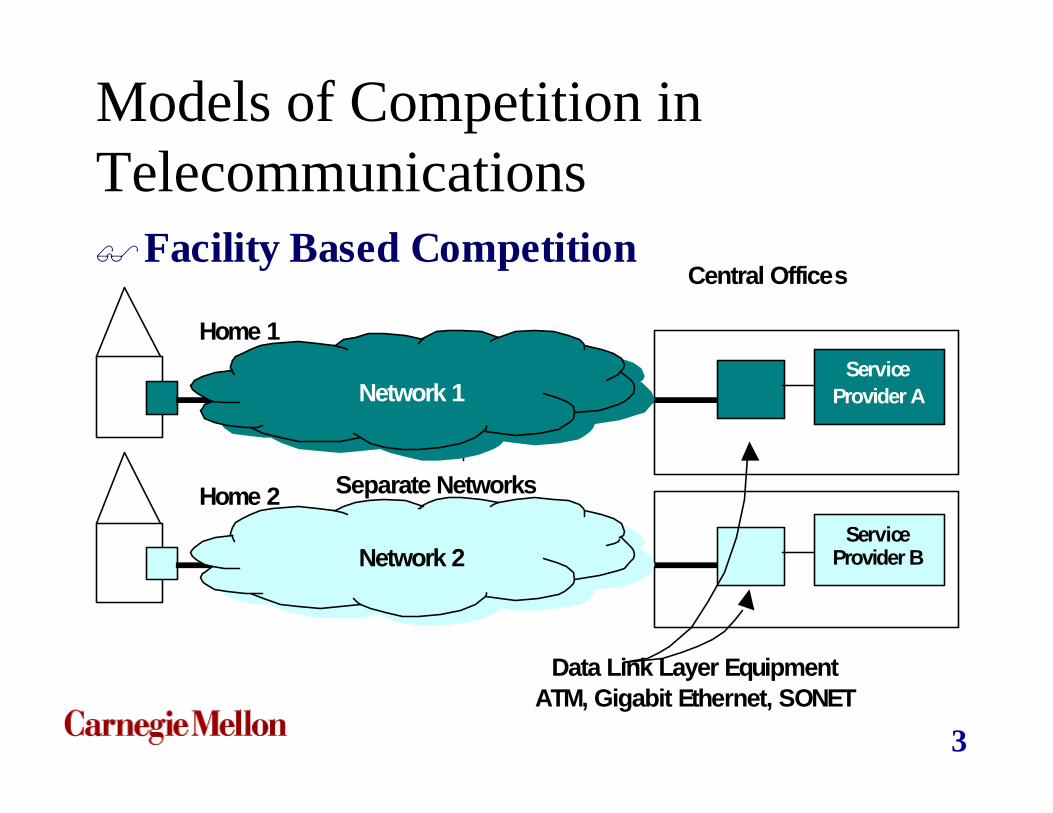
Models of Competition in Telecommunications$Facility Based Competition
Central Offices
ServiceProvider A
ServiceProvider B
Home 2
Home 1
Data Link Layer EquipmentATM, Gigabit Ethernet, SONET
Separate Networks
Network 1
Network 2

4
Models of Competition in Telecommunications$UNE Based Competition
Central Office
ServiceProvider A
ServiceProvider B
Home 2
Home 1
Data Link Layer EquipmentNetwork
5
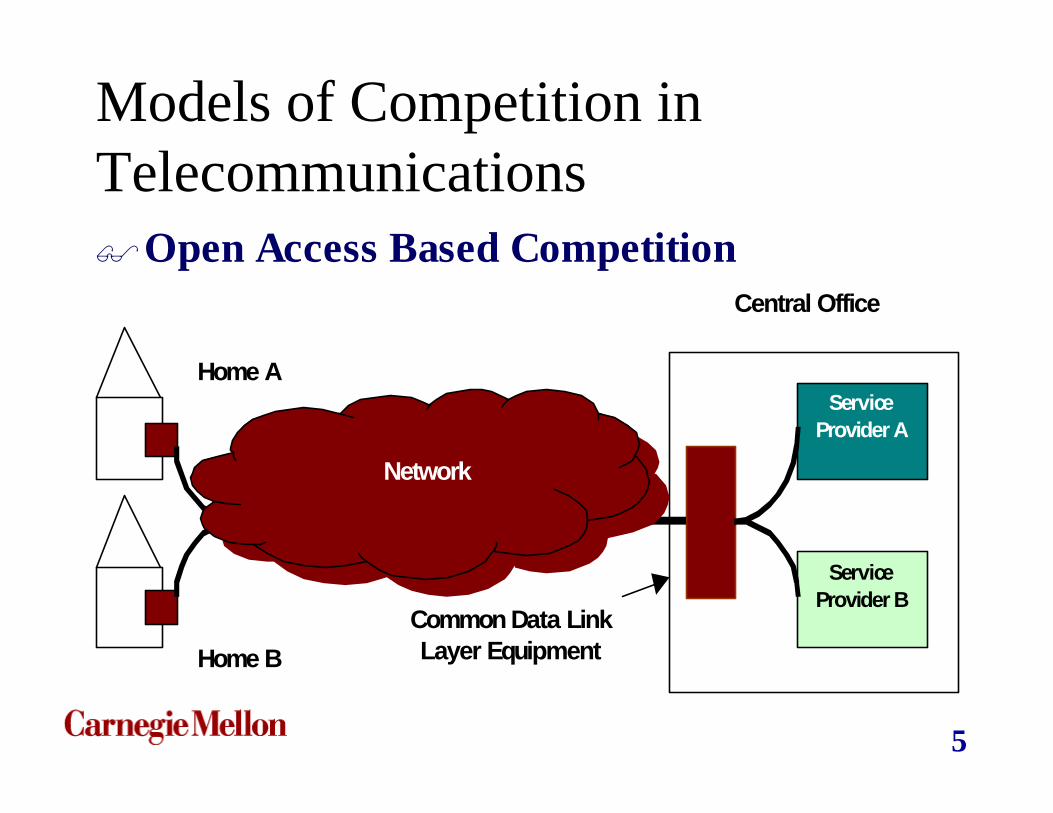
Models of Competition in Telecommunications$Open Access Based Competition
Central Office
ServiceProvider A
ServiceProvider B
Home B
Home A
Common Data LinkLayer Equipment
Network

6
FTTH Architectures
$Home Run
$Active Star
$Passive Star (Passive Optical Network -PON)
$Wavelength Division Multiplexed Passive Optical Networks (WDM PON)
7
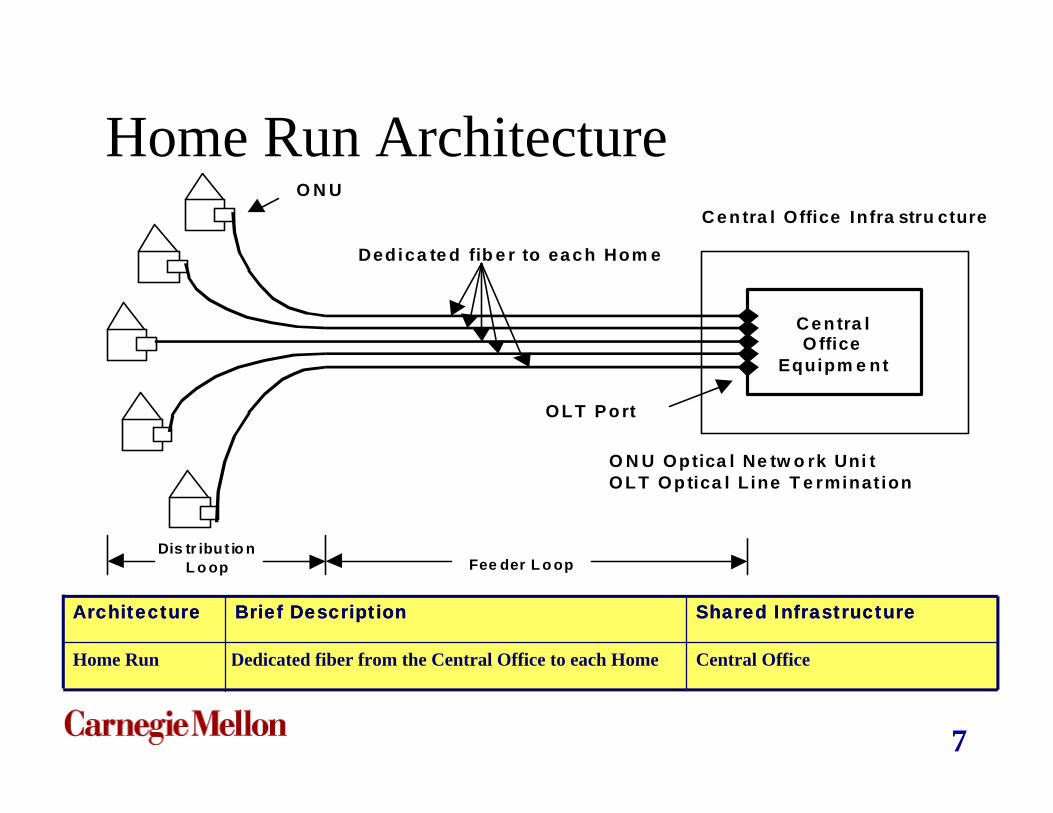
Home Run Architecture
Shared InfrastructureShared InfrastructureBrief DescriptionBrief DescriptionArchitectureArchitecture
Central OfficeDedicated fiber from the Central Office to each HomeHome Run
C e n tra lO ffice
Equipm e nt
O L T P o rt
O N U
C e n tra l Office Infra stru cture
Dedica te d fib e r to each Hom e
Fee der L o opDis tr ibut io n
L o op
O N U Optica l Ne tw o rk Uni tOLT Optica l Line T e rminat ion

8
Active Star Architecture
Shared InfrastructureShared InfrastructureBrief DescriptionBrief DescriptionArchitectureArchitecture
From theCentral Office to the Remote Node
Signals multiplexed at Remote Node that lies between Central Office and Home
Active Star
C e n tra lO ffice
Equipm e ntO L T
O N U
C e n tra l Office Infra stru cture
S h a red Fe e de r fib e r
Fee der L o opDis tr ibu t io n
L o op
32
1
R e m o te N o d e w ithActive E lect ronicsEquipm e nt
9
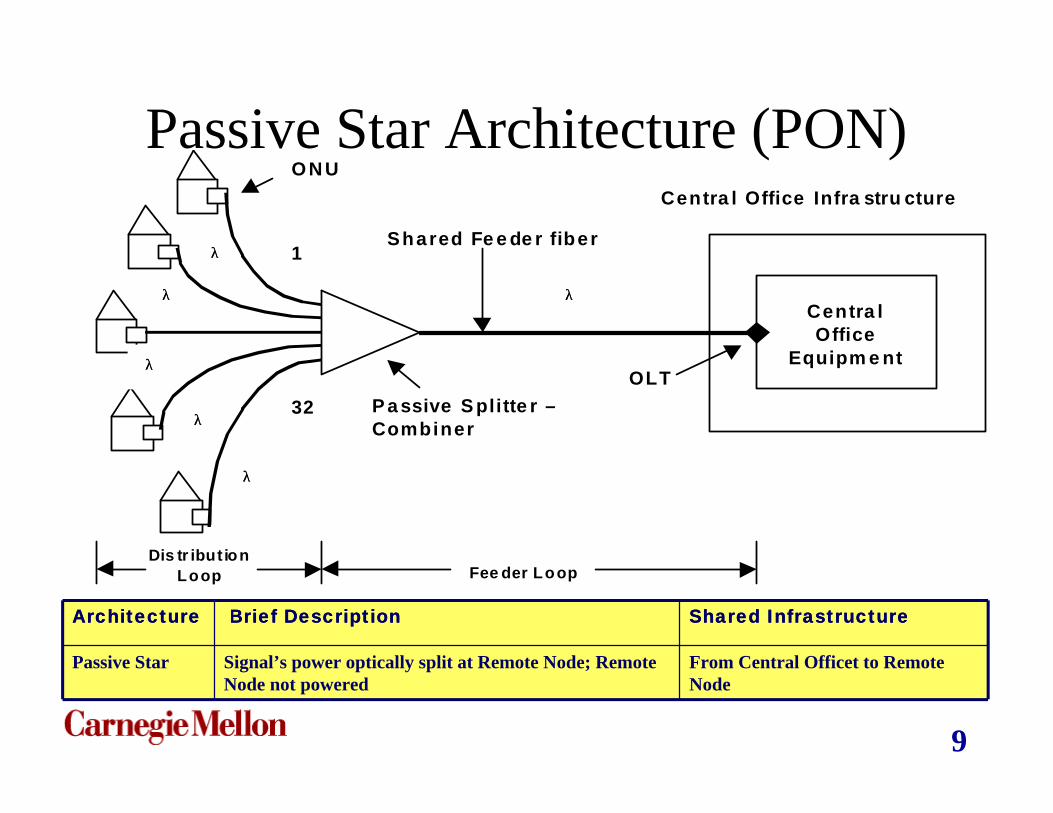
Passive Star Architecture (PON)
Shared InfrastructureShared InfrastructureBrief DescriptionBrief DescriptionArchitectureArchitecture
From Central Officet to Remote Node
Signal’s power optically split at Remote Node; Remote Node not powered
Passive Star
Centra lOffice
Equipm e ntOLT
O N U
Centra l Office Infra stru cture
Shared Fe e de r fiber
Fee der LoopDis tr ibut ion
Loop
32
1
P a ssive S plitte r –Combiner
λλ
λλ
λλ
λλ
λλ
λλ

10
WDM PON
Shared InfrastructureShared InfrastructureBrief DescriptionBrief DescriptionArchitectureArchitecture
From Central Officet to Remote Node
Signal’s power optically split at Remote Node; Feeder fiber carries multiple wavelengths
WDM PON
λλ 55
λλ 33
λλ 11
λλ 22
λλ 44
Centra lOffice
Equipm e ntOLT
O N U
Centra l Office Infra stru cture
Shared Fe e de r fiber
Fee der LoopDis tr ibut ion
Loop
32
1
P a ssive S plitte r –Combiner
λλ 1 , 1 , λλ 2 , 2 , λλ 3 , 3 , λλ 4 , 4 , λλ 5 . . . 5 . . . λλ 3 23 2
11
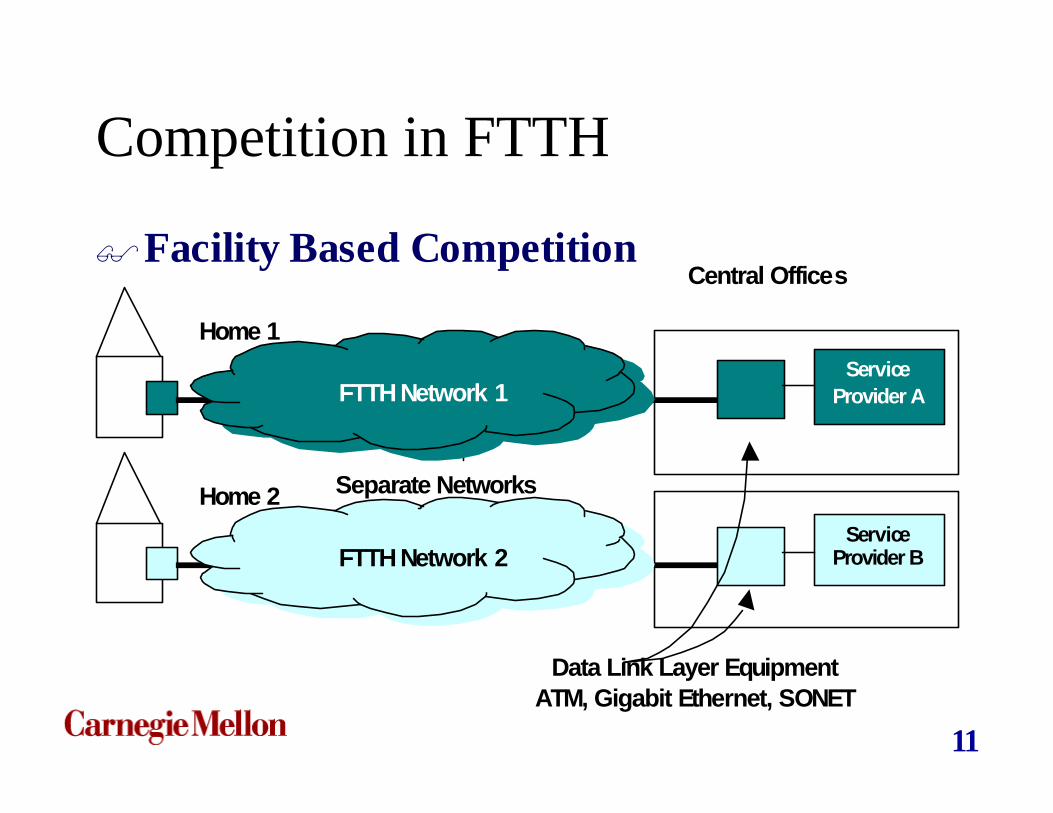
Competition in FTTH
$Facility Based CompetitionCentral Offices
ServiceProvider A
ServiceProvider B
Home 2
Home 1
Data Link Layer EquipmentATM, Gigabit Ethernet, SONET
Separate Networks
FTTH Network 1
FTTH Network 2
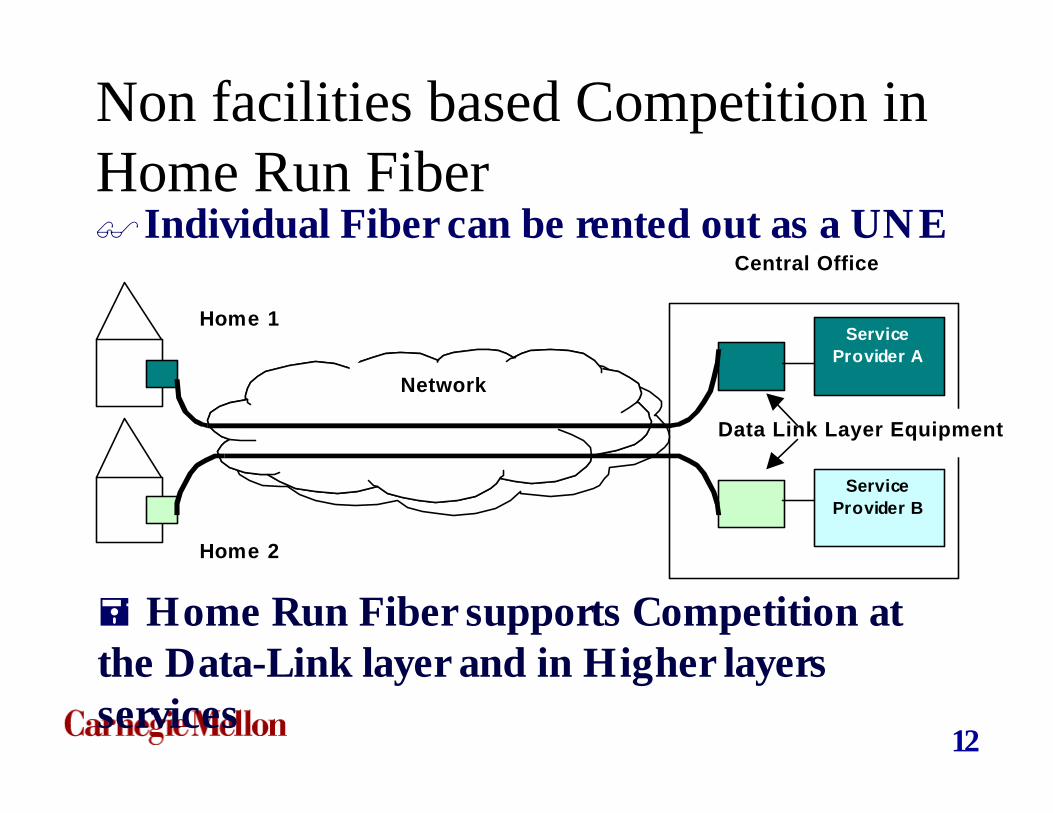
12
Non facilities based Competition in Home Run Fiber$Individual Fiber can be rented out as a UNE
Central Office
ServiceProvider A
ServiceProvider B
Home 2
Home 1
Data Link Layer Equipment
Network
= Home Run Fiber supports Competition at the Data-Link layer and in Higher layers services
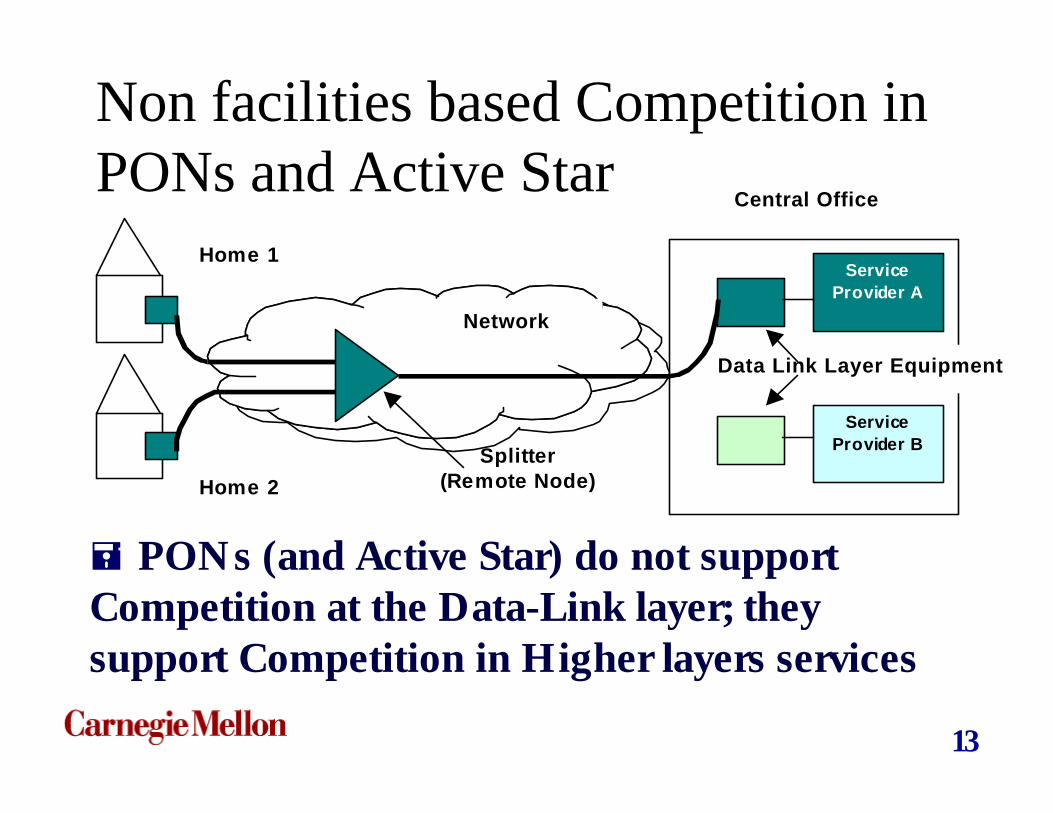
13
Non facilities based Competition in PONs and Active Star
Splitter(Remote Node)
Central Office
ServiceProvider A
ServiceProvider B
Home 2
Home 1
Data Link Layer Equipment
Network
= PONs (and Active Star) do not support Competition at the Data-Link layer; they support Competition in Higher layers services
14
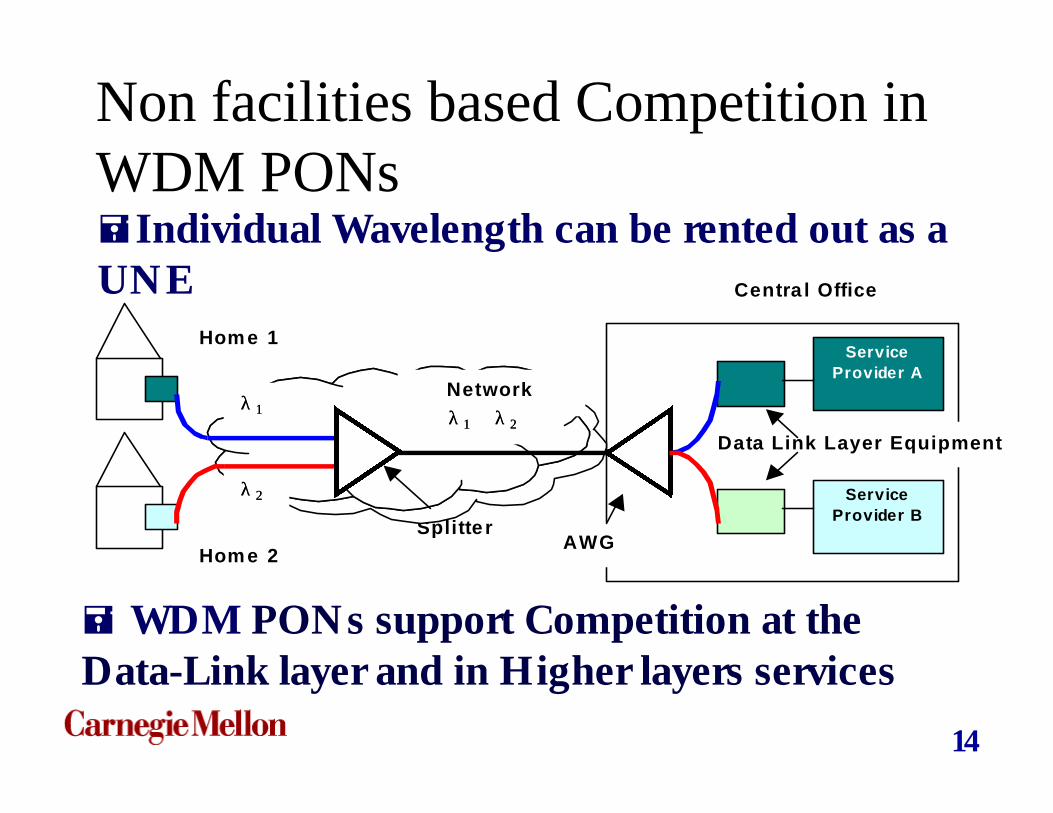
Non facilities based Competition in WDM PONs
Splitte r
Centra l Office
ServiceProvider A
ServiceProvider B
Home 2
Home 1
Data Link Layer Equipment
Network
AWG
λλ 11
λλ 22
λλ 11 λλ 22
= WDM PONs support Competition at the Data-Link layer and in Higher layers services
=Individual Wavelength can be rented out as a UNE
15
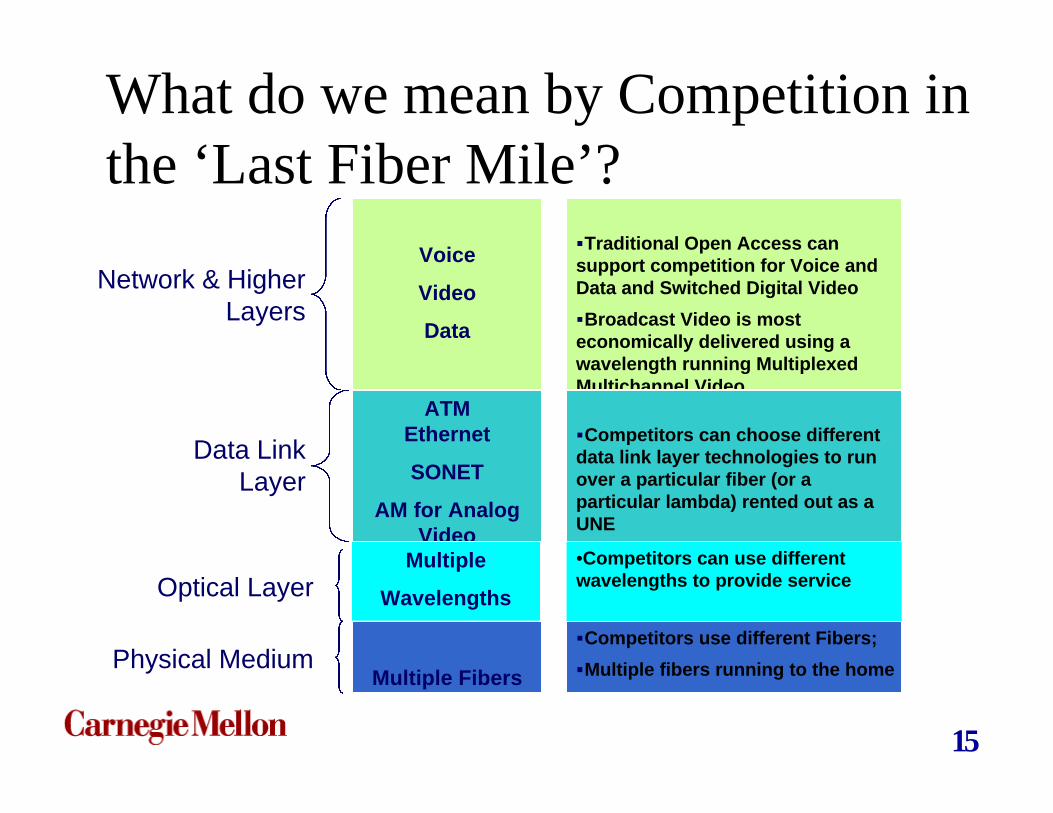
What do we mean by Competition in the ‘Last Fiber Mile’?
Network & Higher Layers
Physical MediumMultiple Fibers
Voice
Video
Data
ATMEthernet
SONET
AM for Analog Video
Data Link Layer
Multiple
WavelengthsOptical Layer
§Traditional Open Access can support competition for Voice and Data and Switched Digital Video
§Broadcast Video is most economically delivered using a wavelength running Multiplexed Multichannel Video
§Competitors can choose different data link layer technologies to run over a particular fiber (or a particular lambda) rented out as a UNE
•Competitors can use different wavelengths to provide service
§Competitors use different Fibers;
§Multiple fibers running to the home

16
Architectures and Competition
Competition in Data Link Layer Services
NeutralNeutral
Competition in Broadcast Video
Competition in Voice, Data, Digital Video
Cost per Home Served
PONsHome Run
Active Star
WDM PONs
HardEasy Hard Easy
NeutralNeutral
HardEasy Hard Easy
?? ? ?
17
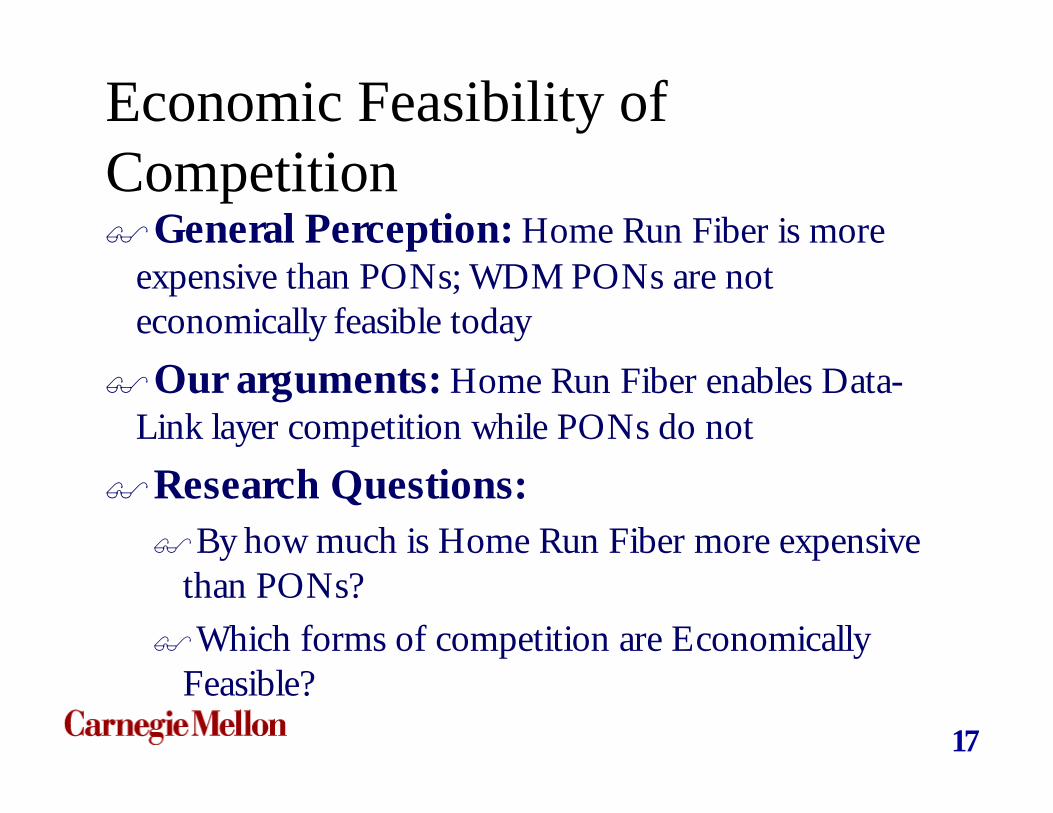
Economic Feasibility of Competition$General Perception: Home Run Fiber is more
expensive than PONs; WDM PONs are not economically feasible today
$Our arguments: Home Run Fiber enables Data-Link layer competition while PONs do not
$Research Questions: $By how much is Home Run Fiber more expensive
than PONs?
$Which forms of competition are Economically Feasible?

18
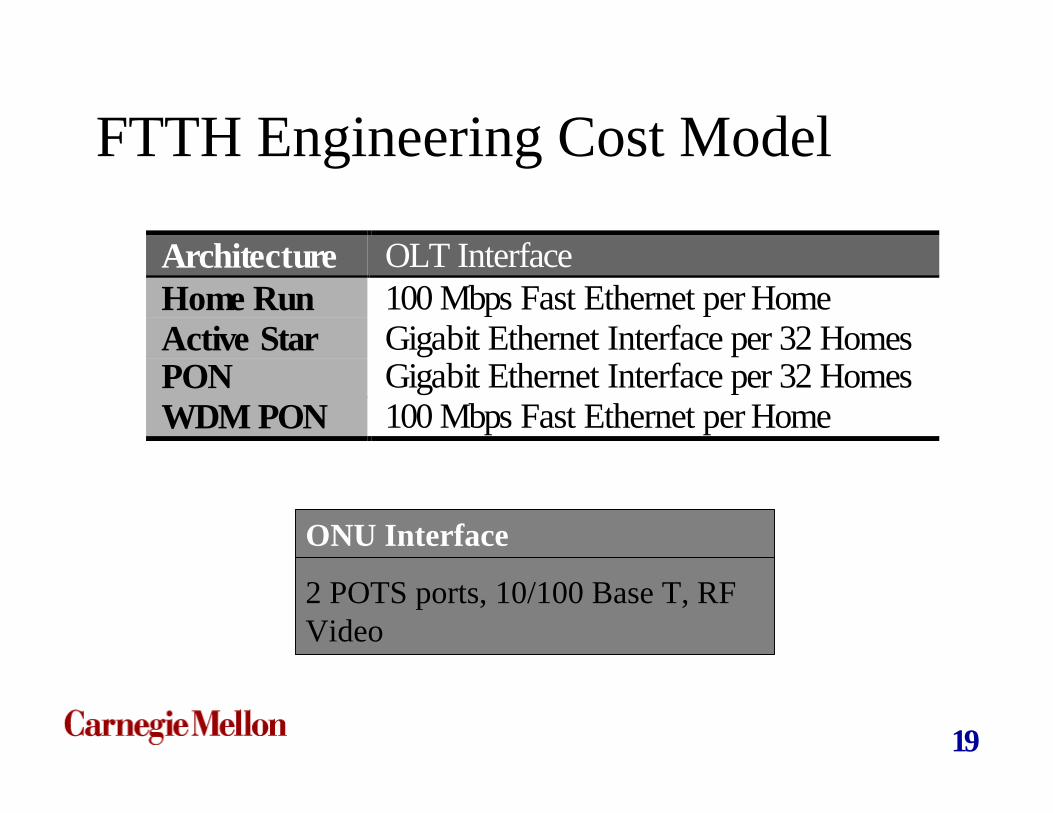
FTTH Engineering Cost Model
Deployment Homes persq. mile
Homesserved per
COUrban 3389 16,135Suburban 1602 16,201Small Town 217 10,184Rural 85 5,871RemoteRural
20 3,018
19
FTTH Engineering Cost Model
Architecture OLT InterfaceHome Run 100 Mbps Fast Ethernet per HomeActive Star Gigabit Ethernet Interface per 32 HomesPON Gigabit Ethernet Interface per 32 HomesWDM PON 100 Mbps Fast Ethernet per Home
ONU Interface
2 POTS ports, 10/100 Base T, RF Video

20
Capital Cost per Home Served (Urban Deployment)
Capital Cost per Home Served (Urban Deployment)
0100020003000400050006000700080009000
10000
0 20 40 60 80 100
Percent Penetration
FT
TH
Ca
pita
l Co
st p
er
Ho
me
Se
rve
d
Home Run Fiber Active Star Passive Star (PON) WDM PON

21
Capital Cost per Home Served (PON Deployments)
PON deployment in Urban, Suburban, Small Town, Rural and Remote Rural Areas
0
1000
2000
3000
4000
5000
6000
7000
8000
9000
10000
0 20 40 60 80 100
Percent Penetration
FT
TH
Ca
pita
l C
ost
pe
r H
om
e S
erv
ed
Urban Suburban Small Town Rural Remote Rural
Urban
Remote Rural
Suburban
Rural
Small Town
22
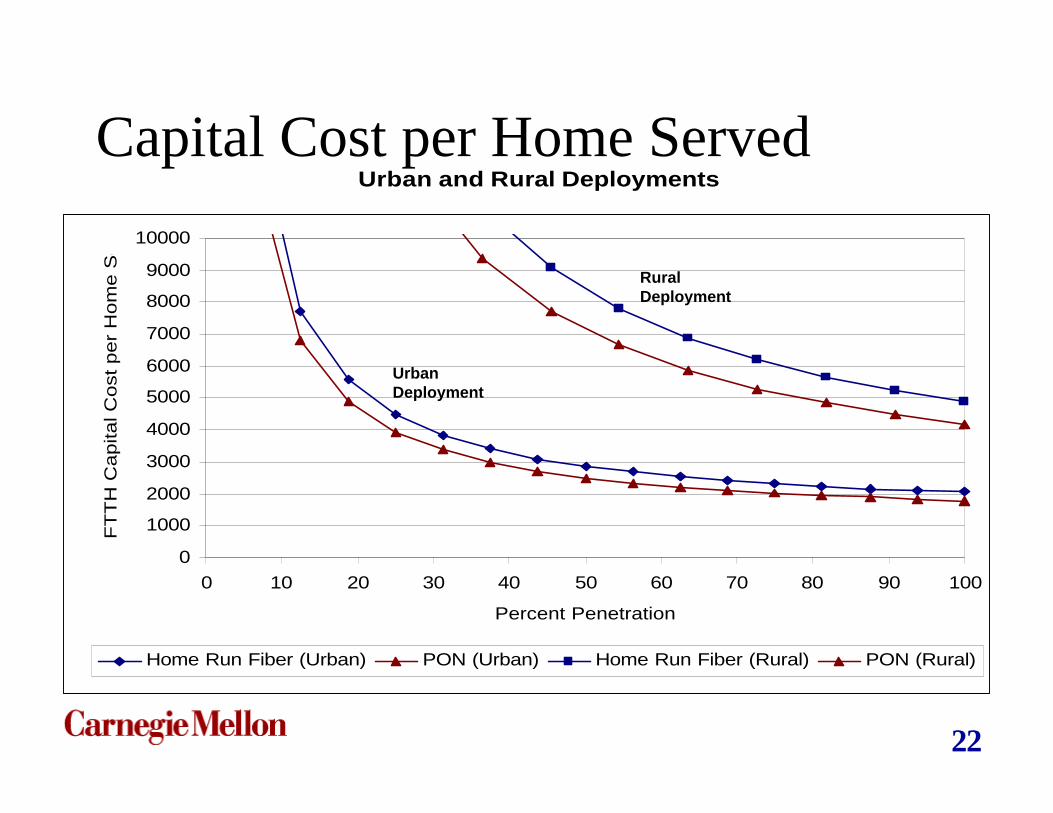
Capital Cost per Home ServedUrban and Rural Deployments
0
1000
2000
3000
4000
5000
6000
7000
8000
9000
10000
0 10 20 30 40 50 60 70 80 90 100
Percent Penetration
FT
TH
Capital C
ost per
Hom
e S
erv
ed
Home Run Fiber (Urban) PON (Urban) Home Run Fiber (Rural) PON (Rural)
Urban Deployment
Rural Deployment
23
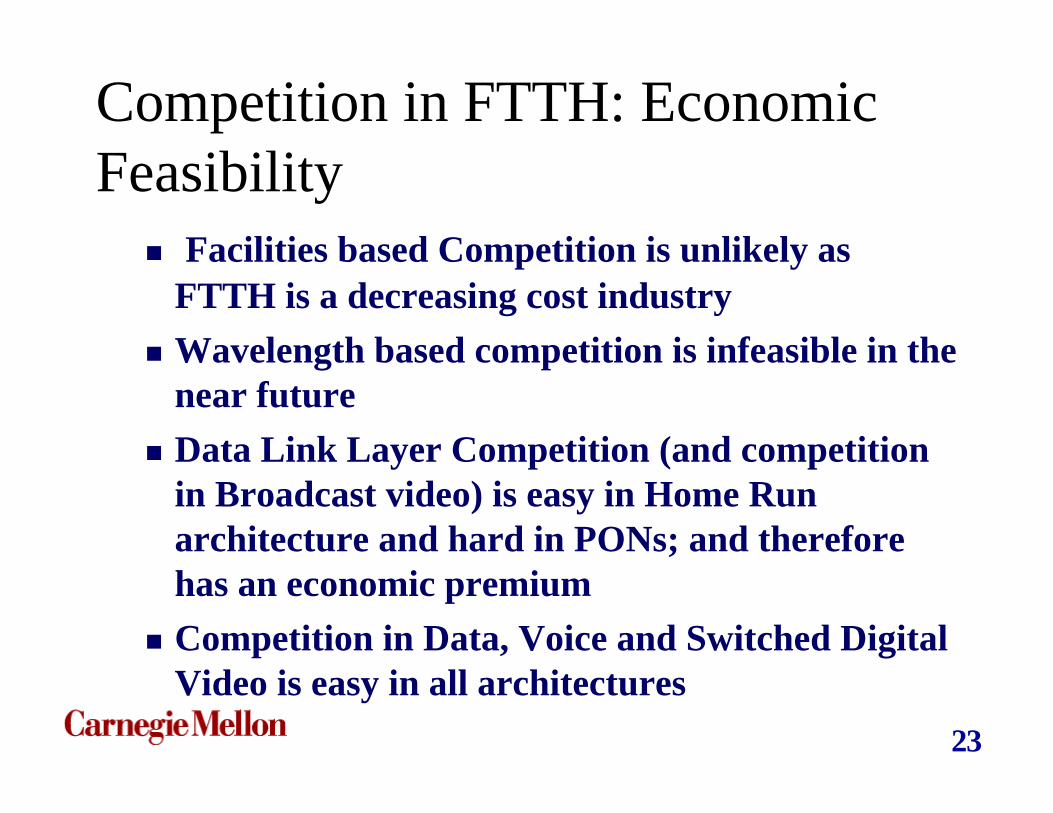
Competition in FTTH: Economic Feasibility
n Facilities based Competition is unlikely as FTTH is a decreasing cost industry
n Wavelength based competition is infeasible in the near future
n Data Link Layer Competition (and competition in Broadcast video) is easy in Home Run architecture and hard in PONs; and therefore has an economic premium
n Competition in Data, Voice and Switched Digital Video is easy in all architectures

24
The ‘Cost’ of Data-Link layer Competition..
Deployment Scenario Cost of Competition per Home Served ($) @ 100%penetration
Urban 270Suburban 350Small Town 510Rural 690Remote Rural 560
$Cost Difference (per Home) between Home Run Fiber and PON

25
Towards Economically Efficient and Competitive Neutral FTTH Infrastructure
$Home Run Fiber is Competitively Neutral..$But is it 'economically efficient'?$Can we have Data-Link layer at a lower cost
than Home Run Fiber?

26
A Traditional PON Deployment
Splitter 1
Splitter 2
Central OfficeOLT Equipment
Central Office Infrastructure
PON1
PON2
Neighborhood 2
Neighborhood 1
Central OfficeOLT Equipment
27
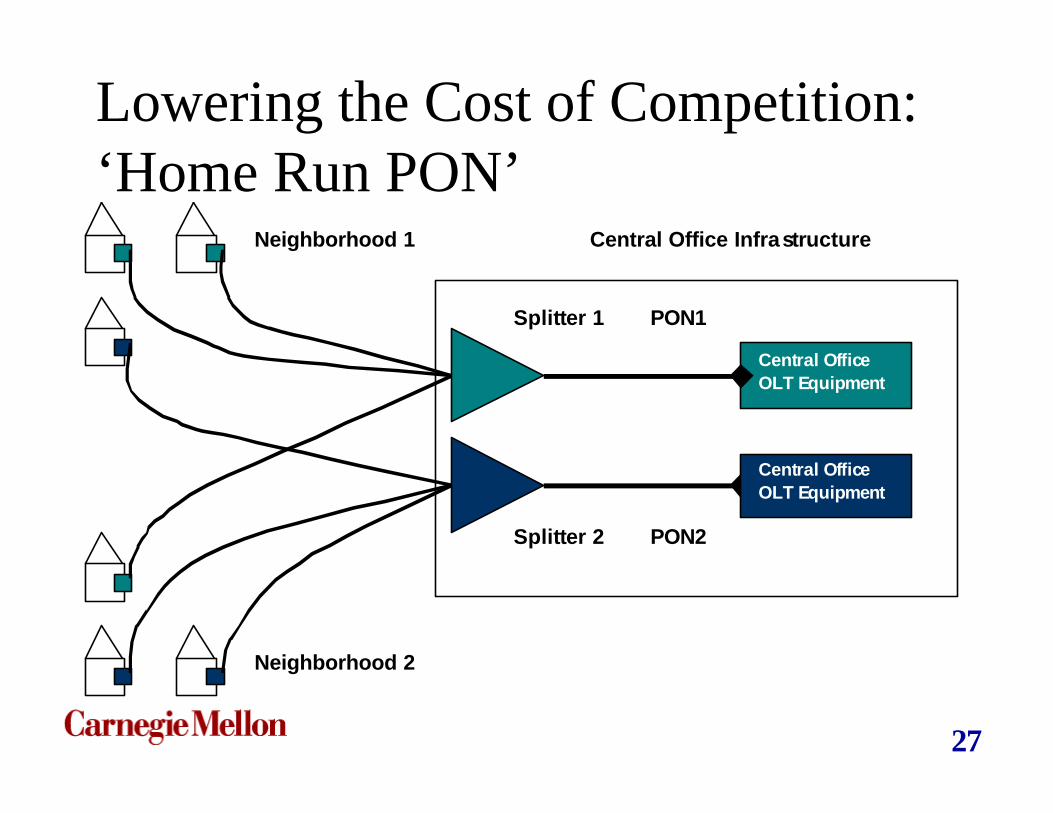
Lowering the Cost of Competition: ‘Home Run PON’
Central OfficeOLT Equipment
Central Office Infrastructure
PON1
PON2
Neighborhood 2
Neighborhood 1
Splitter 2
Splitter 1
Central OfficeOLT Equipment

28
Lowering the Cost of Competition: ‘Aggregation PON’
Central OfficeOLT Equipment
Centra l Office Infra structure
PON1
PON2
Neighborhood 2
Neighborhood 1
Splitte r 2
Splitte r 1
AGGREGATIONof Splitters
Central OfficeOLT Equipment
29
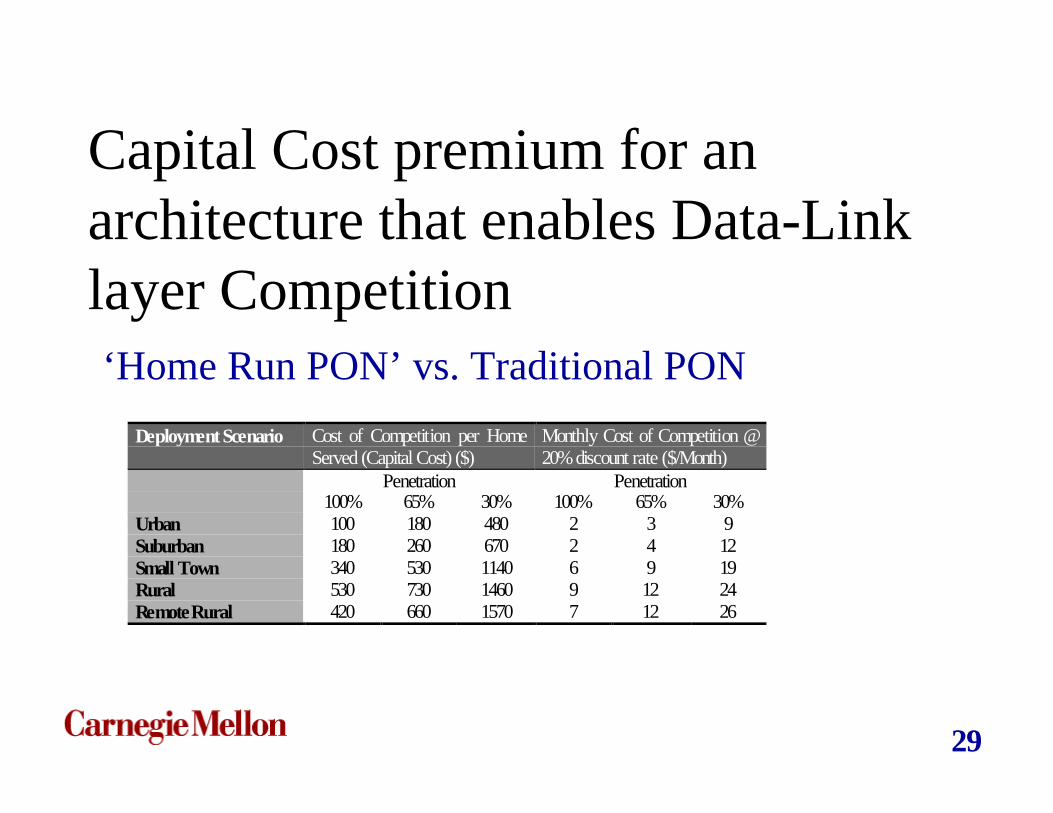
Capital Cost premium for an architecture that enables Data-Link layer Competition‘Home Run PON’ vs. Traditional PON
Deployment Scenario Cost of Competition per HomeServed (Capital Cost) ($)
Monthly Cost of Competition @20% discount rate ($/Month)
Penetration Penetration100% 65% 30% 100% 65% 30%
Urban 100 180 480 2 3 9Suburban 180 260 670 2 4 12Small Town 340 530 1140 6 9 19Rural 530 730 1460 9 12 24Remote Rural 420 660 1570 7 12 26
30
Real Option to Scale Bandwidth..
=In addition to foreclosing competition at the Data-Link layer, PONs also impose bandwidth sharing
= Incremental Cost of Home Run fiber may be viewed as a Real Option to unlimited bandwidth (by scaling bandwidth independently of homes sharing a feeder fiber in a PON / Active Star)

31
Is it worth paying the economic premium..
$ .. Or should we achieve a ‘Static Efficiency’ by choosing the ‘least cost’ alternative?
$ .. And thereby foreclose a possible ‘Dynamic Efficiency’ resulting from the innovation that is driven by Competition that the Competitively Neutral architecture enables?

32
Competition in FTTH & depends on…
Community and Market
CharacteristicsSecond Mile Costs
FTTH Architecture
Competition in FTTH
Ownership and Industry Structure
First Mile Costs

33
The ‘Second’ Mile Problem!!
$The viability of competition in the last mile also depends on:$The cost of bringing voice, video and data services
to a Central Office (The second mile costs) from a Regional Node
$The number of subscribers served by a Central Office
$Distance between Central Offices$ Demand for Services$ ..

34
Non Facilities based Competition
Central Office
ServiceProvider A
ServiceProvider B
Home 2
Home 1
Data Link Layer EquipmentNetwork

35
Vertical Integration and Anti-competitive Behavior ?
Central Office
ServiceProvider A
ServiceProvider B
Home 2
Home 1
Data Link Layer EquipmentNetwork
36
Industry Structure and Competition..
$Desired Industry Structure$Neutral Infrastructure owner providing non-discriminatory
access to Higher Layer Service providers
$Ownership Alternatives$Private Enterprise
$Subscriber (or Community Ownership)
$Local Government
$ Jointly owned common carrier
$Power Utility
$Migration to Desired Industry Structure?
37
Conclusion..$PON is the most economical infrastructure
$Home Run Fiber is more expensive, but Competitively Neutral
$ 'Home Run PON' and 'Aggregation PON' are Competitively Neutral and Economically more Efficient than Home Run
$A Competitively Neutral architecture is a necessary (but not sufficient) condition for data link layer competition

38
Contribution of this paper$Defined taxonomy of competition in FTTH
$Clarified relation of architecture to Data Link layer competition
$Understood the economics of FTTH architectures in different deployment scenarios
$Estimated “Cost of Data-Link layer Competition”
$Devised compromise architectures to enable competition at lower first capital cost
$Identified institutional and economic issues for further study
39
.. and Future Work$Continue to explore implications for
Competition of:$Second Mile Costs $Ownership options$Operations Costs$Market Characteristics
40
Engineering Cost Model Assumptions and
Results

41
Engineering Cost Model
$Estimates Capital Cost per Home Passed and Capital Cost per Home Served for FOUR architectures and FIVE deployment contexts
$Aerial Fiber deployed on poles
$Sufficient Feeder and Distribution fiber for the entire community installed regardless of the number homes that sign up for service

42
Cost ModelCPE Cost
CentralOffice Cost
Total FTTHCapital Cost
FTTH CapitalCost per
Home Served
AssumptionsLocal Loop
Cost
FTTHArchitecture
DeploymentScenario
FTTH LoopInfrastructure
Cost
FTTH CapitalCost per
HomePassed

43
Local Loop Costs
T o t a l L o c a lL o o p C o s t s
F e e d e rL o o p C o s t s
D r o p L o o pC o s t s
O t h e rD e p l o y m e n t
C o s t s
O u t s i d eP l a n t
E q u i p m e n t
D i s t r i b u t i o nL o o p C o s t s

44
Data from HAI Model 5.0 A
Cluster 1
Cluster 5
Cluster 6
Cluster 3
Cluster 2
Cluster 4
Central Office
R6
R5
R4
R2
R1
R3

45
Data from HAI Model 5.0 A
Central Office (CLLI) No. ofClusters
Totalno. ofHomes
Housing Density(Homes/sq. mi.)
Average RadialDistance from COto each cluster (ft)
PITBPASQ (Urban) 23 16,135 3,389 4,730HMSTPAHO (Suburban) 23 16,201 1,603 9,089CHTTPACT (Small Town) 14 10,184 218 15,165TNVLPATA (Rural) 10 5,871 86 18,662CCHRPAXC (Remote Rural) 18 3,018 20 32,763

46
Cost Model Assumptions
Deployment Homes persq. mile
Homesserved per
CO
Ave. FeederLoop length
(feet)
AverageDistributionLoop length
Drop Loop length
Urban 3389 16,135 6,960 377 Uniform(50,75)Suburban 1602 16,201 12,396 521 Uniform(75,150)Small Town 217 10,184 24,012 1,472 Uniform(100,200)Rural 85 5,871 37,054 2,434 Uniform(150,300)RemoteRural
20 3,018 42,084 5,791 Uniform(200,600)

47
Equipment and Costs
Architecture Central OfficeEquipment (per 32Homes)
Central OfficeEquipment (perHome)
Optical NetworkUnit (ONU)
Remote NodeEquipment (perHome)
Home Run $375 $550Active Star $800 $25 $550 $250PONs $2,375 $75 $650 $25WDM PON $20,000 $1,500 $25
Architecture OLT Interface ONU InterfaceHome Run 100 Mbps Fast Ethernet per Home 2 POTS, 10/100 Base T, RF VideoActive Star Gigabit Ethernet Interface per 32 Homes 2 POTS, 10/100 Base T, RF VideoPON Gigabit Ethernet Interface per 32 Homes 2 POTS, 10/100 Base T, RF VideoWDM PON 100 Mbps Fast Ethernet per Home 2 POTS, 10/100 Base T, RF Video

48
Capital Cost per Home Passed
Capital Cost per Home Passed
8121119
2211
3483
6212
715 940
1869
2954
5790
0
1000
2000
3000
4000
5000
6000
7000
Urban Suburban Small Town Rural RemoteRural
Deployment Scenarios
US
D p
er H
om
e
Home Run Architecture
PON Architecture

49
Fiber Loop Cost Breakdown (Home Run Fiber)
Capital Cost per Home Passed (Home Run Fiber)
0.0
1000.0
2000.0
3000.0
4000.0
5000.0
6000.0
Urban Suburban Small Town Rural RemoteRural
Deployment Scenario
US
D p
er H
om
e Feeder Loop
Distribution Loop
Central Office Building
Pole Make Ready Costs

50
Fiber Loop Cost Breakdown (PON)Capital Cost per Home Passed (Passive Optical Network)
0.0
1000.0
2000.0
3000.0
4000.0
5000.0
6000.0
Urban Suburban Small Town Rural RemoteRural
Deployment Scenarios
US
D p
er H
om
e
Feeder Loop
Distribution Loop
Central Office Building
Pole Make Ready Costs

51
Capital Cost per Home Served (Urban Deployment)
Capital Cost per Home Served (Urban Deployment)
0500
100015002000250030003500400045005000
0 20 40 60 80 100
Percent Penetration
FT
TH
Cap
ital C
ost p
er H
ome
Ser
ved
Home Run Fiber Active Star Passive Star (PON) WDM PON

52
Capital Cost per Home Served (Suburban Deployment)
Capital Cost per Home Served (Suburban Deployment)
0500
100015002000250030003500400045005000
0 20 40 60 80 100
Percent Penetration
FT
TH
Cap
ital C
ost p
er H
ome
Ser
ved
Home Run Fiber Active Star Passive Star (PON) WDM PON

53
Capital Cost per Home Served (Small Town Deployment)
Capital Cost per Home Served (Small Town Deployment)
0
1000
2000
3000
4000
5000
6000
7000
8000
9000
10000
0 20 40 60 80 100
Percent Penetration
FT
TH
Cap
ital C
ost p
er H
ome
Ser
ved
Home Run Fiber Ac tive Star Passive Star (PON) WDM PON
54
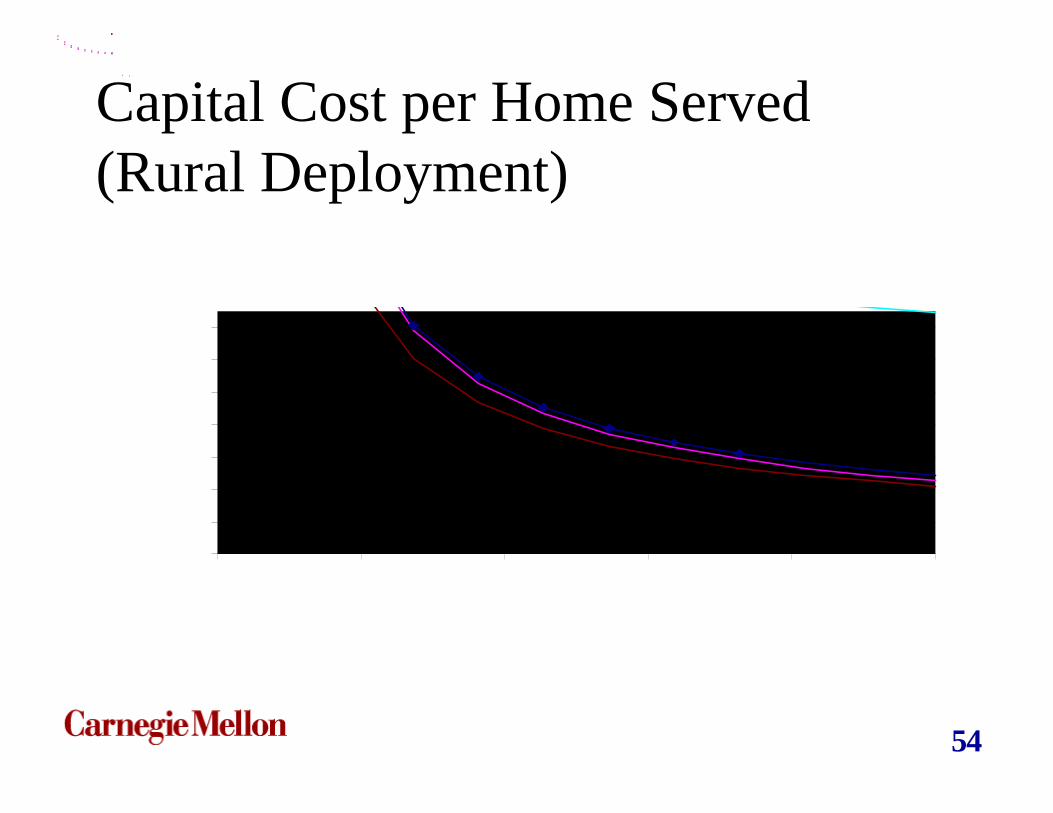
Capital Cost per Home Served (Rural Deployment)

55
Capital Cost per Home Served (Remote Rural Deployment)


