17 th International Symposium on Applications of Laser Techniques to Fluid Mechanics Lisbon, Portugal, 07-10 July, 2014 - 1 - Towards time-resolved Magnetic Resonance Velocimetry for IC-engine intake flows Daniel Freudenhammer 1,* , Elias Baum², Brian Peterson², Benjamin Böhm³, Sven Grundmann 1 1: Center of Smart Interfaces, TU Darmstadt, Germany 2: Reaktive Strömungen und Messtechnik, TU Darmstadt, Germany 3: Energie und Kraftwerkstechnik, TU Darmstadt, Germany * correspondent author: [email protected]Abstract A 1:1 scale model of a single-cylinder optical engine was investigated using Magnetic Resonance Velocimetry (MRV) measurements. Volumetric flow-data within the intake-channel and cylinder geometry was conducted. The measurements were performed in a steady-state flow water-analogue of the optical IC- engine with a fixed valve lift of 9.21mm to simulate the induction flow at crank-angle 270° bTDC. This setup resembles a steady flow engine test bench configuration. MRV measurements are validated with phase-averaged particle image velocimetry (PIV) measurements performed within the symmetry plane of the optical engine. Differences in experimental operating parameters between MRV and PIV measurements are well-addressed. A comparison between MRV and PIV measurements is demonstrated using normalized mean velocity-component profiles and showed excellent agreement in the upper-portion of the cylinder chamber (i.e. y ≥ -20mm). MRV-measurements are further used to analyze the ensemble-average volumetric flow within the 3D engine domain. Measurements are used to describe the 3D overflow and underflow behavior as the annular flow enters the cylinder chamber. Flow features such as the annular jet-like flows extending into the cylinder, their influence on large scale in- cylinder flow motion, as well as flow recirculation zones are identified in 3D space. Inlet flow velocities are analyzed around the entire valve curtain perimeter to quantify percent mass flow rate entering the cylinder. Recirculation zones associated with the underflow are shown to reduce local mass flow rates up to 50%. These are further analyzed in 3D space within the intake manifold and cylinder chamber. As a conclusion MRV is revealed to be an important diagnostic tool used to understand the volumetric induction flow within engine geometries and is potentially suited to evaluate flow changes due to intake geometry modifications. Attempts to measure the dynamic behavior of the flow during a large part of the intake-stroke are a matter of current work. The experimental setup has for that reason been adapted: The MRV-model was equipped with moving intake-valves and a bypass-mechanism. MR-capable hydraulic actuators have been developed and are currently in the process of final testing. These actuators are designed to realize the periodic movement of the intake-valves. A phase-averaging, time-resolving MR-sequence is capable of capturing the periodic nature of the valve-movement. 1. Introduction The engine in-cylinder turbulent flow has long been recognized as one of the key parameters influencing engine performance in spark-ignition (SI) engines. During the intake stroke a large scale flow motion is created, typically regarded as tumble or swirl [Hill et al 1994] and includes high levels of turbulence [Tabaczynski1976]. The large scale motion is primarily defined by the geometry of the intake system (manifold, inlet port, valve(s)) and cylinder geometry [Heywood1988]. Non-intrusive velocimetry measurements within regions of the inlet port and valve curtain are challenging due to the limited optical access and dynamics of moving boundaries. Magnetic resonance velocimetry (MRV) is an advanced diagnostic tool based on magnetic resonance imaging (MRI) [Haacke et al. 1999]. MRV can be applied in any magnetic resonance (MR) scanner using special sequences. It has been proven to be a versatile experimental method, capable of resolving ensemble-average flow fields within a volumetric domain [Elkins and Ally 2007]. The time for data acquisition for volumes of approximately 400 mm diameter and 300 mm
Transcript
17th International Symposium on Applications of Laser Techniques to Fluid Mechanics Lisbon, Portugal, 07-10 July, 2014
- 1 -
Towards time-resolved Magnetic Resonance Velocimetry
for IC-engine intake flows
Daniel Freudenhammer1,*, Elias Baum², Brian Peterson², Benjamin Böhm³, Sven Grundmann1
1: Center of Smart Interfaces, TU Darmstadt, Germany
2: Reaktive Strömungen und Messtechnik, TU Darmstadt, Germany 3: Energie und Kraftwerkstechnik, TU Darmstadt, Germany
* correspondent author: [email protected] Abstract A 1:1 scale model of a single-cylinder optical engine was investigated using Magnetic Resonance Velocimetry (MRV) measurements. Volumetric flow-data within the intake-channel and cylinder geometry was conducted. The measurements were performed in a steady-state flow water-analogue of the optical IC-engine with a fixed valve lift of 9.21mm to simulate the induction flow at crank-angle 270° bTDC. This setup resembles a steady flow engine test bench configuration. MRV measurements are validated with phase-averaged particle image velocimetry (PIV) measurements performed within the symmetry plane of the optical engine. Differences in experimental operating parameters between MRV and PIV measurements are well-addressed. A comparison between MRV and PIV measurements is demonstrated using normalized mean velocity-component profiles and showed excellent agreement in the upper-portion of the cylinder chamber (i.e. y ≥ -20mm). MRV-measurements are further used to analyze the ensemble-average volumetric flow within the 3D engine domain. Measurements are used to describe the 3D overflow and underflow behavior as the annular flow enters the cylinder chamber. Flow features such as the annular jet-like flows extending into the cylinder, their influence on large scale in-cylinder flow motion, as well as flow recirculation zones are identified in 3D space. Inlet flow velocities are analyzed around the entire valve curtain perimeter to quantify percent mass flow rate entering the cylinder. Recirculation zones associated with the underflow are shown to reduce local mass flow rates up to 50%. These are further analyzed in 3D space within the intake manifold and cylinder chamber. As a conclusion MRV is revealed to be an important diagnostic tool used to understand the volumetric induction flow within engine geometries and is potentially suited to evaluate flow changes due to intake geometry modifications. Attempts to measure the dynamic behavior of the flow during a large part of the intake-stroke are a matter of current work. The experimental setup has for that reason been adapted: The MRV-model was equipped with moving intake-valves and a bypass-mechanism. MR-capable hydraulic actuators have been developed and are currently in the process of final testing. These actuators are designed to realize the periodic movement of the intake-valves. A phase-averaging, time-resolving MR-sequence is capable of capturing the periodic nature of the valve-movement. 1. Introduction The engine in-cylinder turbulent flow has long been recognized as one of the key parameters influencing engine performance in spark-ignition (SI) engines. During the intake stroke a large scale flow motion is created, typically regarded as tumble or swirl [Hill et al 1994] and includes high levels of turbulence [Tabaczynski1976]. The large scale motion is primarily defined by the geometry of the intake system (manifold, inlet port, valve(s)) and cylinder geometry [Heywood1988]. Non-intrusive velocimetry measurements within regions of the inlet port and valve curtain are challenging due to the limited optical access and dynamics of moving boundaries. Magnetic resonance velocimetry (MRV) is an advanced diagnostic tool based on magnetic resonance imaging (MRI) [Haacke et al. 1999]. MRV can be applied in any magnetic resonance (MR) scanner using special sequences. It has been proven to be a versatile experimental method, capable of resolving ensemble-average flow fields within a volumetric domain [Elkins and Ally 2007]. The time for data acquisition for volumes of approximately 400 mm diameter and 300 mm
17th International Symposium on Applications of Laser Techniques to Fluid Mechanics Lisbon, Portugal, 07-10 July, 2014
- 2 -
in length is less than an hour and rigorous post-processing is not required. Moreover, since optical access is not required for data acquisition, MRV is convenient in highly complex geometries for which traditional velocimetry techniques are often limited. Magnetic Resonance Velocimetry (MRV) was applied to acquire the 3D3C (three-dimensional, three-component) flow velocity within an engine-equivalent polyamide model with 1:1 scale geometry of a single cylinder optical engine [Baum2014]. The MRV measurements are validated with phase-averaged particle image velocimetry (PIV) measurements performed within the tumble plane of the optical engine. Volumetric flow information is then analyzed within the valve curtain and intake manifold regions. Recirculation zones in 3D space are identified in the inlet port and around the periphery of the valve curtain. The volumetric flow images clearly reveal the capabilities of MRV to better understand the 3D flow during the induction event within realistic engine geometries. Next-generation MRV measurements in engine geometries with moving intake valves are also presented as a future outlook. 2. Experimental Setup 2.1 Optical engine and PIV measurements The engine under investigation is a single-cylinder direct-injection spark-ignition (DISI) optical engine [Baum2014]. It is equipped with a twin-cam, overhead-valve pentroof cylinder head and a dual port intake system designed to provide a tumble flow motion within the combustion chamber. The bore and stroke of the engine are both 86mm with a geometric compression ratio of 8.5. Optical access into the DISI combustion chamber is provided by a 55mm height quartz-glass liner (20mm thickness), an 8mm window extension into the pentroof, and a Bowditch-piston with flat quartz-glass piston-crown window (75mm diameter). Additionally, optical access is granted into the straight piping of the intake manifold by a DN50 (56.3mm inner dia., 70mm length) fused-silica cylinder. An overview of the important engine parameters are given in Table 1.
Table 1: Engine operating parameters RPM 800 min-1 Avg. Press. Intake 0.95 bar Avg. Press. Exhaust 1.00 bar Intake temp. 296 K Compression ratio 8.5 - Intake valve diameter 33 mm Intake valve open (IVO) 325 ° aTDC Intake valve close (IVC) 125 ° bTDC Exhaust valve open (EVO) 105 ° aTDC Exhaust valve close (EVC) 345 ° bTDC Maximum valve lift (IV) 9.5 mm At position 250 ° bTDC
For the verification of the MRV measurements, two PIV experiments were carried out within the motored optical engine operated at 800RPM. The first measured the 2D flow field within the straight pipe of the intake manifold located approx. 7D upstream the intake valves (D = 56.3mm, red line Fig. 2) to estimate the bulk velocity in front of the bifurcation during the intake stroke. The second set of PIV measurements were performed within the combustion chamber to quantify the 2D2C (2-dimensional, 2-component) flow field within the symmetry plane of the engine cylinder (i.e. tumble plane, z = 0mm) [Baum2014]. Both sets of PIV measurements were performed separately at crank-angle (CA) 270° before top-dead-center (bTDC). For the PIV measurements a frequency-doubled Nd:YAG dual-cavity laser (Edgewave INNOSLAB IS16 II-E, 532nm, 10mJ) and a 12 bit CMOS camera (Phantom V.711, 1280x800 pixels, double-frame exposure) were used. The measurement system was synchronized to the engine by an optical crank-angle encoder (AVL) and a programmable timing controller (LaVision, HS-Controller V2). For the measurement in the intake manifold, 78 phase-locked velocity images at 270° bTDC were
17th International Symposium on Applications of Laser Techniques to Fluid Mechanics Lisbon, Portugal, 07-10 July, 2014
- 3 -
acquired at 13.3Hz. The statistic of the velocity data in the tumble plane is based on 2700 phase-locked velocity images at 270° bTDC. An overview of the in-cylinder PIV measurements and engine operating conditions can be found in [Baum2014]. A commercial software program (LaVision, DaVis 8.1.2) was used for processing all PIV images. Images of a spatially defined target (LaVision, Type 7), placed within the quartz-glass intake manifold and quartz-glass engine cylinder, were used for camera calibration. Mie scattering images were cross-correlated with decreasing window size multi-pass iterations (96x96 to 32x32) with 75% window overlap, which provided an approx. spatial resolution of 1.1mm within the intake manifold and 1.8mm within the engine. The spatial resolution is based on the final interrogation window size (i.e. 32x32). Vector post-processing was performed for all PIV images, which utilized a peak ratio factor of 1.3 and a median filter operation to remove spurious vectors [Westerweel1994]. A 3x3 Gaussian smoothing filter was applied to the vector field to remove noise at spatial scales near the resolution limit of the PIV measurements [Fajardo2009]. 2.2 Flow apparatus and MR Scanner The experiments were conducted using the flow-supply system described in detail in Grundmann et al. (2012). This system provides a flow-rate of up to 70L/min (0.55kW rotary-pump: Grundfos, CME3-2) and contains a 70L water tank in which the water can be heated to 50°C (2kW heater coil) to increase the Reynolds number of the flow in the model. The pressure and temperature of the flow is measured downstream of the pump with a pressure sensor (Jumo Midas, 401001) and a Pt100 temperature sensor, respectively. The flow rate is monitored by a paddle-wheel flow meter (Bürkert, 8030DN15).
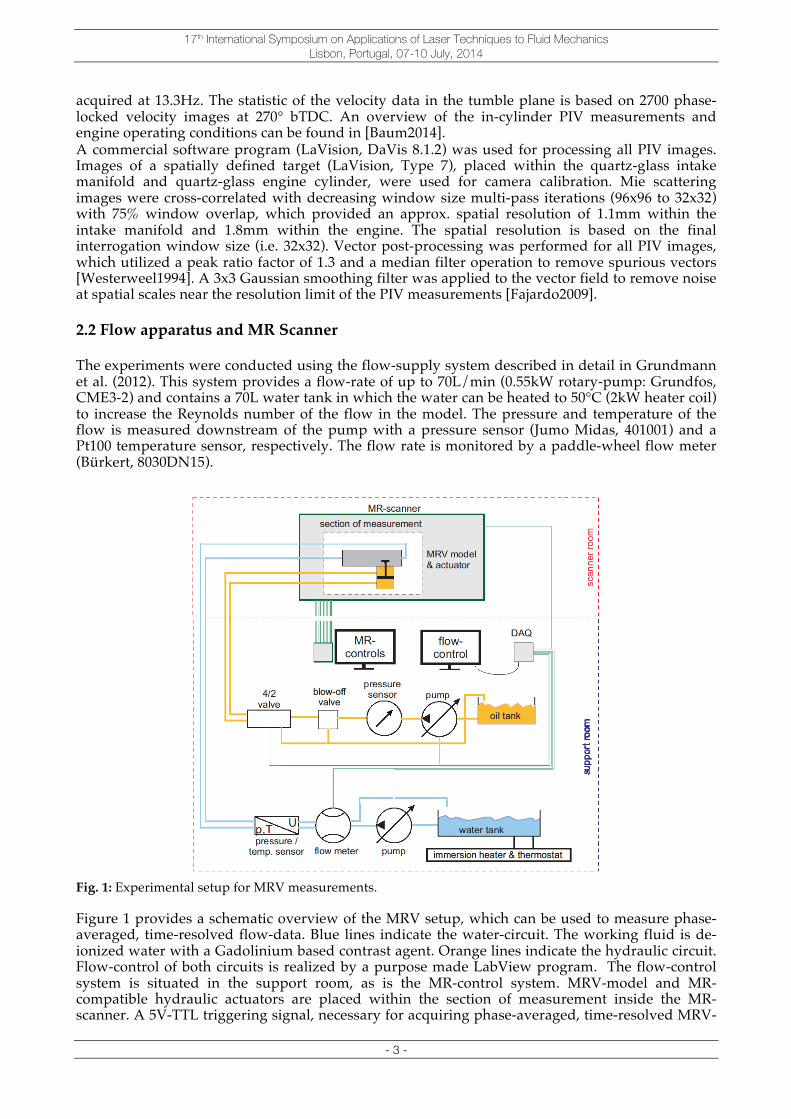
Fig. 1: Experimental setup for MRV measurements. Figure 1 provides a schematic overview of the MRV setup, which can be used to measure phase-averaged, time-resolved flow-data. Blue lines indicate the water-circuit. The working fluid is de-ionized water with a Gadolinium based contrast agent. Orange lines indicate the hydraulic circuit. Flow-control of both circuits is realized by a purpose made LabView program. The flow-control system is situated in the support room, as is the MR-control system. MRV-model and MR-compatible hydraulic actuators are placed within the section of measurement inside the MR-scanner. A 5V-TTL triggering signal, necessary for acquiring phase-averaged, time-resolved MRV-
17th International Symposium on Applications of Laser Techniques to Fluid Mechanics Lisbon, Portugal, 07-10 July, 2014
- 4 -
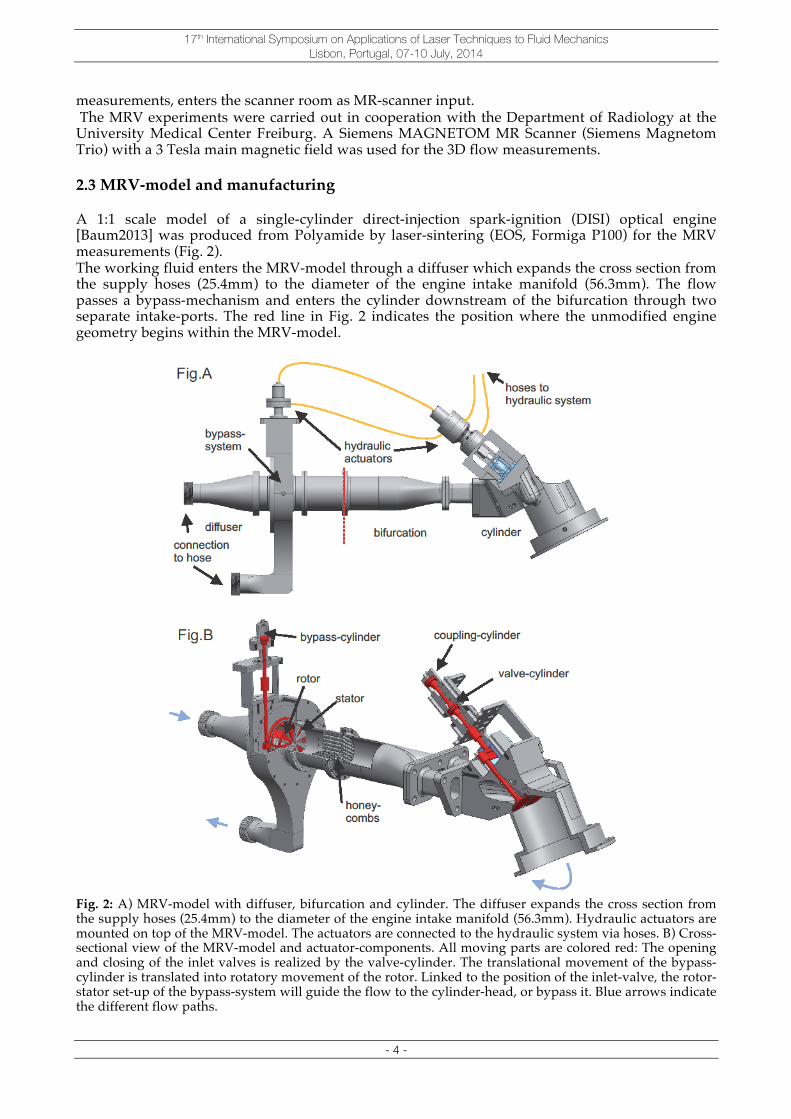
measurements, enters the scanner room as MR-scanner input. The MRV experiments were carried out in cooperation with the Department of Radiology at the University Medical Center Freiburg. A Siemens MAGNETOM MR Scanner (Siemens Magnetom Trio) with a 3 Tesla main magnetic field was used for the 3D flow measurements. 2.3 MRV-model and manufacturing A 1:1 scale model of a single-cylinder direct-injection spark-ignition (DISI) optical engine [Baum2013] was produced from Polyamide by laser-sintering (EOS, Formiga P100) for the MRV measurements (Fig. 2). The working fluid enters the MRV-model through a diffuser which expands the cross section from the supply hoses (25.4mm) to the diameter of the engine intake manifold (56.3mm). The flow passes a bypass-mechanism and enters the cylinder downstream of the bifurcation through two separate intake-ports. The red line in Fig. 2 indicates the position where the unmodified engine geometry begins within the MRV-model.
Fig. 2: A) MRV-model with diffuser, bifurcation and cylinder. The diffuser expands the cross section from the supply hoses (25.4mm) to the diameter of the engine intake manifold (56.3mm). Hydraulic actuators are mounted on top of the MRV-model. The actuators are connected to the hydraulic system via hoses. B) Cross-sectional view of the MRV-model and actuator-components. All moving parts are colored red: The opening and closing of the inlet valves is realized by the valve-cylinder. The translational movement of the bypass-cylinder is translated into rotatory movement of the rotor. Linked to the position of the inlet-valve, the rotor-stator set-up of the bypass-system will guide the flow to the cylinder-head, or bypass it. Blue arrows indicate the different flow paths.
17th International Symposium on Applications of Laser Techniques to Fluid Mechanics Lisbon, Portugal, 07-10 July, 2014
- 5 -
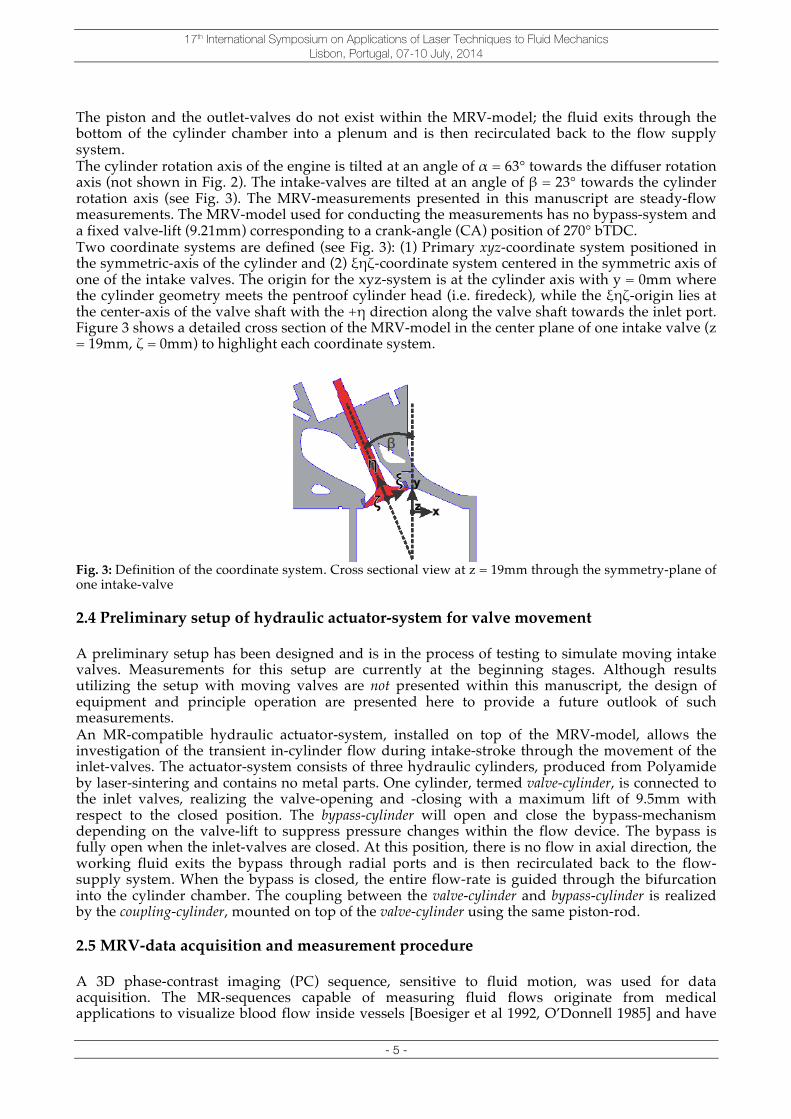
The piston and the outlet-valves do not exist within the MRV-model; the fluid exits through the bottom of the cylinder chamber into a plenum and is then recirculated back to the flow supply system. The cylinder rotation axis of the engine is tilted at an angle of α = 63° towards the diffuser rotation axis (not shown in Fig. 2). The intake-valves are tilted at an angle of β = 23° towards the cylinder rotation axis (see Fig. 3). The MRV-measurements presented in this manuscript are steady-flow measurements. The MRV-model used for conducting the measurements has no bypass-system and a fixed valve-lift (9.21mm) corresponding to a crank-angle (CA) position of 270° bTDC. Two coordinate systems are defined (see Fig. 3): (1) Primary xyz-coordinate system positioned in the symmetric-axis of the cylinder and (2) ξηζ-coordinate system centered in the symmetric axis of one of the intake valves. The origin for the xyz-system is at the cylinder axis with y = 0mm where the cylinder geometry meets the pentroof cylinder head (i.e. firedeck), while the ξηζ-origin lies at the center-axis of the valve shaft with the +η direction along the valve shaft towards the inlet port. Figure 3 shows a detailed cross section of the MRV-model in the center plane of one intake valve (z = 19mm, ζ = 0mm) to highlight each coordinate system.
Fig. 3: Definition of the coordinate system. Cross sectional view at z = 19mm through the symmetry-plane of one intake-valve 2.4 Preliminary setup of hydraulic actuator-system for valve movement A preliminary setup has been designed and is in the process of testing to simulate moving intake valves. Measurements for this setup are currently at the beginning stages. Although results utilizing the setup with moving valves are not presented within this manuscript, the design of equipment and principle operation are presented here to provide a future outlook of such measurements. An MR-compatible hydraulic actuator-system, installed on top of the MRV-model, allows the investigation of the transient in-cylinder flow during intake-stroke through the movement of the inlet-valves. The actuator-system consists of three hydraulic cylinders, produced from Polyamide by laser-sintering and contains no metal parts. One cylinder, termed valve-cylinder, is connected to the inlet valves, realizing the valve-opening and -closing with a maximum lift of 9.5mm with respect to the closed position. The bypass-cylinder will open and close the bypass-mechanism depending on the valve-lift to suppress pressure changes within the flow device. The bypass is fully open when the inlet-valves are closed. At this position, there is no flow in axial direction, the working fluid exits the bypass through radial ports and is then recirculated back to the flow-supply system. When the bypass is closed, the entire flow-rate is guided through the bifurcation into the cylinder chamber. The coupling between the valve-cylinder and bypass-cylinder is realized by the coupling-cylinder, mounted on top of the valve-cylinder using the same piston-rod. 2.5 MRV-data acquisition and measurement procedure A 3D phase-contrast imaging (PC) sequence, sensitive to fluid motion, was used for data acquisition. The MR-sequences capable of measuring fluid flows originate from medical applications to visualize blood flow inside vessels [Boesiger et al 1992, O’Donnell 1985] and have
17th International Symposium on Applications of Laser Techniques to Fluid Mechanics Lisbon, Portugal, 07-10 July, 2014
- 6 -
been adapted for measuring technical flows of engineering sciences. The quantum mechanical phenomenon of nuclear magnetic resonance (NMR) allows the working-principle of all MR-sequences: Subatomic nuclides precess at a resonance frequency, namely the Larmor-frequency ωL in the existence of a strong magnetic field with the axis of the precession motion being the direction of the main magnetic field. The nuclides precess at a resonance frequency, namely the Larmor-frequency ωL [Haacke 1999, Elkins 2007]. A resulting magnetization of the atomic nucleus appears in the case of an odd number of protons and neutrons, as in the case of hydrogen. The Larmor-frequency ωL depends on the material-dependent gyromagnetic ratio γ and the local magnetic field strength B. The main magnetic field B0 and superimposed local magnetic field gradients G(t), that can be created along arbitrary axes r(t) through gradient coil systems, add up to the local magnetic field strength B. ω! r, t = γ ∗ (B! + r t ∗ G t ) (1) Radio frequency (RF) pulses cause tilting of the precession-axis and thus the development of transverse magnetization. After the RF-pulses, the transverse magnetization starts to decay and the MR signal can be measured as an echo of the free induction-decay in receiver-coils. The received signal is a composition of the signals that evolve from every voxel of the entire field-of-view (FOV) and is stored as signal magnitude distribution in raw data space, called k-space. The spatial frequency domain, k-space, is a complex space that contains information on the signal magnitude and on the phase angle of all frequency components of the received MR-signal. Spatial encoding of the received MR-signal can be realized by a systematic spatial and temporal manipulation of ωL within the measurement domain. This enables the adjustment of the signals frequency and phase angle of the spins depending on the position in the FOV. A fourier transform can reconstruct the local signal magnitude and phase angle of the transmitted MR-signal at every voxel in the FOV. Bipolar magnetic field gradients can additionally make the phase angle of the MR signal to depend on the local flow velocity. Further information regarding MRI and MRV can be found in [Haacke1999 and Elkins2007]. The MRV-model was aligned with the patient table of the MR scanner and secured in a fixed position to prevent measurement errors through unintentional movement. Receiver/ Transmitter-coils were installed on top of the model and tightened to the patient table of the MR scanner. The MRV-model was connected to the hoses and filled with water. Two different flow rates were chosen for the experiments: 66L/min and 33L/min. The working fluid was heated to 50°C to reduce the viscosity and thereby increase the Reynolds number of the flow in the model. The Reynolds numbers inside the straight intake piping were calculated using the bulk flow-velocity, the kinematic viscosity of the working fluid and the diameter of the diffuser at the position just upstream of the bifurcation (diameter 56.3mm, see red dotted line in Fig. 2). The Reynolds numbers under investigation are Re = 22,500 and Re = 45,000. Each measurement consists of two scans. In the context of this manuscript, an individual scan is the total acquisition time to measure the velocity within all voxels in the volumetric domain. One scan was conducted with fluid-flow at the selected flow-rate (flow-on scan) and the other scan was conducted without fluid-flow (flow-off scan). Both scans are conducted consecutively. The velocity information was encoded in the phase image that was reconstructed by the Fourier transformation. Phase angle distortions may result from other influences than from velocity, such as eddy currents and magnetic field inhomogeneity. To remove such effects from the velocity data measured during the flow-on scan, the apparent velocity of the flow-off scan was subtracted from the flow-on scan. The velocity encoding value, (venc) is a parameter that relates the measured phase angle to a velocity. The venc must be chosen such that the highest velocities in the FOV lie below the venc value in order to avoid aliasing effects. By setting the venc value, the magnitude of bipolar magnetic field gradients mentioned above can be chosen. However, the venc should be chosen as low as possible to provide highest signal to noise ratio (SNR). Large venc values increase the standard deviation (SD) of the measured velocities. SNRmag is the signal-to-noise ratio of the magnitude image and not of the phase image that carries the velocity information. The noise in the magnitude data is considered to be representative noise of the phase image which can precisely and conveniently be determined for MRV measurements [Haacke1999]. The mean signal value and the value of the standard deviation were determined
17th International Symposium on Applications of Laser Techniques to Fluid Mechanics Lisbon, Portugal, 07-10 July, 2014
- 7 -
from representative regions in the 3D data-sets (signal magnitude). The venc value was chosen to 1m/s and 2m/s for Re = 22,500 and Re = 45,000, respectively, according to the maximum expected flow-velocities in the valve-gap. SNR!"# =
!"#$ (!"#$%&)!∗!"(!"#$%)
(2) 3 flow-on and 3 flow-off scans for Re = 22,500 and 4 flow-on and flow-off scans for Re = 45,000 were conducted and averaged with the exact same conditions to improve SNRmag , which increased SNRmag by a factor of 𝑛 [Haacke.1999]. The time for data acquisition was 9min 15sec/scan. The FOV of the measurements was 240x140x128 mm³ with a spatial resolution of 1.0x1.0x1.0mm³. Values for parameters influencing MRV flow determination are provided in Table 1. The standard deviation of the velocity noise is about 0.02m/s for the individual measurements with Re = 45,000. In relation to the venc of 2m/s a velocity uncertainty of 1% is calculated.
Table 2: Parameters and settings of MRV measurements Flow parameters Fluid De-ionized water Temperature 50 °C Volumetric flow rate 33;66 L/min Re number 22,500; 45,000 MRV parameters Field-of-View 240x140x128 mm³ Spatial resolution 1.0x1.0x1.0 mm³ venc 1; 2 m/sec Time/measurement 9min 15 sec No. of repetitions (n) 3; 4 No. of vectors 4.2e6
3. Validation of MRV-data and comparability to PIV-data For the verification of the MRV measurements, PIV experiments were carried out within the motored optical engine operated at 800RPM to measure the flow field at crank-angle 270° bTDC. The representative ensemble-mean flow fields for MRV and PIV measurements are shown in Fig. 4. The PIV phase-averaged measurements are based on 2700 engine cycles, while MRV data provides ensemble-mean velocity information. Differences of experimental operating parameters between the PIV and MRV measurements are well addressed and discussed below. Compressibility effects for air were evaluated for the given engine operating conditions to evaluate the difference of the working fluids (i.e. water vs. air). The Mach-number (Ma) is calculated for the air flow into the engine for PIV measurements. As previously stated, the CA of interest for this analysis is 270° bTDC. At 800RPM and 0.95 bar intake air pressure, the bulk velocity calculated by PIV measurements within the intake piping exhibited a steady-state pipe flow with average air velocity of 10.1m/s from 300 – 260° bTDC. This provides an instantaneous air mass flow rate into the engine of 𝑚 = 29.8g/s for CA = 270 ° bTDC. The maximum velocity within the intake system occurs within the valve curtain [Bicen1985] with the smallest cross-sectional area (9.5cm² for the present engine). If the air flow velocity is equally distributed along the entire valve curtain perimeter, the average velocity within the valve gap is estimated to be 13.2m/s and would correspond to Ma = 0.038 ( a = 346m/s under the given thermodynamic conditions). However, within previous studies [ElTahry1987] and within this work it is shown that the flow past the valve curtain is not equally distributed. For this work, MRV data reveals that 43.5% of the air mass flow enters the cylinder over the front side of the valve identified as the overflow covering ~25% of the available cross-sectional area. This would suggest a maximum air flow velocity of VAir,max =
17th International Symposium on Applications of Laser Techniques to Fluid Mechanics Lisbon, Portugal, 07-10 July, 2014
- 8 -
22.8m/s entering the cylinder and corresponding Ma = 0.066. Thus, the air flow into the engine can be approximated as incompressible (i.e. ∆ρ ≈ 1.8% and Ma < 0.3), agreeing with that of the water medium in the MRV measurements.
Fig. 4: 2D contour-plot in the symmetry plane. PIV (left) and MRV (right) at 270° bTDC. Dashed lines at y = -10mm reveal the lines for which velocity profiles were extracted in Fig. 3. Flow comparison is not considered in shaded region due to absence of piston boundary in MRV measurements. As previously mentioned, the piston is removed within the MRV-model and the flow exits through the bottom of the cylinder chamber. Within the optical engine, the annular inlet flow enters the cylinder chamber and this flow is redirected by the cylinder wall and piston surface, creating a large scale tumble motion as shown in Fig. 4 and described in detail in [Baum2014]. The PIV data shown in Fig. 4 left is the ensemble-average flow field based from 2700 cycles at 270° bTDC. This large scale tumbling motion within the center of the cylinder chamber does not exist within the MRV measurement volume (see Fig. 4 right) due to the absence of the piston boundary and its movement. The upper part y > -20mm shows now influence of the redirected flow. Therefore, the MRV data should only be evaluated within the measurement volume where the flow is not influenced by the piston. As shown in Fig. 4, the flow pattern within the MRV measurements begin to significantly deviate from the PIV measurements below y = - 20mm and will therefore only be evaluated above y = -20mm. For the current measurements, the MRV-model has a fixed valve lift of 9.21mm corresponding to the valve position at 270° bTDC. This valve position is near its maximum lift of 9.5mm, which occurs at 250° bTDC within the optical engine. As stated within previous studies [Fukutani1982, Bicen1985, ElTahry1987], the influence of valve motion is primarily regarded to provide variations in the valve gap spacing and not, as a first-order effect, cause transients of the velocity profiles at the exit of the valve curtain. Furthermore, at 270° bTDC the valve translational velocity is ~0.01m/s, which is significantly lower than the estimated air velocity exiting the valve gap. Thus, it is expected that valve movement at 270° bTDC will have a minimal influence on the resulting inlet flow field and can therefore be neglected. The fluid flow within the MRV measurements system represents a steady-state flow, while the flow within the engine inlet can be unsteady throughout induction. However, [Bicen1985 and ElTahry1987] established that a quasi-steady flow assumption is valid for many parts of the intake stroke, particularly when the piston acceleration is near zero (i.e. near 270° bTDC). Flow measurements from [ElTahry1987] within a motored engine further argued that the quasi-steady flow phase near maximum valve lift is the induction phase where most of the cylinder charge is inducted into the engine. Thus the steady flow assumption has been one of the key assumptions enabling previous flow studies within engine inlet systems [Bicen1985, Khalighi1986, ElTahry1987, Tindal1988, Cheung1990, Chen1995, Nadarajah1998, Pajkovic2008] and is argued as a valid assumption for the MRV measurements presented in this work.
17th International Symposium on Applications of Laser Techniques to Fluid Mechanics Lisbon, Portugal, 07-10 July, 2014
- 9 -
Since the fluids of both experiments (MRV and PIV) strongly differ in density and viscosity, a direct comparison of the measured velocities is not possible. Therefore, comparison of the MRV and PIV measurements is conducted by analyzing normalized in-cylinder velocity profiles within the measurement volume.
Fig. 5: Normalized u- and v- velocity profiles extracted along the horizontal line y = -10mm for the PIV and MRV datasets.
The comparison of normalized in-cylinder velocity profiles is performed for two different flow rates of water into the MRV measurement volume. This is done to underline the flow-rate and Reynolds-number independence of the flow. The Reynolds number of the inlet flow is calculated using the bulk velocity (2D: PIV, 3D: MRV) measured within the straight pipe of the intake system 390mm upstream the engine (red dotted line in Fig. 1). This is the location at the end of the diffusor in the MRV-model and is also a location where PIV measurements are performed in the intake system. The flow rate was adjusted to provide Re = 22,500 and 45,000 for the MRV measurements, while for PIV measurements Re ≈ 37,200. Figure 5 shows the normalized u- and v- velocity profiles for all data sets. Velocity normalization was conducted by referencing the velocity field to a representative in-cylinder velocity value for each data set, namely the normalization factor (NF). The NF is defined as the arithmetic mean value of the spatial averaged u- and v- velocity components along a horizontal line (x = -33mm to 35mm, y = -10mm, z = 0mm) shown in Fig. 4. The velocities along the selected line are representative for in-cylinder velocities produced by the annular flow past the intake valves and is a region least influenced by the absence of the piston boundary in the MRV measurements. 4. Results The results presented in the context of this section are steady-state flow experiments and have been described in detail in Freudenhammer et al. (2014). Phase-averaged, time-resolved MRV-measurements with the experimental setup described in Section 2.4 have not yet been conducted. These measurements are object of future investigations. As the flow-topology in the MRV-model diverts from the flow-topology in the engine below y = -20mm, due to the absence of the piston boundary within the MRV-model, the MRV data is only analyzed above y = -20mm. The following results have been conducted for Re = 45,000.
17th International Symposium on Applications of Laser Techniques to Fluid Mechanics Lisbon, Portugal, 07-10 July, 2014
- 10 -
Fig. 6: Intake-flow in the tumble-flow plane (at position z = 19mm). Highest flow-velocities appear in the valve-curtain of the overflow-region (x = 0mm, y ≈ 10mm), whereas a region of recirculating mass-flow is apparent in the underflow-region (x ≤ -25mm, y ≈ 0mm). This mass-flow is re-entering the inlet-channel up to the valve-seat. Velocity vectors (every 3rd vector shown) are displayed with a fixed vector length for better visualizing of the flow topology. The flow within the mid-valve tumble plane at z = 19mm is shown in Fig. 6. The flow field for the adjacent intake valve is not shown for economy of presentation, but exhibits identical flow patterns [Freudenhammer et al. 2014]. The velocity vectors (every 3rd vector shown) have a fixed vector length to better visualize the flow pattern, while the 3C velocity magnitude is shown by the color-scale. A quasi-steady, uniform annular flow exists within the intake manifold (top-left in Fig. 6) and is aligned parallel with the manifold (27° to the x-axis). The uniform flow field is disrupted by the valve stem and the valve head surface. The flow velocity increases in the periphery of the valve stem as the flow approaches the smaller cross-sectional areas of the valve gap. The angle of the manifold guides the majority of the flow through the valve gap over the front side of the valve (ξ > 0mm) and the flow enters the cylinder chamber near the central cylinder axis (x = 0mm). This flow is termed overflow. The velocity magnitude is largest within the valve gap of the overflow region and the flow entering the cylinder extends to the opposite side of the cylinder wall. The flow creates a clockwise vortical motion with the vortex center located slightly off cylinder-axis and beneath the intake valve. Without complementary measurements within the middle valve plane in the operating engine, it cannot be quantified that this vortical motion is a part of the large-scale clockwise tumble motion or a separate vortical flow structure resulting from flow separation from the valve surface. On the left side of the image, the flow approaching the valve is redirected at the valve surface and a small portion of the flow enters the cylinder chamber from the back side of the valve (i.e. ξ < 0mm). This flow is termed underflow (see Fig.6). Within this viewing plane, the underflow consists of a narrow flow channel of high velocities entering the cylinder and producing a counter-clockwise vortical motion directly beneath the valve as the flow discharges near the valve surface. Before the underflow is redirected by the valve surface, the flow separates from the intake port geometry and a large recirculation zone is present between the valve seat and valve head. A portion of the underflow that enters the cylinder is redirected by the cylinder wall and is guided into the recirculation zone. The recirculation zone extends from the cylinder chamber into the intake port, covering a large area within the valve gap.
17th International Symposium on Applications of Laser Techniques to Fluid Mechanics Lisbon, Portugal, 07-10 July, 2014
- 11 -
Fig. 7: Iso-contour of the flow past one intake-valve. a) Iso-velocity surfaces represents area of negative flow velocity vel_ξ (vel_ξ = -0.05 m/s) downstream of the intake-valve. Position of ξ-planes ξ = 0mm/10mm/20mm b) Contour-plot of the velocity-magnitude of the flow past the inlet-valve. Velocity vectors (every 3rd vector shown) have a fixed vector-length to better visualize the flow-topology. The disruption of the inlet flow-field by the valve-stem is visualized in Fig.7. Figure 7a shows the position of three parallel ξ-planes (ξ = 0mm, 10mm and 20mm). A zone of recirculating mass-flow due to the valve-stem is also shown in Fig. 7a. This zone represents an iso-velocity region of vel_ξ = -0.05 m/s. The ξ-contour planes are further visualized in Fig. 7b. The separation of the flow-field by the valve-stem is still visible in plane no. 2, with of high flow-velocities in the upper region of (a) and a zone of smaller flow-velocities in the wake-region of the stem (b). As the flow moves further downstream and passes the valve-curtain, the velocity-distribution changes considerably (see plane no. 3). The geometry of the inlet-channel and the cylinder-head is such, that a region of high flow-velocities (c) is created in the downstream-projection of the valve-stem (c). Velocity vectors (every 3rd vector shown) shown in Fig. 7 have a fixed vector-length to better visualize the flow-topology. The flow distribution through the valve curtain of one intake-valve is visualized in Fig. 8. The valve curtain is defined as the annular area between the valve head and valve seat [Heywood 1988]. It shows the contour plot of the radial velocity on a cylindrical area at the perimeter of the valve curtain. This area is the region where the flow enters the cylinder chamber over of the valve curtain and consists of a cylinder perimeter with 17.5mm radius and height of the valve lift (i.e. 9.21mm). A positive radial velocity represents a flow entering the cylinder chamber, while a negative radial velocity represents a flow re-entering the valve curtain region from the cylinder chamber (i.e. recirculation zone). A boundary (dotted line) is superimposed onto the iso-contour to identify regions of negative radial velocities. The distribution of large velocities along the iso-contour is not uniformly symmetric about the polar axis. More than 43% of the total volumetric flow enters the cylinder chamber over just 25% of the valve curtain surface (within the region of |θ| ≤ 45°) [Freudenhammer2014]. Regions of negative radial velocity are primarily seen closer to the cylinder head within the region of η > 6mm, |θ| > 90°. These negative velocities identify the recirculation zones existing along the perimeter of the valve curtain and reveal that in-cylinder flow velocities re-enter the inlet region over 180° around the valve perimeter.
17th International Symposium on Applications of Laser Techniques to Fluid Mechanics Lisbon, Portugal, 07-10 July, 2014
- 12 -
Fig. 8: a) Annular iso-contour around the valve-curtain of one intake-valve and b) annular contour projected on a 2D plane. Note distinctive areas of negative radial velocity that consists of flow re-entering the valve curtain region for |θ| ≥ 90°. The existence of recirculation zones near the cylinder head have been revealed with previous methods employing LDA measurements [Bicen et al 1985, Dittmeyer and Tropea 1990, Chen et al 1995, Mahmood et al 1996] but were not analyzed in 3D space. Thus it is crucial to identify regions of recirculated flow and understand their influence on volumetric efficiency as well as the developing in-cylinder flow pattern. In Fig. 9, recirculation zones are identified in 3D space inside the entire cylinder chamber. The recirculation zones presented are defined as any location with positive η-velocities, indicating velocities directed toward the intake manifold. Figure 9 shows the entire 3D recirculation of the mass flow entering the cylinder chamber in the vicinity of the intake-valves. Iso-surfaces with fixed velocity values are visualized from two different perspectives. The iso-surfaces of η-velocity magnitudes (0.02, 0.15, 0.25 and 0.35m/s) represent positive η-velocities along the valve-shaft towards the inlet port. The recirculating mass-flow is extending upstream and entering the valve-seat, leading to a reduction of the effective cross-sectional area of the inlet-channel. Note that, for a clearer illustration, the recirculating mass flows occurring below the bottom of the valve surface are blanked in the figure.
Fig. 9: η-velocity iso-surfaces representing recirculating mass flow (η-velocity > 0 m/s) during intake stroke inside the cylinder-chamber and valve-gap. Four iso-surfaces of η-velocity magnitudes 0.02, 0.15, 0.25 and 0.35m/s visualized.
5. Conclusions The volumetric MRV measurements have proven to be valid data-sets that contain valuable
17th International Symposium on Applications of Laser Techniques to Fluid Mechanics Lisbon, Portugal, 07-10 July, 2014
- 13 -
information about the 3D flow especially in the inlet-channel and in the vicinity of the intake-valves within a DISI-engine during induction. The presented fully volumetric MRV-data was conducted inside a steady-state flow MRV-model with a fixed valve-lift of 9.21mm, corresponding to a CA-position of 270° bTDC. In an upcoming measurement campaign, the volumetric flow during the induction-flow with moving intake-valves will be measured. Since MRV cannot provide snapshots of an unsteady flow, it is required that the time dependence of a flow is of periodic nature, to be captured by a phase averaging 4D MRV-measurement approach. Using this phase-averaging, time-resolving MR-sequence will allow the investigation of a large part of the flow dynamics during intake-stroke of a 4-stroke DISI-engine. The experimental setup described in Section 2.4 of this manuscript was designed such, that it allows a reproductive opening and closing of the intake valves. To achieve this, the valves of the MRV-model need to be moved by an actuator during the measurements inside the MR-scanner. Due to the particular environment in MR-scanners, an MR-compatible actuator must not contain any metal parts. Electric current near or inside the MR-scanner is disturbing the MRV measurements causing the appearance of flow-artifacts. We developed an MR-compatible hydraulic actuator-system made from all plastic-material, which is currently in the process of final testing. These measurements promise new insights into the complex nature of the transient behavior of IC engine induction. In particular the evolution of the phase-averaged time-resolved flow around the intake valves as well as its distribution around the valve-circumference is of great interest. The results will lead to a better understanding of the development of the flow topology within the cylinder chamber, inside the inlet-channel and, in particular in the vicinity of the intake-valves. 6. References - Baum E, Peterson B, Böhm B, Dreizler A (2014) On the validation of LES applied to internal
combustion engine flows: part 1: comprehensive experimental database. Flow, Turbulence and Combustion 92:269-299
- Baum E, Peterson B, Surmann C, Michaelis D, Böhm B, Dreizler A (2013) Investigation of the 3D flow field in an IC engine using tomographic PIV. Proceedings of the Combustion Institute 34(2):2903–2910
- Bicen AF, Vafidis C, Whitelaw JH (1985) Steady and unsteady airflow through the intake valve of a reciprocating engine. Journal of Fluids Engineering 107(3):413–420
- Boesiger P, Maler S, Kecheng Lea (1992) Visualization and quantification of the human blood flow by magnetic resonance imaging. Journal of Biomechanics 25(1):55–67
- Chen A, Lee KC, Yianneskis M (1995) Velocity characteristics of steady flow through a straight generic inlet port. Journal Numerical Methods in Fluids 21(7):571–590
- Cheung RSW, Nadarajah S, Tindal MJ, Yianneskis M (1990) An experimental study of velocity and Reynolds stress distributions in a production engine inlet port under steady flow conditions. SAE Technical Paper 900058
- Dittmeyer R, Tropea C (1990) LDA Measurements of Diesel Engine Inlet Flows in a Stationary Flow Rig. In: Fifth International Symposium on Applications of LDA to Fluid Mechanics, Lisbon, Portugal
- El Tahry SH, Khalighi B, Kuziak WR (1987) Unsteady-flow velocity measurements around an intake valve of a reciprocating engine. SAE Technical Paper 870593
- Elkins CJ, Alley MT (2007) Magnetic resonance velocimetry: applications of magnetic resonance imaging in the measurement of fluid motion. Experiments in Fluids 43(6):823–858
- Elkins CJ, Markl M, Iyengar A, Wicker R, Eaton JK (2004) Full-field velocity and temperature measurements using magnetic resonance imaging in turbulent complex internal flows. International Journal of Heat and Fluid Flow 25(5):702–710
- Fajardo C, Sick V (2009) Kinetic energy and dissipation rate spectra of high- and low- swirl internal combustion engine flows. SAE Technical Paper 01-0651
- Freudenhammer D, Baum E, Peterson B, Böhm B, Jung B, Grundmann S (2014) Volumetric intake flow measurements of an IC engine using Magnetic Resonance Velocimetry. Experiments in Fluids 55(5):1724
17th International Symposium on Applications of Laser Techniques to Fluid Mechanics Lisbon, Portugal, 07-10 July, 2014
- 14 -
- Fukutani I,Watanabe E (1982) Air Flow through Poppet Inlet Valves - Analysis of Static and Dynamic Flow Coefficients. SAE Technical Paper 820154
- Grundmann S, Wassermann F, Lorenz R, Jung B, Tropea C (2012) Experimental Investigation of Helical Structures in Swirling Flows. International Journal for Heat and Fluid Flow 37(1):51–63
- Haacke M, Brown R, Thompson M, Venkatesan R (1999) Magnetic Resonance Imaging. Wiley-Liss, New York
- Heywood JB (1988) Internal combustion engine fundamentals. McGraw-Hill, New York - Hill PG, Zhang D (1994) The effects of swirl and tumble on combustion in spark-ignition
engines. Progress in Energy and Combustion Science 20(5):373–429 - Khalighi B, El Tahry SH, Kuziak WR (1986) Measured steady flow velocity distributions around
a valve/seat annulus. SAE Technical Paper 860462 - Mahmood Z, Chen A, Yianneskis M, Ganti G (1996) On the structure of steady flow through
dual-intake engine ports. Journal Numerical Methods in Fluids 23(10):1085–1109 - Nadarajah S, Balabani S, Tindal MJ, Yianneskis M (1998) The turbulence structure of the annular
non-swirling flow past an axisymmetric poppet valve. Proceedings of the Institution of Mechanical Engineers 212(6):455–471
- O’Donnell M (1985) NMR blood flow imaging using multiecho, phase contrast sequences. Medical Physics 12:59–64
- Pajkovi´c VR, Petrovi´c SV (2008) Spatial flow velocity distribution around an inlet port/valve annulus. Thermal Science 12(1):73–83
- Tabaczynski RJ (1976) Turbulence and turbulent combustion in spark-ignition engines. Progress in Energy and Combustion Science 2(3):143–165
- Tindal MJ, Cheung RSW, Yianneskis M (1988) Velocity characteristics of steady flows through engine inlet ports and cylinders. SAE Technical Paper 880383
- Wassermann F, Hecker D, Jung B, Markl M, Seifer A, Grundmann S (2012) Phase-Locked 3D3C Measurements in a Bistable Fluidic Oscillator Experiments in Fluids 54(3):1– 15
- Westerweel J (1994) Efficient detection of spurious vectors in particle image velocimetry data. Experiments in Fluids 16(3-4):236–247