32
Shaping Health Care Strategy in a Post-Reform Environment 2011 16th Annual Towers Watson /National Business Group on Health Employer Survey on Purchasing Value in Health Care United States
8/7/2019 TowersWatson-Shaping Health Care Strategy in a Post-Reform Environment
http://slidepdf.com/reader/full/towerswatson-shaping-health-care-strategy-in-a-post-reform-environment 1/32
Shaping Health Care Strategy
in a Post-Reform Environment
2011
16th Annual Towers Watson/National Business Group on Health
Employer Survey on Purchasing Value in Health Care
United States

8/7/2019 TowersWatson-Shaping Health Care Strategy in a Post-Reform Environment
http://slidepdf.com/reader/full/towerswatson-shaping-health-care-strategy-in-a-post-reform-environment 2/32
2 towerswatson.com
8/7/2019 TowersWatson-Shaping Health Care Strategy in a Post-Reform Environment
http://slidepdf.com/reader/full/towerswatson-shaping-health-care-strategy-in-a-post-reform-environment 3/32
2011 Employer Survey on Purchasing Value in Health Care Report | Towers Watson/National Business Group on Hea
2011
Employer Survey on Purchasing Value in Health Care
Table of Contents
Key Findings 2
Costs Continue to Outpace Infl ation 4
High Perormers Reap Rewards 6
Consistent Perormers Drive Long-Term Results 6
Bigger Changes on the Horizon 8
Decline in Employer Conf dence 10
Top Employer Challenges 11
Managing Health Care for Results 14
ABHPs: Gaining Momentum? 16
Road Map for Success — Strategies for Building
a Healthy, Productive Workforce 20
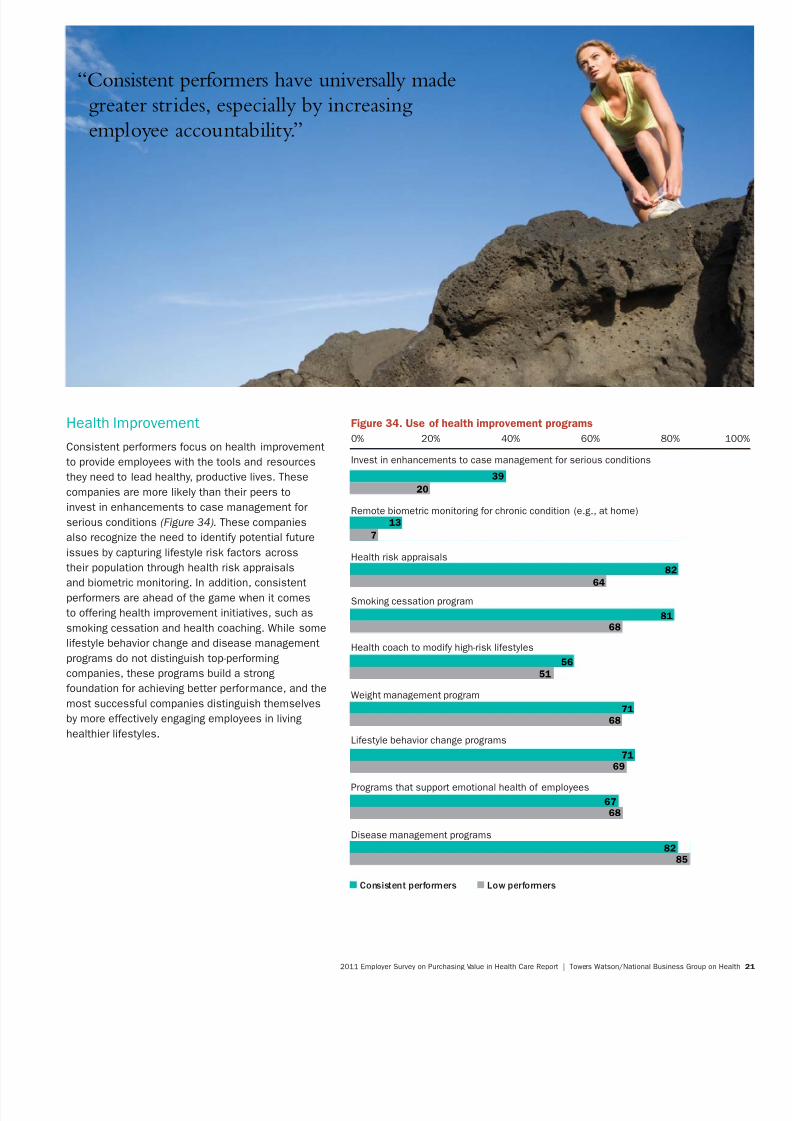
Health Improvement 21
Engagement 22
Accountability 23
Linking Provider Strategies 24
Technology 25
Healthy Environment 25
Measurement and Improvement 26
Conclusion 27
Featured Figures
Figure 4. Health care cost increases have reached
a plateau 4
Figure 7. Total employee/employer health care costs 5
Figure 10. Median trends or high, average
and low perormers 6
Figure 15. Changes due to health care reorm 8
Figure 17. Top health care strategies or 2012 10
Figure 19. Top challenges employers ace
to maintain aordable benef t coverage 11
Figure 27. Take-up in ABHPs stabilizes — or now 16
United States

8/7/2019 TowersWatson-Shaping Health Care Strategy in a Post-Reform Environment
http://slidepdf.com/reader/full/towerswatson-shaping-health-care-strategy-in-a-post-reform-environment 4/32
2 towerswatson.com
Taking bold actions to manage costs and offer
affordable careIn 2011, total health care costs per active employee,
on average, are expected to reach $11,176, up
rom $10,387 in 2010 (Figure 7, page 5). In act,
employers pay 36% more or health care, and
employees contribute over 45% more than they did
f ve years ago. To mitigate costs, employers are
redef ning their f nancial commitments to health
benef ts by redesigning programs to incorporate
enhanced point-o-care consumerism, positioning
incentives more aggressively and redef ning the
employee versus dependent subsidy. Further, coming
changes in the pre-65 and Medicare marketplace
are ueling some employers to reconsider theircommitment to retiree medical sponsorship.
Engaging all stakeholders in costs and care
Health care reorm is providing employers witha catalyst to urther engage all health plan
stakeholders to hold the line on costs and ocus
on quality o care. For example, employers are
designing creative engagement approaches, applying
new ideas, such as behavioral economics, and
leveraging social media to communicate critical
messages.
Setting their sights on bigger changes ahead
While organizations have responded to the initial
wave o mandates and regulatory changes under the
new health care reorm law, employers expect even
bigger changes in the not-too-distant uture with theopening o the insurance exchanges in 2014 and a
potential excise tax, which takes eect in 2018
(Figure 16, page 9). Rather than rely on incrementalism,
employers are considering signif cant changes in
their health care strategy to stave o the excise tax.
Executive Summary
Landmark health care reorm legislation, coupled with an uncertain
economy, is sharpening employers’ ocus on new strategies and
tactics to mitigate costs and improve worker health and productivity,
according to the f ndings o the 16th Annual Towers Watson/National
Business Group on Health Employer Survey on Purchasing Value in
Health Care. Many employers are taking bold actions, and imple-
menting new health benef t program changes to drive employee and
provider accountability. What’s more, some employers are viewing
the coming years as a unique opportunity to reshape their total
rewards portolio and make critical changes to their employee
value proposition.
To help us assess emerging trends in employer-sponsored health
care programs, nearly 600 survey participants provided detailed
inormation about their health care programs, their strategies and
practices, and the results o their eorts to manage health benef t
costs and improve employee health.
Key Findings

8/7/2019 TowersWatson-Shaping Health Care Strategy in a Post-Reform Environment
http://slidepdf.com/reader/full/towerswatson-shaping-health-care-strategy-in-a-post-reform-environment 5/32
2011 Employer Survey on Purchasing Value in Health Care Report | Towers Watson/National Business Group on Hea
Improving workforce health
Employers remain strongly committed to improving
the health o their workorce. Along these lines,
many employers are expanding the use o employee
incentives to participate in liestyle coaching,
complete biometric screenings and take advantageo other measures (Figure 25, page 15 and Figure 26,
page 16). Employers are also encouraging vendors to
coordinate care, implement evidence-based treatments
and use emerging technologies aimed at improving
quality and ef ciency (Figure 24, page 15).
Linking benefi ts, health and productivity
Taking a page rom consistent perormers’*
playbook, more employers are monitoring their
health plans and programs, and measuring
results. These employers are assessing program
perormance, pinpointing areas that need
improvement and targeting uture investments
(Figure 33, page 20).
What’s Next?
Health care reorm provides employers with an
unparalleled opportunity to reassess their health
care strategy and consider where health benef ts f t
within their total rewards package and their overall
business strategy. Those organizations that are
thoughtul and nimble in assessing the post-health
care reorm landscape will position themselves to
prof t rom the myriad larger opportunities that lie
ahead.
Our survey report oers a detailed look at the
changing dynamics in health care benef ts and
workorce health.
About the Survey
The 16th Annual Towers Watson/National Business Group on Health
Employer Survey on Purchasing Value in Health Care tracks employers’
strategies and practices, and the results o their eorts to provide and
manage health benef ts or their workorce. This report identif es the
actions o high-perorming companies, as well as current trends in the
health care benef t programs o U.S. employers with at least 1,000
employees (Figure 1). Respondents were also asked about specif c
implications or their health care benef t programs attributed to thehealth care reorm Patient Protection and Aordable Care Act (PPACA).
The survey was completed by 588 employers, between November 2010
and January 2011, and re ects respondents’ 2010 and 2011 health
program decisions and strategies and, in some cases, their 2012 plans.
Respondents collectively employ 9.2 million ull-time employees, have
7.8 million employees enrolled in their health care programs and operate
in all major industry sectors (Figures 2 and 3). In 2010, respondents
spent, on average, $10,387 per employee on health care, which equates
to a collective $81 billion in total health care expenditures.
5% Energy and Utilities
15% Financial Services
10% General Services
15% Health Care
11% IT and Telecom
29% Manuacturing
3% Public Sector and Education
11% Wholesale and Retail
5%
11%
10%
29%
11%15%
15%
3%
Figure 3. Industry groups
25% National
20% Northeast
15% South
26% Midwest
14% West
25%
14%
15%
26%
20%
Figure 2. Region where the majority of benefit-eligible workforce is locate
16% 1,000 to 2,499
22% 2,500 to 4,999
20% 5,000 to 9,999
24% 10,000 to 24,999
18% 25,000+
16%18%
20%
24%
22%
Figure 1. Number of full-time workers employed by respondents
*A company had to complete this year’s survey and the 2009 and/
or the 2010 Towers Watson/National Business Group on Health
survey to be eligible to be a consistent perormer. The number o
consistent perormers is based on 225 eligible companies, which
translates to 22% o companies reporting an annual trend at or
below the all-company median or each year rom 2007 to 2010.
8/7/2019 TowersWatson-Shaping Health Care Strategy in a Post-Reform Environment
http://slidepdf.com/reader/full/towerswatson-shaping-health-care-strategy-in-a-post-reform-environment 6/32
4 towerswatson.com
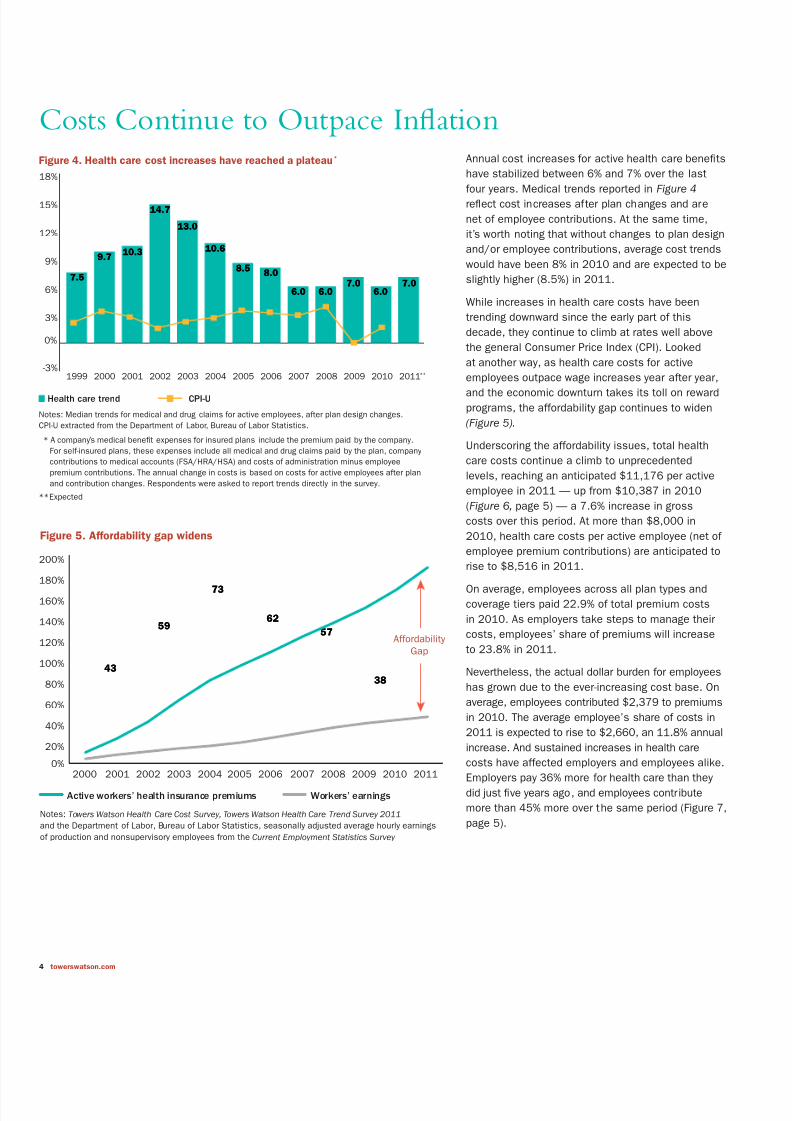
Annual cost increases or active health care benef ts
have stabilized between 6% and 7% over the last
our years. Medical trends reported in Figure 4re ect cost increases ater plan changes and are
net o employee contributions. At the same time,
it’s worth noting that without changes to plan design
and/or employee contributions, average cost trends
would have been 8% in 2010 and are expected to be
slightly higher (8.5%) in 2011.
While increases in health care costs have been
trending downward since the early part o this
decade, they continue to climb at rates well above
the general Consumer Price Index (CPI). Looked
at another way, as health care costs or active
employees outpace wage increases year ater year,
and the economic downturn takes its toll on reward
programs, the aordability gap continues to widen
(Figure 5).
Underscoring the aordability issues, total health
care costs continue a climb to unprecedented
levels, reaching an anticipated $11,176 per active
employee in 2011 — up rom $10,387 in 2010
(Figure 6, page 5) — a 7.6% increase in gross
costs over this period. At more than $8,000 in
2010, health care costs per active employee (net o
employee premium contributions) are anticipated to
rise to $8,516 in 2011.
On average, employees across all plan types and
coverage tiers paid 22.9% o total premium costs
in 2010. As employers take steps to manage their
costs, employees’ share o premiums will increase
to 23.8% in 2011.
Nevertheless, the actual dollar burden or employees
has grown due to the ever-increasing cost base. On
average, employees contributed $2,379 to premiums
in 2010. The average employee’s share o costs in
2011 is expected to rise to $2,660, an 11.8% annual
increase. And sustained increases in health care
costs have aected employers and employees alike.Employers pay 36% more or health care than they
did just f ve years ago, and employees contribute
more than 45% more over the same period (Figure 7,
page 5).
Costs Continue to Outpace Infl ationFigure 4. Health care cost increases have reached a plateau*
-3%
0%
3%
6%
9%
12%
15%
18%
1999 2000 2001 2002 2003 2004 2005 2006 2007 2008 2009 2010 2011**
7.57.5
9.79.710.310.3
14.714.7
13.013.0
10.610.6
8.58.58.08.0
6.06.0 6.06.07.07.0
6.06.07.07.0
Notes: Median trends or medical and drug claims or active employees, ater plan design changes.
CPI-U extracted rom the Department o Labor, Bureau o Labor Statistics.
* A company’s medical beneft expenses or insured plans include the premium paid by the company.
For sel-insured plans, these expenses include all medical and drug claims paid by the plan, company
contributions to medical accounts (FSA/HRA/HSA) and costs o administration minus employee
premium contributions. The annual change in costs is based on costs or active employees ater plan
and contribution changes. Respondents were asked to report trends directly in the survey.
** Expected
Health care trend CPI-U
Figure 5. Affordability gap widens
2000 2001 2002 2003 2004 2005 2006 2007 2008 2009 2010 2011
4343
5959
7373
6262
5757
3838
Notes: Towers Watson Health Care Cost Survey, Towers Watson Health Care Trend Survey 2011
and the Department o Labor, Bureau o Labor Statistics, seasonally adjusted average hourly earnings
o production and nonsupervisory employees rom the Current Employment Statistics Survey
0%
20%
40%
60%
80%
100%
120%
140%
160%
180%
200%
Active workers’ health insurance premiums Workers’ earnings
AordabilityGap

8/7/2019 TowersWatson-Shaping Health Care Strategy in a Post-Reform Environment
http://slidepdf.com/reader/full/towerswatson-shaping-health-care-strategy-in-a-post-reform-environment 7/32
2011 Employer Survey on Purchasing Value in Health Care Report | Towers Watson/National Business Group on Hea
Companies anticipate that employees’ out-o-pocket
expenses (other than premium contributions) will
represent 16% o total allowed charges in 2011,
compared with 17% in 2010 and 18% in 2009. This
slight decline in out-o-pocket costs is unexpected.
However, as we discuss later on, this f nding couldre ect employers’ reluctance to make more
signif cant plan design changes in the current
economic environment and given the uncertainty
around health care reorm.
Premium equivalent rates are based on the costs o
plans and can be used to compare the relative costs
o dierent plan types. Today, preerred provider
organization (PPO) and point o service (POS) are the
most expensive plan types. These plans cost the
average employee almost $200 more than a typical
health maintenance organization (HMO) plan or
single-only coverage and more than $750 more or
amily coverage (Figure 8). This could re ect the act
that since ewer companies oer HMO-type plans,
the HMO plans that are still in place have lower
costs.* The cost o ABHP coverage is considerably
more aordable than either PPO/POS plan or
HMO plan coverage in 2011. ABHP employee-only
coverage is about $900 lower than coverage in
other plan types. ABHP rates or amily coverage
are $2,885 below median PPO/POS plan costs and
$2,118 lower than average HMO plan costs.
Retirees, who pay a considerably larger share o
coverage costs, ace even greater aordability
issues. Retirees not yet eligible or Medicare paynearly $4,100 per year or single-only coverage and
$10,200 per year or amily coverage. As a result
o these costs, absent some other orm o subsidy,
some employees may f nd it dif cult to retire and
secure aordable coverage (Figure 9). On another
ront, Medicare benef ts help cover some o the
costs or retirees age 65 and over. Medicare-eligible
retirees pay more than $2,000 or single-only
coverage and $5,200 or amily coverage.
Figure 6. Annual health care costs
Total PEPY Costs Net PEPY Costs
Percentile 2010 2011* 2010 2011*
Mean $10,387 $11,176 $8,008 $8,516
10th $6,656 $6,943 $5,160 $5,42425th $8,167 $8,725 $6,618 $6,998
50th $9,990 $10,531 $7,992 $8,425
75th $11,714 $12,268 $9,371 $9,990
90th $12,150 $13,036 $10,800 $11,435
Note: Costs include medical and drug claims or active employees. Total per-employee per-year (PEPY) costs (or groscosts) include both employer and employee shares. Net PEPY costs are less employee contributions.
*Expected
Figure 8. Annual premiums for employee-only and family coverage for 2011
Employee-Only Family
PPO and POS plans $5,532 $16,361
HMO plans $5,333 $15,594
ABHPs (including account contributions) $4,603 $13,476
Note: Data show medians, including the 2% administration ee.
Figure 9. Annual premiums for retiree-only and family coverage for 2011
Annual Total Premiums Retiree Premium Sh
Retiree-Only Family Retiree-Only Family
Retirees under age 65 $8,031 $19,275 51% 53%
Retirees age 65 and older $4,507 $11,000 46% 48%
$6,245 Employer paid
$1,834 Employee paid
$8,516 Employer paid
$2,660 Employee paid
77%$6,245
23%$1,834
24%$2,660
76%$8,516
Figure 7. Total employee/employer health care costs
2006 Total Cost = $8,079 2011 Total Cost = $11,176
*Forty-eight percent o companies oer an HMO plan in 2011, compared with 93% that oer a PPO/POS plan.

8/7/2019 TowersWatson-Shaping Health Care Strategy in a Post-Reform Environment
http://slidepdf.com/reader/full/towerswatson-shaping-health-care-strategy-in-a-post-reform-environment 8/32
6 towerswatson.com
High Perormers Reap Rewards
Consistent with our f ndings over several years,
organizations show dramatic variation in their ability
to reduce health care cost trends. While the median
two-year trend (or 2009 and expected or 2010) or
all organizations is 6%, high-perorming companies
have signif cantly lower cost trends (Figure 10). High-
perorming companies — those with a median two-year
average cost increase in the lowest quartile among
all respondents — have a median 1% cost trend. On
the other hand, low-perorming companies — those
in the highest quartile — have a 10% cost trend.
Consistent PerormersDrive Long-Term Results
Some organizations have been successul in
maintaining health care cost trends at or below the
norm or each o the last our years. As a group,we reer to these organizations as “consistent
perormers.” The ability to keep cost increases low
over an extended period o time distinguishes these
companies rom other organizations, including high-
perorming companies.
Our research identif ed 50 companies that qualiy
as consistent perormers.* While consistent
perormers were required only to maintain trends at
or below the median rom 2007 through 2010, they
report average trends signif cantly below the median
cost trend or each o the last our years (Figure 11).
In act, the median trend across the last our yearswas 6.3% versus 1.8% or consistent perormers.
Figure 10. Median trends for high, average and low performers
2003/04 2004/05 2005/06 2006/07 2007/08 2008/09 2009/10
4343
5959
7373
6262
5757
3838
Note: Two-year average trends or medical and drug claims or active employees, net o employee
premium contributions
0%
2%
4%
6%
8%
10%
12%
14%
16%
High perormers Low perormersAverage perormers
5.0
10.0
15.0
3.0
8.0
11.5
2.5
8.0
11.0
1.0
6.2
10.0
.5
5.8
10.5
.3
6.5
10.5
1.0
6.0
10.0
Two-year average trend
Calendar Years
*A company had to complete this year’s survey and the 2009 and/or 2010 Towers Watson/National Business Group on Health survey to be
eligible to be a consistent perormer. The number o consistent perormers is based on 225 eligible companies, which translates to 22% o
companies reporting an annual trend at or below the all-company median or each year rom 2007 to 2010.
Figure 11. Consistent performers vs. median annual cost trends, 2007 – 2010
0%
2%
4%
6%
8%
2007 2008 2009 2010
6.06.0 6.06.0
2.62.6
1.11.11.41.4
7.07.0
6.06.0
2.12.1
Median o all companies Consistent perormers
Note: Median trends or medical and drug claims or active employees, net o employee
premium contributions
Calendar Years

8/7/2019 TowersWatson-Shaping Health Care Strategy in a Post-Reform Environment
http://slidepdf.com/reader/full/towerswatson-shaping-health-care-strategy-in-a-post-reform-environment 9/32
2011 Employer Survey on Purchasing Value in Health Care Report | Towers Watson/National Business Group on Hea
In terms o cost management, both consistent and
high perormers are noticeably ahead. In 2010,
the cost dierence between consistent perormers
and low perormers was more than $2,000 per
employee. The cost dierence between high
perormers and low perormers was $1,745 peremployee (Figure 12). For a consistent perormer
with 10,000 employees, this adds up to a $20
million cost advantage over a low-perorming
competitor. Consistent perormers’ aordability
proposition or employees is also superior to low
perormers’. Notably, employees at consistent-
perorming companies pay 20% less than their
counterparts at low-perorming companies. Apart
rom the obvious advantages o paying lowercosts, aordable health care is key to providing a
competitive reward package, and to attracting and
retaining top talent.*
*See 2010 Employee Perspectives on Health Care, 2010 Global Workforce Study and 2010 Global Talent Management and Rewards Study.
Figure 12. Annual costs and increases by performance group
Performance Groups Difference
ConsistentPerformers
HighPerformers
LowPerformers
Consistentvs. Low
Highvs. Low
Total PEPY costs, 2010 $9,016 $9,302 $11,047 -$2,031 -$1,745
PEPY costs, net contributions, 2010 $7,042 $7,392 $8,576 -$1,534 -$1,184
Employee contributions, 2010 $1,974 $1,910 $2,471 -$497 -$561
Employee share o contributions, 2010 21.9 20.5 22.4 -0.5 -1.8
Two-year average cost trend 2.6 1.0 10.0 -7.4 -9.0
2010 cost trend, net contributions 2.1 0.0 10.0 -7.9 -10.0
2010 cost trend, beore changes 4.8 4.5 10.0 -5.2 -5.5
“Consistent performers report average trends
signifi cantly below the median cost trend
for each of the last four years.”
8/7/2019 TowersWatson-Shaping Health Care Strategy in a Post-Reform Environment
http://slidepdf.com/reader/full/towerswatson-shaping-health-care-strategy-in-a-post-reform-environment 10/32
8 towerswatson.com
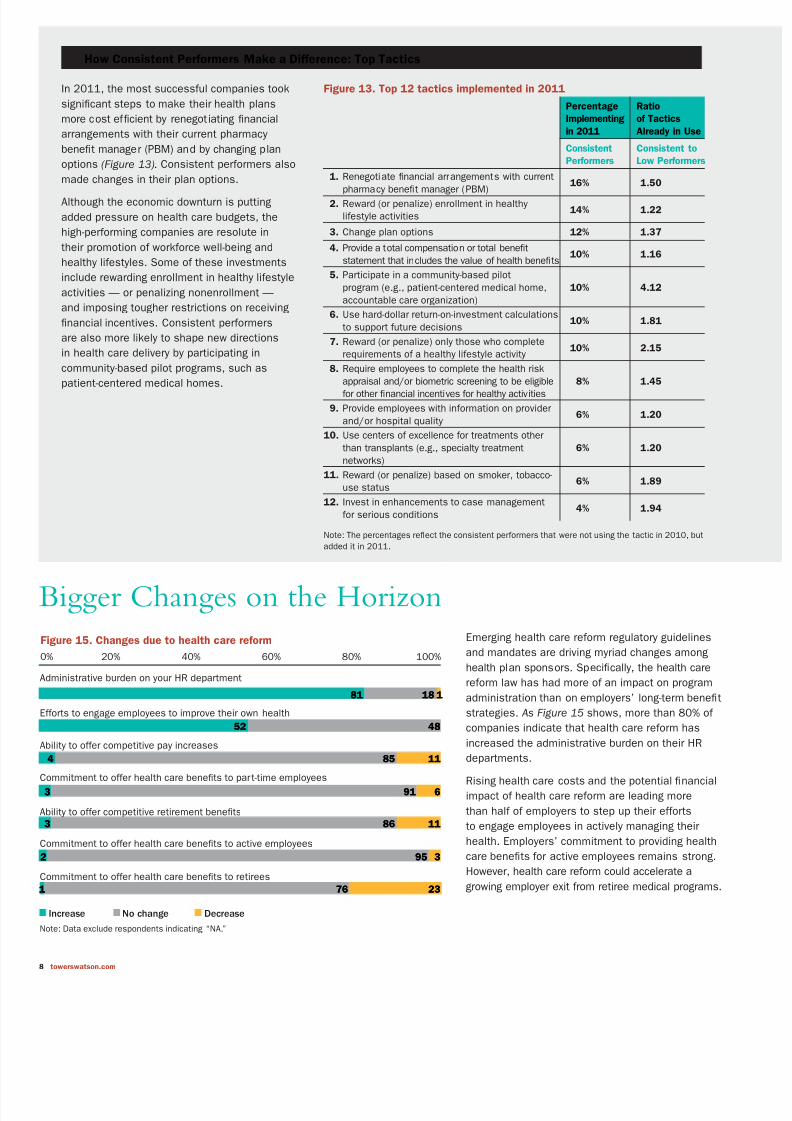
How Consistent Performers Make a Difference: Top Tactics
Emerging health care reorm regulatory guidelines
and mandates are driving myriad changes among
health plan sponsors. Specif cally, the health care
reorm law has had more o an impact on program
administration than on employers’ long-term benef t
strategies. As Figure 15 shows, more than 80% o
companies indicate that health care reorm has
increased the administrative burden on their HR
departments.
Rising health care costs and the potential f nancial
impact o health care reorm are leading more
than hal o employers to step up their eorts
to engage employees in actively managing their
health. Employers’ commitment to providing health
care benef ts or active employees remains strong.
However, health care reorm could accelerate a
growing employer exit rom retiree medical programs.
Figure 13. Top 12 tactics implemented in 2011
Percentage
Implementing
in 2011
Ratio
of Tactics
Already in Use
Consistent
Performers
Consistent to
Low Performers
1. Renegotiate f nancial arrangements with current
pharmacy benef t manager (PBM)
16% 1.50
2. Reward (or penalize) enrollment in healthy
liestyle activities14% 1.22
3. Change plan options 12% 1.37
4. Provide a total compensation or total benef t
statement that includes the value o health benef ts10% 1.16
5. Participate in a community-based pilot
program (e.g., patient-centered medical home,
accountable care organization)
10% 4.12
6. Use hard-dollar return-on-investment calculations
to support uture decisions10% 1.81
7. Reward (or penalize) only those who complete
requirements o a healthy liestyle activity10% 2.15
8. Require employees to complete the health risk
appraisal and/or biometric screening to be eligibleor other f nancial incentives or healthy activities
8% 1.45
9. Provide employees with inormation on provider
and/or hospital quality6% 1.20
10. Use centers o excellence or treatments other
than transplants (e.g., specialty treatment
networks)
6% 1.20
11. Reward (or penalize) based on smoker, tobacco-
use status6% 1.89
12. Invest in enhancements to case management
or serious conditions4% 1.94
Note: The percentages re ect the consistent perormers that were not using the tactic in 2010, but
added it in 2011.
In 2011, the most successul companies took
signif cant steps to make their health plans
more cost ef cient by renegotiating f nancial
arrangements with their current pharmacy
benef t manager (PBM) and by changing plan
options (Figure 13). Consistent perormers also
made changes in their plan options.
Although the economic downturn is putting
added pressure on health care budgets, the
high-perorming companies are resolute in
their promotion o workorce well-being and
healthy liestyles. Some o these investments
include rewarding enrollment in healthy liestyle
activities — or penalizing nonenrollment —
and imposing tougher restrictions on receiving
f nancial incentives. Consistent perormers
are also more likely to shape new directions
in health care delivery by participating in
community-based pilot programs, such as
patient-centered medical homes.
Bigger Changes on the Horizon
Figure 15. Changes due to health care reform
0% 20% 40% 60% 80% 100%
Commitment to oer health care benefts to retirees
Commitment to oer health care benefts to active employees
Ability to oer competitive retirement benefts
Commitment to oer health care benefts to part-time employees
Ability to oer competitive pay increases
Eorts to engage employees to improve their own health
Administrative burden on your HR department
8181 1818 11
5252 4848
44 8585 1111
33 9191 66
33 8686 1111
22 9595 33
11 7676 2323
Increase No change Decrease
Note: Data exclude respondents indicating “NA.”

8/7/2019 TowersWatson-Shaping Health Care Strategy in a Post-Reform Environment
http://slidepdf.com/reader/full/towerswatson-shaping-health-care-strategy-in-a-post-reform-environment 11/32
2011 Employer Survey on Purchasing Value in Health Care Report | Towers Watson/National Business Group on Hea
Although organizations have responded to the initial
wave o mandates and regulatory changes under
the new law, employers expect even bigger changes
ahead. Nearly three-quarters o respondents expect
the opening o the insurance exchanges in 2014
to have an impact on their active medical plans
(Figure 16). Employers are turning their attention
to the excise tax, which takes eect in 2018, as
a key driver o change in their health care strategy
or active employees. In act, 80% o respondents
expect the excise tax to have at least some impact,
and nearly a quarter o respondents believe it will
have an extensive impact on their active medicalprograms, i no subsequent changes are made to
their plan designs. As noted later on, this may lead
to an acceleration in ABHPs* as companies take
more aggressive actions to encourage healthier
liestyles.
How Consistent Performers Make a Difference: Top Tactics (cont.)
Figure 14. Top 12 tactics planned for 2012
Percentage
Planning
for 2012
Ratio
of Tactics
Already in Use
Consistent
Performers
Consistent
to Low Performers
1. Dierentiate cost sharing or use o high-
perormance networks or centers o excellence
27% 1.47
2. Reward (or penalize) based on biometric out-comes other than smoker, tobacco-use status
24% 2.04
3. Change plan options 22% 1.37
4. Use value-based benef t designs 22% 2.00
5. Reward (or penalize) based on smoker,tobacco-use status
22% 1.89
6. Audit o medical claim payments 21% 1.36
7. Provide employees with inormation onprovider and/or hospital quality
20% 1.20
8. Use centers o excellence or treatments otherthan transplants
16% 1.20
9. Reward (or penalize) only those who completerequirements o a healthy liestyle activity
16% 2.15
10. Require employees to complete the health riskappraisal and/or biometric screening to beeligible or other f nancial incentives orhealthy activities
16% 1.45
11. Reward (or penalize) enrollment in healthyliestyle activities
14% 1.22
12. Use hard-dollar return-on-investment calculationsto support uture decisions
12% 1.81
Note: The percentages re ect the consistent perormers that were not using the tactic in 2010 or
2011, but plan to add it in 2012.
Looking ahead, improving the quality and
coordination o care within their health plans is
a top objective or consistent perormers. For
example, 27% plan to dierentiate cost sharing
or using high-perormance networks; 20%
plan to provide employees with inormation on
provider quality, and 16% plan to expand their
use o centers o excellence beyond transplants(Figure 14). This could signal that consistent
perormers are becoming increasingly receptive
to narrow networks.
As shown in Figure 14, there are many specif c
actors that contribute to superior results o
the consistent perormers. And there is a lot
to learn rom these companies by looking at
what they have been doing and where they are
headed. In the section “Road Map or Success:
Strategies or Building a Healthy, Productive
Workorce,” we show that the most successul
companies use a combination o tactics inseven main areas to hold the line on cost
increases while engaging employees to improve
their health habits.
*We def ne an account-based health plan (ABHP) as a plan with
a deductible oered together with a personal account (i.e.,
health savings account or health reimbursement arrangement)
that can be used to pay a portion o the medical expense not
paid by the plan. ABHPs typically include decision support
tools that help consumers better manage their health, health
care and medical spending.
Figure 16. Anticipated impact of health care reform on active and retiree
medical plans
0% 20% 40% 60% 80% 1
Closing the Medicare Part D prescription drug benefit gap (i.e., donut hole)
Retirees
Ending of the tax advantages of the Medicare Part D subsidy in 2013
Retirees
Retirees
Implementation of excise tax in 2018
Actives
Retirees
Retirees
Opening of insurance exchanges in 2014
Actives
88 6262
2727 5151
2424 5757
2020 4646
2222 4040
1616 5050
Extensively Somewhat Not at all
Note: Responses to retiree programs based on companies that oer a retiree program today

8/7/2019 TowersWatson-Shaping Health Care Strategy in a Post-Reform Environment
http://slidepdf.com/reader/full/towerswatson-shaping-health-care-strategy-in-a-post-reform-environment 12/32
10 towerswatson.com
Turning toward 2012, a top strategy or employers
is keeping abreast o and complying with the health
care reorm law (Figure 17). At the same time, morethan a third o organizations say health care strategy
will be one o their top three ocus areas in 2012,
most likely due to the persistent challenges with
rising health care costs and also in anticipation o
the exchanges and the excise tax. While the excise
tax may be a number o years away, Towers Watson
research has shown that 60% o companies will
reach the status o a “rich” plan by 2018 (i.e.,
plans that cost a total o more than $10,200 or
single coverage and more than $27,500 or amily
coverage in 2018). Those companies that take more
strategic actions now will likely have a leg up on
other organizations when it comes to managing healthcare reorm mandates and controlling uture costs.
Organizations will also continue to ocus on actions
that encourage healthier employee liestyles and
behaviors. As health care aordability continues
to erode and health care benef ts become a larger
share o employee compensation, nearly a quarter o
employers will review their health benef t programs as
part o their total rewards strategy over the next year.
Decline in Employer Conf dence
Employers’ increasing rustration with plan peror-
mance, a lack o employee engagement in programs
designed to encourage healthy behaviors and medical
vendor services are key themes that emerged in both
last year’s and this year’s report.
On another ront, f nancial challenges and an aura o
uncertainty surrounding the health care reorm law
are contributing to a decline in employer conf dence
in the uture o their health benef t programs.
Figure 17. Top health care strategies for 2012
0% 10% 20% 30% 40% 50% 60%
ncent employees to use higher-quality providers o care
Maintain grandathered status
Prepare or opening o insurance exchanges
Review competitors’ actions
Expand enrollment in account-based health plans
Make long-term changes to avoid excise tax ceiling
Revise health care strategy or retirees (including potential exit)
ncrease emphasis on eective condition management
Review health care benefts as part o total rewards strategy
Revise health care strategy or active employees
Adopt/expand the use o fnancial incentives to encourage healthy behaviors
Develop/expand healthy liestyle activities
Stay up to date and comply with the PPACA
5454
3939
3636
3535
2323
2020
1919
1919
1717
1010
99
88
77
Note: Companies were asked to identiy their top three ocus areas.
“Organizations will continue to focus on actions that
encourage healthier employee lifestyles and behaviors.”

8/7/2019 TowersWatson-Shaping Health Care Strategy in a Post-Reform Environment
http://slidepdf.com/reader/full/towerswatson-shaping-health-care-strategy-in-a-post-reform-environment 13/32
2011 Employer Survey on Purchasing Value in Health Care Report | Towers Watson/National Business Group on Healt
For nearly a decade, Towers Watson has been tracking
employers’ conf dence that health care benef ts or
active employees will be oered in 10 years’ time.
Historically, employer conf dence levels have trended
in the opposite direction o health care cost increases.
In other words, conf dence is typically high whenhealth care trends are low and vice versa. But despite
health care cost increases that have hovered between
6% and 7% over the last hal decade, employer
conf dence (38%) is at its lowest point since we began
tracking these data (Figure 18). In act, conf dence is
below levels reported in 2003 when health care cost
trends were upwards o 13%. Yet conf dence is higher
over a shorter horizon: 71% are very conf dent about
oering active health care benef ts in the next f ve years.
Top Employer Challenges
Similar to f ndings in previous years, employeehealth habits are the top challenge employers ace
in managing their health care costs (Figure 19).
High-cost catastrophic and end-o-lie care are also
a major challenge, ollowed by the underuse o
preventive services.
Figure 18. Steep decline in employer’s confidence that health care benefits
will be offered at their organization a decade from now
0%
20%
40%
60%
80%
2003 2005 2007 2008 2009 2010
4343
5959
7373
6262
5757
3838
High confdence Annual trend
Note: High confdence represents responses o “very confdent.”
High Confidence Annual Cost TPart-Time Benefi ts Vary From One
Employer to the Next
Forty-our percent o employers oer
the same health care coverage optionsto part-time and ull-time employees,while 29% oer more limited optionsto part-timers. More than a quarter o companies (28%) don’t oer healthcare benef ts to par t-time employees.
For nearly two-thirds o companies(63%), employees must work aminimum o 20 hours per week to beeligible or health care benef ts, and10% o employers require between 20and 30 hours per week or coverageeligibility. At the high end, 13% o employers require 30 hours or morehours per week or eligibility versus thelow end, wherein 14% o employersrequire ewer than 20 hours per week. Figure 19. Top challenges employers face to maintain affordable
benefit coverage
0% 20% 40% 60% 8
Poor inormation on provider quality
Changes in workorce demographics
Overuse o care through providers recommending too many services
Higher costs due to new medical technologies
Cost o compliance under the PPACA
Poor inormation on provider costs
Overuse o care through employees seeking inappropriate care
Poor employee understanding o how to use the plan
Escalating cost o pharmacy benefts
Underuse o preventive services
High-cost catastrophic cases and end-o-lie care
Employees’ poor health habits
6666
3939
3131
2828
2626
1818
1818
1616
1515
1414
1212
1010
Note: Companies were asked to identiy their top three challenges.

8/7/2019 TowersWatson-Shaping Health Care Strategy in a Post-Reform Environment
http://slidepdf.com/reader/full/towerswatson-shaping-health-care-strategy-in-a-post-reform-environment 14/32
12 towerswatson.com
Medical vendor perormance is another sticking
point or many employers (Figure 20). And compared
to last year’s f ndings, employer discontent appears
to be growing. Three-quarters o employers gave
their medical vendors poor marks or their inability
to promote healthier liestyles and encourage moreef cient use o health care services. Last year, two-
thirds o employers rated their vendors unavorably
in these areas.
It is likely that employers’ low marks or health plan
vendors tie back to their sense o rustration with
the overall lack o employee engagement in health
care. By the same token, employers that orge a
strong connection with their health plan(s) and other
vendors, and actively support programs aimed at
engaging employees and promoting patient saety
and quality improvements, can be very eective at
managing their health care costs and building a
healthy workorce.
Looking ahead, no matter how health care reorm
plays out, improvements in workorce health will
continue be the centerpiece o employers’ health
benef t strategy to boost productivity, retention and
f nancial perormance.
Figure 20. Rating the effectiveness of health plan vendors
0% 20% 40% 60% 80% 100%
Screening claims to fnd claimants and inviting them to par ticipate in health managementprograms
ntegrating data to determine appropriate treatment plans or catastrophic cases
ntegrating data to determine appropriate treatment plans or chronic conditions
Assisting employees in understanding and maximizing their beneft plan
Encouraging members to comply with appropriate preventive care guidelines
Engaging members in condition management programs
dentiying members who are not getting evidence-based care and intervening to correct“gaps” in care
Engaging members in health improvement programs
Oering members inormation to help make clinical decisions regarding preerence-sensitivecare (such as back surgery, breast surgery, prostate surgery)
Driving care to higher-quality providers
Changing member behavior related to making healthy liestyle decisions
Changing member behavior to drive more efcient use o health care services
7575 2121 44
21217474 55
6868 2525 77
6868 2525 77
6363 2929 88
6363 2828 99
5858 3434 88
5555 3434 1111
5252 3434 1414
4343 3636 2121
6060 3232 88
5858 3131 1111
Unavorable Neutral Favorable
Note: Unavorable includes “not at all” and “to a slight extent” eective; neutral includes “to a moderate
extent” eective; avorable includes “to a great extent” or “to a very great extent” eective.

8/7/2019 TowersWatson-Shaping Health Care Strategy in a Post-Reform Environment
http://slidepdf.com/reader/full/towerswatson-shaping-health-care-strategy-in-a-post-reform-environment 15/32
2011 Employer Survey on Purchasing Value in Health Care Report | Towers Watson/National Business Group on Healt
The health care reorm law has the potential to
completely change the landscape o employer-
sponsored health benef ts, most notably retireemedical programs. I the legislation works as
intended, the health insurance market will
become more attractive or pre-65 retirees,
allowing companies to exit sponsorship o
these programs. What’s more, elimination o
the Medicare Part D prescription drug benef t
donut hole and the potential emergence o new
solutions may make it easier or employers to
transition rom providing direct f nancial support
o a retiree medical plan to simply providing
access to coverage — still a signif cant value to
retirees.
As shown in Figure 21, less than hal (48%) o
companies in our database oer subsidized
retiree medical coverage to current retirees
under age 65 (versus 50% in 2010), and 44%
provide at least some coverage to Medicare-
eligible retirees (versus 47% in 2010). New
hires are much less likely to receive f nancial
support: 20% receive some pre-65 coverage,
and 19% have post-65 coverage.
In lieu o direct f nancial support, some orga-
nizations have taken steps to leverage the
external marketplace by providing retirees with
access to insurance products that improve plan
choice and increase levels o government und-
ing. Today, 20% o employers oer services that
expand access to pre-65 insurance products to
new hires, and 16% do so or post-65 coverage.
Roughly 10% o companies oer these services
to current retirees in 2011.
Figure 21. Retiree medical support for various subgroups of the workforce
New hires Active employees Current retirees
0% 20% 40% 60% 80%
Post-65
No financial support or access
Pre-65
Post-65
No financial support but provide access to coverage
Pre-65
Post-65
Limited financial support
Pre-65
Post-65
Defined benefit support
Pre-65
1111
2222
1717
1010
1919
1414
99
2626
2323
99
2525
2020
1616
99
1212
21211515
1111
5656
4545
4040
6262
52524545
Retiree Medical: A Shifting Landscape
8/7/2019 TowersWatson-Shaping Health Care Strategy in a Post-Reform Environment
http://slidepdf.com/reader/full/towerswatson-shaping-health-care-strategy-in-a-post-reform-environment 16/32
14 towerswatson.com
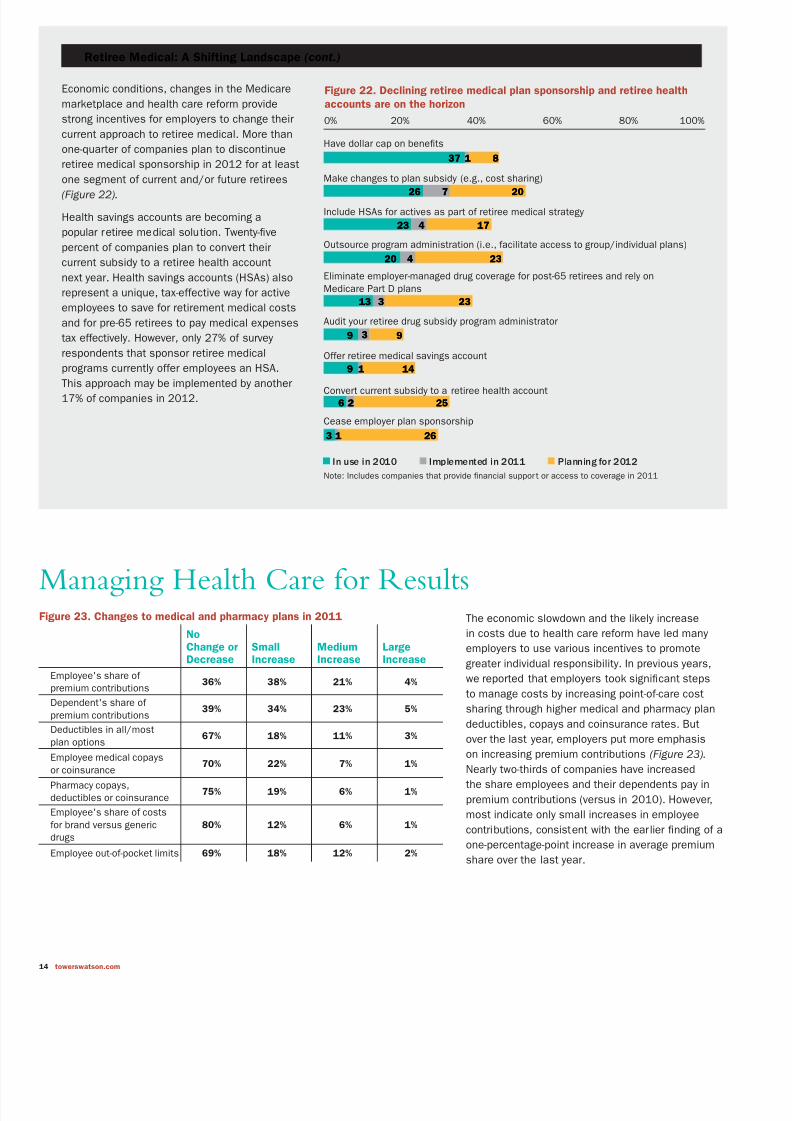
The economic slowdown and the likely increase
in costs due to health care reorm have led many
employers to use various incentives to promote
greater individual responsibility. In previous years,
we reported that employers took signif cant steps
to manage costs by increasing point-o-care cost
sharing through higher medical and pharmacy plan
deductibles, copays and coinsurance rates. But
over the last year, employers put more emphasis
on increasing premium contributions (Figure 23).
Nearly two-thirds o companies have increasedthe share employees and their dependents pay in
premium contributions (versus in 2010). However,
most indicate only small increases in employee
contributions, consistent with the earlier f nding o a
one-percentage-point increase in average premium
share over the last year.
Retiree Medical: A Shifting Landscape (cont.)
Economic conditions, changes in the Medicare
marketplace and health care reorm provide
strong incentives or employers to change their
current approach to retiree medical. More than
one-quarter o companies plan to discontinue
retiree medical sponsorship in 2012 or at least
one segment o current and/or uture retirees
(Figure 22).
Health savings accounts are becoming a
popular retiree medical solution. Twenty-f ve
percent o companies plan to convert their
current subsidy to a retiree health account
next year. Health savings accounts (HSAs) also
represent a unique, tax-eective way or active
employees to save or retirement medical costs
and or pre-65 retirees to pay medical expenses
tax eectively. However, only 27% o survey
respondents that sponsor retiree medical
programs currently oer employees an HSA.
This approach may be implemented by another17% o companies in 2012.
Figure 22. Declining retiree medical plan sponsorship and retiree health
accounts are on the horizon
0% 20% 40% 60% 80% 100%
Cease employer plan sponsorship
Convert current subsidy to a retiree health account
Oer retiree medical savings account
Audit your retiree drug subsidy program administrator
Eliminate employer-managed drug coverage or post-65 retirees and rely onMedicare Part D plans
Outsource program administration (i.e., acilitate access to group/individual plans)
Include HSAs or actives as part o retiree medical strategy
Make changes to plan subsidy (e.g., cost sharing)
Have dollar cap on benefts
3737 11 88
2626 202077
2323 44 1717
2020 44 2323
1313 33 2323
99 33 99
99 11 1414
66 22 2525
33 11 2626
In use in 2010 Implemented in 2011 Planning or 2012
Note: Includes companies that provide fnancial suppor t or access to coverage in 2011
Managing Health Care for ResultsFigure 23. Changes to medical and pharmacy plans in 2011
NoChange orDecrease
SmallIncrease
MediumIncrease
LargeIncrease
Employee's share o premium contributions
36% 38% 21% 4%
Dependent's share o premium contributions
39% 34% 23% 5%
Deductibles in all/mostplan options
67% 18% 11% 3%
Employee medical copays
or coinsurance70% 22% 7% 1%
Pharmacy copays,deductibles or coinsurance
75% 19% 6% 1%
Employee's share o costsor brand versus genericdrugs
80% 12% 6% 1%
Employee out-o-pocket limits 69% 18% 12% 2%

8/7/2019 TowersWatson-Shaping Health Care Strategy in a Post-Reform Environment
http://slidepdf.com/reader/full/towerswatson-shaping-health-care-strategy-in-a-post-reform-environment 17/32
2011 Employer Survey on Purchasing Value in Health Care Report | Towers Watson/National Business Group on Healt
Some companies are also taking a closer look at
their pharmacy programs in part by changing plan
designs. But with many drugs set to lose patent
protection over the next ew years, companies are
also looking more critically at the share o costs
paid or brand-name drugs versus their genericcounterparts, with some companies opting to
exclude popular brand-name drugs rom their
ormulary altogether.
As employers design their 2012 health care strate-
gies, they plan to redef ne the f nancial commitment
made between employees and dependents (Figure 24).
Along these lines, employer actions planned or next
year include increasing contributions in tiers with
dependent coverage, raising contributions per each
covered dependent, and/or using spousal waivers
or surcharges. Companies will also take more
signif cant steps in 2012 to boost enrollment in a
high-deductible health plan, such as an ABHP (see
“ABHPs: Gaining Momentum?” page 16).
In the coming year, employers will also take steps
to improve provider quality and incent the use o
evidence-based care. Twenty-eight percent o employ-
ers plan to dierentiate cost sharing or high-peror-
mance networks or centers o excellence in 2012,
and 21% plan to adopt value-based designs over the
next year. Employers are also doling out incentives
(or penalties) to providers to encourage coordination
o care, the use o emerging technologies and/or
evidence-based treatments.
Companies increasingly recognize that a healthy
workorce can be a competitive advantage. At
the same time, despite signif cant investments in
wellness and other health management programs,
engaging employees in their health is proving to
be a ver y dif cult challenge. As a result, a growing
number o employers are rethinking their current
strategies and imposing tougher, more specif c
requirements or incentives. For example, this last
year marked a twoold increase in incentive designs
that pinpoint specif c outcomes or weight control
or cholesterol levels (Figure 25). Another 33% o
employers plan to adopt an outcome-based programin 2012 — a staggering increase given only 6% o
employers had such a program in 2010.
Figure 24. Cost-sharing strategies and value-based designs
0% 20% 40% 60% 80% 1
Use reerence-based pricing in medical plan (e.g., oer a limited level o coverageor a procedure)
Use value-based beneft designs (e.g., provide dierent levels o coverage based onvalue or cost o services)
Oer incentives (or penalties) to providers or coordination o care, use o emergingtechnologies or use o evidence-based treatments
Dierentiate cost sharing or use o high-perormance networks or centers o excellence
Use spousal waivers or surcharges (when other coverage is available)
Increase employee contributions per each dependent covered
Increase employee contributions in tiers with dependent coverage
Structure most prevalent plan so that deductible or single coverage is $1,000 or more
1616
33
1919 33 1313
1515
18182244
99
55 11 77
22 2121
282822
33 1313
44 1414
202014143434
In use in 2010 Implement or 2011 Planning or 2012 or later
Figure 25. Companies continue to raise the bar on wellness incentives
0% 20% 40% 60% 80% 1
Require employees with high health-risk-actor status or with chronic condition(s)to show evidence o active treatment management rom specialty vendor and/ortreating provider to receive reward (or avoid penalty)
Use a lower-value plan option or employees not ulflling requirements in healthor disease management activities
Require employees to complete the health risk appraisal and/or biometric screeningto be eligible or other fnancial incentives or healthy activities
Reward (or penalize) only those who complete requirements o a healthy liestyle activit
Reward (or penalize) enrollment in healthy liestyle activities
Reward (or penalize) based on biometric outcomes other than smoker, tobacco-use stat
(e.g., achievement o weight control or target cholesterol levels)
Reward (or penalize) based on smoker, tobacco-use status
2222
2525
2222 1212 3030
3030
13132233
99 44 1818
26261212
1212 3030
88 2121
33337766
In use in 2010 Implemented in 2011 Planning or 2012 or later

8/7/2019 TowersWatson-Shaping Health Care Strategy in a Post-Reform Environment
http://slidepdf.com/reader/full/towerswatson-shaping-health-care-strategy-in-a-post-reform-environment 18/32
16 towerswatson.com
While employers are clearly raising the bar or
earning wellness program f nancial rewards, ew
seem willing to penalize employees via premium
surcharges, with exceptions or smokers/tobacco
use (Figure 26).
ABHPs: Gaining Momentum?
While organizations have been steadily adopting
ABHPs over much o the last decade, in 2011, 53%
o companies have this plan in place — roughly the
same percentage as last year (Figure 27). However,
27% o respondents that do not have an ABHP in
place (13% o all respondents) plan to oer one in
2012.
In general, ABHPs can be a valuable tool in helping
employers stave o the impact o the 2018 excise
tax. These plans also benef t employees in both the
short and long term by helping them pay or current
costs while giving them a wealth-accumulation
vehicle or retirement. For those companies planning
to adopt an ABHP next year, 39% indicate that the
PPACA had a “moderate” or “great” impact on their
decision, while 26% said it was not an important
actor.
ABHP enrollment has been picking up steam
over the past f ve years. But employers are still
experiencing challenges in positioning these plans
or success. Among companies oering an ABHP
today, only 15% o eligible employees are enrolled
in the plan — the same percentage as last year
(Figure 28). Along similar lines, the percentage o
companies with at least 20% enrollment plateaued
at 44% this year.
Figure 26. Types of fi nancial incentives by healthy lifestyle activities
% Offering
Program
Offer Program
but Don’t Use
Incentives
Rewards Penalties
Premium
Discount
Coverage
Differentials
Account
Contributions,
Cash or
Equivalent
Other
Rewards
Premium
Surcharge
Other
PenaltiesHealth risk appraisal 79% 24% 30% 3% 31% 11% 4% 1%
Biometric screenings (separaterom the health risk appraisal)
62% 48% 19% 2% 21% 11% 3% 0%
Weight management program 73% 62% 6% 1% 20% 12% 0% 0%
Smoking cessation program 78% 56% 13% 3% 15% 15% 0% 1%
Liestyle coaching 58% 60% 9% 2% 20% 10% 1% 1%
Disease management programs orthose with chronic condition
87% 74% 5% 3% 11% 6% 2% 1%
Physical activity 78% 66% 6% 1% 16% 13% 0% 0%
Smoker, tobacco-use status 30% — 43% 2% 14% 4% 40% 4%
Biometric outcomes 13% — 39% 0% 48% 14% 2% 0%
Figure 27. Take-up in ABHPs stabilizes — for now
2002 2003 2004 2005 2006 2007 2008 2009 2010 2011 2012*
33333939
47475151
5454 5353
6666
*Planned or 2012
0%
10%
20%
30%
40%
50%
60%
70%
25
11
21
Employers Up the Ante on Wellness Incentives
Fity-eight percent o employers are oering cash, premiumcredits and/or account contributions to their employees toencourage participation in healthy liestyle activities in 2011— up rom 52% in 2010. For the typical company that oersincentives, the maximum amount o cash employees can earnis $300 — a $50 increase over 2010. Among companies thatprovide incentives, 46% are oering them to dependents in2011, versus 39% in 2010. The highest cash total that can be
earned by both employees and dependents or companies thatoer incentives to dependents increased by $100 over the lastyear, to $600.

8/7/2019 TowersWatson-Shaping Health Care Strategy in a Post-Reform Environment
http://slidepdf.com/reader/full/towerswatson-shaping-health-care-strategy-in-a-post-reform-environment 19/32
2011 Employer Survey on Purchasing Value in Health Care Report | Towers Watson/National Business Group on Healt
While ew employers have been willing to migrate
their entire workorce to an ABHP, the percentage o
companies with a total replacement ABHP increased
by 22% over last year, and by nearly 75% over the
last two years (9.3% versus 5.4%).
To encourage enrollment, many companies set
employee premium contributions or ABHPs signif -cantly lower than any other plan types. Today, 56%
o employers set their employees’ ABHP premium
contributions at least 20% lower than contributions
or their traditional copay plan (Figure 29). This
premium advantage or ABHPs was more signif cant
in previous years, which may partially explain why
enrollment rates have remained at. However, more
than one-quarter o employers (26%) set employee
premium contributions at more than 50% less than
other plan types, the same as last year.
Stepped-Up Demand for Onsite Services
Onsite health services are expected to grow over the coming years or several reasons.Most notably, these services can be an eective way or some organizations to lower
injury- and illness-related costs with attendant concerns toward time away rom the job andreturn to work ollowing an absence. And in the wake o health care reorm, the availabilityo onsite health services may help to increase access or employees to primary care asmillions o newly insured individuals gain entry to the U.S. health care system.
Today, 23% o companies oer onsite health services to employees, and 16% oer onsitepharmacy services. Looking ahead, another 12% o companies plan to oer onsite healthservices in 2012, and an additional 5% plan to oer onsite pharmacy. Those employersthat oer these services also plan to expand their current oerings. Eleven percent o companies expanded their service oerings over the last two years, and another 11% planto do so in 2012.
Figure 28. ABHP enrollment rates
2006 2007 2008 2009 2010 2011
Median ABHP enrollment Percentage with enrollment over 20% Percentage with 100% enrollment
Note: Estimates are based on companies that oer an ABHP in various years. Year 2006 is based on the 12th annual Towers Watson/National
Business Group on Health survey; 2007 is based on the 13th annual survey; 2008 is based on the 14th annual survey, and 2009 and 2010
are based on the 15th annual survey.
0%
10%
20%
30%
40%
50%
60%
70%
45.545.5 44.144.1
10.010.0
35.135.1
43.043.0
5.45.4
14.014.0
5.05.0
38.838.8
12.012.0
5.45.4
27.227.2
4.94.98.08.0 7.67.6
15.015.0
9.39.3
15.015.0
Figure 29. Companies offer significantly lower premium costs for employees
enrolled in ABHPs
0% 20% 40% 60% 80% 1
22 88 4141 2121
22226644 3232
44 66 2020 4444
44 1515 2525 3030
ABHP
contributions
are more
No dierence 1% to 20%
less
20% to 50%
less
More th
50% le
2008
2009
2010
2011
Note: Results are based on companies that oer an ABHP, excluding those with a totalreplacement plan.

8/7/2019 TowersWatson-Shaping Health Care Strategy in a Post-Reform Environment
http://slidepdf.com/reader/full/towerswatson-shaping-health-care-strategy-in-a-post-reform-environment 20/32
18 towerswatson.com
Among companies that have ABHPs, health savings
accounts (HSAs) — the most popular savings
vehicle — are gaining ground. Forty-one percent o
companies oer an HSA today, with another 12%
expected to add one in 2012 (Figure 30). Thirty-one
percent o all companies contribute unds to their
HSA, and an additional 11% plan to do so next year.
On the other hand, the percentage o companies
oering health reimbursement accounts (HRAs)remains unchanged over the last f ve years.
Today, 8% o employers oer a total replacement
ABHP to at least a portion o their workorce. That
rate could reach almost 13% by 2012 i companies
ollow through with their current health plan strategy.
In addition, 15% o companies oer ABHPs as their
deault plan, and another 11% plan to do so in 2012.
Company Account Contributions Vary
The typical contribution or employerswith an ABHP is $500 or employee-only coverage and $1,000 or amilycoverage. However, 12% o employerswith this type o plan contributeat least $1,000 or employee-onlycoverage, and 11% contribute at least$2,000 or amily coverage. Roughly16% o companies with an ABHP do
not contribute unds to HSAs.
“Among companies that have ABHPs, health
savings accounts (HSAs) — the most popular
savings vehicle — are gaining ground.”
Figure 30. ABHPs with health savings accounts are the most popular
account-based plans
0% 10% 20% 30% 40% 50% 60%
Total replacement ABHP to at least one employee group
2007
Contribute funds to an HSA
2007
ABHP with HSA2007
ABHP with HRA
2007
2020
2121
2020 55
2525
3434
4141 1212
1515
2525
3131 1111
55
66
88 55
Note: Percentages based on all companies — with or without an ABHP.
In place in 2011 Planned or 2012
2009
2011
2009
2011
2009
2011
2009
2011
8/7/2019 TowersWatson-Shaping Health Care Strategy in a Post-Reform Environment
http://slidepdf.com/reader/full/towerswatson-shaping-health-care-strategy-in-a-post-reform-environment 21/32
2011 Employer Survey on Purchasing Value in Health Care Report | Towers Watson/National Business Group on Healt
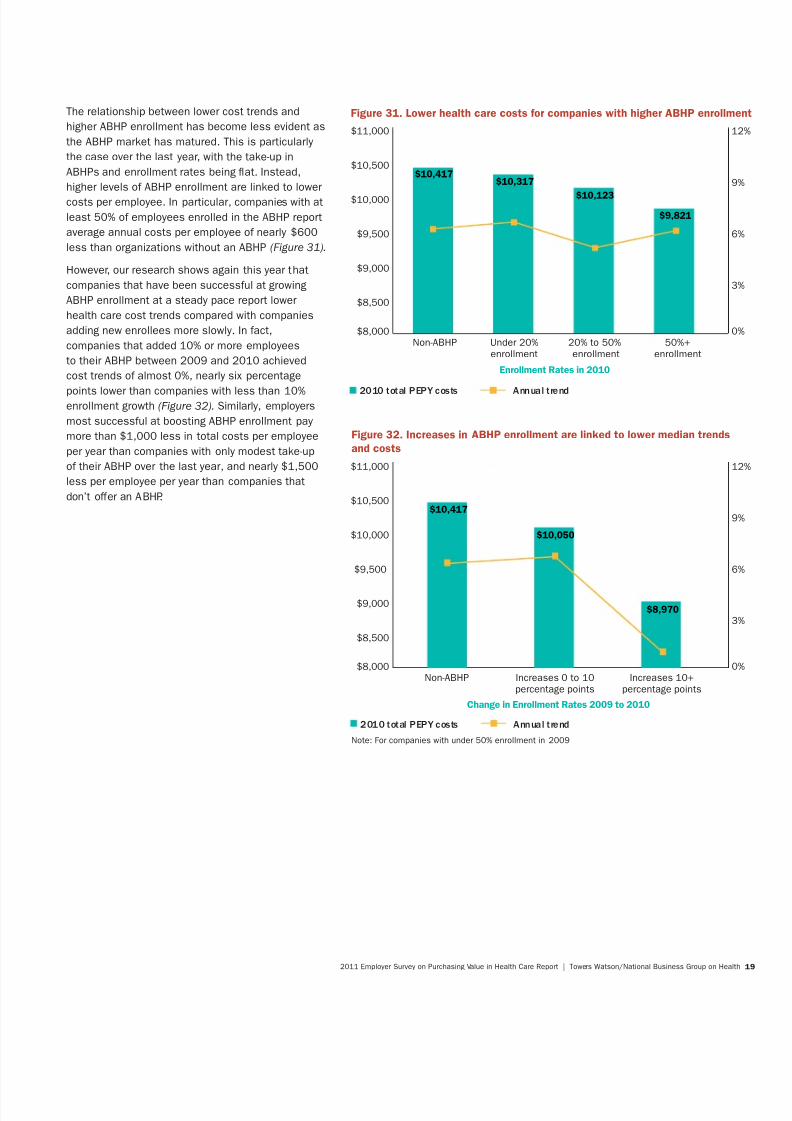
The relationship between lower cost trends and
higher ABHP enrollment has become less evident as
the ABHP market has matured. This is particularly
the case over the last year, with the take-up in
ABHPs and enrollment rates being at. Instead,
higher levels o ABHP enrollment are linked to lowercosts per employee. In particular, companies with at
least 50% o employees enrolled in the ABHP report
average annual costs per employee o nearly $600
less than organizations without an ABHP (Figure 31).
However, our research shows again this year that
companies that have been successul at growing
ABHP enrollment at a steady pace report lower
health care cost trends compared with companies
adding new enrollees more slowly. In act,
companies that added 10% or more employees
to their ABHP between 2009 and 2010 achieved
cost trends o almost 0%, nearly six percentage
points lower than companies with less than 10%
enrollment growth (Figure 32). Similarly, employers
most successul at boosting ABHP enrollment pay
more than $1,000 less in total costs per employee
per year than companies with only modest take-up
o their ABHP over the last year, and nearly $1,500
less per employee per year than companies that
don’t oer an ABHP.
Figure 31. Lower health care costs for companies with higher ABHP enrollm
$8,000
$8,500
$9,000
$9,500
$10,000
$10,500
$11,000
Non-ABHP Under 20% 20% to 50% 50%+enrollment enrollment enrollment
$10,417$10,317
$10,123
$9,821
0
3
6
9
1
2010 total PEPY costs Annual trend
Enrollment Rates in 2010
Figure 32. Increases in ABHP enrollment are linked to lower median trends
and costs
$8,000
$8,500
$9,000
$9,500
$10,000
$10,500
$11,000
Non-ABHP Increases 0 to 10 Increases 10+percentage points percentage points
$10,417
$10,050
$8,970
Note: For companies with under 50% enrollment in 2009
Change in Enrollment Rates 2009 to 2010
0
3
6
9
1
2010 total PEPY costs Annual trend

8/7/2019 TowersWatson-Shaping Health Care Strategy in a Post-Reform Environment
http://slidepdf.com/reader/full/towerswatson-shaping-health-care-strategy-in-a-post-reform-environment 22/32
20 towerswatson.com
Perormance variations tell an important story aboutsuccessul health benef t programs and the specif c
actors that contribute to their superior results.
With economic challenges persisting and health
care reorm poised to transorm the health care
landscape, there has never been a more critical time
or employers’ health benef t programs to operate
ef ciently. And the potential or a clear competitive
advantage has never been greater.
The f ndings o this year’s analysis clearly show
that the most successul companies stand head
and shoulders above their competitors by making
signif cant strides in six core areas: • Health improvement
• Engagement
• Accountability
• Linking provider strategies
• Technology
• Healthy environment
To achieve the right outcomes, these companiesrecognize the inextricable link between their
health benef t program and workorce health and
productivity. How do these companies connect the
dots? Simply stated, they evaluate the perormance
o each o these six components using data and
metrics to gauge their impact on two key indicators:
cost reduction and improvements in workorce
health and productivity. As shown in Figure 33,
consistent perormers have universally made greater
strides in each o the core tactic areas, especially
by increasing employee accountability, promoting
higher-quality care and investing in a comprehensive
approach to engage employees in living healthierliestyles.
Figure 33. Key drivers of performance
Summary of Program Use Difference in Program Use*
Consistent Performers Low Performers Consistent to Low
Accountability 21% 12% 72%Linking provider strategies 30% 19% 56%
Engagement 32% 22% 45%
Measurement 43% 33% 29%
Healthy environment 34% 27% 25%
Technology 35% 29% 20%
Health improvement 58% 50% 18%
*Dierence in program use represents the percentage dierence between consistent perormers’ use o the tactics in each o the seven areas
and that o low perormers. For example, consistent perormers are using 72% more o the activities addressing employee accountability.
Road Map for Success — Strategies for Building a Healthy, Productive Workforce
8/7/2019 TowersWatson-Shaping Health Care Strategy in a Post-Reform Environment
http://slidepdf.com/reader/full/towerswatson-shaping-health-care-strategy-in-a-post-reform-environment 23/32

8/7/2019 TowersWatson-Shaping Health Care Strategy in a Post-Reform Environment
http://slidepdf.com/reader/full/towerswatson-shaping-health-care-strategy-in-a-post-reform-environment 24/32
22 towerswatson.com
Engagement
While many organizations oer programs to support
behavior change and encourage healthier liestyles,
consistent perormers use a multiaceted approach.
As shown in Figure 35, providing monetary rewards
or participating in various liestyle initiatives —
such as liestyle coaching, smoking cessation
and completing a health risk appraisal — is a
undamental component o their strategy.
Consistent perormers also provide employees with
the inormation they need to make clinical decisions
regarding preerence-sensitive care (such as back
surgery, breast surgery and prostate surgery) and
target programs to people with health risks (Figure
36). What’s more, the most successul companies
apply principles o behavioral economics to engage
employees in wellness programs. These employers
also impose stricter requirements or monetaryrewards. For example, employees must complete
all the requirements o a healthy liestyle activity to
receive a f nancial reward. Consistent perormers
are also twice as likely to use specif c health-related
standards or smoker status, weight control and
cholesterol levels than their peers.
Consistent perormers Low perormers
Figure 35. Engaging employees in healthy lifestyle activities
0% 10% 20% 30% 40% 50% 60%
Reward/penalize or biometric screenings (separate rom the health risk appraisal)
Reward/penalize or weight management program
Reward/penalize or physical activity
Reward/penalize or smoking cessation program
Reward/penalize or disease management programs or those with chronic condition
Reward/penalize or liestyle coaching2828
1919
2626
1919
44443232
2828
2222
3838
3030
2424
3030
Consistent perormers Low perormers
Figure 36. Engaging employees through achievement standards and information
0% 10% 20% 30% 40% 50% 60%
Educate employees to be more inormed/active consumers o health care
Require employees to complete the health risk appraisal and/or biometric screeningto be eligible or other fnancial incentives or healthy activities
Use member interaction with health management programs to promote usinga primary care doctor
Segment the population by health risk level and oer targeted programs
Reward (or penalize) based on smoker, tobacco-use status
Reward (or penalize) based on biometric outcomes other than smoker, tobacco-use status
Reward (or penalize) only those who complete requirements o a healthy liestyle activity
Provide members inormation to help make clinical decisionsregarding preerence-sensitive care
1313
44
3838
1818
8844
26261414
23231414
1414
2525
26261919
3636
2525

8/7/2019 TowersWatson-Shaping Health Care Strategy in a Post-Reform Environment
http://slidepdf.com/reader/full/towerswatson-shaping-health-care-strategy-in-a-post-reform-environment 25/32
2011 Employer Survey on Purchasing Value in Health Care Report | Towers Watson/National Business Group on Healt
Accountability
Consistent perormers are making bold strides to
increase employee accountability or their health andcare by promoting the use o evidence-based care
(Figure 37). For example, these employers use value-
based benef t designs and reerence-based pricing
in their medical and pharmacy plans. Consistent
perormers also take a harder-lined position in their
ABHP strategy by using these plans as their deault
option and oering a total replacement ABHP to at
least one employee group. Moreover, consistent
perormers target certain groups with higher
contributions (e.g., by structuring premiums based
on employee compensation levels) and use spousal
surcharges when other coverage is available.
Figure 37. Tactics to promote accountability
0% 10% 20% 30% 40% 5
Provide employees with inormation on provider and/or hospital quality
Reduce pharmacy copays or coinsurance or those with chronic conditions
Change plan options
Dierentiate cost sharing or use o high-perormance networks or centers o excellenc
Modiy defnition o drug tiers
Oer a total replacement ABHP to at least one employee group
Oer an ABHP as a deault plan option
Use value-based beneft designs
Structure employee premiums based on employee compensation levels
Use spousal waivers or surcharges (when other coverage is available)
Use reerence-based pricing in pharmacy plan design
Use reerence-based pricing in medical plan1010
33
88
33
3838
1515
2222
1010
1616
88
26261515
1414
99
1616
1111
1818
1313
1212
99
1212
99
4343
3636
Consistent perormers Low perormers
8/7/2019 TowersWatson-Shaping Health Care Strategy in a Post-Reform Environment
http://slidepdf.com/reader/full/towerswatson-shaping-health-care-strategy-in-a-post-reform-environment 26/32
24 towerswatson.com
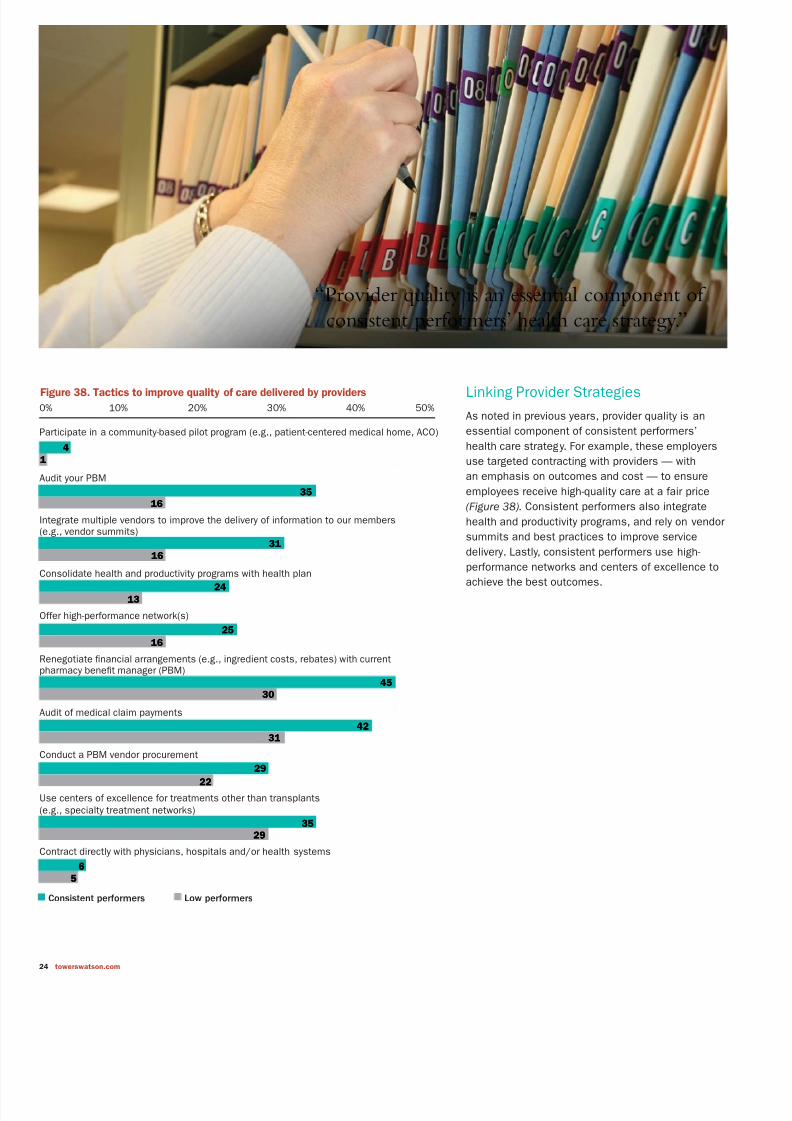
Linking Provider Strategies
As noted in previous years, provider quality is an
essential component o consistent perormers’
health care strategy. For example, these employers
use targeted contracting with providers — with
an emphasis on outcomes and cost — to ensure
employees receive high-quality care at a air price
(Figure 38). Consistent perormers also integrate
health and productivity programs, and rely on vendor
summits and best practices to improve service
delivery. Lastly, consistent perormers use high-
perormance networks and centers o excellence to
achieve the best outcomes.
Figure 38. Tactics to improve quality of care delivered by providers
0% 10% 20% 30% 40% 50%
Contract directly with physicians, hospitals and/or health systems
Use centers o excellence or treatments other than transplants(e.g., specialty treatment networks)
Conduct a PBM vendor procurement
Audit o medical claim payments
Renegotiate fnancial arrangements (e.g., ingredient costs, rebates) with currentpharmacy beneft manager (PBM)
Oer high-perormance network(s)
Consolidate health and productivity programs with health plan
ntegrate multiple vendors to improve the delivery o inormation to our members(e.g., vendor summits)
Audit your PBM
Participate in a community-based pilot program (e.g., patient-centered medical home, ACO)
44
11
35351616
3131
1616
2424
1313
2525
1616
4545
3030
42423131
29292222
3535
2929
66
55
Consistent perormers Low perormers
“Provider quality is an essential component of
consistent performers’ health care strategy.”

8/7/2019 TowersWatson-Shaping Health Care Strategy in a Post-Reform Environment
http://slidepdf.com/reader/full/towerswatson-shaping-health-care-strategy-in-a-post-reform-environment 27/32
2011 Employer Survey on Purchasing Value in Health Care Report | Towers Watson/National Business Group on Healt
Technology
Applying the most eective technologies to
automate data, target those at risk, personalize the
health experience and establish social communities
are eective steps consistent perormers take to
gain operational ef ciencies and lower the cost o
health care. The right technology can help providers
and members identiy gaps in care (Figure 39).
Consistent perormers are more likely to provide
employees with personal health records and a
company-sponsored website to promote year-round
education on important health topics and other
inormation. While social media has become a way
o lie in mainstream America, it has yet to take o
with benef t and HR managers as a way to connect
with employees about health care. But as the social
media environment evolves and more credible and
trusted sites emerge, it is likely more employers willembrace this vehicle to provide their workorce with
expanded education and support.
Healthy Environment
Consistent perormers are most likely to embrace a
culture o health by creating a work environment that
encourages healthier liestyles (Figure 40). These
employers also use environmental audits to ensure
health messages align with workplace health and
saety initiatives. Consistent perormers also brand
their wellness program in all communication related
to healthy liestyle activities and use local wellness
champions to carry the message orward.
These companies also recognize the importance
o senior management support and involvement.
As a matter o routine, these respondents provide
senior leaders with up-to-date health and productivity
program utilization reports.
Figure 39. Applying the most effective technologies
0% 20% 40% 60% 8
Oer website sponsored/hosted by the company that provides health resources(not limited to beneft inormation)
Oer personal health records (electronic records through medical plan or other vendor)
Provide gaps-in-care messaging to the physician and to the member
Provide online messages to support primary care utilization linked to web-baseddecision support tools
Use social networks to impact employee health and well-being
Use cost-eective technology (e.g., YouTube, podcasts, Twitter) to share personal storie
66
22
6644
17171212
5050
3636
4040
3232
63635757
Consistent perormers Low perormers
Figure 40. Tactics to encourage a healthy environment
0% 20% 40% 60% 8
Actively manage vendor-prepared communication/education on health care costs andliving healthier liestyles
Create a work environment to encourage exercise
Oer onsite biometric screenings
Use local wellness champions/advocates
Brand the program or use in all communication related to healthy liestyle activities
Senior leadership visibly supports the importance o a healthy work environment
Create a work environment to encourage healthier eating
Use environmental audits to assure health messages are aligned
with workplace health and saety
Provide managers and/or senior leaders regular reports showing health andproductivity program utilization metrics
2323
88
101055
1919
1414
25252020
65655555
52524545
5353
4848
27272424
4646
4242
66Consistent perormers Low perormers
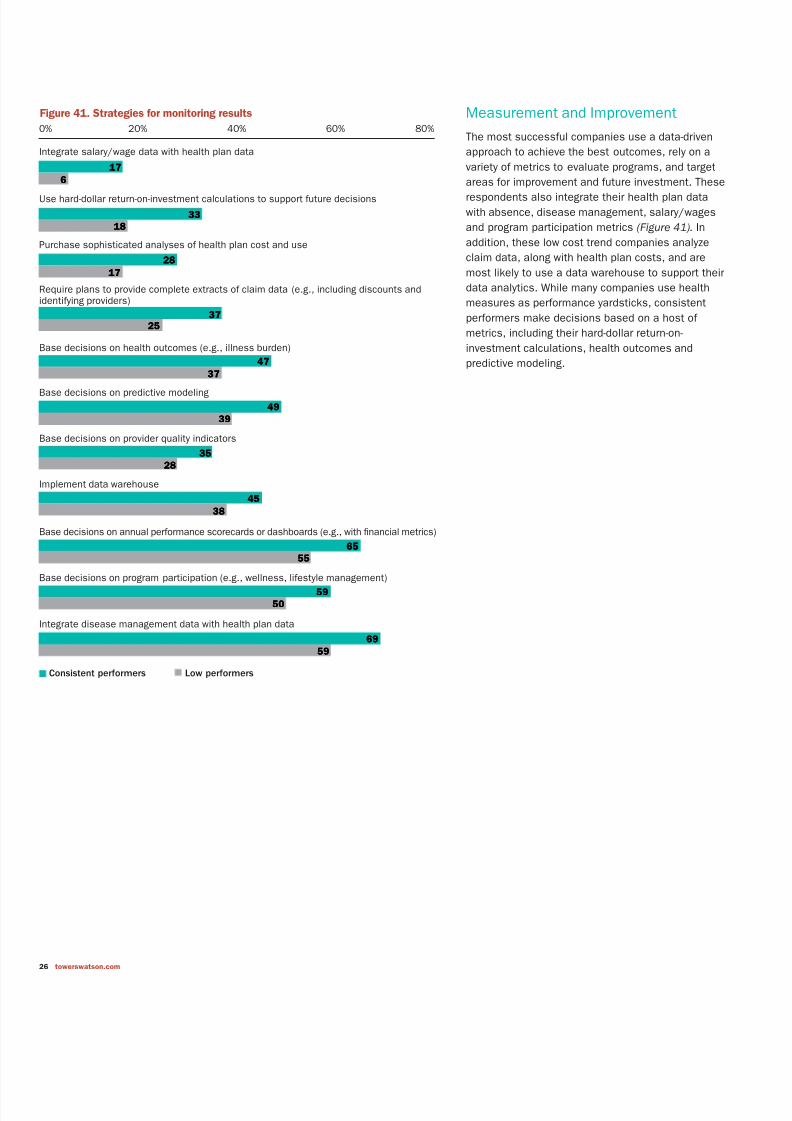
8/7/2019 TowersWatson-Shaping Health Care Strategy in a Post-Reform Environment
http://slidepdf.com/reader/full/towerswatson-shaping-health-care-strategy-in-a-post-reform-environment 28/32
26 towerswatson.com
Measurement and Improvement
The most successul companies use a data-driven
approach to achieve the best outcomes, rely on a
variety o metrics to evaluate programs, and target
areas or improvement and uture investment. These
respondents also integrate their health plan data
with absence, disease management, salary/wages
and program participation metrics (Figure 41). In
addition, these low cost trend companies analyze
claim data, along with health plan costs, and are
most likely to use a data warehouse to support their
data analytics. While many companies use health
measures as perormance yardsticks, consistent
perormers make decisions based on a host o
metrics, including their hard-dollar return-on-
investment calculations, health outcomes and
predictive modeling.
Figure 41. Strategies for monitoring results
0% 20% 40% 60% 80%
ntegrate disease management data with health plan data
Base decisions on program participation (e.g., wellness, liestyle management)
Base decisions on annual perormance scorecards or dashboards (e.g., with fnancial metrics)
mplement data warehouse
Base decisions on provider quality indicators
Base decisions on predictive modeling
Base decisions on health outcomes (e.g., illness burden)
Require plans to provide complete extracts o claim data (e.g., including discounts anddentiying providers)
Purchase sophisticated analyses o health plan cost and use
Use hard-dollar return-on-investment calculations to support uture decisions
ntegrate salary/wage data with health plan data
1717
66
3333
1818
2828
1717
37372525
4747
3737
4949
3939
4545
3838
2828
3535
5959
5555
6565
5050
6969
5959
Consistent perormers Low perormers

8/7/2019 TowersWatson-Shaping Health Care Strategy in a Post-Reform Environment
http://slidepdf.com/reader/full/towerswatson-shaping-health-care-strategy-in-a-post-reform-environment 29/32
2011 Employer Survey on Purchasing Value in Health Care Report | Towers Watson/National Business Group on Healt
Health care reorm is impacting employers in
countless ways. Beyond the immediate cost,
compliance and insurance challenges, this
landmark legislation provides organizations with
an unprecedented opportunity to rethink their role
in oering employer-provided health care and the
broad-reaching impact — well beyond the health
benef ts arena — o potential decisions. To stay in
ront o these complex issues, employers will need
to respond quickly and thoughtully. These insights,
culled rom our research and our work with clients,
are an initial set o actions employers can take right
now to manage costs and mitigate risks.
Stave O the Excise Tax
While the excise tax may be a number o years
away, Towers Watson’s research has shown that
60% o companies will reach the status o a
“rich” plan by 2018 (i.e., plans that cost a total
o more than $10,200 or single coverage and
more than $27,500 or amily coverage in 2018).
Those companies taking more strategic actions
now, or example, through program design andother strategies to drive home improvements
in workplace health, will likely have a leg up on
other organizations managing health care reorm
mandates and controlling costs.
Keep Abreast o Evolving RegulatoryInterpretation, Litigation and PoliticalFallout
Due to the health care reorm law’s sheer volume
and complexity, interpretive regulations or
implementation will be required or years to come.
What’s more, recent political controversy, litigation
and ongoing uncertainty underscore the imperative
or health benef t sponsors to understand all o the
implications o the health care reorm law as theychart their benef t, communication and business
strategies over the next several years.
Take Advantage o ABHPs
As our study f ndings conf rm, sponsorship o ABHPs
is expected to surge in 2012, most likely to address
the rising costs o health care and to respond to
provisions under the 2018 excise tax that will limit
uture program costs. ABHPs can also be benef cial
to employees in both the short and long term,
helping them pay or current costs while giving them
a wealth-accumulation vehicle or retirement. In act,developing a consistent health benef t strategy that
links active employee benef ts to retiree programs
is an eective way or employers to achieve savings
while delivering value and empowering employees to
play an active role in preparing or retirement.
Conclusion

8/7/2019 TowersWatson-Shaping Health Care Strategy in a Post-Reform Environment
http://slidepdf.com/reader/full/towerswatson-shaping-health-care-strategy-in-a-post-reform-environment 30/32
28 towerswatson.com
Increase Employee Accountability
Clearly, changes in plan design can play a critical
role in encouraging employees to be more
responsible or their health care and their costs.
For example, leading organizations are using value-
based benef t designs and reerence-based pricing
in both their medical and pharmacy plans. Some
o these organizations are also adopting more
aggressive ABHP strategies.
Engage Employees With Tools/Resources to Manage Their Health
Our research results consistently support the notion
that consistent perormers are more likely than their
peers to make investments in improving the health
o their workorce. For example, these companies
use health risk appraisals and biometric monitoring
to capture risk actors across their population. Theyalso invest in enhancements to case management,
smoking cessation, health coaching, f nancial
incentives and other initiatives to engage employees
in managing their health.
Forge Strong Connections With HealthPlan Vendors and Other Providers
Consistent perormers set themselves apart
by making provider quality a top priority. These
companies rely on targeted contracting, with
an emphasis on cost and outcomes to ensure
employees receive high-quality care at a air price.These companies also hold vendors accountable
or using best practices to improve service delivery,
and actively manage their pharmacy benef t manager
(PBM) by renegotiating f nancial arrangements and
auditing medical claim payments.
Reevaluate Your Retiree MedicalStrategy
Consider anticipated health plan costs ater health
care reorm and the role o retiree medical in your
total rewards program. In light o opportunities that
will be available in 2014, what is the appropriaterole or your organization? How will changes in your
organization’s retiree medical oering aect other
elements o total rewards?
Embrace a Culture o Health
Leading companies are building employee health
and well-being into their organization’s platorm
or delivering the business outcomes they strive
to achieve. They recognize the strong correlation
between employee health and positive f nancial
and operational results — a health dividend
that includes lower costs as well as improved
perormance and overall business success.
Measure the Results
What places successul companies ahead o
the pack is their emphasis on data to evaluate
programs, address areas that need improvement
and target uture investments. These companies
also integrate their health plan data with absence,
disease management, salary/wages and program
participation metrics, and make decisions basedon a host o measures, such as health outcomes,
predictive modeling and hard-dollar investments.
Looking Ahead
The latest litigation, political controversy and
regulatory actions underscore the act that the
jury is still out on how the health care reorm
law will play out. But one implication is clear:
Employers need to respond quickly by developing
the necessary business planning, analytics
modeling and decision support to understand the
PPACA’s ar-reaching implications or their entireorganization — rom staf ng and reward strategies,
recruitment and retention, to change management
and myriad other issues. By taking advantage o
new opportunities presented by health care reorm
and other initiatives, employers’ potential to align
their health benef t programs with their total rewards
and business strategy — and achieve a competitive
advantage — has never been greater.

8/7/2019 TowersWatson-Shaping Health Care Strategy in a Post-Reform Environment
http://slidepdf.com/reader/full/towerswatson-shaping-health-care-strategy-in-a-post-reform-environment 31/32

8/7/2019 TowersWatson-Shaping Health Care Strategy in a Post-Reform Environment
http://slidepdf.com/reader/full/towerswatson-shaping-health-care-strategy-in-a-post-reform-environment 32/32
About the National Business
Group on HealthThe National Business Group on Health is the nation’s only
nonprof t membership organization o large employers devoted
exclusively to f nding innovative and orward-thinking solutions
to their most important health care and related benef ts issues.
The Business Group identif es and shares best practices in
health benef ts, disability, health and productivity, related paid
time o and work/lie balance issues. NBGH members
provide health coverage or more than 50 million U.S. workers,
retirees and their amilies. For more inormation about the
NBGH, visit www.businessgrouphealth.org.
About Towers WatsonTowers Watson is a leading global proessional services
company that helps organizations improve perormance through
eective people, risk and f nancial management. With 14,000
associates around the world, we oer solutions in the areas
o employee benef ts, talent management, rewards, and risk and
capital management.


