186
Town of Van Buren Planning Reference Guide & Comprehensive Plan May 2002

Town of Van Buren Planning Reference Guide
& Comprehensive Plan
May 2002


TOWN BOARD
TOWN CLERK
HIGHWAY SUPERINTENDANT
PLANNING BOARD
ZONING BOARD OF APPEALS
ZONING OFFICER
TOWN ATTORNEYS
TOWN ENGINEER
TOWN OFFICIALS
Supervisor Mary M. Crego Councilman Daniel Quackenbush, Deputy Supervisor Councilman Harold Johnson Councilman Wade Marvin Councilwoman Darlene O’Kane Councilman John Resseguie, Sr Councilman Arie Scholten
Sharon Klementowski
Edward L. Parks
Anthony Geiss, Chair Harold Crandon Charles Farrell Norma Goodman James Ruddock Derek Stolp Frederick Thomas
John Virginia, Chair Ron Abold James Bowes Robert Cleverley Allen Mitts
David Pringle
Stokes & Knych Mackenzie Hughes
Barton & Loguidice

PlanningConsultantsfor this Project
• Allen R. Lewis, AICP, Project Director • Nick Colas, Environmental Consultant • Kurt Schwenzfeier, Design Guideline Consultant • Jan V. Brath, Graduate Assistant • Todd Canterino, Graduate Assistant • Noah Casler Hitt, Research Assistant
Appreciation Appreciation is extended to all who helped make this Comprehensive Plan
Possible. Without their effort and knowledge, this project would never
have been completed. A special thanks is extended to the Planning Work-
shop Class, Spring 2001, from SUNY ESF for all of their hard work and
effort. They include:
• Mario Albert Colone • Heather Dora Davis • Jamie Patrick Earl • Cory M. Jenner • Jesse Michael McLean • Megan Anne Tennermann
• John Resseguie, Sr., Chair • Ron Abold • Charles Bowers • James Bowes • Rosemary Bucci • Nadine Cole • Mary M. Crego • Charles Farrell • Theresa Golden • Norma Goodman • Eric Mau • Elizabeth McCarthy Bowers • Marc Michalet • Paul Morrissey • Darlene O’Kane • Bruce Porter • David J. Pringle • Arie Scholten • Martin Strodel • Howard Tupper • Darlene Van Der Water • Joseph P. Virkler • Daniel Quackenbush • John Virginia
Land Use Committee

In Memory of James Kilgallen
JAMES KILGALLEN APRIL 2, 1939-OCTOBER 19, 2000
Jim was a Van Buren resident since May 5, 1974. He lived on Comstock Road with his wife Wanda. They had two children, son James, Jr. and daughter Cory. His grandchildren, Kara and Colin, were the joy of his life and he spent as much time with them as possible. Jim worked for the Onondaga County Highway Department for 33 years, retiring in 1991. After “retirement” he worked for the Raddison Community for another 8 years. Jim became very involved in town government after retirement and served on the Planning Board and the Board of Assessment Review. He was also a very regular attendee at Town Board Meet-ings. Jim was most noted for his volunteerism. When Cecil Reeves donated the property on Downer Street for Little League fields, Jim was right there bulldozing and grading the property to get it ready for the baseball diamonds. He gave countless hours of his time for this and other projects. Jim’s pride and joy was his truck and he was always putting something new on it or washing it. He finally got his street rod and enjoyed riding around town in it with his family. We will all miss his corny jokes and his larger than life smile. He was a man that you could be proud to call a friend.

TABLE OF CONTENTS
Introduction
Historical andRegional Background
Part I. Reference Guide
I. The Planning Process 3
II. Historical Development 9
III. Town of Van Buren Photo Survey 27
IV. Regional Context, Population, and Economy 37
V. Environmental Factors 55
VI. Land Use and Transportation 77
VII. Public Utilities 93
Part II. Comprehensive Plan
I. Summary of Plan 99
II. Agricultural and Open Space 107
III. Residential Areas 113
IV. Commercial Areas 135
V. Industrial/Employment Center Uses 149
VI. Transportation 161
VII. The Comprehensive Plan Diagram 175
Natural Resources and Socio-Economic

LIST OF ILLUSTRATIONS
Maps
Tables
Figures
Reference Guide4.1 Population Central New York Counties & Percent Change 38 4.2 Estimate of Net Migration 39 4.3 Population and Percent Change 40 4.4 Existing Population by Age & Projected Population by Age 42 4.5 Population, Town of Van Buren & Village of Baldwinsville 44 4.6 Labor Force 46 4.7 Average Persons per Household 49 4.8 Number of Single-Family & Multiple-Family Housing Units 50 4.9 Permits, Municipalities, Onondaga County 52 4.10 Residential Building Permits 53 4.11 Number of Home Sales and Average Home Sale Value 53 6.1 Land Use by Acre 80 6.2 Land Use Among Suburban and Rural Portions 81 6.3 County Roads 90 6.4 Traffic Counts 91
Reference Guide1.1 The Planning Process for the Town of Van Buren 8 4.1 Population , Central New York 38 4.2 Population, Onondaga County 41 4.3 Onondaga County by Age 41 4.4 Residential Building Permits, Onondaga County 51 4.5 Residential Building Permits, Town of Van Buren 51 4.6 Home Sales 51 6.1 Transportation-Land Use 88
Comprehensive Plan6.1 Street Classifications 167
Reference Guide4.1 Regional Location 37 4.2 Physiography 37 5.1 Surficial Geology 58 5.2 Major Aquifers 58 5.3 Well Yield 59 5.4 Soil Texture and Hydrologic Group 62 5.5 Suitability of Soils for Dwellings with Basements 63 5.6 Suitability of Soils for Septic Systems 63 5.7 Elevation 66 5.8 Percent Slope 66 5.9 Surface Water 66 5.10 Special Flood Hazard Areas 68 5.11 NY Regulatory Wetlands 72 5.12 NWI Wetlands 73 5.13 Land Cover 75 6.1 Land Use 79 6.2 Settlements 77 6.3 School Districts 82 6.4 Fire Districts 83
Comprehensive Plan5.1 Sanitary Districts 155 5.2 Water Service Area 155 5.3 Suitability of Land for Employment Center Uses 155 7.1 The Comprehensive Plan Diagram 177

Town of Van Buren 1
Part I. Reference Guide

Planning Reference Guide 2

Town of Van Buren 3
I. Introduction
Planning Process
A town government faced with the challenge of preparing a comprehensive
land use plan must utilize a process which insures highly effective use of
the energies and resources of those participating in the project. This section
presents a concept of a process for preparing a plan, which includes six
major steps:
1. Collecting and Analyzing Data; Identifying issues, Problems and Oppor-
tunities
2. Formulating Goals and Objectives
3. Developing the Plan
4. Adopting the Plan
5. Implementing the Plan
6. Monitoring Implementation and Updating the Plan
The relationships among the steps of this conceptual, simplified model are
illustrated in Figure 1.1 on page 8.
Although the steps are illustrated as separate activities transpiring in se-
quence, it is important to understand that in reality distinctions between
steps often become blurred. Nonlinear feedback and re-evaluation occur
throughout the process.
The diagram shows that citizen participation, intergovernmental consulta-
tion, and environmental reviews are also important aspects of the process.
These considerations will be addressed following a discussion of the six
major steps.
Introduction

Planning Reference Guide 4
Collection and Analysis of Data; Identification of Issues, Problems, and Opportunities
Careful, in-depth collection and assessment of data and background infor-
mation pertaining to existing conditions and trends serve as the basis for
the many decisions that need to be made in order to complete a plan. To
gain an understanding of conditions in the Town, how the Town’s charac-
teristics might change, and how a plan might best serve the community,
basic studies addressing population, housing, land use, and the economy
are undertaken during this first stage in the process. Hard base-line data on
regional and local infrastructure is also obtained. Whenever information
might be made more useful by displaying it geographically, maps are pre-
pared.
The issues, problems and opportunities identified during this early stage of
the planning process help to focus attention on the most relevant concerns
requiring analysis.
A Planning Reference Guide summarizing the results of the initial research
is presented as soon as an adequate amount of data and background infor-
mation is obtained.
Formulation Goals and Objectives
Goals are the general expressions of community values that provide the
direction for development in the Town. They define the ends toward which
the Town intends its planning efforts to lead. Objectives are the more
quickly attainable intermediate steps toward achieving a goal.
During this stage in the process a community consensus on a set of goals
and objectives begins to be built. Proposed goals are evaluated, and rela-
tionships among the selected goals are discussed.
Introduction

Town of Van Buren 5
Developing the Plan
The objectives that have been decided upon are the directives and criteria
for action that next must be translated into definite plans. Alternative sets
of policies and proposals are developed during this stage. The alternatives
address the amount, scale, location, and type of future development. Nar-
rower concerns that were identified earlier in the process are also focused
upon. A preferred plan is selected after evaluating the alternative policies
and proposals with respect to potential environmental, economic and social
impacts.
Adopting the Plan
The draft is revised to reflect any changes that have
been recommended, and the final draft is adopted by resolution.
Implementing the Plan
Implementation measures that follow from the adopted policies need to be
considered and adopted in order for the plan to be truly effective. Such
measures typically include zoning and subdivision regulations as well as
other development guidelines and plan review procedures. Realistic plan
policies are, of course, the key to implementation. A feasible plan is one
containing policies which were developed with implementation measures
in mind.
Monitoring Implementation and Updating the Plan
Since conditions change over time in every town, the plan must not remain
unaltered indefinitely. Constant monitoring of the plan is necessary.
Shorter-term plan proposals focusing most directly on implementation
should be reviewed and revised periodically (annually, for example). When
there is a broad consensus that policy changes are warranted, amendments
to the plan should be considered. Extreme care must be taken, however,
that consistency within the plan is maintained, and that amending it too
Introduction

Planning Reference Guide 6
frequently does not erode the plan.
Although the plan is intended to serve as a guide to decision making well
into the future, eventually there will come a point when needs have altered
to the extent that overall revision is required.
Citizen Participation
Citizen participation was encouraged throughout the planning process to en-
sure that the plan responds to the needs of the community as effectively as
possible. An advisory committee of Town residents appointed by the Su-
pervisor and chaired by a member of the Town Board was formed to re-
view drafts of planning reports. Public presentations, discussions, and
hearings provide opportunities for involvement of any other citizens who
are interested in taking part.
Citizen involvement is most important in identifying major issues and op-
portunities, identifying community goals, evaluating alternative plans, and
selecting the preferred alternative. Participation in formulating alternative
policies is also enormously helpful.
The significance of securing active participation of Town residents cannot
be overstated, since the success of the plan ultimately depends on the ef-
fectiveness of the citizen participation program.
Intergovernmental consultation
Mutual understanding of the concerns of all relevant local and county
agencies is essential in the preparation and implementation of the Town
Plan.
Conflicts between the Town and other governmental agencies can be
avoided and more useful policies result by contacting these entities early in
the planning process, exchanging plans and information as necessary and
maintaining a relationship conducive to ongoing consultation and negotia-
tion.
Introduction

Town of Van Buren 7
Environmental Review
Review of plan policies and proposals with respect to their potential envi-
ronmental impacts is fundamental to the planning process. All such assess-
ment and evaluation is carefully documented, with environmental condi-
tions and effects described fully.
Plan preparation and environmental review are essentially parallel activi-
ties. Background information relating to natural systems obtained during
the data collecting phase of the plan preparation process is incorporated
into the environmental review document. Similarly, the analysis employed
in the environmental evaluation of alternative policies during the develop-
ment of the plan is the same as that utilized in the required evaluation of
possible environmental impacts of the plan.
Conclusion
In its broadest interpretation, planning is an approach to problem solving, a
process for dealing with existing conditions and providing for future needs.
Through its preparation, adoption, implementation, and maintenance the
Town Plan will serve as an identifier of community goals as they relate to
land use and development, providing citizens with opportunities to partici-
pate in the process of Town government, establishing a guide to decision
making, and informing everyone of the ground rules that will guide devel-
opment in Van Buren for well into this century.
So while change is inevitable, its effects on the nature of development are
not predetermined. The continuous, cyclical planning process outlined in
this section will enable the citizens of Van Buren to translate their values
and goals into policies and standards, and use these standards together with
their knowledge and experience to control the future and provide for a
quality environment.
Introduction

Planning Reference Guide 8
Figure 1.1 The Planning Process for the
Town of Van Buren
Collect and Analyze Data
Identify Issues, Problems, and
Opportunities
Formulate Goals and Objectives
Adopt the Plan
Monitor Implementation and Update
the Plan
Environmental R
eview
Citi
zen
Parti
cipa
tion/
Inte
rgov
ernm
enta
l Con
sulta
tion
Develop the Plan
Implement the Plan
Introduction
Feedback
Feed
back

Town of Van Buren 9
II. History of Development
The development history of Van Buren is the interrelated history of land,
transportation, and human activity. The land has seen the Native Ameri-
cans come and go. The land has seen the establishment of agriculture, the
industrialization of agriculture, the consolidation and even disappearance
of some agriculture. Settlers cleared the land, farmed the land, built homes
and communities, and engaged in commerce. Those who followed the set-
tlers down to the present time, continue to farm, to build homes and com-
munities, and to engage in commerce.
Transportation underlies the development history of Van Buren. Less then
two-hundred years ago the Seneca River, Dead Creek, and a few Indian
trails that were only slightly modified by the settlers, were the means of
transportation in Van Buren. They limited the extent of settlement in Van
Buren. Early road and turnpike building followed by canal building and
railroad building each in turn influenced the amount and location of settle-
ment.
Ultimately, the canal gave way to the railroad. Later trolley cars and fi-
nally the mass-produced automobile and paved highways made their im-
pact on the Town. The trolley cars and railroads for the most part went the
way of the canals. The Interstate Highway system and modern cars and
trucks created new patterns of development in the Town.
Geological Development
Many years before the first human inhabitants, the region that is now the
Town of Van Buren underwent vast geological processes and climatic
changes. These earliest events shaped the land, created the creeks and de-
posited the soil.
Van Buren bedrock formed millions of years ago, and, as a result of fur-
ther processes, the shape of the land was changed. Glaciers, which periodi-
cally formed and receded, left behind much of the rich agricultural soils
and flowing streams found in the Town today. Consequently, these are the
History of Development

Planning Reference Guide 10
elements, which contributed to Van Buren’s development into an agricul-
ture and manufacturing community.
Onondaga County is divided into two quite different physiographic re-
gions: the low, rolling Erie-Ontario Lake Plain to the north, and the more
rugged, hilly Allegheny Plateau to the south. The Town of Van Buren is
situated at the boundary of these two regions, a transitional area of hills
and valleys.
1788 -- End of the Native American Era
What is now the Town of Van Buren was transferred from the Iroquois
Confederacy to New York State in the Treaty of 1788. The Treaty set the
stage for the subdivision of land and the arrival of the first pioneers over
the traditional Indian water routes and trails.
Before the European colonization of North America, the Onondagas inhab-
ited the area that is now Van Buren. The Onondagas were part of the Iro-
quois Confederacy, or Haudenosaunee Nation, that included the Seneca,
Oneida, Mohawk, Cayuga and later the Tuscarora people. Long before the
arrival of the Europeans, the Onondagas roamed much of the land that is
now Van Buren, south from Onondaga Lake, north to Oswego.
In 1779, the settlements of the Cayugas and Senecas were disrupted by
Continental troops, while other expeditions at this time attacked the Mo-
hawks and Oneidas to the east. A detachment under Colonel Van Schaick,
burned the villages of the Onondagas south of Onondaga Lake. The mili-
tary expeditions of 1779 brought an end to the power of the Iroquois Con-
federacy, allocating the lands of the Onondaga country interior region to
the State for settlement under their authority.
A treaty of peace was signed at Fort Schuyler in 1784 between the United
Colonies and the Iroquois Confederacy. The territory of the present Town
of Van Buren was part of the region that passed from the Iroquois Confed-
eracy to the State by a treaty signed in 1788. There was no settlement in
the Town during this period, although pioneers had begun to venture into
History of Development

Town of Van Buren 11
parts of the Onondaga country.
The tide of pioneers increased after the Treaty of 1788 seized the Onon-
daga lands, turning them over for settlement under State authority. On Feb-
ruary 28, 1789, an act was passed requiring the land-office commissioners
to direct a survey of the Military Tract under the surveyor-general of the
time, Simeon Dewitt. Legislative enactment had given specific directions
as to how the tract was to be laid out. A Town was to have one-hundred
lots with each of these to be made up of as close to six hundred acres as
could be determined.
Out of the State land survey of 1789, two phrases came to be commonly
used to describe the tracts of land from the old Dewitt survey. These were
the “States hundred” and “Survey-fifty.” They are applied to certain tracts
of land of either fifty or one hundred acres each, which are scattered all
throughout the County and were included within the bounds of the old
Military Tract. These were set aside and reserved by the State to be granted
to private owners.
The Revolutionary soldier was entitled to five hundred acres from the State
and one hundred more from Congress. The one hundred acre portion
granted by Congress was only done so after the soldier gave in return an
assignment of his Congressional grant. In many cases such an assignment
was not made and as a consequence, the State reserved one hundred acres
from the lot granted to the veteran. These one hundred acre lots were laid
out in square form in the corner of the six hundred acre lots. In about 1795
these lots were sold off to land speculators, described as the “State’s hun-
dred acres.” There are seven of these tracts in the Town of Van Buren.
The “Survey-fifty” tracts were much more common than the States hun-
dred. At the time the townships of the Military Tract were surveyed into
lots, it was not the policy of the State to bear all of the expenses of the sur-
vey work. A statute of 1790 stated that a fee of forty-eight shillings was to
be assessed on each lot to pay for the expenses of the survey.
In case this assessment was not paid within two years, the surveyor-general
History of Development

Planning Reference Guide 12
was instructed to reserve and sell a fifty-acre tract in one corner of the lot
to be laid out in square form. There were fifteen of these fifty-acre lots lo-
cated within Van Buren.
The Treaty of 1788 turned what is now Van Buren over to the new Ameri-
can Government. The subdivision of land and its distribution to Revolu-
tionary War soldiers hastened the arrival of the first pioneers. The first pio-
neers used the rivers and streams long used by Native Americans to reach
the Van Buren area. These early pioneers would continue to use the rivers
and would quickly expand the trails and turn trails into roads.
1792-1825 Pioneers, Road Building, Early Settlements, and the Erie Canal
The pioneer period begins with the first pioneer to arrive in 1792 and ends
with the completion of the Erie Canal in 1825. In between, a lot of road
building opened a lot of land for settlement and clearing of fields for
History of Development

Town of Van Buren 13
farming. Home and communities are established. Settlements and indus-
tries are located to serve the agricultural needs of the area. Travel on the
Seneca River brings economic activity to the area, and the first economic
activity is established in Syracuse that impacts Van Buren. Finally, some
road building activities outside the present Van Buren have an impact in-
side Van Buren. At the end of a very exciting period of great activity, the
need is established for creating a town government for what is now Van
Buren.
Early Settlers.--One of the earliest settlers to the area was John McHarrie
who arrived in 1792. He built and lived in a log cabin for many years.
McHarrie probably reached the area by one of the two earliest highways of
travel to the region—water or old Indian trails. It was near the trails or the
river that the earliest settlers established themselves.
With the exception of lakes and streams, the earliest routes of travel in the
area were the Indian trails. The first pioneers moved by packhorse on trails
that had been deeply worn from centuries
of use. A party of pioneers established the
first road through the region about 1791,
extending from Whitesboro to Canandaigua
across the present Town of Van Buren.
Some years later the road was improved
when the Old State Road was built; it
enlarged and followed the same general
route as early pioneers’ road. The Old
Genesee Road was another trail that was
surveyed and laid out as a public road very
early in this period.
The Seneca River and Camp Brook, now
Dead Creek, played an important role in providing a corridor of easy pas-
sage into the area along with the newly established roads. As new pioneers
arrived they established farms further and further away from the roads and
the river and creek.
History of Development

Planning Reference Guide 14
The place that John McHarrie choose to locate was along the banks of the
Seneca River near some rifts. The spot was rich in fish and game. McHar-
rie realized an economic opportunity. He helped boats through the rifts on
their up trips. The place became a well-known locality, was a stopping
place for river traffic, and became known as “McHarrie’s Rifts.”
In August of 1798, the Seneca River was declared a public highway by the
act of the State Legislature. River traffic increased with immigrants travel-
ing from New York City to the West along the waterway system including
the Seneca River. Goods entered the region from the Mohawk. Pioneers
built homes along the banks just as John McHarrie did in 1792.
Development of the Onondaga region was further stimulated by the im-
provement of natural waterways by the Western Inland Lock and Naviga-
tion Company. Canal facilities were constructed from Oneida Lake on
Oneida, Oswego, and Seneca Rivers; running north to Oswego and further
west to the central part of the State. Work was completed in 1800; many of
the first settlers in Onondaga Country carried their families over this route.
Road Building.--The systematic laying out of regular roads began early in
the century in accordance with settlement advances. In the year 1804, the
State ordered the survey of the road from the Onondaga Court House to
Oswego. The road was laid out fairly straight
between the two points and hastened the devel-
opment of the eastern part of Van Buren, and
was an important factor in the growth of the
McHarrie-Baldwin settlement. The road crossed
through “Belle Isle”, Amboy, Van Buren Cor-
ners, and Baldwinsville. In the war of 1812 it
assumed an important role in the movement of
troops. After 1817, and possibly before that, it
was a post-route. This is present day Van Buren
Road.
A short time after this, deed records make reference to other roads, and
History of Development
Town of Van Buren 15
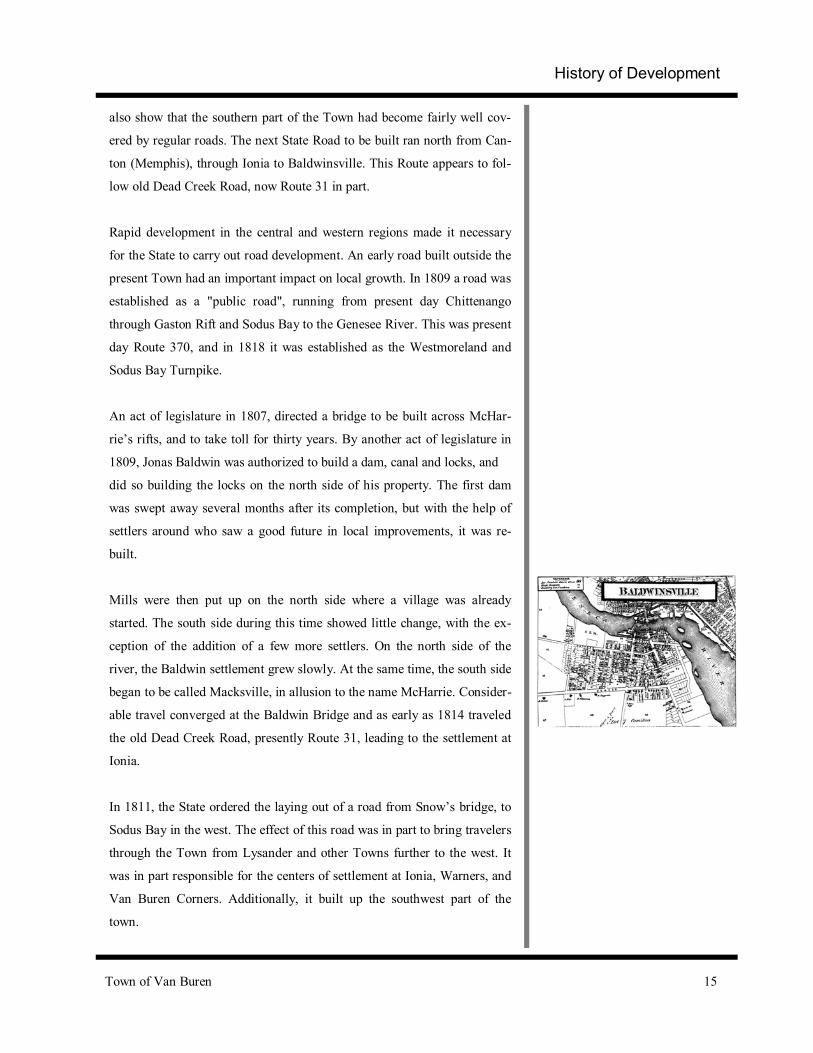
also show that the southern part of the Town had become fairly well cov-
ered by regular roads. The next State Road to be built ran north from Can-
ton (Memphis), through Ionia to Baldwinsville. This Route appears to fol-
low old Dead Creek Road, now Route 31 in part.
Rapid development in the central and western regions made it necessary
for the State to carry out road development. An early road built outside the
present Town had an important impact on local growth. In 1809 a road was
established as a "public road", running from present day Chittenango
through Gaston Rift and Sodus Bay to the Genesee River. This was present
day Route 370, and in 1818 it was established as the Westmoreland and
Sodus Bay Turnpike.
An act of legislature in 1807, directed a bridge to be built across McHar-
rie’s rifts, and to take toll for thirty years. By another act of legislature in
1809, Jonas Baldwin was authorized to build a dam, canal and locks, and
did so building the locks on the north side of his property. The first dam
was swept away several months after its completion, but with the help of
settlers around who saw a good future in local improvements, it was re-
built.
Mills were then put up on the north side where a village was already
started. The south side during this time showed little change, with the ex-
ception of the addition of a few more settlers. On the north side of the
river, the Baldwin settlement grew slowly. At the same time, the south side
began to be called Macksville, in allusion to the name McHarrie. Consider-
able travel converged at the Baldwin Bridge and as early as 1814 traveled
the old Dead Creek Road, presently Route 31, leading to the settlement at
Ionia.
In 1811, the State ordered the laying out of a road from Snow’s bridge, to
Sodus Bay in the west. The effect of this road was in part to bring travelers
through the Town from Lysander and other Towns further to the west. It
was in part responsible for the centers of settlement at Ionia, Warners, and
Van Buren Corners. Additionally, it built up the southwest part of the
town.
History of Development

Planning Reference Guide 16
Ionia Settlement.--The first place in the Town to become a population cen-
ter was Ionia. Its existence as a settlement dates from about 1813; it was at
this point when the state road toward Sodus Bay was laid out. This south-
west portion of the Town was the oldest settled and generally the most ad-
vanced. The first buildings in the section were log cabins, but in 1808 the
first frame house appeared, built by Joseph Wilson. By 1829 frame houses
were being built to replace the cabin residences.
The early populations of the Town were small and scattered through the
area so few schools were needed. The first one room school was estab-
lished at Ionia in 1813. At this same school in 1816, the first library was
founded. About this time, John Tappen gave land to the west of the corners
for the first cemetery in the Town.
When the State road, present day Route 173, was located through Ionia in
1813, the route became well traveled and a bridge was constructed cross-
ing the Seneca River. This caused a change at “Barns Corners” as the lo-
cality had been called. A post-route was extended over the new highway
and Charles H. Toll built the first tavern for passers by. A justice court
with Toll as justice was established in 1814. The place was now a growing
settlement with great prospects for the future.
Warners Settlement.--Warners settlement was located around the junction
of the Old State Road and the newer State Highway at a later date in the
center of Lot 40. In the year 1807, the members of the Warner family that
settled in the area were numerous enough to give the village its name. In
1813, the first schoolhouse was built, becoming a community center. This
was also the location of the first Baptist Society in the settlement.
In 1818, a tavern was started just south of the crossroads on the State High-
way. A moderate amount of travel passed along the road passing from
Ionia Corners through Warners to the Van Buren settlement, connecting
the two State Highways.
History of Development

Town of Van Buren 17
After establishment of the tavern, other permanent services began to fol-
low. A county store was located in the settlement as early as 1821. A
blacksmiths shop was established in 1829. A post office was established in
1837, it was called Van Buren Center, using that name for many years with
great trouble to the postmaster. The name was changed back to Warners in
1870.
The building of the railroad, a little south of the old settlement, changed
the center of the locality to its present location. However, once the railroad
was built to Oswego in 1848, the corners lapsed into a quiet that never re-
ceded.
Industries.--Industries applicable to the requirements of the people flour-
ished in and around the region in the 1800’s. Sawmills were necessary
from the beginning to provide the raw materials for building, and gristmills
were soon to follow. These were built at strategic locations on streams and
rivers for waterpower purposes. One of the first sawmills was built at
Jack’s Reef in 1808, another in Whiskey Hollow in 1815. The first grist-
mill in the Town was built a little north of Bangall on lot number 19 in
1817. The Clark and Mercer Mill was built in 1828, and is still intact.
In 1820, the growth of the salt-boiling industry at Syracuse brought a de-
mand for wood that gave a ready market to the timber owners along the
Seneca River. Regular highways were then existent leading down to nu-
merous boat landings where the timber was stocked, awaiting shipment.
Canal Building.-- The value of water transport had been realized since the
first explorers ventured into the region in early Colonial times. It had the
advantage of being both faster and cheaper than overland travel, but be-
cause of the limited capacity of the existing natural waterways its use was
restricted to small bulk high value items, such as furs. The natural water-
ways of the region were realized to be an attractive but inadequate option
to overland travel.
Early attempts at canal building were directed at improving natural water-
ways by dredging, constructing levees, and building short canals to avoid
History of Development

Planning Reference Guide 18
rapids. The demands that traffic made combined with natural factors
caused these to be abandoned soon afterward.
In 1817 construction began on the Erie Canal that extended from Albany to
Lake Erie, creating a direct connection from the east coast the to mid-west.
This revolution in transportation of goods and people crossed the southern
boundary of the present Town of Van Buren, of what was then the five
County Region. The Erie Canal was completed in 1825, and the develop-
ment of new feeder canals in conjunction with those existing such as the
Oswego, Seneca, Cayuga, and Baldwinsville Canals virtually made the
whole region accessible by water transportation.
The settlement of Memphis dates to the year 1821, when surveyor George
W. Robinson was employed to lay out a village along the bank of the Erie
Canal, to be named Canton. The name Canton was already used by a vil-
lage in St. Lawrence County, so the name of Memphis was used to avoid
confusion.
These developments occurred at the full tide of prosperity for the village of
Ionia. With the construction of the Erie Canal, and the accompanying Vil-
lage of Canton laid out less than a mile away on the new highway of com-
merce, the post-route over the state road was abandoned. Any new devel-
opment in the area was now done close to the new Erie Canal in Canton.
The future growth of Ionia became a dream of the past.
The Pioneer Period Ends.-- Nearly forty years after opening of the Military
Tract for Revolutionary War soldiers in 1790, the Town of Van Buren was
established in 1829. Never have so few done so much in such a short time
in Van Buren. Areas of the Town were cleared and put into agricultural
cultivation. Roads, economic activities, and settlements were established.
The 1807 State Census identified only forty names of individuals in the
Van Buren area who owned or occupied freeholds and were entitled to
vote under the laws of the day. By 1829, the base was established for
nearly a century of prosperity.
History of Development

Town of Van Buren 19
1829-1919 The Town Established, the Railroad Era and the In-dustrial Revolution
A great change in transportation occurred in the early 1800’s as advances
in technology led to the introduction of the railroad. By 1839, railroads
were being constructed from Syracuse east to Utica and west to Auburn.
These early rail lines were considered adjuncts to the canal system. The
first railroad built through Van Buren was the Oswego & Syracuse, which
skirted the northern edge of the Town in 1848.
In the year 1851, the south side of Baldwinsville began to rival Canton. At
this point, the railroad was built through the Town, starting the building up
of railroad terminal cities at the cost of the surrounding canal villages.
Memphis was one of these areas whose future of growth was ended.
A successor route was built by the Delaware, Lackawanna & Western
Railroad that ran five passenger trains in each direction each day. By 1853
the independent railroads became the New York Central System that ran
through the southern tier of Van Buren, following very closely the line of
the early canal. During these years, an endless number of trains were oper-
ating on the New York Central’s four tracks running through the southern
part of the Town.
During the 1850’s agriculture began to expand as a result of transportation
and facilities increasing the possibilities for trade and development. By
1854, the Town of Van Buren had 5,216 acres plowed, with an additional
4,557 in pasturelands totaling 9,773 acres used for agricultural purposes.
This is roughly the amount of acreage still used to date. The early years of
agriculture within the Town were comprised of smaller self-sufficient
farms producing fruits, vegetables, and livestock for the purpose of com-
merce and personal use.
Cheap water transportation in addition to the railroad increased eastward
shipment of grain from fields farther west. This caused the farmers of cen-
tral New York to turn their attention to general farming, dairying, tobacco
and fruit growing. Many grain fields were turned over to pasture and
History of Development

Planning Reference Guide 20
meadow for livestock. Large barns were built for livestock, hay and to-
bacco storage.
In 1883, the New York West Shore & Buffalo Railroad completed a steam
line running parallel to the New York Central lines. In 1885, a short line
was built by private capital from Baldwinsville to Amboy Station on the
West Shore. The development of the railroad as a fast and efficient trans-
portation compared to freight and passenger carriers started to overshadow
the Canal System.
The first trolleys were in operation in the Town of Van Buren starting in
1899. The first line connected Baldwinsville to Syracuse, passing through
the northern part of Van Buren. Several years later a second track was
added, and service was extended to Oswego. An interurban trolley fran-
chise ran east and west passing through Warners and Memphis, on the way
towards Auburn and Rochester in 1909. The development of the motor car
during the next development period doomed the trolleys. The Syracuse &
Oswego Trolley line and the east-west line both ceased around the year of
1932.
The development of these transportation systems helped join the counties
of the region together into one economic unit, providing the foundation for
future growth. The physical development of the region during the 19th Cen-
tury involved both settlement of the countryside and the growth of urban
places. Agriculture began to go through a period of expansion, utilizing all
suitable lands as a result of improvements in transportation, allowing prod-
ucts to be shipped to distant markets.
Improvements in transportation also aided in the growth of central places
within the region. The canals and railroads were being maximized, causing
many small towns to grow and take on characteristics that come with a
more urbanized setting. By the 1840’s, the housing stock within the Town
began to reflect the phase of growth and prosperity at hand. Many houses
were now being constructed of brick, the first being built by Thomas
Marvin in Warners who used brick from his newly established brickyard in
History of Development
Example of 1910 trolley
Example of a local brick home

Town of Van Buren 21
the Town.
By the years just preceding the Civil war, and for years to follow, better-
designed wood frame homes were also being built. These were often a
modified form of Greek revival architecture. Hamlets within Van Buren
along the canals and railroads grew due to their strategic locations in rela-
tion to these major routes of transportation. The new transportation net-
work established the region as a gateway to the interior; the ever-
increasing volume of trade with the newly settled west demonstrated this.
The Erie Canal, completed in 1825, stretching along two miles in the
southern part of the Town and had great influence on the development and
demise of several Hamlets within the Town in the early years. The "Great
Ditch" as it was called was now facing its own fate due to increases in
technology and transportation methods. The Erie Canal was closed for
good in the year 1920, but option for water transportation was not totally
eradicated. At the time the Erie was being phased out, the state opened the
larger Barge Canal System in 1918, reverting back to the Seneca River
Route. This is still in use at present day Lock #24, and bisecting Baldwins-
ville.
At one time, the cheapest way to ship goods from Philadelphia to Pitts-
burgh was by way of Albany, the Erie Canal, and Lake Erie. This domi-
nance began to diminish just prior to the Civil War, when the railroads be-
gan to move westward from coastal cities.
During the period before, during and after the Civil War, the region includ-
ing Van Buren, as a characteristic of the North continued to develop indus-
trial and transportation facilities. The Northern economies were bolstered
by war efforts’ demands, expanding every aspect of productive effort. The
Civil War gave the regional economy a boost that lasted long after the
War; these changes in the region were also a parallel to larger national de-
velopments.
The railroad era and the industrial revolution brought lasting changes to
Van Buren. Farms and farm families changed. Fewer children died in
History of Development
Lock #24 in Baldwinsville

Planning Reference Guide 22
childhood with the beginnings of modern medicine. Fewer children were
needed on the farms with the beginnings of mechanized agriculture.
The number of farms declined, but the size of the remaining farms in-
creased. Many children were attracted to factory jobs in the city.
The railroads allowed families to visit one another over long distances.
Frequent travel for business, education, or pleasure into Syracuse was pos-
sible. With the invention of the telephone, in 1876, and the widespread use
of electricity that followed development, everyday life for residents in Van
Buren began to change. Between the Civil War and World War I the econ-
omy experienced several booms and busts, but overall Van Buren pros-
pered.
1919-2001--The Automobile,Highways, and Suburbanization
In 1910, fifty-four percent of the population of the United States lived in
rural areas; in 1920, fifty-one percent of the population lived in cities. The
internal combustion engine was invented in 1885. In 1900, 8,000 automo-
biles existed in the United States. In 1909, a nineteen-year production run
began for the Ford Model T; 11,000 were produced that year and sold for
as little as $850. By 1917, 80,000 automobiles and 45,000 miles of railroad
tracks coexisted.
With World War I came prosperity. The roaring twenties were not very
prosperous to agriculture which faced over production and falling prices.
Consolidation of family farms continued. Automobiles began to impact
road construction with demands for concrete highways. Nearby Route 5
was paved during the 1920’s. Limited suburbanization began to occur in
parts of the country. Not much of this affected the Town of Van Buren.
The 1929 crash and subsequent depression did little to enhance the agricul-
tural base of Van Buren. A new federal program of home mortgage insur-
ance was established in the 1930’s that would eventually enable most mid-
dle class families to own a home. World War II and the post war period
brought on a wave of economic prosperity, increased automobile owner-
ship, interstate road construction, improved accessibility at the edges of
History of Development
An example of a Ford Model T

Town of Van Buren 23
central cities, and large-scale suburbanization. These factors had a large
impact on Van Buren.
The population of Van Buren remained relatively stable at about 3,000 un-
til after 1950. In 1960, the population doubled to nearly 6,500 and in-
creased by another 3,000 in 1970 and again in 1980. Thus, suburbanization
impacted Van Buren. Most of the additional families represented by the
population increases moved into the eastern edge of the Town near the Se-
neca River.
About 1954, the New York Thruway was the first major interstate level
highway built in Upstate New York. In Van Buren the Thruway ran along
the southern part of the Town roughly paralleling the east-west railroad
tracks and the Old Erie Canal. The Thruway provided an intersection with
Van Buren Road.
The road that provided immediate access to new development was Van
Buren Road. The road was laid out in 1804 as a relatively straight and flat
road between Onondaga Hill (site of the County Court House in 1804) and
Oswego (an important shipping port in 1804). The road’s connection to the
New York Thruway improved accessibility to the areas adjacent to Van
Buren Road.
Most of the residential development during the period of rapid growth oc-
curred between Van Buren Road and State Fair Boulevard (Route 48). In
addition to good highway accessibility, relatively flat land and provision of
utilities provided additional inducements to build large residential projects
in the area. The major developments are Seneca Knolls (1957-1962), Vil-
lage Green (1961-1999), and Harbor Heights (1965-1976).
The construction of Interstate 690, approximately parallel to State Fair
Blvd., provided additional access to the large residential developments. It
also provided better access for non-residential uses to locate on relatively
flat parcels serviced by utilities and near the interchanges.
History of Development

Planning Reference Guide 24
Not all the residential development in Van Buren occurred in the suburban-
ized eastern edge of the Town. Scattered residential homes often on rela-
tive large parcels (many over ten acres) have occurred in the rural part of
the Town. These scattered homes have an accumulative impact on the vis-
ual character of the rural landscape and on the ability of the old “farm to
market” roads to safely move increased traffic volumes. They may also try
to interfere with farming activities and may inhibit future large-scale de-
velopments by land-locking large parcels. The scattered home sites do pro-
vide an opportunity for land owners to realize some gains on their land in-
vestment.
The Future
Throughout the state, many canal-side Villages, Hamlets, and Towns that
the Erie Canal crosses have begun to realize the historical significance and
tourism potential of this state landmark. Other municipalities along the
Erie Canal have, with funding assistance started the restoration process to
facilitate tourism and preservation of this historically significant transpor-
tation route.
The Hamlet of Memphis still has many of the original canal buildings from
the 1800’s standing, but gradually deteriorating. The two-mile section of
the old Erie Canal that passes through Van Buren also has recreation po-
tential. This has already been realized by the citizens on the east side of
Syracuse, and through private effort and state recreational development the
Canal trail has been extended from Dewitt to Rome. The Town of Camillus
has initiated recreational development from Geddes to the Town of Van
Buren line. This has also been placarded as part of the Erie Canal Park.
The rich history of Town of Van Buren as a crossroad of rail, water and
highway in relation to manufacturing and agriculture remains a valuable
resource for the community today. Many historic buildings, including
those relating to the Erie Canal remain intact; some are well preserved,
while others are in need of repair. Besides its economic potential, the
Town’s history can provide residents with a shared past and sense of place.
In the past, Van Buren was vitally connected with the Syracuse region, and
History of Development

Town of Van Buren 25
went through changes in relation to what was happening to the region as a
whole. These historic regional ties are a potential economic development
tool for the Town in the future.
Change has been a persistent ingredient in Van Buren history. Agriculture,
industry, business, population, problems, and prospects all have gone
through changes from one generation to the next. These changes need not
mean only more complicated problems for the Town in the future though.
With an awareness and understanding of the forces leading to these
changes, the citizenry, businesses, and government can plan to take advan-
tage of the opportunities they offer.
Sources
Scisco, Louis Dow. Reprinted 1995. Early History of the Town of Van
Buren. Beauchamp Historical Club.
Central New York Regional Planning and Development Board. 1969.
Central New York Regional Historical Background. Central New
York Regional Planning and Development Board. Syracuse, NY.
History of Development

Planning Reference Guide 26

Town of Van Buren 27
III. Town of Van Buren Photo Survey
Fifteen members of the Land Use Committee participated in a photo-
graphic survey of the Town. The purpose was to identify the potential vis-
ual preferences and values of residents, to identify significant natural, cul-
tural, and visual resources, and to identify the attributes that contributed to
or distracted from the desirable qualities of the Town. Photographs were
taken in response to a nineteen question survey. Written responses were
supplied for each photograph.
Nearly 350 photographs were taken by members of the Land Use Commit-
tee. The photographs and accompanying explanations were organized by
question and mounted on display boards. The responses to the questions in
the survey were then summarized by question and included on the display
boards. The following pages provide a short summary of the resulting im-
ages and comments.
1. Take a photograph that you feel best represents the
image of the Town.
• Combination of elements: such as open space, interstate highway,
small to medium scale commercial development, residential pockets,
expansive views; more realistic and pragmatic image of the Town.
• Farmland and open space.
• Van Buren is a farming community turning into more residential –
open country is desirable.
• Shows agricultural land use – the largest percentage of the Town.
Photo Survey Analysis

Planning Reference Guide 28
2. Photograph your favorite two scenic views in the Town.
Explain what you like about them.
• Scenic Views of rolling farmland.
• Overlook of cornfields and country homes.
• Van Buren is a rural area with attractive residential housing .
• Nice view of farms and rolling hills.
• Enjoy views of the farmland and surrounding country.
• Open farmland and farm buildings.
• On a clear day you can see very far across the woods, and fields.
3. Think of one thing you feel should be changed in the
town. Take a photograph and comment on what you
would like to see done.
• I would like to see the Town acquire direct access to the Seneca River
behind the DPW facility for a public boat launch & fishing access and
possibly to develop a natural resource education facility.
• As the Town becomes more commercially developed, there is a need
to require new structures to fit in. If not, Certain areas will begin to
succumb to “Dewittisis” (or look like Erie Boulevard).
• It is sad that Tri-County Mall has been left to die. There is almost
nothing left there, what is left is not maintained or attractive to shop-
pers. Much of it is like an indoor flea-market.
• I would like to see the Erie Canal area in Memphis cleaned up and
turned into parkland.
• Meadow Street along the Seneca River should be developed for a
Town and Village Park cooperation.
Photo Survey Analysis
River behind DPW building
Tri-County Mall

Town of Van Buren 29
4. What would you never want to see changed in the
Town.
• The Van Buren Town Park, this is the biggest civic possession within
the Town that can be unequivocally utilized by all Town residents.
• Middle class homes, that are well kept and inviting to others; they are
conducive to responsible living. Hard to put into a photograph, I like
the feel of the country and the space here but I also like being twenty
minutes at the most from the city and activities there.
• People come from all around to get water at Whiskey Hollow, don’t
ever prevent that access.
• I don’t ever want to see the site on Turner Road become a landfill.
5. Photograph your favorite view of the riverfront and ca-
nal area.
• It is fun to see different boats and activity along the village river trail.
• The new park and amphitheater are a great improvement, likely to
bring people into the area.
• The new park and good use of the riverfront to draw new people into
town, and a gathering place.
Whiskey Hollow
Town Park
Photo Survey Analysis

Planning Reference Guide 30
6. Photograph a structure that you feel detracts from the
Town.
• Basic intrusion upon landscape, need to explore ways to integrate into
the existing landscape while exploiting market demands for more
transmission / relay facilities.
• Trailer-homes are not desirable in the Town of Van Buren.
• The Tri-County Mall facility is becoming unkempt, and an eyesore.
• Residential property with unattractive grounds, too many vehicles,
sloppy parking, no designated parking area, and vehicles for sale.
7. Photograph two residential buildings that you feel are
valuable to the Town.
• This represents stock of well built, reasonably priced homes for first
time and moderate- income buyers that are likely to remain occupants
for a long time.
• A farm home over 100 years old, well designed and needs to be re-
spected.
• A good depiction of a country setting.
• A well maintained historical farm property with natural areas adjacent.
• This is such a beautiful old home, well maintained with large trees. I
love driving by it all times of year.
• Gives historical perspective, represents richness and timelessness of
attention to simplicity and detailing, the iconography of the American
spirit.
Tri-County Mall
Cell Tower
Photo Survey Analysis
Town of Van Buren 31
Photo Survey Analysis
8. Photograph two non-residential (commercial, civic, etc.)
buildings that you feel are valuable to the Town.
• The Van Buren Town Hall, an important symbol of civic pride, the
location of interaction between community members and potential
members ( Developers/Businessmen etc.).
• Companies like Sysco create jobs and tax base for the Town.
• The Syracuse Home is an asset to local residents and the peaked struc-
tures fit well with the location. It also has good screening from the
road and adjacent residential areas.
• The Sunoco gas station is very convenient because there is generally
enough parking if you are stopping for something other than gas.
• The Town Building, has a professional look but, needs to be larger.
• The Family Sports Center, this brings a lot of people into the Town.
9. Photograph a structure that is not maintained, but
could be an important asset to the Town.
• A potential commercial property on the main road that is poorly main-
tained, elicits sense of residents apathy toward the Town’s character
and personal pride.
• The former roller-skating rink and cabinet shop, this is a solid struc-
ture out in the country that could be adaptively reused and is a possi-
ble asset to the Town.
• It would be great to see some decent stores move into the Tri-County
Mall.
• Mercers Mill is a historic structure that could be used as a museum or
other public use, becoming an asset to the Town.
Syracuse Home
Van Buren Town Hall
Mercer’s Mill
Tri-County Mall

Planning Reference Guide 32
Photo Survey Analysis
10. Photograph a well-maintained structure that you feel
does not fit in with the Town.
• All well maintained structures fit within the Town with the exception
of radio and communication towers.
• 84 Lumber has no landscaping, and poor architectural qualities; there
aren’t any visual amenities at all.
11. What do you feel has changed for the better in the
Town in the past ten years? If you have lived in the
town for less than ten years, what has changed for the
better since your arrival?
• P&C Warehouse, an example of commercial development and attrac-
tive location that is an efficient use of Town land.
• The Town is providing more activities for families and children in the
winter at the Town Park.
• Syracuse Home, McHarrie Towne is an attractive plan for senior hous-
ing, which fills a need for that segment of the population.
A variety of satellite dishes
P&C Warehouse
McHarrie Towne

Town of Van Buren 33
12. Photograph an outdoor gathering place important to
you.
• Lock #24 Seafood and Deli has a good comfortable atmosphere, with
a convenient location and unique surroundings.
• The Van Buren Town Park has activities for families like pool, tennis,
basketball, and animals are welcome.
• The Van Buren Town Park will continue to become more attractive to
Van Buren residents.
• The willingness of the Town to open the park to sledding in the winter
and fishing during the season is a very important utilization of Town
assets.
• The Van Buren Town Park is a very popular recreation area all year
long.
13. Photograph an indoor gathering place important to
you.
• The Family Sports Center, good place for year-round activity for chil-
dren / adults / families.
• The Van Buren Town building is the only indoor gathering place that I
even know of in the Town.
• The Warners Methodist Church is an important indoor gathering
place.
• The Lock #24 Seafood Restaurant, A good place to eat that is growing
with the Town.
• The “T”-Bird Bowling Lanes.
Photo Survey Analysis
Lock 24 Seafood and Deli
The Town Park
Thunderbird Lanes
Family Sports Complex

Planning Reference Guide 34
Photo Survey Analysis
14. Photograph an attractive street / road in the Town.
• Crandon Terrace in Village Green, non-linear street pattern creates
continuously variable perspectives and visual interest. Utilities are
hidden, street lamps fit the character of the area, the roads and proper-
ties are well maintained (Sense of community).
• Buccaneer Bend in Harbor Heights, I like the winding streets that Har-
bor Heights is full of. It is one of the nicest residential areas in Van
Buren.
15. Photograph what you feel is an example of attractive
commercial landscaping.
• Syracuse Home, natural and man-made elements that integrate
the building into its surroundings.
• The River Mall Rite-Aid is tastefully done and well maintained
• The McHarrie Towne entrance is very well done.
• The M&T Bank itself is attractive and different, being on an an-
gle. The grounds of the bank are also always well maintained.
• The Memphis Post Office, while very simply done has perenni-
als that come up from March to November so it is almost al-
ways colorful.
Memphis Post Office
Syracuse Home

Town of Van Buren 35
Photo Survey Analysis
16. Photograph what you feel is an example of less attrac-
tive commercial landscaping.
• The Microtel, it’s not that it is unattractive, but there is nothing around
it. They built a parking lot and put grass in front of the building, very
unimaginative.
• Nobles Plaza has run-down partially occupied buildings, there are
weeds in the black top, no shrubs or flowers.
• Absolutely no concession made for landscaping by a large commercial
enterprise, which can afford it. Total disregard for pride of place and
ownership beyond profit generation.
17. Photograph a commercial parking area you feel is at-
tractive.
• A building is separated from the roadway with the adjacent property
screened. The sign utilizes natural materials, individual craftsmanship,
and subdued lighting.
• There is no such thing as an attractive parking area.
• The River Mall Rite-Aid is well designed, neatly kept with good traf-
fic flow.
• The Syracuse Home has nice trees on the grounds and is well main-
tained.
• The M&T bank is easy to use, attractive and the grounds are kept up
well.
Microtel
Nobles Plaza
M&T Bank
Rite-Aid

Planning Reference Guide 36
Photo Survey Analysis
18. Photograph a commercial parking area that you feel
needs additional work to improve its appearance .
• Seneca Knolls has exposed dumpsters with no separation from the
roadway, asphalt in disrepair. It is directly adjacent to residential prop-
erties with no transition between uses.
• The Mobil gas station on State Fair Blvd. is crowded and remains un-
sightly.
• P&C Warehouse minimal landscaping that isn’t always maintained,
lots of wasted space.
• Tri-County Mall (rear) is poorly maintained. Often, one can find litter
scattered around the parking lot.
19. Photograph something that you feel is important to the
planning of the Town.
• The Rte. 690 corridor has the greatest potential for economic develop-
ment and tax revenue that the Town can exert some control over.
• Planning must offset the detriment to the Town with the landfill.
• Development of businesses in the area around the Baldwinsville exit
• The Town should not give in to short sighted demands of technologies
and other economic resources, which can spoil the Town’s natural at-
tractiveness that encourages residential settlement.
Mobil
River Mall
690 Corridor
Gypsum Trucking
Town of Van Buren 37
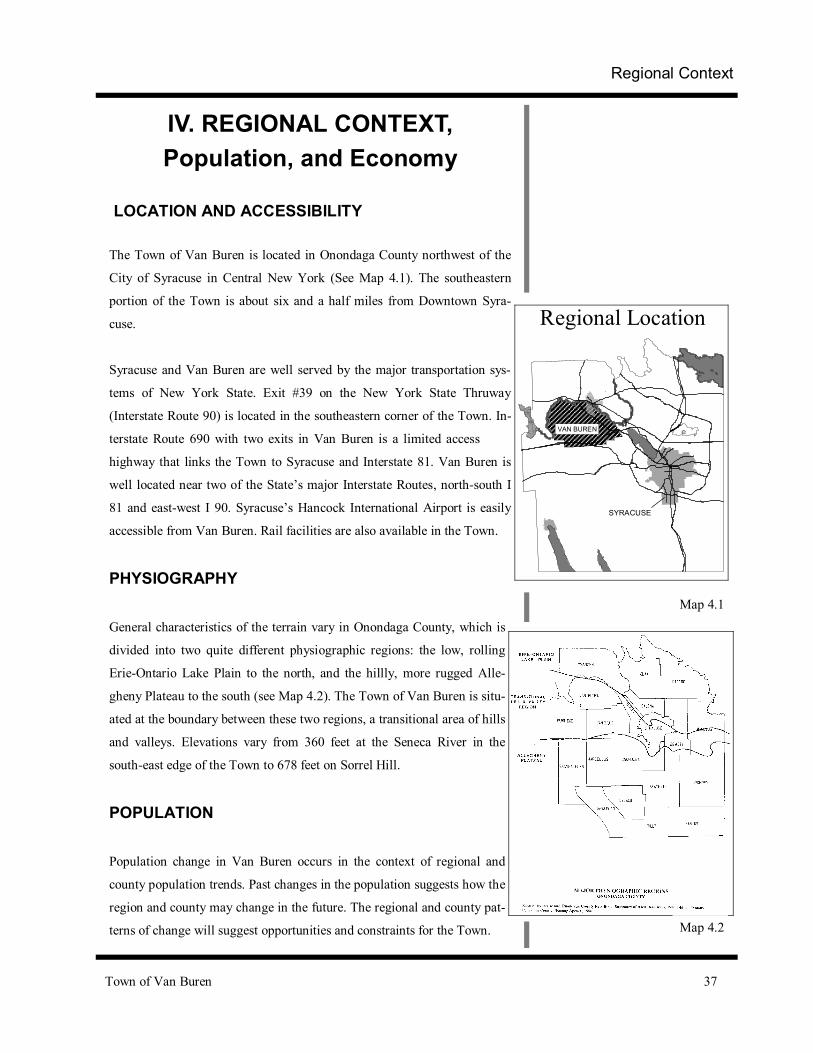
IV. REGIONAL CONTEXT, Population, and Economy
LOCATION AND ACCESSIBILITY
The Town of Van Buren is located in Onondaga County northwest of the
City of Syracuse in Central New York (See Map 4.1). The southeastern
portion of the Town is about six and a half miles from Downtown Syra-
cuse.
Syracuse and Van Buren are well served by the major transportation sys-
tems of New York State. Exit #39 on the New York State Thruway
(Interstate Route 90) is located in the southeastern corner of the Town. In-
terstate Route 690 with two exits in Van Buren is a limited access
highway that links the Town to Syracuse and Interstate 81. Van Buren is
well located near two of the State’s major Interstate Routes, north-south I
81 and east-west I 90. Syracuse’s Hancock International Airport is easily
accessible from Van Buren. Rail facilities are also available in the Town.
PHYSIOGRAPHY
General characteristics of the terrain vary in Onondaga County, which is
divided into two quite different physiographic regions: the low, rolling
Erie-Ontario Lake Plain to the north, and the hillly, more rugged Alle-
gheny Plateau to the south (see Map 4.2). The Town of Van Buren is situ-
ated at the boundary between these two regions, a transitional area of hills
and valleys. Elevations vary from 360 feet at the Seneca River in the
south-east edge of the Town to 678 feet on Sorrel Hill.
POPULATION
Population change in Van Buren occurs in the context of regional and
county population trends. Past changes in the population suggests how the
region and county may change in the future. The regional and county pat-
terns of change will suggest opportunities and constraints for the Town.
Regional Context
������������������������������������������������������������������������������������������������������������������������
VAN BUREN
SYRACUSE
e
Regional Location
Map 4.1
Map 4.2

Planning Reference Guide 38
The total population in Central New York is essentially unchanged over
the past thirty years-it grew by a little more than 18,000 from 1970 to
2000. The four counties in Central New York grew 4.5% in the 1970’s and
4.28% in the 1980’s, and then declined by 1.36% in the 1990’s. Changes in
individual counties in Central New York are modest over the same period.
Cayuga, Madison, and Oswego Counties experienced small increases in
population from 1970 to 2000. However, Cayuga and Oswego Counties
lost population during the past ten years. The population in Onondaga
County is nearly 15,000 smaller than in 1970. For the 1990’s, see Table 4.1
and Figure 4.1.
The estimated net out-migration for the Central New York Region from
1990-1998 is nearly 41,000 (See Table 4.2) with nearly 33,000 of the out-
migration from Onondaga County. Absent the net out-migration, the Re-
gion’s population would have grown by nearly 33,000, or 4.5%, and Onon-
daga County’s population would have grown by over 22,000, 4.7%.
Table 4.1 Population, Central New York Counties
and Percent of Change, 1970-2000
Population
Percent of Change
Source: U.S. Bureau of the Census, Compiled by the Empire State Development.
County 1970 1980 1990 2000
Cayuga 77,439 79,894 82,313 81,963
Madison 62,864 65,150 69,166 69,441
Onondaga 472,835 463,920 468,973 458,377
Oswego 100,897 113,901 121,785 122,377
Total 714,035 722,865 742,237 732,117
County 1970-1980 1980-1990 1990-2000
Cayuga 3.20 3.00 -0.004
Madison 3.60 6.10 0.40
Onondaga -1.90 1.10 -2.27
Oswego 12.90 6.90 -0.49
Total 4.45 4.28 -1.36
Population, Central New York Counties, 1970-2000
0100000200000300000400000500000
Cayug
a
Madiso
n
Onond
aga
Osweg
o
Popu
latio
n
1970198019902000
Figure 4.1
Regional Context

Town of Van Buren 39
Table 4.2 Estimated Net Migration,
Central New York Counties, 1990-1998
Source: Central New York Regional Planning and Development Board,
Web Page: http://www.cnyrpdb.org
The regional trends are more understandable in a State context. The popu-
lation of New York has stabilized at about 18.0 million (1970, 18.2; 1980,
17.6; 1990, 18.0; 2000, 18.9). During this period, births outnumbered
deaths by about two to one. The total population remained stable because
of net out-migrations every year since 1960 except 1962-1965 and 1983.
The peak year for out-migration was 1973 with a net out-migration of
221,000. Net out-migration exceed 100,000 per year except for the years
1972-1987, 1990, 1997, and 1998. The estimated out-migration for 1999 is
101,234.1
The long-term statewide trends impact Upstate New York, Central New
York, Onondaga County and ultimately the Town of Van Buren. Based on
population data only, the prospects for large amounts of population growth
are limited. Many communities are seeking to attract new residents. The
successful community will present a comprehensive package to prospec-
tive residents that includes employment opportunities, model residential
communities, and amenities that contribute to both the quality of life and
the image of the Town.
Counties Net Migration
Cayuga -3,221
Madison -999
Onondaga -32,892
Oswego -3,841
Total -40,953
Regional Context

Planning Reference Guide 40
Table 4.3 Population and Percent Change, Onondaga County Towns,
Villages, and Syracuse, 1930-2000 and Estimated for
Onondaga County, 2010
Population
Percent Change
Source: New York State Department of Economic Development, 1989 and
Syracuse-Onondaga County Planning Agency, Framework for Growth in Onondaga
County, June 1998, page 4.
Year City of Syracuse Towns & Villages Onondaga County
1930 209,326 82,280 291,606
1940 205,967 89,141 295,108
1950 220,583 121,136 341,719
1960 216,038 206,990 423,028
1970 197,297 275,538 472,835
1980 170,105 293,815 463,920
1990 163,680 305,113 468,973
2000 147,306 311,530 458,336
2010 464,800
Year City of Syracuse Towns & Villages Onondaga County
1930-1940 1.60 8.30 1.20
1940-1950 7.10 35.90 15.80
1950-1960 -2.10 70.90 23.80
1960-1970 -8.70 33.10 11.80
1970-1980 -13.70 6.60 -1.80
1980-1990 -3.80 3.80 1.10
1990-2000 -10.00 2.10 -2.27
2000-2010 1.40
REGIONAL CONTEXT Regional Context

Town of Van Buren 41
Like New York State, Onondaga County’s births exceed deaths leaving
out-migration as a significant factor affecting population (See Table 4.2).
Out-migration is estimated at 35,000 in the
1970s, 25,000 in the 1980s, and nearly 33,000
from 1990-1998. From 1970 to 1990, the
Onondaga County population would have
grown by 56,000 instead of declining by
4,000 if in-migration had equaled out-
migration.2
A long-term perspective on population
change in Onondaga County is shown in Ta-
ble 4.3 and Figure 4.2. The population of the county grew until 1970 with
the largest growth occurring in the post-World War II baby boom decades
of 1950 and 1960. From 1970 to 1990 the population remained stable;
from 1990-2000, the population declined by 10,000.
The City of Syracuse’s population remained stable from the 1930’s
through 1960’s; however, since the 1960’s the population has been declin-
ing. The population in the towns and villages , surrounding Syracuse, grew
by nearly 87,000 in the twenty year period after 1960. This population has
remained relatively stable since 1980, growing less then 18,000.
The age distribution of an area’s population influences economic
development, the demand for various housing types and public
services. The 45-64 age group is projected to increase by nearly
twenty-five percent by 2010, the over sixty-five age group by
about six percent, and the over eighty-five by nearly fifty percent.
The twenty to thirty-four age group will stop its rapid decline and
remain stable between now and 2010. Note an absence of pro-
jected growth in the new job seeking age groups. The data is
shown in Table 4.4 and Figure 4.3.
Population, Onondaga County, Syracuse, and Towns and Villages, 1930-2000
0200000400000600000
1930
1940
1950
1960
1970
1980
1990
2000
CityTownsCounty
Figure 4.2
Onondaga Population By Age, 1980-2000 and Estimated 2010
020000400006000080000
100000120000140000
0-4
5-19
20-3
4
35-4
4
45-6
4
65-8
4
85+
Age
Popu
latio
n 1980199020002010
Figure 4.3
Regional Context

Planning Reference Guide 42
Table 4.4 Existing Population by Age 1980 and 1990
& Projected Population by Age 2000 and 2010
& Projected Changes by Age, 1990-2000 and 2000-2010
Existing and Projected Population
Projected Change by Age Group
Source: New York State Department of Economic Development & U.S. Census Bureau as
seen in Framework for Growth in Onondaga County, Syracuse-Onondaga County Plan-
ning Agency (June 1998), page 4.
The population changes in the towns and villages vary by geographic area.
The population changes by municipality reflect the long-term growth stem-
ming generally north and northwest and easterly. The northward expansion
is attributed to the combination of access, flat land, and available utilities.
It is no accident development generally occurs outward from a core of jobs
and workers combined with good accessibility. While development occa-
sionally leapfrogs over undeveloped areas, in the long run the undeveloped
areas will be filled in by development.
Age 1980 1990 2000 2010
0-4 30,973 35,006 31,030 28,414
5-19 116,954 96,605 99,017 91,017
20-34 121,205 121,160 96,895 96,246
35-44 49,462 69,087 74,948 61,207
45-64 94,478 86,275 101,678 128,003
65-84 50,848 60,840 67,715 71,728
85+ 4,971 6,485 10,257 14,757
Total 463,920 468,973 473,283 476,615
Age 1990-2000 Percent Change 2000-2010 Percent Change
0-4 -3,976 -11% -2,616 -8%
5-19 2,412 2% -8,000 -8%
20-34 -24,265 -20% -649 -1%
35-44 5,861 8% -13,741 -18%
45-64 15,403 18% 26,325 26%
65-84 6,875 11% 4,013 6%
85+ 3,772 58% 4,500 44%
REGIONAL CONTEXT Regional Context

Town of Van Buren 43
Classification of the Towns in the County into inner suburbs, outer sub-
urbs, and rural areas provides a useful framework for describing population
changes in the area outside of the City.
Four of the inner suburban Towns, Salina, Camillus, Geddes, and DeWitt,
lost population (5,534 persons) in the 1980s while experiencing an increase
in the number of housing units. The explanation is a decrease in average
household size. These trends are likely to continue3.
Sixty-five percent of the County’s Town and Village growth in the 1980’s
occurred in the northern outer suburbs of Clay, Cicero, Lysander, and an-
other thirteen percent in the eastern outer suburb of Manlius. Growth in
these areas since the 1970s is attributable to accessibility to jobs (i.e., high-
way access), availability of easily developed land, and availability of water
and sewer services. The County anticipates Cicero and Lysander will con-
tinue steady rates of growth while Clay and Manlius will experience lower
rates of growth4.
In the more rural areas of the County, Towns experienced either small
amounts of growth or small amounts of population loss. Poor relative ac-
cessibility or inherent land development problems probably account for the
modest changes in population. Towns closest to the outer suburbs can ex-
pect to experience some increases in population.
The major population growth in the Town of Van Buren occurred in the
1940s to 1980 (See Table 4.5). In the 1950’s, the population grew by about
fifty percent, and in the 1960s again by fifty percent, and in the twenty
years from 1960 to 1980 the Town’s population nearly doubled. In the
1980s and 1990s, the total population of the Town has remained approxi-
mately unchanged.
Population growth in the Town has, in effect, divided the Town into two
halves—a developed half and a largely undeveloped half. A large portion
of the Town’s population resides in the eastern developed portion of the
Town. In one sense, the eastern portion of the Town might be character-
ized as an inner suburb and the western portion of the Town an outer sub-
Regional Context

Planning Reference Guide 44
urb or even a rural area of the County. The eastern portion of the Town is
included in the “urbanized area” of the County by the U. S. Census Bu-
reau.
Some of the factors affecting population change in the State and Region
also affect the Town. Although births probably outnumber deaths by a
wide margin, smaller household size and net out migration keep the popu-
lation size in a steady state even with modest amounts of new construction.
The most highway accessible and easily developed land located in the east-
ern portion of the Town was developed first.
Table 4.5 Population, Town of Van Buren & Village of Baldwinsville
(portion), 1900-1998
Source: U.S. Bureau of the Census, U.S. Censuses of Population; Central New York Re-
gional Planning and Development Board, Web Page.
Year Town Village
(Portion)
1900 2,107 1,190
1910 1,966 1,234
1920 1,977 1,448
1930 2,259 1,555
1940 2,094 1,597
1950 3,117 1,783
1960 6,465 2,289
1970 11,859 2,355
1980 12,585 2,514
1990 13,367 2,457
2000 12,667
REGIONAL CONTEXT Regional Context

Town of Van Buren 45
Regional Economy
Decisions about plans for the Town require an understanding of Onondaga
County’s economy. The economy is interrelated with population trends. A
strong economy compared to other parts of the country helps retain resi-
dents and encourage in-migration. Conversely, the reverse is also true. The
economy is also affected by changes in the population characteristics of the
County. Differential changes in age groups impact positively or negatively
on different sectors of the economy and needed services.
Table 4.6 shows the number of persons aged sixteen and over working or
looking for work. The labor force is larger today than twenty years ago,
although the total population is relatively unchanged since 1970. A large
increase in the “baby boomer” generation age groups and increased partici-
pation by women account for the increase in labor force relative to the
static total population. Labor force decline in Syracuse reflects the loss of
population and larger numbers of retired persons in the City. The relatively
constant size of the new entrants available offsets the out-migration to ar-
eas with a stronger economic base.
The industry profile in the County parallels national trends with a large
service oriented focus. Retail trade employed nearly 45,000 workers in
1995. Manufacturing employment was nearly 37,000, followed by miscel-
laneous services, 31,000, health services 25,000, transportation and public
utilities 18,000, finance, insurance, and real estate 17,000, wholesale trade
16,000, business services 14,000, and education 11,000.
The County’s location close to northeastern markets and excellent trans-
portation routes to those markets is a major plus for the area. Abundant
water supplies, availability of suitable land for development, and a low
cost of living, excellent health services, and good educational programs are
additional selling points for the area.
Regional Context

Planning Reference Guide 46
Table 4.6 Labor Force (1960-1980), Projected Labor Force (2000-2010 and New Labor Force Entrants (1980-1995, and Projected New Labor Force Entrants (2000-2010), Syracuse and Towns, Onondaga County
Percent of Change from Start of Data
Source: New York State Department of Economic Development, U.S. Bureau of the Census as seen in Framework for Growth in Onondaga County, Syracuse-Onondaga County Plan-ning Agency (June 1998), page 8.
Year Syracuse Towns County New Entrants
(Age 15-24)
County
1960 156,522 130,160 286,682
1970 145,676 178,344 324,020
1980 135,569 197,870 353,440 92,956
1985 89,018
1990 130,128 235,342 365,470 73,576
1995 64,254
2000 374,960 64,447
2005 70,413
2010 390,865 70,709
Year Syracuse Towns County New Entrants
(Ages 15-24)
County.
1960 100 100 100
1970 93 137 113
1980 87 152 123 100
1985 96
1990 83 181 127 79
1995 69
2000 131 69
2005 76
2010 136 76
REGIONAL CONTEXT Regional Context

Town of Van Buren 47
The County ascertained the status of the Onondaga County’s economy in a
publication released in June 1998. The report’s findings are reproduced
below.
Economic Development Potential in Onondaga County
1. Economic growth is essential to decrease out-migration of population
and preserve the vitality of the community.
2. Trends in restructuring and downsizing businesses, increased productiv-
ity through capital investments, and a switch away from manufacturing to
a service and information economy, will continue to provide challenges for
the local labor force to adapt to this changing environment.
3. Economic development efforts should be targeted at the attraction, re-
tention and expansion of small and medium sized firms.
4. The County’s economy for the next twenty years will increasingly rely
upon the creation, formation, and marketing of ideas, knowledge, and in-
formation.
5. A diversified transportation system, a range of housing and lifestyle op-
tions, an excellent water supply and an educated labor force are positive
development assets for Onondaga County.
6. The County’s role as a regional distribution center will continue due to
excellent interstate highway, air, and rail access.
7. Onondaga County’s importance as a regional center of medicine, educa-
tion, government, and cultural institutions will continue to enhance eco-
nomic vitality.
8. Tourism as an economic growth generator can be greatly expanded with
an increased emphasis on special events, promotion of existing tourist at-
tractions such as the Burnet Park Zoo, creation of new tourism opportuni-
ties such as the Inner Harbor and Canalway improvements, and other inno-
vative activities.
Regional Context

Planning Reference Guide 48
9. Manufacturing will be dependent on productivity gains, high value
added products, and retention of existing firms; total employment in manu-
facturing will continue to lag behind retail and service sectors.
10. Training workers for a changing workplace and to meet the challenges
of the 21st century is vital. Welfare reform with its emphasis on job training
and placement has reinforced the need for ongoing training. The Applied
Technology Center at Onondaga Community College is an example of the
many training opportunities available in this community. Source: Syracuse-Onondaga County Planning Agency. Framework for Growth in Onon-
daga County, June 1998, page 15.
Housing and Land Development
Housing and land development trends respond to changes in the character-
istics of the population and to changes in the status of the economy. Antici-
pating changes in population and the economy is important in understand-
ing future changes in housing and land development. Housing and land
development trends derive from the sum total of individual buying deci-
sions.
Physical factors also play a role in housing and land development trends.
Topography has been the most important physical factor affecting develop-
ment patterns in the County. The relatively flat northern lowland areas
have presented the fewest barriers to construction of buildings and devel-
opment of water, sewer and transportation systems. The southernmost up-
land portion of the County has been developed only sparsely due to severe
limitations posed by steep slopes and shallow bedrock. Although the tran-
sitional area of hills and valleys within which most of Van Buren is situ-
ated present certain limitations to development, areas in Syracuse and the
inner suburbs have been built-up rather intensively.
Accessibility is the third leg of factors affecting housing and land develop-
ment. At a regional scale, land use patterns are generally predictable based
on transportation system. Employment centers stay close to highways and
to a lesser extent rail lines; major retail centers locate near major highways.
REGIONAL CONTEXT Regional Context

Town of Van Buren 49
Airports attract economic activity. Housing locates in areas with accessi-
bility to employment centers.
Average persons per household relates to both population and housing. The
average size of a household has decreased since 1950 (See Table 4.7).
Fewer children per family, more single person households, increasing age
at which people first marry, and an increase in the elderly population have
contributed to the declining persons per household. In suburban areas, the
new housing construction has kept pace with the demand for new housing
resulting from smaller family sizes.
Table 4.7 Average Persons Per Household, Onondaga County, 1950-1990
and Projected Persons Per Household, Onondaga County, 1990-2000
The number of units of single-family and multiple-family units in Onon-
daga County has increased since 1960. But most of the growth has oc-
curred in the Towns; while Syracuse has remained relatively stagnant (See
Table 4.8)
Year Size
1950 3.51
1960 3.41
1970 3.25
1980 2.80
1990 2.64
2000 2.52
2010 2.45
Regional Context

Planning Reference Guide 50
Table 4.8 Number of Single-Family and Multiple-Family Housing Units,
Municipalities, Onondaga County, 1960-1990
Housing Units
Syracuse Towns Total
Amount of Change, 1960 Equals One-Hundred
Syracuse Towns Total
Nearly 30,000 residential building permits were issued from 1980 to 1999
for single-family and multi-family homes (See Table 4.9 on page 52).
Two-thirds of the permits were issued in the 1980s. The Town of Van Bu-
ren issued 1,154 permits from 1980 to 1999, eighty-two percent were is-
sued during the 1980s and eighteen percent in the 1990s (See Table 4.10
on page 55). During the 1980s, Van Buren issued 5.2% of all residential
permits issued in the County; during the 1990s, Van Buren issued 1.9% of
all residential permits issued in the County. The changing patterns of
building permits is shown graphically in Figures 4.4 and 4.5.
The northern towns (Cicero, Clay, Lysander, and Van Buren) issued over
half the building permits over the entire twenty year period. The eastern
and western parts of the County are secondary growth areas.
Year SF MF Total SF MF Total SF MF Total
1960 100 100 100 100 100 100 100 100 100
1970 92 109 102 120 234 132 110 128 116
1980 97 109 104 147 332 169 130 142 134
1990 97 105 102 176 373 197 148 142 146
REGIONAL CONTEXT
Year SF MF Total SF MF Total SF MF Total
1960 29,002 41,440 70,442 54,130 6,463 60,599 83,132 47,903 131,035
1970 26,637 45,099 71,736 65,149 15,132 80,281 91,786 60,231 152,017
1980 28,044 45,110 73,114 79,654 22,724 102,738 107,698 67,834 175,532
1990 27,991 43,511 71,502 95,060 24,316 119,376 123,054 67,827 190,878
Regional Context

Town of Van Buren 51
Figure 4.4
Figure 4.5
A substantial number of homes are available on the housing market in the
County. The average home sale value has remained relatively constant
through the 1990s (See Table 4.11 on page 55). The pattern of average sale
prices of homes and the number sold are shown on Figure 4.6.
Figure 4.6
Residential Building Permits, Onondaga County, 1980-2000
0500
10001500200025003000
1980
1983
1986
1989
1992
1995
1998
Perm
its
Permits
Home Sales and Average Value, Onondaga County, 1990-1997
0200040006000
1991
1993
1995
1997
$90,000$95,000$100,000$105,000
Homes Sold
AvarageValue
Residential Building Permits, Town of Van Buren, 1980-2000
050
100150200250
Year
1982
1985
1988
1991
1994
1997
Permits
Regional Context

Planning Reference Guide 52
In September 2000 the multiple-listing service listed seventy homes for
sale in Van Buren. Thirty-two were condos in the Village Green area that
ranged in price from $20,000 to $95,000. The average price was $43,000.
Ten single-family homes were listed in the Village Green area that ranged
in price from $65,000 to $165,000. The Seneca Knolls area showed eight
homes listed that ranged in price from $40,000 to $70,000.
Table 4.9 Permits, Municipalities, Onondaga County, 1980-1984
and 1990-1999 (By Volume)
REGIONAL CONTEXT
Municipalities 1980-1989 Municipalities 1990-1999
Clay 4,247 Cicero 1,671
Manilus 2,289 Clay 1,538
Cicero 1,909 Lysander 1,287
Syracuse 1,783 Manilus 1,012
Lysander 1,595 Syracuse 881
Salina 1,112 Onondaga 859
Camillus 1000 Salina 553
Van Buren 948 Camillus 526
Onondaga 845 De Witt 482
De Witt 560 Pompey 333
Pompey 494 Geddes 320
Geddes 493 Van Buren 206
La Fayette 323 Skaneateles 189
Skaneateles 278 Otisco 184
Elbridge 260 Elbridge 164
Marcellus 254 Tully 146
Tully 170 Marcellus 136
Spafford 154 La Fayette 135
Fabius 68 Spafford 111
Otisco No Data Fabius 92
Total 18,787 Total 10,829
Regional Context

Town of Van Buren 53
Table 4.10 Residential Building Permits,
Town of Van Buren, 1980-2000
Table 4.11 Number of Home Sales and Average Home Sale Value,
Onondaga County, 1990-1997
REGIONAL CONTEXT
Year Number of Homes Sold Average Home Sale Value
1990 4,606 $94,500
1991 4,272 $97,700
1992 5,489 $96,600
1993 5,221 $101,000
1994 5,682 $98,800
1995 5,348 $94,000
1996 5,427 $94,900
1997 4,689 $95,700
Year Permits Year Permits
1980 10 1990 34
1981 13 1991 23
1982 7 1992 7
1983 59 1993 14
1984 137 1994 16
1985 185 1995 13
1986 165 1996 29
1987 215 1997 29
1988 60 1998 16
1989 97 1999 25
Total 948 Total 206
Regional Context

Planning Reference Guide 54
Conclusions
As one of thirty-five municipalities in Onondaga County, the Town of Van
Buren is inextricably linked to the Region and the County both socially
and economically.
Changes that occur in the County will undoubtedly impact the character of
the Town in the future. By maintaining an accurate and realistic regional
perspective on population growth, housing, and the economy as the Town
plans for the future, it will be better prepared to respond to the various
pressures and trends of the Region and determine for itself the manner in
which these trends will influence the development of Van Buren.
Notes
1 Empire State Development, New York State Data Center, Web Page
2 Syracuse-Onondaga County Planning Agency. Framework for Growth in Onondaga County, June 1998, page 3.
3 Ibid, page 4.
4 Ibid, page 5.
REGIONAL CONTEXT Regional Context

Town of Van Buren 55
V. Environmental Factors
Geology and Groundwater Hydrology
Bedrock Geology
The bedrock lying closest to the surface in Van Buren is that of the
Vernon Formation. The Vernon Formation is a geological unit approxi-
mately 500 feet thick consisting of layers of shale and dolostone alternat-
ing with layers of halite (rock salt). The shale consists of fine-grained clay
minerals, while the dolostone consists chiefly of an organic carbonate of
calcium and magnesium. The salt and sediments which were the sources of
material in the rocks were deposited in the shallow waters of a very salty
sea that covered the area of Van Buren during the Late Silurian Period
(408 to 421 million years ago). Deformation and uplifting of the rock oc-
curred late in its development and left the rock beds dipping slightly to the
south.
Surficial Geology
Most of the unconsolidated sediments lying above the bedrock and below the soil in Van Buren are products of the fourth and final glacial advance which reached its climax approximately 22,000 years ago. Vast sheets of ice scoured the bedrock, moved soils great distances, and ground rocks into smaller pieces. Mixed, unlayered sediment was deposited in elongated, streamlined hills as the mile-thick glacier moved forward. These hills, or drumlins, are generally steeper on one side (the side upstream of the direc-tion of glacier movement), and are the most obvious topographic features in Van Buren.
Approximately 14,000 years ago the ice began to melt. Meltwater formed an expansive, shallow lake and deposited silt, sand, gravel and clay be-tween and around islands of drumlins. Glacial erratics, or large boulders were also deposited in upland areas by the melting ice.
The drumlins, kettle holes (depressions made by the melting of detached pieces of glacier ice), scattered wetlands, long narrow valleys and flat areas in Van Buren are all evidence of glacial erosion and deposition.
Environmental Factors

Planning Reference Guide 56
The Map 5.1 titled "Surficial Geology" shows the distribution of various types of surficial geological deposits in Van Buren including glacial deposits and other more recent deposits of streams and rivers. The different types of deposits are listed and described below in order from greatest amount to least amount found in Van Buren.
Thick till over bedrock (thr)
Unsorted glacial deposits of silt, sand, clay, cobbles, gravel, and boulders; generally averages about 30 feet thick, but may be up to 200 feet thick in some places; low to moderate permeability
Lake silt and/or clay (lsc)
Thin bedded to massive offshore deposits of sediments accumulated in lakes formed during or after glaciation.
Ice contact sand and gravel (ic)
Gravel or sand deposited in conical hills, short irregular ridges, or terraces along valleys; poorly to moderately well sorted and stratified; high perme-ability
Outwash sand and gravel (osg)
Stratified and well sorted glacial meltwater deposits; high permeability
Peat, marl, muck, and clay (pm)
Fine-grained sediments often high in content of calcite, dolomite or organic matter; low permeability
Alluvial silt and sand (als)
Floodplain deposits of postglacial to recent age; low permeability
Delta sand and gravel (dsg)
Mostly fine to coarse sand; deposited when streams entered lakes formed during or after glaciation; high permeability
Environmental Factors

Town of Van Buren 57
Alluvial sand and gravel (alg)
Floodplain deposits of postglacial to recent age; high permeability
Aquifers
An aquifer is any stratum or zone below the surface of the earth capable of producing water, as for a well. Any of the geological material underlying Van Buren may produce water, but the quality and the quantity of the wa-ter available will vary depending on the location and depth of the well.
Water yields from wells drilled into the shale bedrock of the Vernon For-mation range from between 1 to 245 gallons per minute. The water from this source, however, often contains large amounts of dissolved minerals including sodium chloride and calcium sulfate. This mineralization can produce unpleasant taste, odor, color, or other undesirable chemical prop-erties.
Glacial till may also produce water, but only in quantities of a few hundred gallons per day to individual wells. A dug well is usually the only type of well that can supply usable quantities of water from till. Since dug wells are simply holes in the ground extending below the water table, they are highly susceptible to contamination.
Sand and gravel deposits are the best sources of groundwater. The Map 5.2 titled "Major Aquifers" shows the location of major sand and gravel aqui-fers in Van Buren. Some of these aquifers are located very near the sur-face. Others lie at varying depths beneath less permeable material. The Canton Street Well in the Village of Baldwinsville, for example, taps a 14-foot deep layer of coarse sand and gravel beneath finer-grained silty sand. The well is 16 feet deep. Its peak withdrawal rate is approximately 700,000 gallons per day.
The Map 5.3 titled "Well Yield" indicates the estimated potential well yields in various parts of the major aquifers. The map also shows where the aquifers are believed to be overlain by less permeable sediments.
Wellhead Protection Area
A Wellhead Protection Area is the surface and subsurface area surrounding
Environmental Factors Environmental Factors

Planning Reference Guide 58
a well through which contaminants are reasonably likely to move toward and reach the well. The New York Rural Water Association (NYRWA) has delineated the Wellhead Protection Area for the Canton Street Well. This area is shown on the Map 5.2 titled "Major Aquifers". It is the com-bined area of the zones defined by the NYRWA as the Zone of Influence, the Zone of Contribution, and the Tributary Watershed Zone. The Zone of Influence is the area around the well where pumping has lowered water levels in the aquifer. The Zone of Contribution is the area outside the Zone of Influence where groundwater flows toward the well. The Tributary Wa-tershed zone is the additional area which supplies surface water runoff to the Zone of Contribution and the Zone of Influence.
Environmental Factors
N
1 inc h = 1 m ile
0 1 M i.
Surficial GeologyTown of Van Buren
SUNY College of Environ men talScience and Fo re st rySyracuse, New York
So ur ce: P ag an o, T im o thy S. an dD av id B . T e rr y, G eo hyd ro log y o fthe G la c ia l Ou tw ash Aq ui fers i n theBa ld w ins v ille Ar ea , S en eca R ive r, On o nda g a C o un ty , N e w Y or k ,U S GS , 19 84 .
Surf icial Deposits
alg
lsc o r a lsdsg or o sg
ic
pm
th r
Bou n da ry n ot m ap p ed
Decem ber, 20 00
Decemb er, 20 00
����Major Aquifers
% Canton Street WellWellhead ProtectionArea
S ou rce : S ee no tes in th e a ccom pa ny in gtex t
SUNY College of En vironm ent alScience a nd ForestrySyra cuse, New York
Town of Van BurenMajor Aquifers
N
1 inc h = 1 m i le
0 1 M i.
������������������������������������������������������������������������������������������������������������
��������������
����
������
���������������������������������������������������������������������������������������������������������������������������������������������������
������������
������������������
������������������
������
������������
��������
������
������
��
��������������������
���������������������������������������������
����������������������������������
����������������������������
������������������������������������������������������������������������������
��������������������������������������������������������������������������������������������������������
�����������������������������������������������������
�������� ������������������������
����������������
������������������������������������������������������������������������������������������������������������������������������������������������������������������������������������������������������������������������������������������������
�� ��� ������
�������������������������������
����������������������������������������
������������
����������������
�������������������������������������������������������������������������������������������������� ����������� ��������� ��������� ��������� ���������� �������������
����������������� � �� �������� � �� �������� �� �� ��������� �� �� ���������� �� �� ������������������� ������������������� ������������������� ��������������������� �������������������� ���� ��������������� ����� ��������������� ����� ��������������� ��������������������� ����������� � ������� ����������� ������� ���������������� ����������������� ������������������ ������ ������������� ������ ��������������� ������ ���������������������� ���������������������� ����������������������� ���������������������� ����������������������� ����������������������� ������������������������ ����������������������� ���������� ����������� ������� ���������� ��������������� �������������������������������������������������������������������������������������������������������
������
������������������������
�������������
����������������������
������������������������������������������������������������������������ ����
���������������������������������������������
��������
��������������������
%
Map 5.1
Map 5.2
Environmental Factors

Town of Van Buren 59
REFERENCES
Baldwinsville Joint Groundwater Protection Committee and New York Rural Water Association, Wellhead Protection Plan: Village of Baldwins-ville, 1999.
Ground-Water Resources in the Eastern Oswego River Basin, New York.USGS Basin Planning Report ORB-2, 1970.
Isachsen, Y.W. et. al., Geology of New York: A Simplified Account, New York State Museum/Geological Survey, The State Education Department, The University of the State of New York, Albany, New York, 1991.
Miller, Todd S., Unconsolidated Aquifers in Upstate New York-Finger Lakes Sheet, USGS Water Resources Investigations Report 87-4122. 1987.
Pagano, T.S. et. al., Geohydrology of the Glacial-Outwash Aquifer in the Baldwinsville Area, Seneca River, New York, USGS Water Resources In-vestigations Report 85-4094. 1985.
����������������������������������������������������������������������������������������������������������������������������������������������
������������������������������������������������
������������������������������������������������������������
�������������������������������������������� ����������������
��������������������� ��� ��� ���� ���� ���� ����� ����� ����� ����� ����� ������ ������ ������� ������� ������� ������� ������� ������� ������� �������
�����������������������������������������������������������������������������������������������������������������������������������������������������������������������������������������������������������������������������������������������������������������������������������������������������������
���������������������������������������������������������������������������������������������������������������������������������������
�������������������������������������������������������������������������������������������������������������������������������������������������������������������������������������������������������������������������������������������������������������������������������������������������������������
�����������������������������������������������������������������������������������������������������������������������������������������������������������������������������������������������������
1
4
1
2
1
3
1 15
5
3N
1 inc h = 1 m ile
0 1 Mi.
Well YieldTown of Van Buren
SUNY College of EnvironmentalScie nce a nd ForestrySyracuse, New York
S ource : Pa gano , 19 85 (Se e refere ncei n the a cco m apny ing tex t)
�����Aquifer ov er lain by lessperm eable sedim ents
�����Aqui fer not over la in by less perm eable s edim ents
Potential well yield (gal./m in.)1 5 - 502 50 - 1003 100 - 3504 100 - 350+5 350+
Dece mber, 20 00
Map 5.3
Environmental Factors

Planning Reference Guide 60
Soils
Background
The soils in Van Buren are derived primarily from deposits left behind by the glacier of the last ice age. Some soils in the valleys of the major streams are derived from more recent sediments deposited by water. Weathering of these materials has taken place over thousands of years. Or-ganic matter has been added, and chemical reactions have occurred. These processes have yielded a wide variety of soil types.
Soil Texture
The mineral portion of a soil is made up of particles which vary in size from large sand grains to medium-sized silt particles and very small clay particles. The relative proportions of the different sized particles determine a soil's texture. Soils which contain relatively balanced mixtures of sand, silt, and clay particles are known as loams.
Texture affects the movement of water and air through the soil and root penetration into the soil. It also determines the looseness and workability of the soil.
Hydrologic Soil Groups
Hydrologic groups are groups of soils having the same runoff potential un-der similar storm and cover conditions. Soil properties that influence run-off potential are those that influence the minimum rate of infiltration, or the rate at which water seeps into the soil. Chief among these is the soil texture. The soils of the U.S. are placed into four hydrologic groups: A, B, C, and D. Definitions of the classes are as follows:
A. Soils with low runoff potential. Soils having high in-filtration rates and consisting chiefly of deep, well drained to excessively well-drained sands or gravels.
B. Soils having moderate infiltration rates and consisting chiefly of moderately deep to deep, moderately well drained to well drained soils with moderately fine to moderately course textures.
Environmental Factors Environmental Factors

Town of Van Buren 61
C. Soils having slow infiltration rates and consisting chiefly of soils with a layer that impedes downward movement of water, or soils with moderately fine to fine textures.
D. Soils with high runoff potential. Soils having very slow infiltration rates and consisting chiefly of clay soils with high swelling potential, soils with a perma-nently high water table, soils with a claypan or clay layer at or near the surface, and shallow soils over nearly impervious material.1
Characteristics of General Soil Units in Van Buren
The Map 5.4 titled, "Soil Texture and Hydrologic Group" delineates gen-eral soil units in Van Buren and depicts the surface textures and hydrologic groups of the dominant soils in each general mapping unit. The mapping units are those of the U.S. Department of Agriculture's States Geographic (STASTGO) soils data base. Less suited for use in Town scale analyses than regional scale studies, the STATSGO data provide a broad overview of predominant soil characteristics.
According to the STATSGO data, lower elevations in the western areas of the Town are generally dominated by well drained gravelly loam soils in Hydrologic Group A. Higher elevations in the western and central areas of the Town are generally dominated by moderately well to well drained loam soils in Hydrologic Group B.
Lower elevations in the eastern areas of the Town are generally dominated by less well drained loamy fine sand soils and poorly drained silt soils in Hydrologic groups C and D. Higher elevations in the eastern areas of the Town are generally dominated by moderately well to well drained gravelly silt soils in Hydrologic Group B.
Characteristics of Soil Series
The U.S. Department of Agriculture has mapped the boundaries of forty-five soil series in the Town of Van Buren. Soil series are groups of soils having horizons similar in characteristics and arrangement in the soil pro-file and developed from a particular type of parent material. They are more detailed units of classification than those defined in the STATSGO data-
Environmental Factors Environmental Factors

Planning Reference Guide 62
base mentioned above. It is beyond the scope of this report to describe the characteristics of the soil series in detail. The USDA's maps and descrip-tions are contained in its Soil Survey of Onondaga County, New York,available for inspection at the Town Hall.2
The suitabilities of soil series for two particularly important uses are indi-cated in the Maps 5.5 and 5.6 titled "Suitability of Soils for Dwellings with Basements" and "Suitability of Soils for Septic Systems". The term slight limitations on these maps indicates that few or no limitations exist, or that limitations are easily overcome. Moderate limitations indicates that limita-tions need to be recognized, but can be overcome under good management. Severe limitations indicates that limitations exist that are serious enough to make use questionable. Limitations are based on wetness, flooding hazard, permeability, depth to bedrock, surface rockiness, and soil texture. For the purposes of producing the soil suitability maps, slope was not considered in the interpretation of limitations.
Environmental Factors
N
1 inc h = 1 m i le
0 1 M i.
Soil Texture and Hydrologic GroupTown of Van Buren
SUNY College of En vironm ent alScience a nd ForestrySyra cuse, New York
So ur ce: D ig ital S T A T SG O da ta,U SD A N a tu ra l R e sou rceC on ser vat io n S er v ice , 1 99 8
So il Surface Texture andHydro logic Group ofDom inant Soils
Gra ve lly L oa m , HSG AL oa m , H SG BGra ve lly S ilt, HSG BL oa m y Fine Sa n d, H SG CS ilt , H SG CS ilt , H SG C/DS ilt , H SG D
Decemb er, 20 00
Map 5.4
Environmental Factors

Town of Van Buren 63
N
1 inc h = 1 m i le
0 1 M i.
Suitability of Soils for Dwellings With BasementsTown of Van Buren
SUNY College of En vironm enta lScie nce a nd ForestrySyracu se, New York
Janu ary, 2001
Suitabil ity of Soils forDwe llings w/Basemen ts
S ligh t Lim ita tion sM o de ra te L im ita t io nsSe ve re Lim ita tion sU n rated (w ater, q ua rries ,cu t an d fi l l lan d , e tc. )
N ote: Li m ita ti on s ba sed onch ar ac te ris t ics o f soil ser ies
s l op e co ns ide re di n the inte rp re ta t io n ofl im ita t ion s
was not
Suitabili ty of Soilsfor Septic Systems
Slig h t L im itat io n sM od e rate Lim ita tion sSe vere L im itat io n s
N o te: Lim itat io ns b ase d o nch ara c ter is t ics o f so il se rie s
U nra te d (wa te r, qu a rrie s,cu t a n d fi ll la nd , etc.)
Janu ary, 2001
SUNY College of En vironm ent alScience a nd ForestrySyra cuse, New York
Town of Van BurenSuitability of Soils for Septic Systems
N
1 inc h = 1 m i le
0 1 M i.
was nots lo p e co ns i der edi n the i nter pr eta ti on o fl im ita ti on s
Environmental Factors
Map 5.5
Map 5.6
NOTES
1 New York Guidelines for Urban Erosion and Sediment Control, New York State Soil and Water Conservation Committee, 1991.
2 Soil Survey of Onondaga County, New York, United States Department of Agriculture Soil Conservation Service, 1977.
Environmental Factors

Planning Reference Guide 64
Topography and Surface Hydrology
General Topography
The land in the Town of Van Buren consists of gently rolling ter-rain. Valleys varying in steepness and width run along the align-ments of the Seneca River, Dead Creek, Crooked Brook, and the New York State Thruway. The local landscape features were formed from the deposition of geologic materials carried by gla-ciers, and more recently by deposits of streams and rivers. The sec-tion of this survey titled "Geology and Groundwater Hydrology" contains a description of the glacial activity which played a major role in sculpting the landscape.
Elevation
The Map 5.7 titled "Elevation" shows how land in various ranges of heights above sea level is distributed across Van Buren. The highest point in the Van Buren lies 670 feet above sea level on Sorrell Hill west of Canton Street in the central area of the Town. The lowest point lies 360 feet above sea level on the shore of the Seneca River east of Van Ness Road in the eastern area of the Town.
Slope
The Map 5.8 titled "Percent Slope" shows how terrain of various steepness is distributed across Van Buren. Sixty-six percent (66%) of the land area in the Town slopes at a rate of 0% to 6%. Eighteen percent (18%) of the land slopes at a rate of 6% to 10%. Nine percent (9%) of the land slopes at a rate of 10% to 15%. Six percent (6%) of the land slopes at a rate of 15% to 25%. One percent (1%) of the land slopes at a rate of greater than 25%. The steepest slopes are oriented along the valleys of streams and the longer sides (the northeastern and southwestern sides) of drumlins. Drumlins are smooth, streamlined hills formed by glacial activity.
Surface Water and Drainage
There are approximately 48 linear miles of streams and creeks in Van Bu-
ren. The entire Town is located within the Eastern Oswego River Basin
which drains into Lake Ontario at Oswego. The Map 5.9 titled "Surface
Environmental Factors Environmental Factors

Town of Van Buren 65
Water" shows the locations of surface watercourses and major drainage divides.
Streams and creeks on the western side of the upland area in the western
portion of the Town flow northwestward into the Seneca River. Streams on
the western side of the Valley of Dead Creek flow eastward into the Creek,
while streams on the eastern side flow westward into it. Dead creek flows
north into the Seneca River. Land in the southern area of the Town drains
into the old Erie Canal which flows westward into Dead Creek. The north-
eastern portion of the Town drains into the Seneca River via the northerly
flowing Crooked Brook. The remaining land in the southeastern section
drain into the Seneca River either directly or via Nine Mile Creek in Ca-
millus.
Water Quality and Regulation
The New York State Department of Health has classified surface waters
according to their "highest and best use". Water classified in Classes A and
AA are of the highest quality and are suitable for drinking and food proc-
essing. Class B waters are suitable for swimming and other water related
recreation where bodily contact is involved. Class C streams and lakes are
suitable for fishing and recreational boating. The additional classification
letters of (t) or (ts) are used to indicate that there is sufficient dissolved
oxygen to support trout or trout spawning in Class A, B, or C waters. Class
D waters are of the poorest quality and are suitable only for agricultural
irrigation and most industrial processes.
A Protection of Waters Permit is required from the New York State De-partment of Environmental Conservation for the following activities:
• Modification or disturbance of the bed or banks of streams that are classified C(t) and above, including removal of sand or gravel
• Filling or dredging in navigable waters • Construction, reconstruction, or repair of certain
dams • Construction, reconstruction, or modification of cer-
tain docks, mooring areas or other structures in navi-gable waters
Environmental Factors Environmental Factors

Planning Reference Guide 66
Environmental Factors
N
1 inc h = 1 m i le
0 1 M i.
ElevationTown of Van Buren
SUNY College of En vironm ent alScience a nd ForestrySyra cuse, New York
So ur ce: 10 -m e ter d ig ital e le vat io nm od el p ro v id ed b y th e U nite d S ta tesGe ol ogi cal S u rve y, 19 9 9
Elevation111m - 130m131m - 150m151m - 170m171m - 190m191m - 210m
Ma jor DrainageDiv ides
Decemb er, 20 00
N
1 inc h = 1 m i le
0 1 M i.
Percent SlopeTown of Van Buren
SUNY College of En vironm ent alScience a nd ForestrySyra cuse, New York
So ur ce: 10 -m e ter d ig ital e le vat io nm od el p ro v id ed b y th e U nite d S ta tesGe ol ogi cal S u rve y, 19 9 9
Percent Slope0% - 6%6% - 10%10% - 15%15% - 25%>25%
Decemb er, 20 00
N
1 inc h = 1 m i le
0 1 M i.
Surface WaterTown of Van Buren
SUNY College of En vironm ent alScience a nd ForestrySyra cuse, New York
S tre am s a nd C re eks
S ou rce: D i gita l da ta pr ov i de d by th eN e w Y o rk Sta te D e pa rtm e nt ofE nv ir on m e ntal C on ser vat io n, 19 9 8
Surface WaterP on ds
M ajo r D rain age Div ide s
Decemb er, 20 00
Map 5.7
Map 5.9
Map 5.8
Environmental Factors

Town of Van Buren 67
Special Flood Hazard Areas
Background
The Federal Emergency Management Agency (FEMA) defines a flood as:
…a general and temporary condition of partial or com-plete inundation of normally dry land areas from one of the following four sources:
- The overflow of inland or tidal waters.
- The unusual and rapid accumulation or runoff of surface waters from any source.
- Mudslides (i.e., mudflows) which are proxi-mately caused by floods, as defined above, and are akin to a river of liquid and flowing mud on the surface of normally dry land area, as when earth is carried by a current of water and depos-ited along the path of the current.
- The collapse or subsidence of land along the shore of a lake or other body of water as a result of erosion or undermining caused by waves or currents of water exceeding the cyclical levels which result in flood, as defined above.1
FEMA has produced maps outlining the degree and extent of flood risks in communities across the United States. These maps include delineation of high-risk flood zones, or Special Flood Hazard Areas (SFHA's).
The National Flood Insurance Program (NFIP) provides coverage against flood damage to property owners in communities like Van Buren that have adopted and enforce regulations designed to ensure safe construction of buildings in high-risk flood zones. The maps produced by FEMA serve as guiding documents for local officials in the regulation of floodplain con-struction. The Town is required, as a condition of its participation in the NFIP, to ensure that the lowest floor elevations of new structures built in Special Flood Hazard Areas are at or above the base flood elevations shown on the FEMA maps.
Environmental Factors

Planning Reference Guide 68
The FEMA maps also guide lenders in enforcing the mandatory flood in-surance purchasing requirements that apply to owners of property in Spe-cial Flood Hazard Areas.
Distribution and Extent of Special Flood Hazard Areas in the Town of Van Buren
The Map 5.10 titled "Special Flood Hazard Areas" shows flood zones de-lineated by FEMA in the Town of Van Buren. The areas delineated have been determined by FEMA to be located in the 100-year floodplain, areas where there is a one percent chance of flooding in any given year.
Special Flood Hazard areas in Van Buren are limited to lands adjacent to the Seneca River, Dead Creek, and the portion of the old Erie Canal west of Bennetts Corners Road.
NOTES
1 Federal Emergency Management Agency (FEMA) Internet web page at
http://www.fema.gov/nfip/readmap.htm.
Decem ber, 20 00
�����
S ou rce : D igi ta l " Q3 " d ata p ro v ide d b ythe F ed er al E m e rg en cy M an ag em e ntA ge ncy , 19 96
Special FloodHazard Areas
SUNY College of E nviron men talScience and Fo restrySyra cuse, New York
Town of Van BurenSpecial Flood Hazard Areas
N
1 inc h = 1 m i le
0 1 M i.
������������� �����������
��������������������
���
���
���
���
���
���
���
���
���
���
���
������
����
�������
�����
��������
����
������
������
��������
�������
���������
������
������
�����
�����
����
����
���������
�������
����������
���
�
�
�
���������������
�
��������������������������������������������������������������������������������������������������������������������������������������������������������������������������������������������������������������������������������������������������������������
���������������������������������������������������������������������������������������������������������������������������������������������������������������������������������������������������������������������������������������������������������������������������������
������������������������������������������������������������������������������������������������������������������������������������������������������������������������������������������������������������������
�����������
�
�
�
�������
�
�����������
�
��������������������������
�
����
��
�
�����
�
�
���
�����
����
��
����
����
��������
�
�
�����
����������
��
�
���������
����������
�������
�
��������
�������
����
����
�
����
�����
��������
�������
���
�����
������
�������
������
��������
���������
�������
�������
������
�����
����
����
����
����
����
����
���
�����
������
��
������
������
�������
����
����
�������
���������
���
����
��������
�������
�������
����������
������
��
���������
���������������������������������������������������
��
��� ������������������������������������������������������������������������������������������������
���������������������
�������
������������������������������������������������
����������������������������������������������������������������������������������������������������������������������������������������������������������������������������������������
�����������������
������
�����
������������
����������������
����������
���
����
��
���
����
���
����
�������
����
���
��������
�������
����
����
���
�������
�����
����
���
�����
�����
�����
���
����
����
������
����
���
���������
�����
�����
�����
����
�����
�������
����
���������
�
�
�������
�
�
�
�
�����
���
�
�����
�
������������
�
��
�
������
����
�
�
���
�
������
��
�
���������
���
�
���
�
�
���
�
���
�
������
�
�
����
�
�
���
�
�
������
��
�
����
����
�
��
�
����
�
����
��
�
����
��
�
��������������
����
�
��
�
�����
��
�
���
��
���������
��
�
����
��
���
�
����
������
��
���
����
�
����
��
�����
��
�
��
�
��
�
���
�
��������
����
�
����
��
�������
�����
�
��
�
�����
�
������
�
�
�
���
��
�
�
��
���
����
�
�
��
�
�
��
���
�
����
��
���
�
������
�
����
�
��
��
������
�
��
��
�������
�
��
�
��
�
������
�
����
����
������
�
���
��
���
�
�����
��
����������
���
�
�
�����
�
�������
�
��
��
����
��
�
�
�
�
�
�
��
���
�
�
��
�
��
���
���
���
�
�
�
���
��
���
���
�
��
�����
�
�
��
�����
��
���
��
��
�
���
�
���
�
��
�
�
�
��
����
��
������������������������������������������������������������������������������� ������������������������� �������������������������������������������������������������
���������������������������������������������
Map 5.10
Environmental Factors

Town of Van Buren 69
Wetlands
Definitions
Several federal and state agencies provide definitions of wetlands through various laws, regulations, administrative guidelines, and programs. All of these definitions include consideration of hydrology, vegetation, and soils.
Federal Definitions
The U.S. Environmental Protection Agency (EPA) and the Army Corps of Engineers define wetlands as:
…those areas that are inundated or saturated by surface or groundwater at a frequency and duration sufficient to support, and that under normal conditions do support, a prevalence of vegetation typically adapted for life in saturated soil conditions. Wetlands generally include swamps, marshes, bogs, and similar areas. 1
The U.S. Department of Agriculture's Soil Conservation Service, now the Natural Resource Conservation Service (NRCS) has defined wetlands similarly, adding that wetlands include "areas that have a predominance of hydric soils" 2. Hydric soil is soil that is wet enough to periodically pro-duce anaerobic (oxygen-free) conditions.
The U.S. Fish and Wildlife Service (FWS) has developed the following definition of wetlands:
…lands transitional between terrestrial and aquatic sys-tems where the water table is usually at or near the sur-face or the land is covered by shallow water. Wetlands must have one or more of the following three attributes: 1) at least periodically, the land supports predominantly hydrophytes (water dependent vegetation), and 2) the substrate is predominantly undrained hydric soil, and 3) the substrate is nonsoil and is saturated with water or covered by shallow water at some time during the grow-ing season of each year. 3
Environmental Factors Environmental Factors

Planning Reference Guide 70
State Definition
The New York State Freshwater Wetlands Act defines wetlands as:
(a) lands and submerged lands… supporting aquatic or semi-aquatic vegetation…; (b) lands and submerged lands containing remnants of any vegetation that is not aquatic or semi-aquatic that has died because of wet con-ditions over a sufficiently long period, provided that such wet conditions do not exceed a maximum seasonal water depth of six feet and that such conditions can be ex-pected to persist indefinitely, barring human interven-tion; (c) lands and waters substantially enclosed by aquatic or semi-aquatic vegetation…or by dead vegeta-tion as set forth in paragraph (b), the regulation of which is necessary to protect and preserve the aquatic and semi-aquatic vegetation; and (d) the waters overlying the areas set forth in (a) and (b) and the lands underlying (c). 4
Values and Benefits
Wetlands in their natural state have tremendously significant ecological value. They filter pollutants, nutrients, and sediments, thus protecting the quality of surface water and ground water resources. By collecting, and then slowly releasing runoff from heavy rains and snow melts, wetlands reduce the risk of flood damage. Wetlands adjacent to watercourses pro-vide a buffer against streambank erosion.
Wetlands export nutrients supporting the food chain on which wildlife and fisheries depend, and provide critical habitat for fish, waterfowl, and other animals. The hunting and fishing industries are enhanced by systems of wetlands providing fish and wildlife habitat.
The strikingly beautiful open spaces and other areas for active and passive recreation that wetlands provide add to our quality of life, enhance private property values, and promote tourism.
Wetland Regulation
Activities in wetlands are regulated by state and federal laws. Pursuant to the New York State Freshwater Wetlands Act, a permit is required for
Environmental Factors Environmental Factors

Town of Van Buren 71
draining, dredging, grading, filling, excavating, placing of obstructions, or
conducting any other activity that might substantially impair wetland
benefits in or within 100 feet of a freshwater wetland.
The New York State Department of Environmental Conservation (DEC) has mapped the approximate boundaries of all freshwater wetlands of 12.4 acres or more. In some cases, these maps include smaller wetlands of unusual local importance. The DEC maps are used to determine the pres-ence of State regulatory freshwater wetlands on particular properties. When the locations or boundaries must be determined more precisely, property owners may request a delineation by the Corps of Engineers, the DEC or a consultant. Boundaries delineated by consultants are subject to DEC and Corps verification.
Section 404 of the Federal Clean Water Act regulates discharges to waters of the United States, including filling, soil movement, and the placement of certain pilings in wetlands regardless of size. The Army Corps of Engi-neers administers a permit program to ensure that regulated activities comply with environmental requirements. A joint DEC/Corps application procedure is in place for wetland permits.
State Wetland Classification
A classification system is used to objectively rank New York State regu-latory wetlands according to criteria derived from DEC regulations. Un-der this system, Class I wetlands are considered the most valuable, while Class II, III, IV, and V wetlands are considered progressively less valu-able. Federal regulations do not distinguish between wetlands on the basis of potential wetland values.
The Distribution and Extent of Wetlands in Van Buren
The DEC wetlands maps show 1693.7 acres of regulatory wetlands in Van Buren, 7.6% of the total Town area (see Map 5.11 titled "NYS Regu-latory Wetlands").
The wetland adjacent to Dead Creek has been identified by the Onondaga County Environmental management Council as one of the most important wetlands in the County. It is a favorite stopping place of migratory water-fowl. It also serves as a critical stormwater and meltwater retention basin.
Environmental Factors Environmental Factors

Planning Reference Guide 72
The portion of this wetland north of Conners Road and northeast of Gun-barrel Road is classified as a Class I wetland.
Another Class I wetland lies south of the New York State Thruway and adjacent to the old Erie Canal. The other wetlands in the Town are classi-fied as either Class II or Class III.
Two wetlands function as recharge areas for large, significant groundwater aquifers. One extends along the Seneca River from Baldwinsville to the eastern Town boundary. The other extends east from the area of Jack's Reef along the southern boundary of the Town and includes the wetland adjacent to the old Erie Canal.
Another wetland of special interest is one which is located at the northwest corner of Van Buren and Brickyard Roads. This lies in a depression be-lieved to have been formed by the melting of a detached mass of ice buried or partially buried in other material deposited by the most recent glacier.
The Federal Emergency Wetland Resources Act of 1986 directed the U.S. Fish and Wildlife Service (FWS) to map the wetlands of the United States as part of a National Wetlands Inventory (NWI). The FWS's definition of wetland differs from the definitions used by the DEC and the Army Corps of Engineers, and the NWI wetlands have not been field-verified. Still, the NWI maps are a useful resource in determining where certain wetlands not mapped and regulated by the DEC might exist. The NWI maps show an additional 685.5 acres of wetlands not delineated on the DEC maps (see the Map 5.12 titled "NWI Wetlands").
Environmental Factors
����������
��������
�������� ������
������������
������������
����������
���������������
���������������
��������������������������
�����������������
��������������
������ �� ��������
��������
�������� �
�����������
��������������
�� �������� ��������
������� ��
������������
�� ������������
�����������
��������
������������
�� ��������������
�������������� ��������������
����������� ���������
���������� �����
�������������������������
����������������������� �����������
��������������
��������
��������������
����������
������������������������ ����� ��������������� ������� �������� �������� ����������������������������� � ��������
N
1 inc h = 1 m i le
0 1 M i.
NYS Regulatory WetlandsTown of Van Buren
SUNY College of En vironm ent alScience a nd ForestrySyra cuse, New York
NYS RegulatoryWetlands
S ou rce: D i gita l da ta pr ov i de d by th eN e w Y o rk Sta te D e pa rtm e nt ofE nv ir on m e ntal C on ser vat io n, 19 9 8
�����
Decemb er, 20 00
Map 5.11
Environmental Factors

Town of Van Buren 73
Decem ber, 20 00
����So ur ce: D ig ital data pr ov id ed by theU .S. F ish an d W il dlife Se rv i ce, 20 00
NWI Wetlands
SUNY College of E nviron men talScience and Fo restrySyra cuse, New York
Town of Van BurenNWI Wetlands
N
1 inc h = 1 m i le
0 1 M i.
��� �������� � ���� � ����� �����������������������������������
�����������������������������������������������������������������
����������� ��
������
���� � ���� ���
������ ������ ���� �����������
������� ���
������������������
����� �� �� ����
����
���� ��
���� ���� ����� ���� ���
�����
��
����� ����������������������������������������������������������������������������������������������������������������������������������������������������������
�������������������� ������ ��������� � �� � ����� ���
���� ������
������������� �� ����
�� ���������������
������
�������� �������� ������ �� ������� �� ���� ���
�����������������������
����������������� �����
�� � �� ��� ����� ����������
�����
������
�������� �� ������ ��� ������ ��� ����
��������
���������� �� ������� ������� ���������
������
������
��
� ������� ���� ���� ������� ����������������������������������������������������� � �� ������
������ ��� ������ ���������������� ���������� ������
���������� ����
��������������������������������������������������������������������������������������������������������������������������������������������������������������������������������������������������� ����� ���������� ����������������������������� ���������������� ���� � ���
����� ���� ���
����
������ �� � ���� ���� ��
��������
�� ����� ��� ������ ���� ���
��������
��������
��
�����������
����������������
�������� ������ ��� �������� ������ ���� � ���������
�� ������ ���
Map 5.12
NOTES
1 EPA, 40 Code of Federal Regulations (CFR) 230.3 and Army Corps of Engineers, 33 CFR 328.3.
2 USDA Soil Conservation Service, National Flood Security Act Manual,1988.
3 U.S. Department of the Interior Fish and Wildlife Service, Classification of Wetlands and Deepwater Habitats of the United States. 1979.
4 New York State Environmental Conservation Law, Article 24, Title 1, Section 24-0107.
Environmental Factors

Planning Reference Guide 74
Land Cover
Background - The National Land Cover Dataset (NLCD)
The U.S. Geological Survey (USGS), in cooperation with the U.S. Envi-ronmental Protection Agency, has produced a land cover dataset for the conterminous United States on the basis of data collected in 1992 and 1993 by the Landsat 5 earth observing satellite. The data contains 21 categories of land cover information suitable for a variety of regional applications, including landscape analysis, land management, and modeling nutrient and pesticide runoff.
The land cover categories used in the National Land Cover Dataset are listed below:
- Open Water - Perennial Ice/Snow - Low-Intensity Residential - High-Intensity Residential - Commercial/Industrial/Transportation - Bare Rock/Sand/Clay - Quarries/Strip Mines/Gravel Pits - Transitional - Deciduous Forest - Evergreen Forest - Mixed Forest - Shrubland - Orchards/Vineyards/Other - Grasslands/Herbaceous - Pasture/Hay - Row Crops - Small Grains - Fallow - Urban/Recreational Grasses - Woody Wetlands - Emergent Herbaceous Wetlands
Environmental Factors Environmental Factors

Town of Van Buren 75
Distribution of Land Cover in Van Buren
For the purposes of this survey, data covering the area of the Town of Van Buren were extracted from the National Land Cover Dataset. The 13 cate-gories of land cover present in the Town are generalized into 6 categories and displayed on the Map 5.13 titled "Land Cover". The map is enhanced with the more detailed surface water and wetlands data which was col-lected in other tasks associated with this survey.
The percent of land in the Town under each category is as follows:
Crops and Grasses 60.8% Forest 27.9% Wetlands 3.3% Urban/Built-Up Areas 6.1% Quarries and Mines <.1% Water 1.9%
Environmental Factors
N
1 inc h = 1 m i le
0 1 M i.
Land CoverTown of Van Buren
SUNY College of En vironm ent alScience a nd ForestrySyra cuse, New York
S our ce: D i gita l N at io n al L an d C o verD a ta pr ov id ed by the U ni te d S tatesG eo log ica l Su rve y , 2 00 0
Land Cover
Water
Urban/Built-Up AreasQuarries and Mines
Crops and Grasses
WetlandsForest
Decemb er, 20 00
Map 5.13
Environmental Factors

Planning Reference Guide 76

Town of Van Buren 77
VI. Land Use and Transportation
A. Existing Land Use
A division of the Town into two parts is clearly noted in a survey of exist-
ing land use in Van Buren. A suburban part is to the east of Interstate 690
where higher concentrations of residences (Village Green and Seneca
Knolls), private and public facilities, commercial uses, and industrial uses
are located. West of Interstate 690 is the more rural part of the Town,
composed of mostly agricultural land, larger residence parcels, and a scat-
tering of other uses. The Hamlets (Memphis and Warners) are also
found in the rural portion of the Town.
The suburban portion of the Town is approximately one-sixth the acreage
of the rural side of the Town. The suburban side contains a greater variety
of uses. The suburban portion is contains about fifty-five percent “built-up
land.” The rural portion of Van Buren contains about fifteen percent
“built-up land.” Built-up land consists of land uses such as residential,
community facilities, parks and recreation, commercial, industrial, and
utilities. The suburban portion is twenty-eight percent residential. The
rural side is fifty-six percent agricultural land, and eleven percent residen-
tial. The suburban portion is (percentage wise) more residential
than the rural side, consisting of smaller, more numerous parcels,
but the rural side has more overall residential acreage.
Map 6.1 (Page 79), Land Use, shows existing land uses in the
Town of Van Buren for the year 2001. The suburban and rural
parts are clearly illustrated. Map 6.2, Settlements, identifies the
hamlets, and major housing developments within the Town. Ta-
ble 6.1 shows the breakdown of land uses by acreage and as-
sessed value. Table 6.2 shows the breakdown of land uses in the
suburban and rural portions of the Town.
Land Use and Transportation
HARBOURHEIGHTS
JACK'SREEF
SENECAKNOLLS
VILLAGEGREEN
WARNERS
MEMPHIS
IONIA
BALDWINSVILLE
SettlementsTownof VanBuren
Map 6.2

Planning Reference Guide 78
Land use is often influenced by transportation. Historically, different
forms of transportation influenced the development of the Town. The
Indian trails and waterways throughout New York were the first forms of
travel in the area. The trails evolved into roads, rail lines, and trolley
lines..
The system of roads within Van Buren today, for instance, is key for
trucking routes and ways for people to get to and from different areas of
the region efficiently, whether for work, or for other purposes. The Vil-
lage of Baldwinsville is located on the Seneca River and includes Lock 24
of the New York State Canal system. Railroad also helped with the physi-
cal development of Town. They run along the eastern and southern por-
tions of Van Buren.
Table 6.1 Land Use
Town of Van Buren, New York, 2001
Land Use and Transportation
Land Use Acres Percentage Assessed Value Percentage
Agricultural 10610 46 19015900.00 4
Residential 2975 13 291976300.00 68
Community Facilities 191 0.7 33979300.00 8
Parks & Recreation 795 3.4 2307700.00 0.5
Commercial 199 0.8 24882400.00 6
Employment Centers 398 1.7 33418000.00 8
Utilities & RR 421 1.8 6715935.00 1.6
Open Lots 5789 25 15201025.00 3.5
Water 508 2.2 2248900.00 0.5
Roads & Highways 1366 5.8 N/A N/A
Total 23252 100 429745460.00 100

Town of Van Buren 79
Land Use Map available at the Town Building

Planning Reference Guide 80
Land Use Map available at the Town Building

Town of Van Buren 81
Table 6.2 Land Use by Suburban and Rural Areas,
Town of Van Buren, New York, 2001
Agriculture
Just less than fifty percent of the land in Van Buren is classified as agricul-
tural. The agricultural lands account for more acreage than any other land
use in Van Buren. The major agricultural land use is field crops, which ac-
count for 2429 acres. Other major agricultural land uses, which consist of
100 to 200 acres of land each, are dairy farms, horse farms, orchards
(mostly apples), and livestock. Some of the minor agricultural uses are
nurseries and green houses, poultry, and sheep.
Residential Uses
Approximately thirteen percent of the Town is classified as residential.
The classification of residential includes single-family units, two-family
units, and apartments. Less than three percent of all the residential proper-
ties are apartments, and are mostly in the eastern part of the Town.
Most of the smaller residential lots are to the east, on the suburbanized side
of Van Buren. The Village of Baldwinsville and the larger developments
Land Use and Transportation
Land Use Acres (Suburban Acres (Rural Side)
Agricultural 296 10314
Residential 994 1981
Community Facilities 187 13
Parks & Recreation 399 387
Commercial 148 52
Employment Centers 185 212
Utilities & RR 65 323
Open Lots 1132 4691
Water 193 315
Total 3599 18288
Land Use and Transportation

Planning Reference Guide 82
are located on the suburban side. Numerous residential parcels are located
to the west of Interstate 690. These residential parcels are larger and more
scattered than those on the eastern side of the Town. Some of the houses
in the rural part of the Town are located on parcels over ten and fifteen
acres in size.
Community Facilities and Services
Slightly less than one percent of the total Town area is comprised
of community facilities. Community facilities include schools,
churches, public buildings, and police and fire stations.
Van Buren is divided into three school districts; Baldwinsville
Central School District is the largest. The two other school districts in Van
Buren are West Genesee Central School at the southern edge, and Jordan-
Elbridge Central School to the western side of the Town (See Map 6.3).
The Baldwinsville Central School District includes Baker High, Ray Mid-
dle, and Durgee Junior High, and five elementary schools. Ray Middle
School and McNamara, Reynolds, and Van Buren Elementary are located
in the Town outside the Village. Total enrollment in the district is nearly
6,000 students.
The Town is host to a rich variety of churches (see list in the margin).
The Town Hall is located on Van Buren Road a short distance from the
Village. The Town Hall was recently enlarged to increase the courtroom
size and improve the usage of the existing space. Incorporated in the addi-
tion is an Onondaga County Sheriff Substation for an added law enforce-
ment presence in the Town and quicker response time to calls.
Four fire districts provide fire protection to the Town (See Map 6.4). The
Baldwinsville Fire Department has the largest active membership with 104
and is located in the Village of Baldwinsville. The Lakeside Volunteer Fire
Department, located in Lakeland, has forty-eight active members. About
half of its calls are in Van Buren. The Memphis Fire Department has an
Land Use and Transportation
Churches:
Baldwinsville Alliance
Baldwinsville Congregational
Beacon Gospel
Christ Community
Community Wesleyan Church
Faith Baptist Church
First Baptist Church
Full Gospel Church of God
Hillview Community Baptist
Hindu Mandir of CNY
Memphis Baptist Church
New Beginnings Christian
St. Augustines Church
St. Mary’s Catholic Church
Temple Baptist Church
Warners Methodist Church
Baldwinsville CSD
Jordan-Elbridge CSD
West Genesee CSD
Map 6.3
Land Use and Transportation

Town of Van Buren 83
active membership of twenty-three. Most calls are for emergency service
reflecting the aging population in its service area. Three-fourths
of its calls are in Van Buren. Warners Fire Department has about
thirty-two active members. About sixty percent of its calls are in
Van Buren and eighty-five percent of its calls are for emergency
services.
Of the four fire districts, only two stations are located in the
Town: Baldwinsville and Memphis. The Warners fire station is
located south of the Town in Camillus and the Lakeside fire sta-
tions is east of the Town in Geddes. For some years, consideration has
been given to locating a substation in the Town south of Baldwinsville
near the Village Green area. It could provide good response time to nearby
housing as well as attracting more volunteers from nearby housing.
Parks and Recreation
Approximately 695 acres are occupied by park and recreation facilities in-
cluding town parks, golf courses, and private recreation facilities. The
Town Parks are Van Buren Central Park, Memphis Community Park,
Snowdale Park, and the old Erie Canal. Central New York Sports is a
forty-six acre privately owned sports facility. Three golf courses are Se-
neca, Ironwood, and Foxfire. Recreation facilities are also found at public
school sites. Private facilities also provide recreational opportunities such
as tennis courts at Village Green, target range at the Rod and Gun Club,
bowling at Thunderbird Lanes, and hunting with permission on private
property.
Van Buren Central Park is a little over a hundred acres and includes a pool,
tennis courts, ball diamond, open areas, a small lake, a large hill, trails, and
picnic tables. Memphis Community Park is about four acres devoted to
softball and picnic tables. Snowdale Park is provides informal areas for
hiking and ball playing. Forty-one acres of the old Erie Canal between Ca-
millus and Jordan was transferred to the Town in 2001 for development
into park. The park will provide recreational and educational opportunities
for the Town residents. It will connect to the Camillus Erie Canal Park.
Land Use and Transportation
Recreation & Parks:
Town Parks
Van Buren Central Park
Memphis Community Park
Snowdale Park
Old Erie Canal Park
CNY Sports
Lions’ Park
Golf Courses
Seneca
Ironwood
Foxfire
Baldwinsville FD
Memphis FD Warners FD
Lakeside FD
Map 6.4
Land Use and Transportation

Planning Reference Guide 84
Cemeteries Nine cemeteries account for sixty-two acres of land. Cemeteries provide
advantages with few disadvantages. They don’t generate a lot of traffic and
make demands for public services. They do provide a permanent and stable
amount of attractive open space. They should be viewed as a positive asset
since they provide permanent open space around which to build other de-
velopment.
Commercial
Commercial and office uses account for 199 acres of land in the Town.
These uses make up approximately three percent of the developed lands in
Van Buren and less than one percent of the total Town area. As shown in
Map 6.1, the commercial and office uses are mainly located in the north-
east (suburbanized) portion of the Town. Other commercial and office
uses are located on the eastern side of Van Buren, mostly along Route 48.
Employment Centers
Employment centers are lands, or structures used for uses such as ware-
housing, or distributing and account for 398 acres of the Town. Employ-
ment centers make up almost two percent of the developed land in the
Town. Most of the lands in this land use category are located in the south-
east portion of the Town, along the New York State Thruway and Inter-
state 690. Most of the others are located along the rail lines that pass
through Van Buren. (See Map 6.1)
Utility Services and Railroads
Property owned by utility services and railroads add up to 421 acres, which
is approximately two percent of the total Town area. Utility services in-
clude sewer and water districts, as well as gas and electric companies.
There are two railroad lines in Van Buren, one runs parallel to the New
York State Thruway, along the south edge of the Town, the other runs par-
allel to Interstate 690, on the eastern border. The railroads account for
Land Use and Transportation
Cemeteries:
Burial Ground
Iona Cemetery
Kingdom Cemetery
Rural Cemetery
Riverview Cemetery
Sorrell Hill Cemetery
St. Mary’s Catholic Cemetery
Van Buren Cemetery
Warners Cemetery
Commercial Facilities:
Nobles Plaza
River Mall
Seneca Knolls Shopping Center
Tri-County Mall
Employment Centers:
Fed Ex/RPS
J.B. Hunt
Interstate Island
P & C Perishables Warehousing
Ragonese Park
Sysco Food Services/Syracuse
SYROCO
Land Use and Transportation

Town of Van Buren 85
twenty percent of this category. The utility services in Van Buren include
a sixty-acre reservoir.
Open Fields and Lots
Open fields and lots account for 5,789 acres, or twenty-five percent of the
Town area. A large percentage of this land is probably unsuitable for inten-
sive development because of environmental limitations associated with
steep slopes or poor drainage. Map 6.1 shows the locations of the open
fields and lots.
The map also shows the area designated for a proposed County landfill
site, County Site #31, in the Town. The 341 acre site is owned by the
Onondaga County Resource Recovery Agency. The Agency has assured
the Town on more than one occasion that it has no short or long-term plans
to develop the site as a landfill. It cannot visualize a situation in which the
site would be used as a land fill. It is retained in order to provide leverage
in contract negotiations with large landfill operators outside the County.
This large publicly owned site presents the Town with several alternatives
for the future use of the site and the surrounding area. These alternatives
are discussed in the Plan.
Water
Water is an important element to a community. Water is used for many
purposes including irrigation, transportation, drinking water, and recrea-
tion. The Seneca River is part of the New York State Barge Canal and runs
tion. The Seneca River is part of the New York State Barge Canal and runs
up the west side of the Town, along the north and then down the east side
of Van Buren.
This gives Van Buren a great natural resource and natural border along
three sides of the Town. In the early years, the Seneca River was Van Bu-
ren’s connection to other parts of the State. The river first brought people
and businesses to the area. Water makes up slightly more than two percent
of the total Town area.
Land Use and Transportation Land Use and Transportation

Planning Reference Guide 86
Roads
Roads and highways cover approximately six percent of the total Town
area. Just like water, roads and highways play an important role in how
land uses come about in an area. Employment centers rely on roads and
highways in order to run a business, therefore employment centers like to
be as close to a highway and an on ramp as possible. The relationship
between roads and the other land uses can be seen in Map 6.1.
B. Transportation
An access to regionally important highways and safe and efficient ways to
travel from place to place within the community are essential to the resi-
dents of the Town. In suburban towns such as Van Buren, the automobile
is one of the essentials for residents. As a mostly residential and agricul-
tural area, the roads in Van Buren connect places of employment, recrea-
tion, and community facilities for its residents.
From 1970 to 1990, the total miles traveled by County residents increased
by approximately thirty percent while at the same time the County’s
population declined by two percent1. The most popular form of transpor-
tation for Onondaga County and Van Buren remains the automobile.
Note: 1Syracuse-Onondaga County Planning Agency. 2010 Development
Guide: County Growth & Infrastructure, June 1990. The location of re-
gional population growth and economic development in Central New
York is closely connected to the availability of facilities and services. At
the same time, population growth and economic development have fol-
lowed generally the area’s highway system. Most growth and develop-
ment in the future is expected to locate close to the regional highway sys-
tem.
Land Use and Transportation Land Use and Transportation

Town of Van Buren 87
The Transportation and Land Use Cycle
Accessibility to an area is influential in the developmental process of
towns. At the same time development leads to more traffic in the area.
More traffic creates a need for the improvements of current roads and the
development of new ones. As roads change and new roads are added, an
increase in accessibility and attractiveness occurs. This cycle is known as
the transportation—land use cycle (See Figure 6.1).
Here is how the cycle works. A two-lane road becomes congested over
time as strip developments with numerous driveways provide access to
businesses. Traffic to and from the businesses impedes the flow of traffic.
Because of congested conditions, additional lanes are built that increase the
capacity of the road and provides relief from the congestion. The accessi-
bility is now enhanced, raising land values. The increased accessibility at-
tracts development. Additional development causes additional traffic and
soon congestion has exceeded previous levels. Demands repeat themselves
for additional road improvements. The cycle continues.
Reconstruction to improve the level of service is costly and in most cases
only provides temporary relief unless access is controlled. Roads become
wider, neighborhoods are divided, pedestrian accessibility is reduced, and
street trees are lost. Carefully controlling access is seldom possible because
of shallow property depths, nearness of buildings to the road, and multiple
ownership of adjacent parcels.
Land Use and Transportation Land Use and Transportation

Planning Reference Guide 88
Figure 6.1 Transportation—Land Use Cycle
Arterial improvements
Deterioration in Increased level-of service accessibility
Increased Increased traffic conflict land value
Increased Land use traffic generation change
Source: Stover, Vergil G. and Frank J. Koepke. Transportation and Land
Development (Englewood Cliffs, J.J.: Prentice Hall), 1988.
Changing market forces that drive the transportation-land use cycle is be-
yond the influence of town government. However, the use of practical
planning, zoning, and subdivision regulations can make a difference. Ap-
propriate intensities of land use relative to the road network are estab-
lished in the Comprehensive Plan. Subdivisions with rear yards boarding
on through street (reverse frontage subdivisions), increased setbacks and
lot widths, and increase right-of-way widths along major roads are also
used in zoning to aid traffic flow. The reverse frontage subdivision incor-
porates lots that back-up to an arterial road with access to the lots re-
stricted to a minor road at the front of the lot. Traffic related design stan-
dards are incorporated into the subdivision regulations and implemented
through the review process. Traffic studies should also help.
Modern Development of Town Roads
Development in the area around the Village of Baldwinsville has led to
congestion on the streets in the Village. To minimize the congestion the
Town is currently discussing a couple of plans. One plan is to reroute
NYS Route 31 so that instead of going through the center of Baldwins-
Land Use and Transportation Land Use and Transportation

Town of Van Buren 89
ville, Route 31 will go around the west side of the Village. The second
plan involves the Town of Lysander, which is to the north of Van Buren.
The plan is to build another bridge that will cross the Seneca River and
will serve as another route in the north of the Town.
Existing Roads and Highways
Road and highway responsibilities within the Town are divided between
State, County, and Town transportation or highway departments. The bulk
of the system in terms of linear length of roads is the responsibility of the
Town’s Highway Department and is funded primarily through local tax
revenues.
The Town of Van Buren is served by a regional system. The New York
State Thruway runs east-west along the southern part of the Town. Inter-
state 690 runs diagonally from the southeast to the center of the north end
of the Town. The Town is also served by State Routes 31, 48, and 173, and
numerous county and town roads.
NYS 31 (Downer Street west of I 690 and south to Elbridge) runs west
from Cicero and Clay to Baldwinsville. In Baldwinsville, NYS 31 turns
briefly northwest to join I 690 in Lysander, where it crosses the Seneca
River and enters the Town of Van Buren. In Van Buren, NYS 31 quickly
leavesleaves I 690 onto Downer Street for a short distance and then turns
south. It continues to just north of Memphis when it turns west and enters
the Town of Elbridge. In Elbridge, Route 31 again takes a westerly direc-
tion through the Village of Jordan and onto Cayuga County and the Vil-
lages of Weedsport and Port Byron.
NYS 48 (State Fair Boulevard) begins as Oswego Street at I690 in Lysan-
der. NYS 48 turns and continues onto Syracuse Street in Baldwinsville,
and becomes State Fair Boulevard in Van Buren, ending at I 690.
NYS 173 (Warners Road) runs northwest from Onondaga Hill southwest
of Syracuse, through Camillus and Van Buren to NYS 31 in Van Buren.
Land Use and Transportation Land Use and Transportation

Planning Reference Guide 90
Table 6.3 shows traffic counts for selected roads in the Town. They illus-
trate how traffic counts on apparently minor roads can add-up. Table 6.4
provides a national standard for accepted volumes of traffic on different
classes of road. trate how traffic counts on apparently minor roads can add-
up. Table 6.4 provides a national standard for accepted volumes of traffic
on different classes of road.
Table 6.3 Traffic Counts, Selected State and County Roads,
Town of Van Buren, Various Years
Source: Onondaga County Department of Transportation
Road Road Segment Year Peak Hour 24 Hour
Brickyard Road Peck Road-Van 1998 406 3,423
Connors Road River Road- 1998 17 91
Kingdom Road Perry Road-
West Dead
Creek Road
1998 52 503
River Road Old Route 31- 1998 59 213
Walters Road Van Buren
Road-Winchell
Road
1999 140 1,106
West Dead Creek Kingdom Road- 1998 198 2,261
Connors Road W.Sorrell Hill
&E. Sorrell Hill
Roads
1998 33 321
Land Use and Transportation Land Use and Transportation

Town of Van Buren 91
Table 6.4 Nationally Accepted Volumes for Different Classes of Roads:
Maintenance and Improvements of Town Roads
The Town of Van Buren has been improving its highway department fa-
cilities bit by bit over the past few years, and plans to continue improving.
The Town is in the process of making the current town barn presentable,
and upgrading the equipment. Van Buren has recently received four to five
new trucks, and in 1999, the Town built a salt shed.
Roads are paved with an inch to an inch and one-half overlay of material
once every ten years. Because of variations in ground conditions, the base
conditions of older roads, and the quality of road construction in the
1960’s,
some roads are resurfaced more frequently. This resurfacing frequently
involves a six to seven inch cold mix of materials that is used to build up
the road.
The Town of Van Buren currently has forty-one miles of paved town
roads. Van Buren does not have a long-term paving program, but the Town
does pave approximately ten miles of roads each year. Van Buren also
paves a mile or so in the Village Green area.
In 1998, Van Buren received two grants from New York State for the re-
construction of roads at $125,000 each. The roads chosen in 1998 were
Idlewood Boulevard and Crego Road. In 2000, the Town received
Land Use and Transportation
Limited Access 20,000 plus average daily traffic
Arterial 5,000 to 20,000 average daily
Major Collector up to 5,000 average daily traffic
Rural or Residential Collector up to 3,500 average daily traffic
Minor Rural or Residential up to 1,500 average daily traffic
Land Use and Transportation

Planning Reference Guide 92
$20,000 for work to be done in the Hamlet of Memphis. For 2001, Van
Buren is planning for a total rebuilding of both Seneca Boulevard and
Morgan Road for $75,000.
In Village Green, the original design for the drainage system was faulty.
Easements do exist along the front and back yards. At the same time
Seneca Knolls uses almost all open ditches for drainage. The Town will lay
the pipes if the homeowner is willing to buy the pipes.
Other Transportation Facilities
Access to Hancock International Airport located just north of the City of
Syracuse is simple and efficient from the Town of Van Buren. A rail runs
east to west along the southern edge of the Town with connections
throughout Onondaga County, the City of Syracuse, and other parts of the
State. Another rail line runs along the eastern side of Van Buren.
Bus service is also available to the Town. Centro includes service from
Memphis-Warners to places such as Downtown Syracuse, Carousel Cen-
ter, Fairmount Fair and to neighboring Villages such as Jordan and Skane-
ateles.
Land Use and Transportation Land Use and Transportation

Town of Van Buren 93
Public Utilities
VII. Public Utilities
Provision of public facilities, services, and utilities is vital to growth in the
Town. Planning for future development must relate the demand for these
services to existing needs. Sound judgments regarding the provision of
these services requires an understanding of the relationship between devel-
opment and public facilities, services, and utilities.
Zoning and subdivision regulations can contribute to economies in public
utility development by effecting a more complimentary balance between
utilities and the intensity of land use development. Planned and coordi-
nated growth and the provision of public facilities, services, and utilities
mean less costly services.
A. Water
Water is a very important resource and its availability or lack thereof can
shape the development of an area. Water, sewers and good roads are neces-
sary for development at urban and suburban densities and public water
more than any other service can lead to demands for additional infrastruc-
ture extensions. It is relatively inexpensive to extend this service, but the
impact that it has on development can be enormous. Development often
occurs more quickly, where public water service is available and sanitary
sewers and improved roads soon follow. The availability of water shapes
the location of residential, commercial, and industrial developments and
the ultimate density of an area.
Onsite wells supply water to a large part of the Town. Water service in
Van Buren covers most of the land east of Interstate Route 690, as well as
Harbour Heights west of I-690. The Van Buren Water and Sewer Depart-
ment administers Town water districts. The Districts obtain water from the
Village of Baldwinsville, and the Onondaga County Water Authority
(OCWA) from the Metropolitan Water Board’s (MWB) Western
Reservoir.

Planning Reference Guide 94
MWB’s Western Reservoir is located on Butcher Ridge off Canton Street. It
is a regional reservoir with a hundred million-gallon capacity to store water
from Lake Ontario. The water is wholesaled to OCWA for distribution to
retail customers. A sixty-inch water transmission line from the MWB’s ter-
minal reservoir in Clay feeds the Western Reservoir. The transmission line
crosses the Seneca River into the Town near Seneca Beach Road and Route
48. A this location, a meter pit monitors water metered to a sixteen
inch OCWA transmission line which flows south into Geddes and connects
at another meter pit to the distribution line services Interstate Island custom-
ers in Van Buren. A meter pit on Connors Road diverts water to the Van
Buren Town Park on Connors Road and the Connors Road Water District.
The Baldwinsville and OCWA water systems interconnect and provide
backup for one another. OCWA has the capacity in an emergency to expand
distribution or replace the Village wells with water from Otisco Lake or
Lake Ontario.
Extension of public water service is accomplished through creation of water
districts, which are based on feasible cost estimates per customer for con-
struction of new water lines. Contaminated groundwater or substantial
growth usually generates the demand for new water services. Pumping costs
related to changes in elevation and feet of water lines per customer are the
most significant costs factors.
Over a half-dozen water districts serve the Town. The water system is basi-
cally fifty years old. It includes thirty-five miles of pipe. Most are transite,
eight miles are ductile iron and some plastic, and none are lead. A one-inch
line is located on Tappan Street. Other sizes vary from six to sixteen inches
in diameter.
The largest water districts are Seneca (about 1800 customers), Harbour
Heights and Harbour Heights Extension (together about 265 customers).
The Harbour Heights Districts receive water from Baldwinsville through a
ten-inch main. A standpipe to the South of Route 31 would improve fire
protection and facilitate development in the area. The Seneca Water District
extends from Village Green east to the Geddes Town line. An eight-inch
Public Utilities

Town of Van Buren 95
main carries water from the County source in addition to the ten-inch main
from Baldwinsville. Water can be drawn from either source by regulation
of valves. Seneca Water District also has a million gallon water tank to
maintain a reserve supply and constant pressure.
The Jack’s Reef Water District is a newly formed district in response to
problems in Jack’s Reef. The water line from near Warners to Jack’s Reef
is the result of a cooperative effort between the Towns of Elbridge, Lysan-
der, and Van Buren. The District would supply water to the Jack’s Reef
area and in the process to the residents along Route 173 and Bennetts Cor-
ners Road south to the State Thruway. The Towns signed an inter-
municipal agreement for the project and the OCWA has offered to con-
struct the necessary infrastructure to construct, operate, and maintain the
new water system.
B. Sewage
Sewage treatment systems are of utmost importance since they are essen-
tial for a healthy environment and a safe water supply. The two most com-
mon methods for treating wastewater or sewage are using a septic system
or connecting into a public sewer system which transports the waste to a
treatment facility.
Septic systems are most common in rural areas where hookup to a public
sewer system is unlikely. Homes served by septic systems often require
large lots since these systems tend to have a life span of less than twenty-
five years before the system has to been moved. Furthermore, a large lot is
often desirable for rural lots that are dependent on well water, so that the
well and the septic system leach field can be located far apart from each
other to reduce the likelihood of contamination of the drinking water sup-
ply.
The County Department of Health’s Regulations require a minimum lot
size of 40,000 square feet where no public water or sewer are available and
a minimum lot size of 20,000 square feet where public water is available,
but public sewer is not. Site specific conditions may vary the minimum
Public Utilities Public Utilities
Planning Reference Guide 96
requirements.
Sewers are necessary to accommodate the densities associated with subur-
ban development. They make it feasible for lots to be smaller since large
leach fields do not need to be constructed. In addition, smaller lots keep the
cost of sewers down since the sewer lines will not have to be as long.
Sewer service is a very important public service and often follows the con-
struction of water lines in an area.
Most of the areas in the Town use onsite wastewater treatment systems.
The eastern half of the Town is in the Onondaga County Sanitary District.
Eight Town sewer districts transport wastewater to the County trunk sew-
ers and to a sewage treatment plant for the Harbour Heights District. The
Village Green Sewer District is owned by Seneca Sewerage and serves most of
Village Green, it also sends its sewage to the County trunk line.
The Harbour Heights treatment plant is scheduled for replacement by 2003
with a pump station and interceptor that will feed into the County’s trunk
sewer line. The line will provide sewage collection on Downer Street,
which should encourage development in the area.
Sewer Districts:
Harbour Heights
Floral Park/Stiles Road
Interstate Island
River Mall
Seneca
Interstate Island Exit 1
Morgan Road
Interstate Island Exit 2
Public Utilities Public Utilities

Town of Van Buren 97
Part II. Comprehensive Plan

Planning Reference Guide 98 Comprehensive Plan

Town of Van Buren 99
I. Summary of the Comprehensive Plan
MAJOR TOWN GOAL:
• Conservation of existing residential neighborhoods and existing
farming activities; promotion of business, commercial, and light in-
dustrial uses; and promotion of a network of natural open space
through implementation of planning policies that maintain a suitable
balance of uses and densities while allowing for appropriate future
growth.
GENERAL LAND USE GOALS:
• A land use pattern that provides options for a variety of residential
environments, opportunities for recreation and culture, and desirable
locations for business and industry.
• A land use pattern that is consistent with the capabilities of the road
and street systems, sewage disposal systems, water distribution sys-
tems, drainage facilities, public open space facilities, and natural en-
vironmental systems.
• A land use pattern that separates incompatible uses and densities and
ensures non-encroachment.
BASIC PREMISES AND ASSUMPTIONS
The basic premises and assumptions that have had the most obvious and
direct influence on the Plan are summarized below. Many of the premises
and assumptions are based on the goals and objectives established to
guide the development of the Plan or on various demographic or eco-
nomic projections.
Summary of Plan

Planning Reference Guide 100
Demand for Housing
• During the 1980’s, Van Buren accounted for 5% of the residential building permits in Onondaga County. During the 1990’s, the number was 1.9%. Residential permits in the County declined from nearly nineteen thousand in the 1980’s to nearly eleven thousand in the 1990’s. An ample supply of housing exists in the Syracuse Metro-politan area. A significant part of the future demand is for housing to accommodate baby boomers. The housing will range from active adult communities and independent living facilities to skilled nursing facilities. The Plan proposes to accommodate the limited amount of anticipated demand for these future residential uses, while protecting existing residential neighborhoods.
Employment Growth
• Relative location in the Metropolitan area, highway access, a water supply, an educated labor force, a choice of housing, and an excellent school system are positive development assets. Overall Metropolitan job growth declined from 10.4% in the 1980’s to 3.8% in the 1990’s through July 1998. Job growth in New York State was not much bet-ter—13.9% growth in the 1980’s and 3% growth in the 1990’s through July 1998. National job growth in the 1980’s was 21% and 21.3% in the 1990’s through July 1998. Identifying and zoning for a few highly suitable sites for light industrial uses is of greater importance than zoning vast areas for industrial uses. A proactive program in coopera-tion with Village and Metropolitan groups and focused on suitable economic development sites is a prerequisite for Van Buren to capture its share of employment growth and related economic benefits.
Land Use
• Residential development will continue to consume the most acreage in Van Buren. Future development will not consume the majority of land within the Sanitary District during the next twenty years. Agricultural activity and scattered residential lots are predominant in most areas not covered by the Sanitary District. The Plan proposes policies to en-courage the location of major developments in areas that are serviced by public utilities. Scattered lot residential development in areas domi-nated by agricultural activity will continue although policies to limit the negative impacts on future development and on agricultural land uses is anticipated.
Summary of Plan
Comprehensive Plan

Town of Van Buren 101
Roads and Highways
• The existing road and highway system with few exceptions is the ba-sic network Van Buren will have for the near future. Few State or Federal funds will be available for new roads or extensive improve-ments. Traffic generated by strip commercial development and strip lot residential developments is a major factor in increasing road and highway congestion and increasing accident rates. The responsibility of the Town is to maintain land use patterns that will ensure the safe and efficient movement of people and goods throughout the network.
Environmental Considerations
• All types of development alter the natural environment to some extent. Often the adverse environmental impacts are minimized. On the other hand, the cumulative impacts of individual projects with seemingly minimal impact on the environment go unassessed, although the col-lective impact can be significant. The Planning Reference Guide pro-vides maps of environmentally sensitive features (See Maps 5.1 to 5.13). Identification of important environmentally sensitive areas prior to development will help both the Town and the developer understand what areas need protection. The same maps help identify areas suitable for development.
Metropolitan Opportunities
• The Plan proposes that Van Buren help develop a cooperative ap-proach to development within the Syracuse Metropolitan Area in order to make a wide range of jobs and cultural opportunities accessible to Van Buren residents and in turn enable Van Buren business and em-ployment centers to draw upon and be accessible to Syracuse area resi-dents. This includes recognition that Van Buren must plan to accom-modate its fair share of population and employment growth. It also means Van Buren should take the lead in influencing the activities of county and state agencies that affect development within the borders of Van Buren. Van Buren must convey the perception the Town is on-top of planning issues and knows what it wants. Issues related to utili-ties, transportation, economic growth, solid waste, and environmental protection are of particular importance.
Summary of Plan Summary of Plan

Planning Reference Guide 102
A “Special” Character for Van Buren
• The Plan proposes that Van Buren emphasize its existing residential, agricultural, commercial, and employment center uses; its rural char-acter; and its proximity to Baldwinsville, while considering develop-ment. Although difficult to define, this policy is of fundamental im-portance to the Plan and is the basis for the most important proposals of the Plan. Van Buren needs to strive to make the case that it is a “special” community in Onondaga County. Van Buren has a special character that can be appreciated and strengthened while providing for necessary and desirable growth. The Plan provides a cautious and positive approach intended to be used as an intelligent tool for guiding the future development of Van Buren.
THE COMPREHENSIVE PLAN DIAGRAM
The Plan Diagram gives geographic reference and a broad spatial context
to the goals of the Comprehensive Plan and its most significant physical
design proposals. The Plan Diagram shows the relationships between the
different elements of the Plan and emphasizes the unity of the Town-wide
physical design proposals.
Nine different types of areas are designated on the Plan Diagram: 1)
Neighborhood Conservation Areas, 2) Hamlets, 3) Development Areas, 4)
Special Industrial Opportunity Areas, 5) Water Development, 6) Commer-
cial Areas, 7) Rural Reserves, 8) Greenway System and 9) Baldwinsville.
1) Neighborhood Conservation Areas • These existing neighborhoods exhibit conditions for a livable and
healthy environment. These areas can serve as models for future hous-ing developments in the Town. Implementation of the Plan will focus on the protection of the existing neighborhoods from incompatible land uses and excessive traffic. Development projects in these areas will follow design guidelines that will result in the compatible integra-tion of the projects with the existing neighborhoods.
Summary of Plan
Comprehensive Plan
Summary of Plan

Town of Van Buren 103
2) Hamlets • Hamlets provide much of the existing village/country character of Van
Buren. The unique character of each hamlet should be promoted and encouraged to expand. Mixed uses including locally owned small businesses should be encouraged. Pedestrian amenities, the street-scape, and historic qualities should be upgraded. Flexibility of use should be encouraged, but with greater attention to design.
3) Development Areas • Development areas favor the highest level of development activity for
the next twenty years. The areas are characterized by a combination of factors including availability of land; proximity to public facilities and accessibility of services
• Envisioned within the Plan are developments with mixed residential and commercial uses. Even office or a small light industrial use might locate in these areas. Implementation of planning policies and design guidelines will ensure that the private development sector is provided with the flexibility necessary to realize development goals while mini-mizing adverse community and environmental impacts.
• Industrial uses near hamlets need special care to avoid adverse impact to the hamlets.
4) Special Industrial Opportunity Areas (SIOA)
• The concept behind SIOAs goes beyond narrowly defined industrial uses. The concept includes multiple-use development, which mix three or more uses that are organized to make a viable project. They may include office, research, manufacturing, or warehousing in addition to a variety of housing types. SIOAs are like PUDs, but are designed as more self-contained and economic viable developments.
• Four general locations for SIOAs are identified on the Comprehensive Plan Diagram: 1) Walters Road Area, 2) Northwest of Dead Creek Road/Old Route 31 Area, 3) County Site #31 (owned by Onondaga
County Resource Recovery Agency - OCRRA). It is approxi- mately 400 acres and is mostly agricultural leased land to local farmers.
• Given their closeness and accessibility to Downtown Syracuse and Destiny USA, SIOAs three and four offer an opportunity to make a difference in the development of the northwestern part of Onondaga County and the Town of Van Buren. County Site #31 (which has no plans by OCRRA for a DEC permitted landfill for ash) is ideal for a
Summary of Plan Summary of Plan

Planning Reference Guide 104
countywide recreational/golf/open space facility or for a multiple-use development. The area is large enough, the opportunities broad enough, and the planning climate strong enough to attract major pri-vate investments. County leadership can help in the development of the area’s resources by planning for appropriate infrastructure invest-ments.
5) Waterfront Development • The riverfront has potential to attract development to the Town be-
yond the immediate river area. A trail system along the river, small tourist-oriented commercial developments, and a marina would en-hance the image of the Town. It would amplify and extend the Bald-winsville image to Van Buren. In addition, where feasible, residential developments could be built to take advantage of riverfront locations.
6) Commercial Areas • Commercial areas are areas where proposals to expand commercial
development will be encouraged. A significant effort is needed to re-build existing commercial structures that have outlived their useful-ness. Some of these structures detract from the character of the Town. The focus of planning and development in these areas is on revitaliz-ing commercial development and promoting beautification and en-hancement of existing commercial buildings and grounds. These ef-forts will go a long way in extending a positive image from Baldwins-ville to Van Buren.
7) Agricultural Reserve • The remaining area of the Town is designated as agricultural reserve
on the Plan Diagram. Due to the impracticality of extending services such as public sewer to this area, it is considered unsuitable for planned developments, but suitable for scattered lot developments and agricultural uses. Agricultural uses might be encouraged through a purchase of development rights program. Additional policies might discourage residential strip lot development that would compromise the rural character, lead to inefficiencies in the delivery of essential services, and prevent valuable road frontage from being used more efficiently in the future. Protection of these areas is important because they represent future expansion areas for development.
Summary of Plan
Comprehensive Plan
Summary of Plan

Town of Van Buren 105
8) Greenway System • The greenway system is an interconnected corridor of greenways and
open space that will safeguard the visual and rural qualities of Van Buren and provide recreation opportunities. For the most part, the ar-eas designated are undevelopable for other uses. Flood hazard areas, wetlands and surface streams, and steep slopes are the particularly sen-sitive features that form the core of the greenway system depicted on the Plan Diagram. The greenway system is a concept that will be achieved beyond the time horizon of this Plan. Nevertheless, the areas depicted in general terms should help identify opportunities for future generations. Inappropriate intrusions into these areas should be avoided.
9) Baldwinsville • The Village of Baldwinsville is the “Old Town Center” for the Town
of Van Buren. It is and will remain an important cultural center for all residents of the Town. The Village provides much of the identity that is associated with this part of the Syracuse Metropolitan Area. Devel-opments near the Village are encouraged. The Town of Van Buren
should work with the Village to develop the southern area of Village.
Summary of Plan

Planning Reference Guide 106 Comprehensive Plan

Town of Van Buren 107
Agricultural and Open Space
II. Agricultural and Open Space
GOAL
Goal.—Conservation of agricultural, natural resources, open space, and
historic resources for the Town’s long term recreational, environmental,
cultural and economic benefit.
BACKGROUND
The quality of the natural environment greatly influences the general
health of the Town. The agricultural and open space element of the Com-
prehensive plan is based on the premise that maintenance of high quality
living and agricultural environments requires the adoption and implemen-
tation of a series of policies. These include promoting conservation of agri-
cultural, natural resources and open space, the linking of environmentally
sensitive areas into a continuous open space system, and the conservation
of prime agricultural lands.
Agricultural
Agriculture is a mainstay of Upstate New York and important in Onondaga
County and the Town of Van Buren. The Town relies on agriculture for
more than a tax base requiring few services. Agricultural fields form the
basis of the character and sense of place of the Town. In fact, the allure of
the Town results in continued pressure to convert farmland resources.
Some families in Van Buren have been stewards of the soil for many gen-
erations. Their contributions to the community go well beyond the value of
the products they produce. Over 10,000 acres of land, or nearly half the
land in Van Buren, are classified in agricultural use in the land use survey.
About a fourth of the agricultural uses are field crops. Other major uses are
dairy farms, orchards, and livestock. Minor uses are nurseries and poultry.
Horse farms are also using agricultural lands. Many of the farmlands are in
an agricultural district.

Planning Reference Guide 108
Preservation of farmland and open space is highly cost effective for local
governments in terms of the ratio of revenue versus the cost of community
services. Recent studies completed by the American Farmland Trust for
counties in New York indicate that the median ratios of revenue versus the
cost of community services was 1:1.23 for residential, 1:0.27 for commer-
cial/industrial and 1:0.29 for farm/forest/open land.
Thus, farmland and open space, which provides a net tax benefit to the mu-
nicipal budget, can help to stabilize mounting costs of services. It may be
less expensive for the community to purchase development rights than to
pay the cost of services to residential developments.
Environmentally Sensitive Areas
Prime farm lands, flood prone areas, steep slopes, areas critical to the con-
servation of water supplies and streams, and areas valued for wildlife and
recreational opportunities are the important environmentally sensitive ar-
eas.
Currently the Town of Van Buren enjoys the benefits of many wetlands,
streams, floodplains, and mature woodlands that are relatively unaltered.
These natural resources play highly critical roles in maintaining and con-
trolling important natural processes. Development pressures can threaten
these important resources. Incorporating particularly sensitive areas into a
continuous open space system would promote natural resource conserva-
tion.
Environmental overlay zoning and resource protection standards can help
to insure that only development that is environmentally sound occurs in or
near sensitive areas. If suitable care is taken, development can occur while
natural processes continue to function at a desired level.
Open Space System
A continuous open space system incorporating particularly sensitive areas
Comprehensive Plan
Agricultural and Open Space
Town of Van Buren 109
would help natural resource conservation in Van Burn. Benefits from an
open space system include protection against erosion and flooding, conser-
vation of natural filters for pollution, separation of development areas with
a natural buffer, added value to adjacent properties, lower service costs,
and conservation of habitat for vegetation and wildlife.
The Seneca River waterfront areas represent a special opportunity for open
space. A mix of residential, recreational, and service uses can enhance the
Seneca River open space corridor. The Town has an opportunity to pro-
mote desirable public and private uses along the corridor. The areas adja-
cent to Baldwinsville provide a natural starting point for developing the
system.
Open space lands not sensitive from an ecological standpoint are also im-
portant. All developed sites should contain land that is free from structures,
paving, and similar features. In some cases, these lands can form a system
of spaces that buffer incompatible uses and provide an aesthetically pleas-
ing landscape of trees, grass, and other vegetation.
OBJECTIVES AND POLICIES
Agricultural Lands
• Objective.—Conservation of agricultural lands and prime agricultural soils.
• Policy.—Adopt zoning controls and other provisions that promote conservation of land for agricultural use while not inhibiting appropri-ate non-agricultural uses.
• Policy.—Pursue opportunities for the development of a purchase of development rights for agricultural lands.
• Policy.—Encourage participation in the County’s agricultural district program.
Agricultural and Open Space Agricultural and Open Space

Planning Reference Guide 110
Environmental Protection
• Objective.—Conservation of natural areas which preserve or protect environmental quality or the ecological balance. Such areas include wetlands, streams, creeks and other drainage channels, floodplains, mature woodlands, steep slopes and unique landforms.
• Policy.—Adopt environmental overlay zoning that protects environ-mentally sensitive area.
• Policy.—Maintain an environmental inventory of the Town to be used as a beginning reference in implementing environmental overlay zon-ing and in reviewing environmental impact assessments.
Open Space System
• Objective.—An open space conservation system linking environmen-tally sensitive areas, parkland, drainage easements and other areas to serve the recreational, environmental, and health and safety needs of the present and future population.
• Policy.—Encourage developers to save usable open space within de-velopment projects and promote the establishment of a town-wide open space system by arranging buildings or building plots in groups interspersed within open spaces that connect with open space net-works of other development projects.
• Policy.—Provide access and essential utilities and improvement, where appropriate, to open space lands.
• Policy.—Adopt design standards and criteria to insure that improve-ments such as roads traversing the open space system are compatible with the special nature of these lands.
IMPLEMENTATION STRATEGIES
Environmental Overlay Zones
Environmental overlay zoning involves zoning districts that provide an
added layer of standards. Thus, properties are located in two districts.
Comprehensive Plan
Agricultural and Open Space Agricultural and Open Space

Town of Van Buren 111
Regulations determined by the conventional zoning district still apply, but
for projects within an overlay zone, compliance with additional resource
protection standards is mandated. In Van Buren, floodplains, steep slopes,
and stream corridors might lend themselves to the development of an over-
lay zone.
Purchase of Development Rights
Participate with Onondaga County in a purchase of development rights
program (PDR). In order to achieve maximum benefit from a PDR pro-
gram, town, county, state, and non-profit efforts must be coordinated to
achieve the maximum integration of protected farm parcels. The Town
Board should pursue an aggressive program to acquire agricultural lands
and open space.
Environmental Inventory
A compilation of environmental data is the basis for planning and land-use
decisions relating to environmental concerns. The Planning Reference
Guide prepared for the Comprehensive Plan will become the environ-
mental inventory for the Town when the plan is adopted.
DESIGN CONCEPTS AND CRITERIA
Natural resource conservation in Van Buren is enhanced by incorporating
environmentally sensitive areas into a continuous open space system.
These areas would include the least intrusive and most environmentally
sound development. Particularly sensitive features such as flood hazard
areas, wetlands and surface streams are the most logical choices to form
the interlined spine of the open space system. Unique landforms and ma-
ture woodlands are other features that may be connected to the system.
Design Criteria for Open Space Areas
In order to encourage appropriate use of areas within the open space sys-
tems, certain facilities may be provided. Care must be taken to insure that
the design of parking lots, roads, and other such facilities are in keeping
with the desired character of these areas. Hiking or biking trails should be
planned in the open space system.
Agricultural and Open Space Agricultural and Open Space

Planning Reference Guide 112 Comprehensive Plan

Town of Van Buren 113
III. RESIDENTIAL AREAS
GOALS
• Goal.—A high quality living environment that accommodates resi-dential needs with respect to housing type, cost, and location.
• Goal.—Protection and improvement of the desirable character and identity of existing residential neighborhoods.
• Goal.—New residential development appropriately located, offering quality design, and providing adequate usable open space.
BACKGROUND
High quality living environments are dependent on wise planning. Con-
sistent goals, objectives, and policies implemented over time are required.
The Plan is based on the following assumptions:
• The number of households will continue to increase modestly, • Suburban development will expand from the existing suburban areas, • Rural residential lot development will continue in small numbers on
large lots in the rural portion of the Town, • Environmental reviews will be of increasing importance in the devel-
opable residential areas, and • Pressures on agricultural and natural resources will increase.
Neighborhood Character
The character of neighborhoods is a vital concern of the people who live
in them. Protection of residential neighborhoods from the encroachment
of incompatible uses is important in maintaining the variety, identity, and
desirable character of neighborhoods. The use of design guidelines can
help protect neighborhoods from the negative impact of commercial or
industrial development and the effects of high traffic volumes.
Residential Areas

Planning Reference Guide 114
Locating New Development
Many areas suitable for development also have environmentally related
problems such as steep slopes, flood prone areas, aquifer recharge areas,
streams, and poor septic suitability. Scattered development is probably one
of the greatest threats to the best long-term use of land. Strip lot or piano
key subdivisions also can have negative impact on the use of land. The
Town through land use policies such as density averaging can encourage
development to locate in the best areas.
The Demand for Housing
The total population in Central New York and in Onondaga County has
remained stable over the past thirty years. However, the number of house-
holds is increasing slightly because of a decline in the size of households.
The age distribution of the population throughout the Region is aging. The
percent of young people, age 20-34, is declining while the age groups over
45 years of age are increasing. These demographic factors directly influ-
ence the amount and the variety of housing types in Van Buren.
Housing built in the future may not always reflect the kinds of housing
built in the past. Single-family starter homes may always be part of the
mix, but may no longer dominate the market. The Town has a good mix of
housing types between single-family detached homes, to town homes, and
to apartments. The increasing demands from baby boomers and seniors
will influence the mix in the future.
The location, quality, and type of new residential development will exert a
significant influence on the future character of Van Buren. Careful plan-
ning of new residential development will take into account housing market
demand, provision of adequate public services and facilities, and protection
of environmentally sensitive areas, open spaces, prime agricultural and
other characteristics that make Van Buren an enjoyable place to live.
Residential Areas
Comprehensive Plan

Town of Van Buren 115
OBJECTIVES AND POLICIES
• Objective.—Protection of existing residential neighborhoods from the encroachment of incompatible uses that may have a negative impact on the residential living environment.
• Objective.—New residential development appropriately located with respect to the natural environment, community facilities and services, transportation systems, and the image and character of its surround-ings.
• Objective.—Safe, secure, aesthetically appealing residential develop-ment projects in which important natural areas are conserved and ade-quate usable open areas are provided in either private yards or com-mon areas.
• Policy.—Strengthen zoning standards and site design guidelines to provide for adequate buffering of residential areas from commercial or industrial development and from the effects of high traffic volumes.
• Policy.—Encourage new residential development in areas where com-munity services and facilities are available.
• Policy.—Amend the Zoning Ordinance to encourage flexibility in neighborhood layout. Include clear and concise standards to be applied by the Planning Board in reviewing site plans.
• Policy.—Prepare illustrated design guidelines that clarify the objec-tives of the Town’s development policies and standards.
• Policy.—Give favorable consideration to residential development pro-posals that incorporate building forms that relate to the size, shape, and character of the surrounding development.
RESIDENTIAL AREASResidential Areas

Planning Reference Guide 116
GENERAL DEVELOPMENT CONCEPTS
Large Lot Subdivisions
Consumer preference for low-density living as well as a perception of an
adequate supply of developable land contributes to the demand for large lot
subdivisions. Sometimes Onondaga County government officials and pol-
icy-makers believe development of large lots help to keep service needs to
a minimum and provide a more stable tax base than higher density devel-
opments. Accordingly, many land use regulations favor large lot develop-
ment.
Large lot subdivisions result in public utilities traversing substantial dis-
tances without being used to full capacity. The resulting high construction
and maintenance costs place an undue financial burden on local govern-
ment and homebuyers alike. Incremental additions of dispersed large lot
subdivisions in the community can produce other problems over the long
run including storm water runoff impacts on natural drainage ways, ero-
sions of rural character, and inhibiting more productive longer term devel-
opment.
Residential Strip Lot Developments
Subdivisions of parcels resulting in lots fronting on rural roads are found in
Van Buren. These “strip lot” or “piano key” subdivisions over time create
negative impacts on the transportation system, rural character, demand for
public services, and future land developability.
Strip development produces numerous, close-together points of traffic in-
terruption on roads. Traffic safety is compromised, speed limits are low-
ered, and the functional capacity of the road is reduced. Homebuyers who
were originally attracted by the rural character find themselves living on a
road that has assumed a semi-suburban character.
Strip lot subdivisions prevent efficient use of land and development re-
sources by preempting road frontage and restricting access to areas beyond
the roadside development. Large areas of open space are blocked from
view, further compromising rural character. When water and sewer lines
RESIDENTIAL AREAS
Comprehensive Plan
Residential Areas

Town of Van Buren 117
are extended in response to demands created by strip lot development,
even more strip development is encouraged, resulting in even greater haz-
ards and inefficiencies.
Cluster Development
Cluster development is a project design technique that calls for modifica-
tion of lot size standards specified in the zoning ordinance to concentrate
dwellings in specific areas of a tract and leave the land “saved” as usable
open space. Although lots smaller than those specified in the zoning regu-
lations are developed, clustering respects a zoning district’s permitted
gross density (number of dwellings per acre relative to the entire develop-
ment site.
By minimizing the amount of land that is disturbed in grading and clearing,
clustering permits the retention of landforms and vegetation that distin-
guish the site and increases the amenity of the project. Minimization of
land disturbance also helps to prevent sedimentation and erosion that is
costly to control. In addition, flexibility in siting dwellings in a cluster de-
velopment provides opportunities to reduce energy demand by taking ad-
vantage of development designs that minimize exposure to winter winds
while providing maximum exposure to the sun.
A clustering plan can result in reduced per unit site preparation costs and
lower per unit land prices. Development of smaller lots with shorter linear
front footages requires shorter distances to be traversed by sewer and water
lines. Street and sidewalk lengths are also reduced. Per unit charges for the
installation and maintenance of public services can therefore by expected
to be lower for clustered dwellings than for homes in a standard large-lot
subdivision.
Developers are required to reserve undeveloped land within the develop-
ment as common open space in exchange for modification of the require-
ments relating to the configuration of the conventional subdivision. Clus-
tering of housing units and the saving of open space are means by which
Plan objectives can be met concerning conservation of rural character, re-
source conservation, and the prevention of strip development of road front-
RESIDENTIAL AREASResidential Areas

Planning Reference Guide 118
age.
Cluster development including a variety of housing types is currently pos-
sible in the Town under the enabling authority of Section 278 of the Town
Law. However, the Town has not defined criteria for evaluating cluster
proposals, which compromises the ability of the Town to encourage desir-
able cluster development.
Planned Unit Development
Planned Unit Development (PUD) is a land planning and project design
approach that calls for a site review and negotiation process that allows
flexibility in the siting of buildings, the mixture of house types and land
uses, useable open space, and the preservation of significant natural fea-
tures.
Like cluster development, planned unit development can be useful in as-
suring that open space and recreation areas will be incorporated into site
plans. Per unit cost advantages arising from either net or gross density in-
creases and per unit reductions in road length and paved areas also can
translate into per unit savings in raw land costs and savings in the installa-
tion of roads, sewer lines and storm water management systems.
Housing Types
Standard single-family detached homes
A single-family detached house is a freestanding structure that occupies its
own parcel. Conventional developments follow prescribed setbacks for
front, side, and rear yards. It is built in a wide range of densities, models,
and site plan arrangements.
RESIDENTIAL AREAS
Comprehensive Plan
Residential Areas

Town of Van Buren 119
The relationships between houses and sites and to the provision of privacy
and orientation for each house are important to the development of good
neighborhoods. Lots and placement of houses should respond to the site’s
natural features to avoid a uniform and monotonous pattern of develop-
ment. Garage doors should be located or designed to minimize their street
presence. Blocks on linear streets should be short to minimize long view of
driveways and the fronts of houses. Setbacks should be deeper on collector
streets and shallower on minor residential streets like cul-de-sacs to rein-
force the hierarchy of the street system. Consideration should be given to
varying the size of lots within a development by twenty-five percent to ac-
commodate a site’s natural features.
Town homes
Townhomes have long been a popular housing option. They are usually
more affordable than detached units. They are single-family attached units
with a common wall. Lot widths generally range from twenty-two to
thirty-two feet. Usually each house is a complete entity with its own utility
connections, front and rear yards, and a front door opening to the street.
The land is owned by the resident or through a condominium.
The gross densities in suburban townhome projects vary with natural site
conditions, size of the units, and with the requirements for parking. Eight
to twelve units per acre are typical, but higher density projects do exist in
some areas.
Apartment homes
Garden apartments are a particular type of multifamily units, usually
within a two or three story building, and with about ten units per building.
Garden apartments appeal to singles, young couples, empty nesters, and
elderly residents. Sometimes they appeal to families who cannot afford to
purchase or rent a single-family house.
Buildings in garden apartment developments are located around the site to
permit ample areas for landscaping and parking. Densities are generally ten
RESIDENTIAL AREASResidential Areas

Planning Reference Guide 120
to twenty units per acre. Modern garden apartment developments place
greater emphasis on amenities such as swimming pools, exercise rooms,
and general landscaping.
Design Review Process
The active participation of the Town and the developer working together
creates a process that leads to good design solutions. Developers have an
interest in delivering a well-designed product. The Town’s concern for the
long-term impacts of development is equally legitimate.
The legal authority to impose design guidelines and review site plans is in
New York State Town Law, Section 274-a, which authorizes site plan re-
view when development of a single parcel of land is proposed, and in state
enabling legislation authorizing subdivision review.
Subdivision regulations allow towns through their planning board to re-
view how newly created lots will be laid out. Town Law Section 274-a au-
thorizes towns to approve site plans “showing the arrangement, layout and
design of the proposed use of the land…[and the] elements may include…
those relating to parking, means of access, screening, signs, landscaping,
architectural features, location and dimensions of buildings, impact of the
proposed use on adjacent land uses, and such other elements as may rea-
sonably be related to the ...general welfare of the community.”
The design review process provides an opportunity for a town and a devel-
oper to work together to ensure that a project meets both the design goals
of the town and the requirements of the developer. Design considerations
relating to security, aesthetics and safety are incorporated in the review
process using design guidelines.
RESIDENTIAL AREAS
Comprehensive Plan
Residential Areas

Town of Van Buren 121
Design guidelines consist of text and illustrations that clarify and define
design objectives of the Town’s development standards. Thus, they pro-
vide criteria by which various aspects of development design is evaluated.
Guidelines help Town decision-makers, area residents and developers
broaden their understanding of the issues involved in achieving quality de-
signs in development projects. They also expedite the review process by
putting both the developer and the Town on the same level playing field by
making clear in advance what the Town expects of the developer.
IMPLEMENTATION STRATEGIES
Cluster Development
New York State Town Law Section 278 authorizes towns in approving
subdivisions to “…modify applicable provisions of the zoning ordinance…
to enable and encourage flexibility of design and development of land in
such a manner as to promote the most appropriate use of land, to facilitate
the adequate and economical provision of streets and utilities, and to pre-
serve the natural and scenic qualities of open lands.” Several limitations
are imposed; the most important being the number of dwelling units ap-
proved may not exceed the number permitted for the tract by the existing
zoning regulations.
A great deal of flexibility in locating dwelling units is indeed possible un-
der this provision. The statute provides the bare framework for allowing
cluster development.
RESIDENTIAL AREASResidential Areas
Planning Reference Guide 122
Standards should be adopted that specify criteria that cluster development
must meet. The review of cluster proposals that might include the follow-
ing conditions:
• The minimum required area of land in a cluster development. • The method used to determine the allowable number of dwelling units.
Minimum lot sizes specified in the zoning ordinance do not translate readily into a dwelling-units-per-acre equivalent, since tract shape and topography often require that some lots exceed the minimum size, and some land may be consumed by street rights-of-way.
• The maximum percentages by which lot area and road frontage re-quirements of the zoning may be reduced, and absolute lot area and road frontage minimums.
• The minimum percentage of dwellings that must be single-family de-tached residences, or the maximum percentage that may consist of at-tached units.
• Lot boundary setback and screening requirements where the subdi-vided tract abuts land that is not part of the subdivision.
• The method used to determine the total area of common land that must be set aside for recreation or conservation, or agriculture.
• Accessibility, ownership and maintenance of the common land. • Structure and buildings accessory to non-commercial recreational or
conservation uses that may be erected on the common land. • Access to the shorelines of water bodies that the development might
abut and the portion of shorelines that must be a part of the common land.
• Requirements for connection to a common water supply and distribu-tion system, if available, or to a central collection and treatment sys-tem following other applicable standards.
• Requirements for addressing orientation of buildings with respect to scenic vistas, natural landscape features, topography, and natural drainage areas in an overall plan of site development.
Comprehensive Plan
Residential Areas
Town of Van Buren 123
Planned Unit Development
The review of PUD’s include the conditions for cluster developments plus
the following:
• A maximum percentage of the total tract area that may be developed for higher density residential uses and for commercial uses.
• The location of uses relative to the periphery of the tract. For example, it is often desirable to require that multifamily development be located more toward the interior rather than the periphery of the tract so that only single-family detached residences border adjacent properties.
• The timing of the occupancy of nonresidential portions of the develop-ment. It is often desirable to prohibit occupancy of nonresidential por-tions until all or some minimum percentage of the residential portions are completed or their completion is assured.
Design Guidelines
Design guidelines are a written and illustrative means of describing the
characteristics that the people of Van Buren would like to see in the future
development of the Town. The purpose of these guidelines is to educate
and effectively communicate the Town’s desire to promote growth and de-
velopment without sacrificing the character and quality of life that make
Van Buren a pleasant place to live.
The design guidelines are developed to assist residents, developers, and the
Planning Board during site plan review. The plans of residents and devel-
opers are facilitated by knowing in advance what the community wants
with respect to design standards. They provide a visual description of what
the Town wants from future development. They illustrate strategies and
alternatives that result in development that are consistent with the commu-
nity’s goals and objectives. Design guidelines facilitate the expeditious
review of development projects, which benefits the developer, the Town,
and the future residents of the project.
A report, Town of Van Buren Design Guidelines, describes in detail de-
sign guidelines for the Town. Included below are examples of design
guidelines for residential developments.
RESIDENTIAL AREASResidential Areas

Planning Reference Guide 124
Design guidelines for the Town of Van Buren
These design guidelines will apply as required to residential, commercial,
industrial, agricultural working and vacant, open-space as well as the river-
front area.
RESIDENTIAL LOT SIZE AND LAYOUT
There are several conflicting factors to consider when deciding on an ap-
propriate size for rural residential lots. These factors include density, char-
acter, natural constraints and the need for septic systems.
Currently the density, the number of people or homes per square mile, par-
ticularly in the western part of Van Buren is low. Unlike the pattern in the
eastern part of the Town including Baldwinsville, homes are spread further
apart on larger lots. This low density is one element that defines the rural
character of the land outside Baldwinsville and the hamlets.
The question raised is should future residential development match the
density and lot size of existing homes. One reason for doing so would be to
match the existing pattern so that new development would blend into its
surroundings. A row of houses along the road on small lots looks right in a
hamlet or the village but may not visually fit into rural surroundings.
The downside to the large-lot approach is that it consumes large quantities
of land and in rural areas often removes it from agricultural use. Large-lot
requirements often cause residential development along road frontages to
land locked or render inner parcels virtually useless. When lot sizes be-
come larger, homeowners are often unable to use or even maintain the en-
tire parcel. Another problem associated with encouraging low density over
a large area is the expense of providing services like road maintenance,
school bus pick-up and emergency services to far-flung residents.
Comprehensive Plan
Residential Areas

Town of Van Buren 125
Land Subdivision
If the alternative method of subdividing land were followed, the first step
would be a site analysis to locate the best building locations and means of
access. The number of appropriate building locations would influence the
number of lots to be subdivided. This process would likely lead to less tra-
ditional lot shapes.
Currently the Town of Van Buren has a two-acre minimum lot size. As
seen in the illustration on the opposite page, there is a variety of possible
lot configurations, even while requiring the two-acre minimum lot size.
Moving away from the conventional road frontage lots raises some issues,
especially regarding access and open space.
Lot Subdivision Examples
RESIDENTIAL AREASResidential Areas

Planning Reference Guide 126
The Traditional Approach to Land Subdivision
Currently most of Van Buren’s land outside of Baldwinsville and the ham-
lets is divided into agricultural parcels of over 10 acres, which could be
easily subdivided into smaller lots. There has been development pressure
in certain areas of the Town for this land to be shifted from agricultural use
to residential use.
The traditional approach to subdivision and development has been to take
the parcel, do a basic site analysis and decide on the number and size of
the lots to be created from it. The lots are laid out primarily based on how
they will be accessed from the driveways and/or new roadways. It is then
that the buildings are sited on the lots.
Comprehensive Plan
Residential Areas

Town of Van Buren 127
Alternative Subdivision and Development Approach
This illustration below is one alternate method for subdivision and develop-
ment that would start with a thorough site analysis or understanding of the
site’s natural systems. Next, the best areas for the buildings would be iden-
tified and mapped. Then the most appropriate means of access could be
determined and the lot lines drawn. The benefit of this approach is that it
allows for more flexibility in responding both to the features of the site as
well as to the patterns found in the surrounding landscape.
RESIDENTIAL AREASRESIDENTIAL AREAS Residential Areas

Planning Reference Guide 128
CLUSTER HOUSING INTRODUCTION
Cluster housing development has become increasingly more popular for
residential areas because of the urgency to solve overcrowding in urban
areas. A cluster-oriented design is a plan that groups the uses found in the
development rather than spreading them evenly throughout the site. To
accomplish this the method calls for the modification of lot size standards
to concentrate the dwellings in specific areas, which in turn creates open
space. By minimizing the amount of land disturbed by development the
value of the land increases, existing vegetation and landforms are pre-
served, rural character is kept and an overall distinction of the site is no-
ticed. The cluster housing style works best in environmentally sensitive
areas, such as steep slopes, wetlands and/or woodlands, because it con-
serves/preserves a certain percentage of desirable land. The plan utilizes
various different preferences and income levels. Attached (i.e. multifamily
units) and detached (i.e. single family units) are often both permitted
throughout the same project, but usually have restrictions on the amount of
each style used. The cluster housing development, compared to a conven-
tional method, is a more cost-effective way to build because of the reduc-
tion in the amount of materials needed. Other advantages of clustering are
described in the following:
ADVANTAGES OF CLUSTER HOUSING DEVELOPMENT
• reduction in development costs
• reduction in housing costs • decrease in environmental impacts • conservation of open space • shared amenities (i.e. recreation) • safety • accessibility and efficiency
CLUSTER vs. CONVENTIONAL DEVELOPMENT
Density is equally distributed throughout a conventional plan whereas in a
cluster plan densities are higher in some areas and lower in others and dif-
Comprehensive Plan
Residential Areas

Town of Van Buren 129
ferent income levels are thereby accommodated. A wide variety of housing
types are found in a cluster development which, unlike the conventional
method, may have a broader appeal in the marketplace. Because of reduced
development standards the cluster subdivision is a much more cost-
effective approach. In a cluster housing design, existing natural amenities
can be preserved without losing lots, and the creation of open space is the
most obvious advantage over the conventional method.
With the increased amount of open space in a cluster housing development,
recreational activities are more possible and natural drainage systems can
be implemented. Such amenities are often lacking in a conventional hous-
ing development.
CHARACTERISTICS OF CLUSTER HOUSING DEVELOPMENT
• a reduction of street and right-of-way standards;• a reduction of minimum lot size to 4,000 square feet;• the use of a more natural storm water management approach;• a greater mix of unit types and income levels;• a minimum of 20% of the site reserved for open space • a high compatibility with residential development.
A TYPICAL CLUSTER HOUSING DEVELOPMENT BASED ON THE “COMMONS” PLAN
8 UNITS ON 2.17 ACRES AVERAGE LOT SIZE 9,114 S.F.
RESIDENTIAL AREASResidential Areas

Planning Reference Guide 130
SITE ANALYSIS
The easiest and most logical areas to build housing on would be the level
or slightly sloping land, but because the most suitable place for construc-
tion might not be the best aesthetically, other factors must be considered:
• Water • Existing vegetation • Views • Severe climatic exposure • Utilities • Adjoining land uses • Unstable soils / danger of slippage • Existing roads / potential access • Existing physical features (depressions, outcrops, hills, etc.)
Although features such as steep slopes, rock outcroppings, natural habitat
areas, places with wildlife potential, and other landscape qualities should
be avoided as they are essential in determining the actual site selection.
NECESSARY ELEMENTS TO CONSIDER
Open Space
Open space is the most obvious benefit to a cluster design. It is all the land
on the site not occupied by the buildings. Open space enhances the devel-
opment as a whole and supports socialization within the community. Other
benefits are that it considers environmental issues of conserving / preserv-
ing the natural amenities in the area and also supporting aesthetic and eco-
logical concerns. An additional advantage is that natural drainage systems
can be designed within open spaces thereby avoiding the cost of extensive
underground infrastructure. Ideally, the open space should be made acces-
sible to as many units as possible by having several, if not all of them, abut
the open land.
Comprehensive Plan
Residential Areas

Town of Van Buren 131
Views
Desirable views should be taken advantage of in development. A cluster
development should be designed so that as many as possible share one
view. Undesirable views, such as parking lots and major roads, should be
screened and buffered with design elements such as vegetation, berms, or
fences so they are not as noticeable when seen from the units.
Privacy
Privacy is maintained among each unit without sacrificing safety. Because
the units are close to each other it creates a social atmosphere, and
neighbors are placed in a situation where it is easy to get to know one an-
other. This helps to promote an almost “neighborhood watch” system. On
the other hand, because they are placed near to one another the situation
also creates a greater need for privacy. This definition of personal space
can be accomplished through the use of vegetation and architectural ele-
ments such as walls and fences.
Identity
The need to maintain individual identity for the housing units can be ful-
filled by applying architectural decoration to both the façade and the inte-
rior of the building. In addition, through outdoor landscape design in front
or around the structure, originality can be achieved.
A TYPICAL CUL-DE-SAC LOT LAYOUT INCLUDING 12 UNITS ON 3.37 ACRES
AVERAGE LOT SIZE 9,675 S.F.
RESIDENTIAL AREASResidential Areas
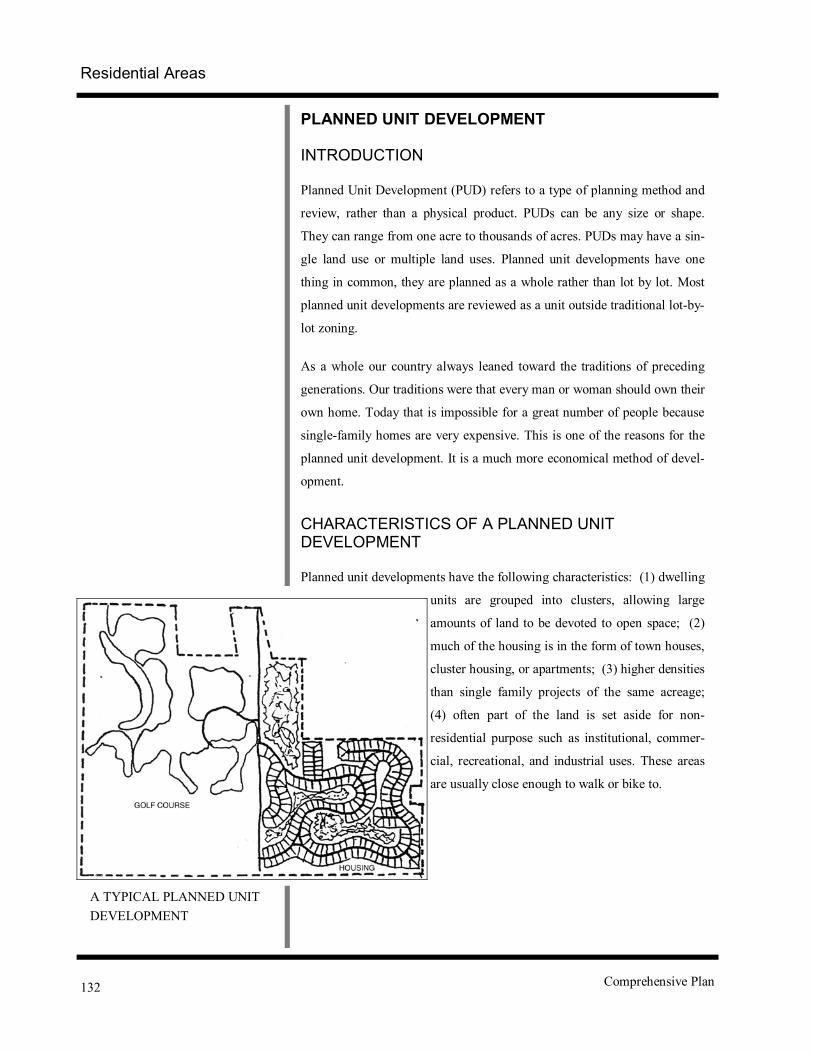
Planning Reference Guide 132
PLANNED UNIT DEVELOPMENT INTRODUCTION
Planned Unit Development (PUD) refers to a type of planning method and
review, rather than a physical product. PUDs can be any size or shape.
They can range from one acre to thousands of acres. PUDs may have a sin-
gle land use or multiple land uses. Planned unit developments have one
thing in common, they are planned as a whole rather than lot by lot. Most
planned unit developments are reviewed as a unit outside traditional lot-by-
lot zoning.
As a whole our country always leaned toward the traditions of preceding
generations. Our traditions were that every man or woman should own their
own home. Today that is impossible for a great number of people because
single-family homes are very expensive. This is one of the reasons for the
planned unit development. It is a much more economical method of devel-
opment.
CHARACTERISTICS OF A PLANNED UNIT DEVELOPMENT
Planned unit developments have the following characteristics: (1) dwelling
units are grouped into clusters, allowing large
amounts of land to be devoted to open space; (2)
much of the housing is in the form of town houses,
cluster housing, or apartments; (3) higher densities
than single family projects of the same acreage;
(4) often part of the land is set aside for non-
residential purpose such as institutional, commer-
cial, recreational, and industrial uses. These areas
are usually close enough to walk or bike to.
Comprehensive Plan
A TYPICAL PLANNED UNIT DEVELOPMENT
Residential Areas

Town of Van Buren 133
RESIDENTIAL STREET WIDTH
Just as maintaining a traditional street pattern is important to preserving
hamlet, village and rural Town character, so too is the design of those
streets. Traditionally, the side streets in hamlets and villages are narrow
and tree lined. This is in contrast with new streets being built in suburban-
style subdivisions on rural land where space allows pavement widths to
reach up to 40-feet.
The section below illustrates that a much narrower street still allows plenty
of room for two-way traffic and in many cases parking on one shoulder. In
more populated areas such as hamlets, to accommodate vehicular and pe-
destrian traffic, the right-of-way should not be more than 60 feet wide.
While electric service runs along most of Van Buren’s existing roads,
where feasible new lines could be buried or run along back lots. Certain
areas of the Town have utilities located in this manner already. Sidewalks
are one of the distinguishing features of the hamlets and village, these
may be built along new residential streets.
RESIDENTIAL AREASResidential Areas

Planning Reference Guide 134 Comprehensive Plan

Town of Van Buren 135
IV. COMMERCIAL AREAS GOAL
Goal.—Appropriately designed commercial development that is located to maximize accessibility to a variety of outlets and services and minimize degradation of the scenic quality and the character of surrounding develop-ment.
BACKGROUND
Retail and service areas can serve as centers of commerce and as social
gathering places important to the cultural life of the community. Commer-
cial areas attract more people per unit of area than any other land use. Visi-
bility and accessibility are important for developers of commercial proper-
ties. Commercial developments can cause many problems.
Population growth drives commercial activities. The commercial element
of the Plan assumes the number of commercial establishments in Van Bu-
ren and Baldwinsville will increase as suburban development expands.
With limited suburban development anticipated, limited new commercial is
expected. However, many commercial opportunities exist for the redevel-
opment of existing commercial uses. Accordingly, this element of the Plan
addresses issues related to how new development is integrated into an
evolving pattern of land use and how older commercial uses and area are
redeveloped.
Van Buren residents are committed to avoiding the negative impacts on
surrounding development that unplanned commercial expansion could
bring. They are concerned about the impacts that the development of scat-
tered individual businesses could have on residential neighborhoods. They
are also concerned with the visual unattractiveness and traffic congestion
that is sometimes associated with commercial strip development.
The Character, Vitality, and Pattern of Commercial De-velopment
The character and economic vitality of commercial areas is a concern of
business owners and community residents. As commercial areas become
Commercial Areas

Planning Reference Guide 136
older, it is necessary to encourage their revitalization. Changes in uses
may be appropriate. Revitalization of older commercial areas should be
supported. One way of supporting older commercial areas, is preventing
spot development of isolated commercial uses and the development of
commercial strips in new areas.
The Plan proposes new commercial development take place in planned
shopping centers or in planned communities. Unplanned expansion of
commercial strips or the creation of new commercial strips will complicate
traffic problems and detract from the character of the Town.
Design and Site Considerations
Addressing design and site consideration in commercial development pro-
jects will create coordinated development, a sense of unity and identity in
an area, and reduce visual blight. It will also make an area attractive for
additional commercial developments. An attractive commercial area will
feed on itself in terms maintaining economic viability and attracting new
stores and services. Conversely, an unattractive commercial area will spi-
ral downhill by discouraging new uses from entering the area.
Design and site considerations include building height and bulk, place-
ment of signs, and parking. The amount of parking is a common practical
concern, but the design of the space and its location on the site plan is also
important in determining the visual impact that results. Landscaping con-
siderations are also important and include the use of screens, buffers, and
berms.
Through private initiative, improvement of design quality is possible even
when new development is not involved. Beautification programs promot-
ing high quality design organized by business groups will enhance existing
commercial areas.
OBJECTIVES AND POLICIES
• Policy.--Concentration of new commercial development in existing commercial areas, in planned communities, or in planned commercial shopping centers.
Commercial Areas
Comprehensive Plan

Town of Van Buren 137
• Policy.—Commercial development that is aesthetically attractive and relates compatibly with the character of surrounding development.
• Policy.--Encourage revitalization of existing commercial strips and shopping centers.
• Policy.—Discourage proposals to locate or expand commercial devel-opment within established residential neighborhoods when such de-velopment will have a negative impact on the character and livability of the surrounding residential community.
• Policy.--Consider proposals to convert residential properties along major roads to office or retail use only when there is a substantial non-residential character to the area, where satisfactory parking and site design can be demonstrated, and where it can be demonstrated that adverse traffic impacts will be minimized.
• Policy.--Encourage commercial developers to locate parking lots at the rear and/or partially on the side of commercial structures.
• Policy.—Require the use of landscaping, screening, and berms where appropriate.Policy -- Review standars for the height and placement of signs.
• Policy.—Encourage local business interests to establish programs promoting beautification and enhancement of commercial buildings and grounds.
GENERAL DEVELOPMENT CONCEPTS
Commercial Strips A commercial strip is a ribbon of commercial uses that are developed in-
dependently on lots along a major road. Commercial strips are common in
suburban areas, where they grow gradually along with the population and
in tune with the pattern of individual land ownership.
It is not difficult to understand how or why land along the highway corri-
dor is so often reserved for commercial expansion. Such land is usually
both undesirable and too expensive for residential use.
Commercial Areas

Planning Reference Guide 138
To the commercial developer the strip offers high traffic volume and good
accessibility as well as good visibility and advertising display space along
a considerable length of road frontage. Space for future expansion is also
usually available. To the consumer the strip offers direct access to any of a
wide variety of commercial outlets.
Local governments are less anxious to acquire it for use as a landscaped
buffer than to generate tax revenues from it, so strips of land along both
side of the highway are designated for commercial use. Very often the
amount of land designated for commercial use far exceeds the commercial
needs of the community, which leads to marginal commercial uses, vacant
properties, and unsightly conditions. A downward spiral of strip develop-
ment occurs.
The major problems with commercial strips as they are traditionally devel-
oped are that they are visually chaotic and result in the creation of serious
traffic hazards. The large number of parking entrances and exits generate
turning movements that disrupt traffic. Traffic congestion worsens as de-
velopment of new business continues until the strip’s advantage of easy
accessibility is destroyed.
In their efforts to gain competitive advantage and make maximum use of
the visibility offered by the strip, businesses often erect oversize signs and
garish displays. But this eventually defeats the commercial goals of the
businessperson. Not only does it result in a streetscape that many consider
ugly, but the overabundance of signs and displays make the recognition by
consumers of any one business difficult.
Shopping Centers
A shopping center is a cluster of commercial establishments built on a site
that is planned as a single, integrated unit. Individual shops or offices are
tenants in the center that is owned and organized by an entrepreneur.
Shopping centers are commonly divided into four types: convenience cen-
ters, neighborhood centers, community centers, and regional centers. Gen-
eral characteristics of these four types are summarized in Table 4.1.
Comprehensive Plan
Commercial Areas
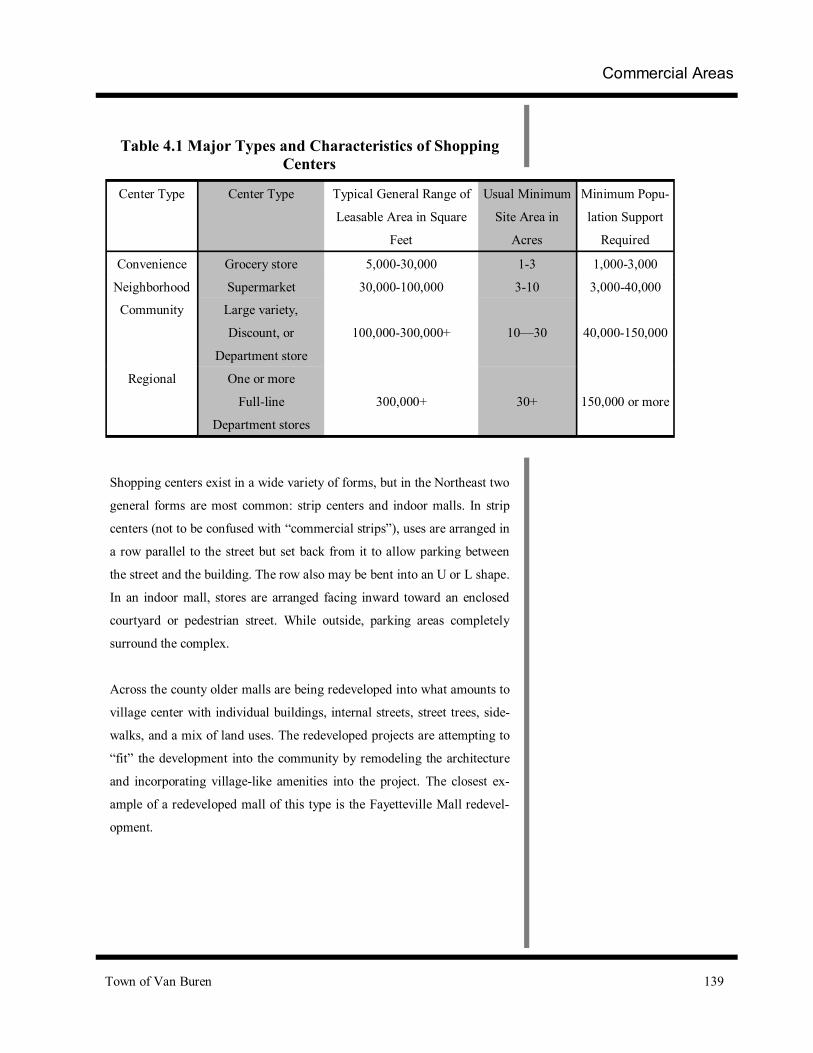
Town of Van Buren 139
Table 4.1 Major Types and Characteristics of Shopping Centers
Shopping centers exist in a wide variety of forms, but in the Northeast two
general forms are most common: strip centers and indoor malls. In strip
centers (not to be confused with “commercial strips”), uses are arranged in
a row parallel to the street but set back from it to allow parking between
the street and the building. The row also may be bent into an U or L shape.
In an indoor mall, stores are arranged facing inward toward an enclosed
courtyard or pedestrian street. While outside, parking areas completely
surround the complex.
Across the county older malls are being redeveloped into what amounts to
village center with individual buildings, internal streets, street trees, side-
walks, and a mix of land uses. The redeveloped projects are attempting to
“fit” the development into the community by remodeling the architecture
and incorporating village-like amenities into the project. The closest ex-
ample of a redeveloped mall of this type is the Fayetteville Mall redevel-
opment.
Center Type Center Type Typical General Range of
Leasable Area in Square
Feet
Usual Minimum
Site Area in
Acres
Minimum Popu-
lation Support
Required
Convenience Grocery store 5,000-30,000 1-3 1,000-3,000
Neighborhood Supermarket 30,000-100,000 3-10 3,000-40,000
Community Large variety,
Discount, or
Department store
100,000-300,000+ 10—30 40,000-150,000
Regional One or more
Full-line
Department stores
300,000+ 30+ 150,000 or more
Commercial Areas

Planning Reference Guide 140
Locational Criteria
Analysis of the market and the accessibility of the location are the princi-
pal reasons developers choose sites for commercial projects. Factors con-
sidered in a market analysis include the distribution of the population, its
spending habits, and the locations of competing businesses. Accessibility is
analyzed by evaluating the various means of traveling to the site, the time
distances involved, the customary routes of travel for other purposes, and
the capacity of the site.
Commercial areas draw on populations from the surrounding area to sup-
port the business area. The larger the commercial area, the larger the popu-
lation base that is needed. This concept is explained in Table 4.1, Major
Types and Characteristics of Shopping Centers. The market forces de-
scribed in the table are important considerations when setting policies for
the location of commercial establishments. Maintaining opportunities for
commercial profit and the attractiveness of Van Buren as a desirable place
to shop is important. Important, too, is maintaining the attractiveness of
Van Buren as a place to live and work.
A business may desire to locate in a less populated area or on the fringe of
a population center if accessibility to the site is particularly good or if the
site lies along the route to a popular destination such as a large shopping
center. However, permitting isolated businesses in low-density residential
areas could result in undesirable neighborhood impacts and a decline in the
attractiveness of a significant amount of land for other low-intensity uses.
Thirty years ago many commercial uses were developed in conjunction
with a residential building boom in the area. The larger of the commercial
uses served a large part of the Syracuse Metropolitan Area. Some of these
uses are still viable. Others are nearing the end of their useful life of about
thirty years. The problems and the opportunity are to reinvent marginal
commercial uses. Public policy should be proactive in encouraging appro-
priate reinventing efforts. In order to maintain an attractive commercial
image, Van Buren must avoid blighted commercial areas.
Comprehensive Plan
Commercial Areas
Town of Van Buren 141
The commercial element of the comprehensive plan supports the idea that
new commercial development should be located within existing commer-
cial areas or concentrated in new planned shopping centers. New centers
should be located where they can serve adjacent residential districts with
minimum negative impact, or where they can be planned as integrated
parts of new residential communities.
IMPLEMENTATION STRATEGIES
The Commercial Strip
Accommodating strip commercial development along roads often gener-
ates problems. These include inhibiting growth on parcels behind the
strips, traffic congestion, and uncoordinated and unsightly development.
Undeveloped commercially zoned parcels exist and existing parcels are
redeveloped from time to time. The major issue for strip commercial de-
velopment is the manner in which development or redevelopment activities
are carried out along existing commercial strips. Existing commercial zon-
ing regulations relating to aspects of site design including building set-
backs should be reviewed to facilitate the application of design guidelines
described below.
Shopping Centers
The site plan approval provision in the zoning ordinance establishes the
legal authority for site plan review and approval in general terms. This
regulation is drafted appropriately for the purposes of the Town Code.
Design guidelines are proposed for use in the review of site plans by the
Planning Board.
DESIGN GUIDELINES The following design guidelines were taken from Town of Van Buren
Design Guidelines.
Commercial Areas

Planning Reference Guide 142
COMMERCIAL DEVELOPMENT
In their heyday, the streets of Memphis, Warners, Ionia, and Van Buren
were lined with a variety of commercial establishments. Currently, com-
mercial use has almost disappeared entirely from the hamlets. In the future,
however, it is more likely that if there were any new commercial develop-
ment in the hamlets that it would most likely be the chain or franchise type
like a new gas station/convenience store.
Some of the design issues associated with commercial development are
similar to those with residential development. In order to maintain a small-
town character within the village and hamlets, any new development –
commercial or residential – should try to fit into surroundings and follow
existing patterns. However, with commercial development there are further
concerns regarding appropriate lighting, signage, parking and the relation-
ship between the building, street and in many areas of Van Buren, the sur-
rounding rural land.
Many commercial structures typically do not fit in with their surroundings,
residential or rural, due to their bright lighting, architecture and in many
cases large signage. However, with alternate lighting, smaller signs and a
greater use of plants, these structures can be more harmonious with their
surroundings.
A) PARKING
Commercial buildings generally require parking. The typical parking solu-
tion is the large paved lot between the building and the street. The view of
these structures from the road is often a sea of parked cars. This view can
be improved by moving the parking to the side or the rear of the building.
Parking lots also benefit from trees planted in parking islands. This helps
to control and guide traffic, provides shade for parked vehicles and visu-
ally screens the parked cars from passersby.
Commercial Areas

Town of Van Buren 143
Small businesses with light vehicle traffic could consider planning for on-
street parking or gravel lots. Locations of events that may park many cars
but only several times a year could consider a grass lot instead of an ex-
pensive paved or gravel lot.
B) ARCHITECTURE
New commercial buildings can better fit into their surroundings if their
architecture is similar to that of neighboring buildings. Just as with new
residential development, the size, orientation, materials, roofline and de-
tails of new buildings is important to maintaining character. Obviously
commercial buildings have different use requirements than the surrounding
residences, but the exteriors can be designed to blend in.
C) LIGHTING
Commercial buildings often require lighting for safe access and security.
However, lighting can be located so as to provide adequate light without
projecting harsh glare on the street or adjacent properties. Avoid large
overhead lights and think about using lower or more directed lights where
needed.
Commercial Areas

Planning Reference Guide 144
D) SIGNAGE
Signs are important elements in creating character in communities. Within
the village or hamlets, inappropriate signs could have an extremely notice-
able impact. A sign also creates a public image for the business it adver-
tises. That can be carefully and deliberately controlled through design.
There are three considerations to deciding what type of sign is inappropri-
ate: (1) who will be seeing the sign – will they be on foot or in a vehicle,
(2) any neighboring signs – will the new sign fit in or dominate and, (3) the
building – what kind of sign would look right given the architecture type of
the building.
GENERAL STANDARDS FOR SIGNS IN VILLAGE AND
HAMLET AREAS
• Sign should be no larger than 20 square feet per side. • Signs should not cover any architectural details or features. • No more than two lettering styles should be used. • No more than 60% of the sign should be filled with lettering. • The colors in the sign should compliment the colors of the build-
ing. • Sign materials should compliment the colors of the building.
Example of Commercial Sign
Commercial Areas

Town of Van Buren 145
COMMERCIAL CLUSTER DEVELOPMENT
Commercial cluster developments are groups of buildings used for com-
mercial uses such as stores and restaurants. The commercial cluster is an
alternative to the conventional plaza or strip mall development.
The buildings and other elements in a cluster development are designed as
a single architectural entity. The various elements are sited to form closed
or semi-closed spaces that best accommodate their function, best reveal the
features of the surrounding structures, and best relate the group as a whole
to the surrounding landscape.
OBJECTIVES AND STRATEGIES
Parking and Landscaping
• Buildings and vegetative screens can be used to enclose and con-ceal a parking area.
• Planters can help divide and separate a parking area as well as enhance and conceal it.
• The use of commonly found or native plant species in the area to integrate the new cluster development into the existing landscape.
• The accommodation of service and emergency vehicles with ade-quacy.
• The creation of a main access road large enough to accommodate the amount of traffic, which will be produced by the new com-mercial cluster development.
Architecture
• It is important that cluster developments harmonize with the sur-rounding landscape.
• New developments should relate to the surroundings by integrat-ing regional architecture into the structures.
• New commercial structures should enhance the traditional archi-tectural character of the area.
• New architecture should harmonize with the surrounding architec-ture through the uses of similar materials, color, symmetry, form and scale.
Commercial Areas
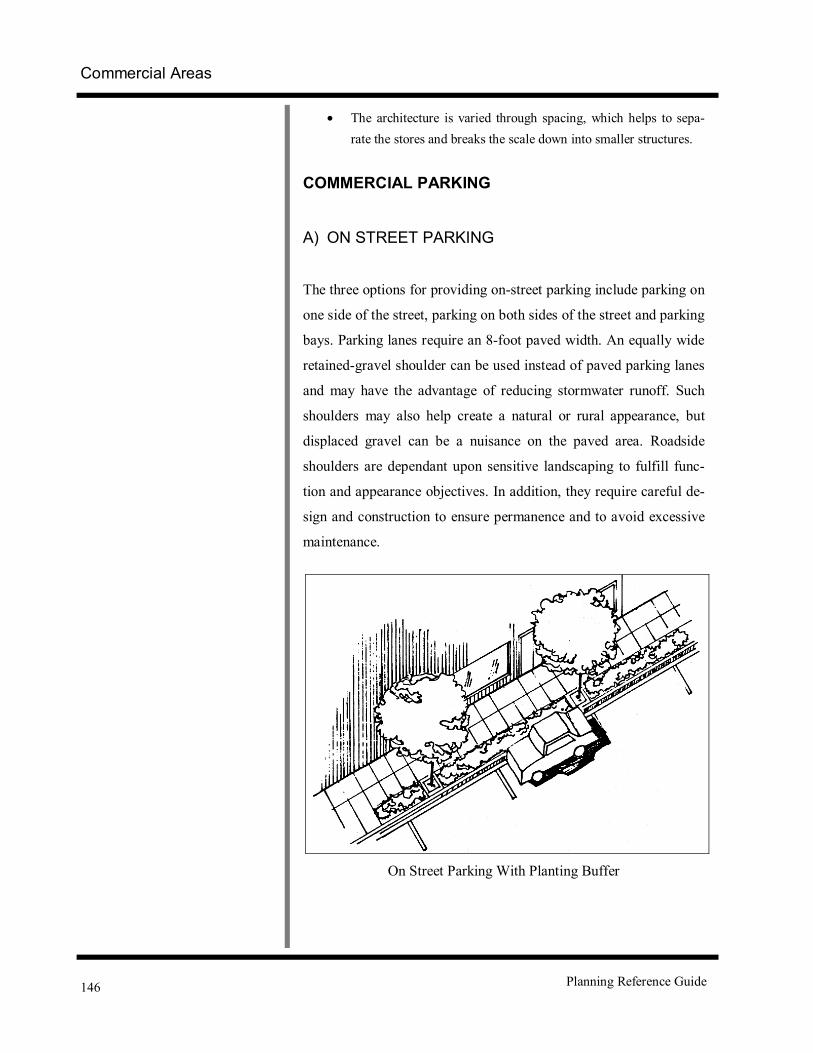
Planning Reference Guide 146
• The architecture is varied through spacing, which helps to sepa-rate the stores and breaks the scale down into smaller structures.
COMMERCIAL PARKING
A) ON STREET PARKING
The three options for providing on-street parking include parking on
one side of the street, parking on both sides of the street and parking
bays. Parking lanes require an 8-foot paved width. An equally wide
retained-gravel shoulder can be used instead of paved parking lanes
and may have the advantage of reducing stormwater runoff. Such
shoulders may also help create a natural or rural appearance, but
displaced gravel can be a nuisance on the paved area. Roadside
shoulders are dependant upon sensitive landscaping to fulfill func-
tion and appearance objectives. In addition, they require careful de-
sign and construction to ensure permanence and to avoid excessive
maintenance.
On Street Parking With Planting Buffer
Commercial Areas

Town of Van Buren 147
B) OFF STREET PARKING Off-street parking minimizes the need for parking lanes on the
street. In addition, a vehicle parked in an off-street location is less
likely to be hit by a moving vehicle. Off street parking also keeps
the streets clear for snow removal. For these reasons sufficient off
street parking should be provided as an alternative to curb parking.
All residential occupant parking should be off-street parking, ac-
commodated by driveways, carports, and garages, or, in higher-
density developments, parking lots. Only visitor parking should
overflow onto the street. In a well-planned community, parking
should not occur on arterial or collector streets. Adequate off-street
parking must be provided for schools, shopping centers, employ-
ment complexes and other similar uses. While parking may occur
on sub-collector and other minor residential streets, the relative
safety on these streets can be enhanced by increased visibility. Chil-
dren darting between parked cars and cars backing out of driveways
between parked cars are factors most affected by reduced sight dis-
tance.
Commercial Areas

Planning Reference Guide 148 Comprehensive Plan

Town of Van Buren 149
Industrial/Employment Centers
V. INDUSTRIAL/EMPLOYMENT CENTER USES
GOAL
Goal.--New industrial development to meet the economic needs of present
and future citizens that is suitably located and compatible with the existing
activities and character of the Town.
BACKGROUND
Industrial development provides employment centers of business activities
that provides marketable products and services needed to maintain desir-
able standards of living. From the Town’s perspective, the value and im-
portance of industrial/employment center uses goes beyond the basic role
of industry to process materials and manufacture goods. Properly located,
adequately serviced, and carefully designed industrial/employment center
uses can assist the community by attracting new employment opportuni-
ties, and expanding the fiscal capacity of local government by adding new
investment to the property tax base.
Expansions of industrial/employment center uses do have risks. Air and
water pollution, hazardous waste generation, commuter and truck traffic,
special demands on public services, storage of large quantities of materials,
around-the-clock operations, the size and design of buildings, and overall
impacts on the image of Van Buren.
This element of the Comprehensive Plan assumes growth in industrial/
employment center uses in Van Buren is necessary and desirable to bal-
ance growth in residential uses. How industrial/employment center uses
can meet objectives and policies of the Plan and be integrated into the
evolving pattern of land use is the purpose of this element of the Plan.
Planning Reference Guide 150
OBJECTIVES AND POLICIES
• Objective.—Attract appropriate research, office, warehousing, and manufacturing activities that are located in open and park-like settings and accessible to the transportation network and public utilities.
• Objective.—Evolve a proactive effort for industrial development that focuses Town activities in an Industrial Committee and that is de-signed to expand the economic base of Van Buren and improve em-ployment opportunities.
• Policy.—Provide sufficient vacant prime industrial land zoned for in-dustry to meet anticipated demand.
• Policy.—Evaluate the extent of existing vacant industrial sites, and review industrial location standards relating to accessibility, utilities, site size, and natural environmental factors when considering the des-ignation of additional industrial sites.
• Policy.—Expand provisions for site plan review of industrial use pro-posals by the Planning Board and adopt design review guidelines clarifying the design objectives of the Town as they pertain to indus-trial development projects.
• Policy.—Protect industrial developments from incompatible land uses by allowing only appropriate research, office, manufacturing and other associated activities in industrial areas.
• Policy.—Update industrial performance standards in the zoning ordi-nance relating to impacts from odor, noise, dust and smoke, gases, ra-diation levels, glare, waste, water contamination, electrical interfer-ence and other measurable effects of industrial operations.
• Policy.—Encourage cooperation between the various public and pri-vate agencies to promote industrial development within the Town in-cluding the Greater Baldwinsville Economic Development Agency and the Baldwinsville Chamber of Commerce.
Comprehensive Plan
Industrial/Employment Centers

Town of Van Buren 151
GENERAL DEVELOPMENT CONCEPTS
Early Industrial Development
In pre-1920’s America, industrialists largely determined the pattern of in-
dustrial development. The availability of natural resources, competition,
and the demand for products were the factors influencing their locational
decisions. Industrial uses were commonly established on the most desir-
able sites in a region. Sites near rivers that could supply water and provide
for waste disposal were prime sites. Later, industrial development spread
along railroad lines that often ran parallel to rivers.
The results of unplanned industrial expansion during this era are visible in
many older communities where high levels of site coverage, crowded
streets, and lack of parking and truck loading areas characterize industrial
areas. Often the factories, warehouses, and storage yards in these areas are
found either intermixed, or in dangerous proximity to commercial, service,
and residential uses.
Industrial Use Districts
With the emergence of land use planning, the practice of zoning attempted
to prevent the mixing of uses. Frequently, however, the areas designated as
industrial zoning districts consisted of land that was “leftover” after allo-
cating to other uses the areas in the community that had potential for resi-
dential or commercial development. To make matters worse, industries
locating in the industrial districts were not protected from the encroach-
ment of other uses.
Within the last forty years many communities including Van Buren, have
protected industrial/employment center areas by not allowing residences in
these areas. Some communities also prohibit commercial uses from some
industrial/employment center areas.
Industrial/Employment CentersIndustrial/Employment Centers

Planning Reference Guide 152
Industrial/Employment Center Parks
An industrial/employment center park is a tract of land subdivided and pro-
moted for industrial/employment center use by a sponsoring managerial
organization. In many cases, the sponsoring organization either develops
the entire tract itself, or it offers development assistance such as financial
aid or engineering and construction services to prospective tenants. The
Town of Dewitt has several parks including Pioneer Business Park, Butter-
nut Creek Business Park, and Widewater Office Park. The park develop-
ment idea contrasts with the uncoordinated development of industrial par-
cels along an existing road.
Industrial/employment center parks grew out of the desire of corporations
of moderate size, by clustering together, in order to take advantage of eco-
nomics that accrue when services and facilities are shared. Corporations
are also motivated to locate within industrial/employment center parks by
the desire to obtain suitable sites and avoid complaints and to take advan-
tage of the protection and prestige an organized district can provide. Local
and state governments in the name of economic growth often assist devel-
opment of industrial/employment center parks. The New York State
“Empire Zone” program is an example.
Uses found in industrial/employment center parks vary from low technol-
ogy to high technology companies. The low end includes manufacturing,
warehousing, and distribution uses. The high technology end includes re-
search and development activities ranging from product development and
testing to assembly and distribution. The parks also use a variety of names:
research parks, research and development parks, and office parks.
Concentration of industrial/employment center uses in industrial/
employment center parks makes planning-related problems traditionally
associated with these uses easier to address. The managerial organization
controlling and administering a park has a self-interest in maintaining com-
patibility of uses and activities within the park and ensuring that necessary
infrastructure is made available to tenants.
Comprehensive Plan
Industrial/Employment CentersIndustrial/Employment Centers
Town of Van Buren 153
LOCATIONAL CRITERIA
Entrepreneurs seeking development sites first evaluate regional or state
characteristics and then evaluate the attributes of particular sites. In making
a choice between two nearly identical sites, quality of life characteristics
also influence an entrepreneur’s decision.
Regional characteristics are largely beyond the community’s power to in-
fluence. They include:
• weather, • taxes, insurance and interest rates, • permit and approval processes, • cost of energy, • the cost of labor, • the quality and skill levels of the labor force, • accessibility to markets, • proximity to supplies and resources including energy, and • location with respect to other existing and proposed facilities of
the company, and proximity to residential living areas of the kind preferred by engineers and managers.
Site characteristics include:
• highway access, • cost of utilities in sufficient and reliable quantities (gas, sewerage,
water, internet), • site topography, compatibility of adjacent uses, prestige of the
location, • location with respect to rural, suburban, and urban areas (most
industries prefer rural or suburban locations within a metropolitan area),
• availability of land parcels or buildings, • proximity to airports, and • availability of railroad, truck, or other required ground transporta-
tion services.
Industrial/Employment CentersIndustrial/Employment Centers
Planning Reference Guide 154
Infrastructure needs are generally more important to industrial/employment
centers than local tax rates or financial assistance programs offered by lo-
cal governments and economic development agencies. Good access for
truck and cars is the single most important locational consideration. Direct
highway frontage is usually desired for its advertising value. Railroad ac-
cess is much less important than it once was, but proximity to a rail line
provides a district with flexibility in attracting tenants.
High-tech industries are somewhat less concerned with infrastructure char-
acteristics than manufacturing industries, but they still require a location
accessible to skilled workers and roads suitable for shipping work in proc-
ess between plants. Availability of high-quality air service including air-
freight is also particularly important to high-tech industries.
Quality of life considerations include regional factors such as climate and
natural features (mountains, lakes, etc.), that are beyond the community’s
control. Other quality of life factors are local in scope. They include the
quality of local schools, health care facilities, and local social and recrea-
tional amenities as well as the current and long-range availability of hous-
ing in a variety of price ranges, styles, and neighborhoods to meet the
needs of both labor and management.
The quality of life for industrial/employment center entrepreneurs is also
affected by local attitudes toward employment center development. Ade-
quate regulations to protect the industrial/employment center are impor-
tant. The reasonableness of regulatory restrictions, the development review
processes, and the willingness of local officials to help solve problems are
all-important.
IMPLEMENTATION STRATEGIES
In Van Buren, the sanitary district boundary (Map 5.1) and the water ser-
vice area (Map 5.2) serve to outline areas that might contain sites suitable
for industrial/employment center uses. Map 5.3 , Suitability of Land for
Employment Center Uses combines the maps 5.1 and 5.2, and also identi-
fies areas with possible environmental limitations for industrial/
employment center uses.
Comprehensive Plan
Industrial/Employment CentersIndustrial/Employment Centers

Town of Van Buren 155
Industrial/Employment Centers
�����������������������������������������������������������������������������������������������������������������������������������������������������������������������������������������������������������������������������������������������������������������������������������������������������������������������������������������������������������������������������������������������������������������������������������������������������������������������������������������������������������������������������������������������������������������������������������������������������������������������������������������������������������������������������������������������������������������������������������������������������������������������������������������������������������������������������������������������������������������������������������������������������������������������������������������������������������������������������������������������������������������������������������������������������������������������������������������������������������
N
1 inch = 1 m ile
0 1 Mi.
Sanitary DistrictTown of Van Buren
SUN Y C ollege of Env ironm entalScie nce and F ores trySyracuse, New Yor k
So urce : Inform at io n pro vid ed b y th eTown o f Va n Bure n, Feb rua ry 20 01
�����S anitary D istric t
F eb ruary, 2001
��������������������������������������������������������������������������������������������������������������������������������������������������������������������������������������������������������������������������������������������������������������������������������������������������������������������������������������������������������������������������������������������������������������������������������������������������������������������������������������������������������������������������������������������������������������������������������������������������������������������������������������������������������������������������������������������������������������������������������������������������������������������������������������������������������������������������������������������������������������������������������������������������������������������������������������������������������������������������������������������������������������������������������������������������������������������������������������������������������������������������������������������������������������������������������������������������������������������������������������������������������������������������������������������������������������������������������������������������������������������������������������������������������������������������������������������������������������������������������������������������������������������������������������������������������������������������������������������������������������������������������������������������������������������������������������������������������������������N
1 inch = 1 mile
0 1 Mi.
Water Service Area (approximate)Town of Van Buren
SU NY College of Env ironm entalSc ience and Fores tr ySyracuse, N ew Yor k
F ebruary, 2 00 1
W ater Service Area�����Sour ce: Co nsu ltan t's g eo gra ph ican alysis o f existing wa te r d ist rictbo un da rie s, ro ad s, top og rap hy,an d oth er ph ysical fea tu res
����������� ����� �� ��� �� ������� ����� � � ������
��������� �� ���
������
�� ���� � �� ����� ��� ����� ��� �������� �� �� ���� �� ��� ����� �� ��� �� ��� �� �� � ��� ���� ��� � ��� ������� ��� �� ���� ��� � ������ ��� � ��� � � �� �� � ��� ����� ����� �� ��� �� � ��� ���� ���� � ���
��������
������
���� ������ ��� � ����������� ��� � �� ������ � �������� ������� ��� �� ���� ��� ������ � ���� � ��� ���� �������� �� ������ �� ��� ��� ��� ����� � �� ���� � ����������������� ��� �� ��� ��� �� ���� �� ���� ������ � � �� ���� ����� ����� � ���� ������ ����� ��� �� ��� ���� ��� � ���� � ��� ���
���
�� ��� �
���� �� � ��� � � ���� �� ���� ���� �
�� ���� � ���� ���� ���� ������ ���� � ��� ��� ��� �� � �� � ����� ��� �� ���� � ������� � ��� ��� ���� ��� ��� ��� ��� � �� �� ��������� ��� ���� � �� ��� ��� � ����� �� � ����� ��� � �� �������� �� �� ���� ��������� ��� �� � ���� �� ��� �� ����
������
��
���
���
�� ��� ������ �������� ��� � �����
�� � �� ����� ���������� ��� ��� ��� � �� � ����� ��� ������� ��� ��� �� � ��� �� ��� �� ��� � � ����� � � ����� ��� �� �� �������� ��� � ��� �� �� �� � ���� �� � � ��� � �� ������� � �� ��� � � � �� ����� ��� � �� ��� �� �� � � ��� �� ���� � �� ��� � � �� �� �� � �� � ��� ��� �� ��� � �� ���
�� ��
����
������ � ������ � � � ��� � � � ��� � ��� ���� � � �� ���� ����� � �� � � �� � ��� �� � �� � �� �� � ����� ��� � �� �� �� � � �� �� � �� � � ������� �� � �� �� �� ����������������������������� � �� ����� � ��� � �� � ��� � � �� � � � �� � ��� � ������ ���� ��� ����� � ��������� ��� � ��� ���� �� �� ��� �� � ����� � ��� � ���� �� ���� �� �� � �� ������ � ���� � �� ����� ���� ���� � ��� ���� � ��� � � ������ � �������������������������
�������
������������ �� �� � �
���
��� ��� � � �� � ����� ��� �� ��� ��� �� ���
��� ����� � ���� � ��
�������� �
����������� � �� �� � ��� ���� ��� � ������ ��� ��
���������������������� �� ��� �� �� � ����� ����� ����� ���� ���� ��� �� � ��� �� ���� � � ���� �� �� � ��� � ��������� ��� �� �� ��� � ���� �� ������� ���� � �� � ������ ��� ��� ���� � ��� � ��� � �������������������������������������� ��� �� � ��� ���� �� ����� ���� � ��� � ��� �������� ������ ������������ � �� ������� � ����� �� ���� � �� � ��
�����
��
����� � � ���������������� ���� ���
����� ����� � �������������������������������� �������� � �� �� ����� ��� � � ���� � � ����� �� � � �� � � ��
������ �� ���� �� � ����� � � �� ��� � ��� �� � ��� �� ��� ��� �� ����� ���� � ��� ����� � �� �� �� ��������� ���� �� � ���� ��� � ��� � ����� � ��� ����� ��� � ���� ����� ��� �� �� � �� ����� ��� � �� ����� �� ���� �� ������� ���� �� �� �� � ���� ��
������
�� � ��� �� �� �
����������� ������ �� ��������� ������ ��� � ����� �� ����� � ��� � ��� ��� �� �� ���� �� ����
�� ������� ��� ����� ��� ��� ��� ��� � ������� �� ���������������������������� �� ��� ��� ��� �� ���� � � ��� ��� ���� ��� �� �� ����� �� ��� �� ��������
��
�� ������ ��� �� ������������ ���������
����������
������������
���
����������
��������
��
�
������������������������������������������������
����������
��������
�����������������������
�������������������������
���������
�� ������
�������������������� �����
�����
���
��������
������
����
��������������������
��������
�������������������������������������������
������
������
������������
��������������������
����������
�����
�������������
����������
����
���
���� �� ������������������������������������������������������������������������
���
���������������������������������������������������������
������
�� ��
��
��� ��������������������������������������������������������������������������������������������������������������������������������������������
��������������
����������������
������
���
���������������������������������������������������������������������� ��� ����������������������������� ������� ������������������������������������� �������������������������������������������������������������������������������������������������������������������������������
����
��������
���� ���
������������ ����������
������������������������
��������
�������
��������������
������� ����� ���������
������������������� ����������
��� ���
����������������
�������������
�����
� ������� ���
�� ���������������������� ����� ������
�
��� �� �������� �� �������� �� �������
��� ���� �� ������ � ����� ����� ��� ��� ���� ����������������� ���
������
���������� ����� �� ��������� ��� �� ���� ���� �� ������� �� �� ��� ���� �� �� ������ ��
���������
��������� ��
���� ������������� � �� �
�� ��� �� ����� �� ���� ��� ��� ��� �� � ��� �� �� ��� � �� ������� �� ���� � ��
����� � ����������
������ ��� �� ��� �������� ���� � ����� � �� ��� ��� ����������������� ��
� ���� � � ����� ����� ��� ��� �� ��� � ����� �� �� � ��� ��� ��� ���� ��� ����� �� �� � �� �� ��� � ��� �� � �� ���� �������� �
�������� � ��
���� ��
���� �� �� ������ ����� �� ���������� �� ���� �� �������������������������������������������������������������������� �� ����������������� ����
�������
��
������ ����
�� ���� ����� ���
������������������ �������������������������� ��� � ��� �� �� ��� � ������ ��� ���� ���� ������� �����������������������
���� � ���� �� ���������� ������ � ��
��������
����
F ebruary, 2001
Approximate boundary of areacontained within both the SanitaryDistrict and the water service area
����������
SU NY College of Env ironmentalSc ience and F ores trySyracuse, New York
Town of Van BurenSuitability of Land for Employment Center Uses
N
1 inch = 1 mile
0 1 Mi.
Areas with possible environmentallimita tions to employment center uses
Map 5.1
Map 5.2
Map 5.3
Industrial/Employment Centers

Planning Reference Guide 156
Basic Strategies
To attract industrial/employment center development, a community needs
to know “what they want and where they want it.” Zoning needs to match
up with the desired land uses, and the regulations need to be suitable for
modern situations. Streamline approval processes for efficiency and re-
duced approval time. Identify and promote lots with minimal limitations to
the approval and development process. A lot of sites are not important.
You just need a few excellent sites.
Information about the community needs to be available to site selection
and real estate brokers. The Planning Reference Guide provides a wealth
of information in one place. The Guide and the Comprehensive Plan
show’s the community is thinking about industrial/employment center de-
velopment and has an idea about what it wants.
Market the town. Be proactive, not merely reactive. Take into account re-
gional plans and activities. Utilize local and regional resources that pro-
mote a community’s assets, including the Metropolitan Development
Board, Chamber of Commerce, and the Empire Economic Development
Corporation.
[Note: The Basic Strategies outlined above are from a presentation made to the Van Buren Land Use Committee by David Mankiewicz, Deputy Director, Metropolitan De-velopment Association.]
Performance Standards
The concept behind industrial performance standards is that industrial en-
terprises are free to locate and operate within an industrial zone in the
Town so long as the enterprise avoids the creation of enumerated nui-
sances. The nuisances are related to sound, odor, dust, smoke, gases, vibra-
tions, glare, and fire, explosion or safety hazards. The Van Buren Zoning
Ordinance includes provisions related to these nuisances. A review and
updating of the provisions is part of the review of the zoning ordinance.
Comprehensive Plan
Industrial/Employment CentersIndustrial/Employment Centers
Town of Van Buren 157
Industrial/Employment Center Park Zoning
Present industrial/employment center zoning in Van Buren includes a gen-
eral office district and three industrial districts. The four districts are con-
ventional zoning districts in that they assume an area will be zoned and
individual lots subdivided and sold to individual businesses. Generally ba-
sic industrial/employment center uses are permitted after the Planning
Board approves a site plan. Additional uses are permitted after a special
permit is obtained from the Zoning Board of Appeals. Site plan approval
for additional uses permitted by special permit is at the discretion of the
Zoning Board of Appeals.
An industrial/employment zoning district is designed to ac-
commodate uses in new planned developments. The district would be de-
signed to accommodate planned office or employment center uses as a sin-
gle entity and may accommodate a variety of industrial, office, and sup-
porting commercial uses intended to primarily service persons working at
or patronizing the planned development. The district is proposed as a
“floating zone” that is requested by a developer and approved by the Town
Board after a recommendation from the Planning Board. The “floating
zone” sets forth locational criteria and performance guidelines not unlike
the planned unit development district in the Van Buren Zoning Ordinance.
DESIGN GUIDELINES The following design guidelines were taken from Town of Van Buren
Design Guidelines.
INDUSTRIAL LOT LAYOUT In the layout of industrial structures, the integration of these devel-
opments into the surrounding landscape is just as critical as the inte-
gration of residential projects to their surroundings.
Individual lots should be laid out to take advantage of the sites natu-
ral amenities including distinctive landforms and scenic views. Lots
should also be arranged to minimize the potential for conflict be-
tween dissimilar uses.
Industrial/Employment CentersIndustrial/Employment Centers
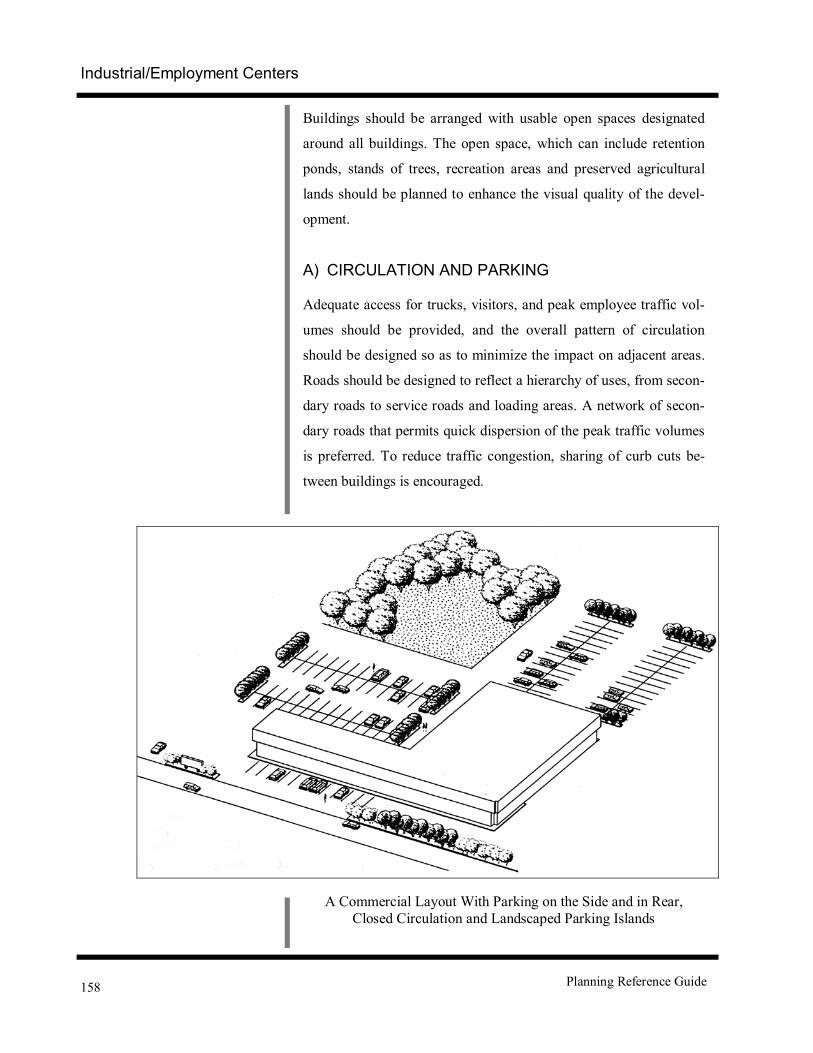
Planning Reference Guide 158
Buildings should be arranged with usable open spaces designated
around all buildings. The open space, which can include retention
ponds, stands of trees, recreation areas and preserved agricultural
lands should be planned to enhance the visual quality of the devel-
opment.
A) CIRCULATION AND PARKING
Adequate access for trucks, visitors, and peak employee traffic vol-
umes should be provided, and the overall pattern of circulation
should be designed so as to minimize the impact on adjacent areas.
Roads should be designed to reflect a hierarchy of uses, from secon-
dary roads to service roads and loading areas. A network of secon-
dary roads that permits quick dispersion of the peak traffic volumes
is preferred. To reduce traffic congestion, sharing of curb cuts be-
tween buildings is encouraged.
A Commercial Layout With Parking on the Side and in Rear, Closed Circulation and Landscaped Parking Islands
Industrial/Employment Centers

Town of Van Buren 159
Truck circulation should be physically separated from the general
circulation of passenger cars as much as possible. Loading areas
should be located behind buildings so turning areas and loading /
unloading activities will not interfere with employee and visitor
traffic.
B) SCREENING AND GENERAL LANDSCAPING
Loading areas, outdoor refuse containers, transformers and other mechani-
cal and technological equipment should be screened so as not to be visible
from adjacent lots or sites, neighboring properties or streets. Residential
areas adjacent to industrial developments should be substantially screened
from views of parking lots, interior roads or railroad tracks, and lights.
Plantings and berms are usually most appropriate for use as screens. Walls
or fences are generally discouraged, especially between buildings and
fronting streets. Where walls or fences are necessary , they should be de-
signed as integral parts of the overall architecture and site design.
A minimum of 15% of the area within the property lines of a devel-
opment site should be devoted to landscaping. A 10-foot minimum
planting strip should be provided continuously along and adjacent to
all interior property lines. Interior streets should be planted with
rows of trees that will provide a distinctive appearance.
Wooded areas should be preserved as much as possible in order to
maintain a sense of natural amenity. Mass plantings of trees and
other vegetation in areas between setbacks and property lines should
be suggestive of the natural “woodland” landscape. Parking lots
should be planted with a low overhead canopy of non-evergreen
shade trees.
Industrial/Employment Centers

Planning Reference Guide 160 Comprehensive Plan

Town of Van Buren 161
VI. TRANSPORTATION
GOAL
Goal.—The planning of a safe, efficient and reliable transportation system
to meet the needs of the present and future population and consisting of
facilities that are compatible with adjacent land uses.
BACKGROUND
The safety, economy, efficiency of a transportation system to move people
and goods influences the desirability of a community as a place to live,
work, and play. The roadways in Van Buren serve as the primary means
for access and circulation in and through the Town. The roadways also
provide space for water, electric, gas and telecommunication utilities and
for storm drainage facilities. Roads also provide a visual setting for homes
and other buildings. The design of roadways helps create an image of the
community and defines the character of neighborhoods.
At times the widening of roads and improvement of intersections to meet
increased demand, has resulted in the intrusion of automobiles into almost
every area. The effects of traffic can become so severe that any potential
increase in traffic is seen as a threat to peaceful, safe, and pleasant living.
The transportation element of the Comprehensive Plan is based on the
premise that the planning of roads in Van Buren can serve many purposes,
which are responsive to the social, environmental, and aesthetic concerns
of residents. Through guidance of the most favorable relationships be-
tween the land uses in the community and the trafficways that are intended
to serve them, traffic impacts of new development are mitigated while the
transportation system in Van Buren continues to serve as one of the
Town’s most important assets.
Transportation
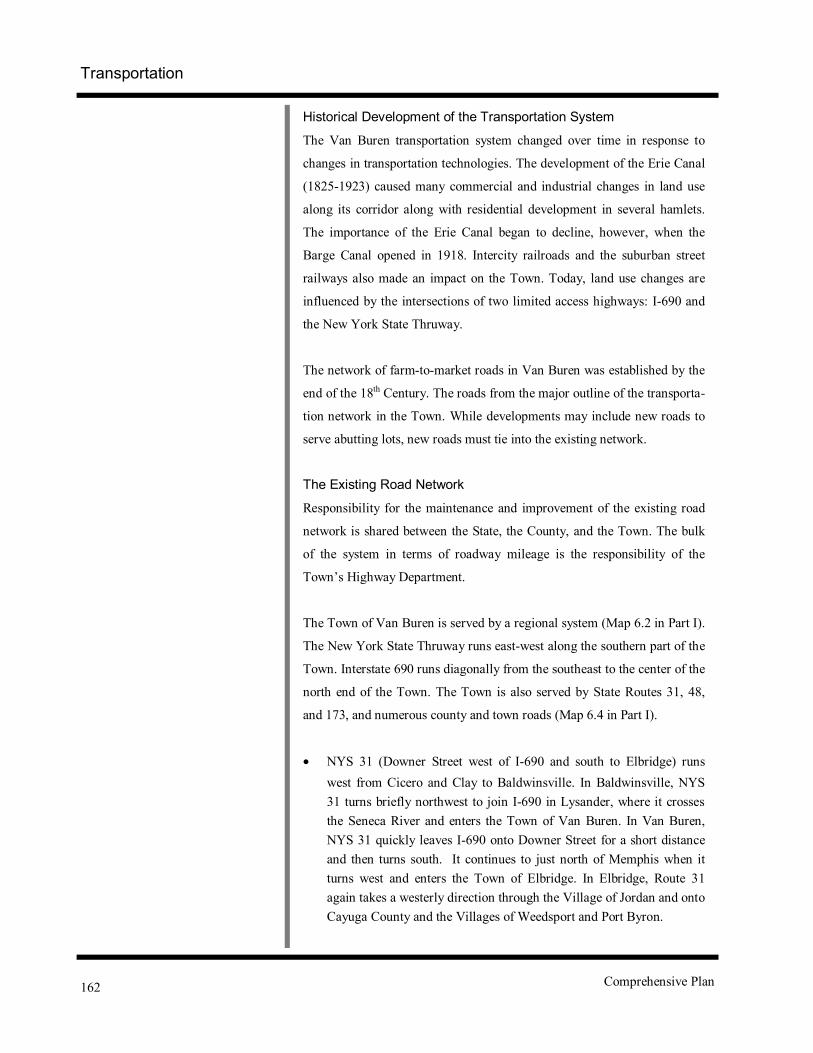
Planning Reference Guide 162
Historical Development of the Transportation System
The Van Buren transportation system changed over time in response to
changes in transportation technologies. The development of the Erie Canal
(1825-1923) caused many commercial and industrial changes in land use
along its corridor along with residential development in several hamlets.
The importance of the Erie Canal began to decline, however, when the
Barge Canal opened in 1918. Intercity railroads and the suburban street
railways also made an impact on the Town. Today, land use changes are
influenced by the intersections of two limited access highways: I-690 and
the New York State Thruway.
The network of farm-to-market roads in Van Buren was established by the
end of the 18th Century. The roads from the major outline of the transporta-
tion network in the Town. While developments may include new roads to
serve abutting lots, new roads must tie into the existing network.
The Existing Road Network
Responsibility for the maintenance and improvement of the existing road
network is shared between the State, the County, and the Town. The bulk
of the system in terms of roadway mileage is the responsibility of the
Town’s Highway Department.
The Town of Van Buren is served by a regional system (Map 6.2 in Part I).
The New York State Thruway runs east-west along the southern part of the
Town. Interstate 690 runs diagonally from the southeast to the center of the
north end of the Town. The Town is also served by State Routes 31, 48,
and 173, and numerous county and town roads (Map 6.4 in Part I).
• NYS 31 (Downer Street west of I-690 and south to Elbridge) runs west from Cicero and Clay to Baldwinsville. In Baldwinsville, NYS 31 turns briefly northwest to join I-690 in Lysander, where it crosses the Seneca River and enters the Town of Van Buren. In Van Buren, NYS 31 quickly leaves I-690 onto Downer Street for a short distance and then turns south. It continues to just north of Memphis when it turns west and enters the Town of Elbridge. In Elbridge, Route 31 again takes a westerly direction through the Village of Jordan and onto Cayuga County and the Villages of Weedsport and Port Byron.
Comprehensive Plan
Transportation

Town of Van Buren 163
• NYS 48 runs between Oswego and Baldwinsville, as Syracuse St. in the Village of Baldwinsville and continues onto Maple Rd. and
then State Fair Blvd. in the Town of Van Buren, ending at Route 690.
• NYS 173 (Warners Road) runs northwest from Onondaga Hill south-west of Syracuse, through Camillus and Van Buren to NYS 31 in Van Buren.
Trends in Highway Travel
In Onondaga County, traffic is increasing faster than population. Low den-
sity suburban and rural sprawl, increase in suburban jobs, and decline in
public transportation are contributing factors. Roads become crowded and
infrastructure costs increase. At the same time, public funding for transpor-
tation projects is declining at the federal and state levels. The era of major
limited access road building is over. The transportation needs for the future
depends on the present framework of roads. Management of the street sys-
tem including the intensities and patterns of land uses are critical to the
long-term safe and efficient movement of people and goods.
Transportation and Land Use
The relationship between transportation and land use is significant. In the
short run, land use shapes the demand for transportation. As the accessibil-
ity of an area improves, changes in land values lead to further changes in
land use intensity. Transportation planning and land-use planning should
go hand-in-hand. It is not enough to attempt simply to meet demand. Plan-
ning efforts should be aimed at influencing the pattern of land use so that
the impact of development on the transportation system is accommodated
efficiently and safely.
Hierarchy of Movement
The quality of service that a circulation system provides depends on how
well each element in the system performs in relation to its primary purpose
and in relation to operational characteristics and design. Conflicts, conges-
tion, loss of efficiency, and safety hazards result when transitions between
various kinds of public streets or private drives are functionally inappropri-
ate.
TransportationTransportation

Planning Reference Guide 164
Movement through a network of roadways serving both regional and local
needs is involved in almost all travel. Thus, the different stages involved in
making a trip are reflected in a functionally designed circulation system
that integrates different types of streets and highways performing a variety
of traffic mobility and property access functions.
Specific streets and highways are planned and designed to perform a par-
ticular function within a hierarchy of roadways. The system serves to es-
tablish a network integrating commercial and industrial development, com-
munity facilities, and residential areas. Also reflected in the system are ex-
isting traffic volumes, access needs of adjacent land development, street
patterns, and proposed land uses.
Trips flow through elements designed specifically for each stage of a trip.
Likewise, each element of a functional hierarchy serves as a collecting or a
distributing facility for the next higher (or lower) element of the system.
Thus, ideally, residential streets should connect only with other residential
streets or with collector streets. The preservation of neighborhoods also
should be a basic objective of the classification system.
OBJECTIVES AND POLICIES
Objective.—Provision and maintenance of transportation facilities provid-
ing both intra-county service and service to all areas of the Town at desired
levels of efficiency.
Objective.—Compatibility of transportation facilities with the character of
adjacent land uses.
Policy.—Improve intersections, including adding turn lanes, channeliza-
tion, and revise signalization where needed.
Policy.—Encourage State and County participation in funding transporta-
tion projects intended to alleviate traffic congestion.
Comprehensive Plan
TransportationTransportation

Town of Van Buren 165
Policy.—Encourage the State and County to participate in funding trans-
portation projects intended to reduce hazards in areas where accidents oc-
cur most frequently.
Policy.—Develop and apply street design criteria to insure vehicular and
pedestrian safety.
Policy.—Minimize the number of intersections and curb cuts and encour-
age development of service roads to reduce the number of individual ac-
cess points necessary in new development. Seek State and County support
and cooperation in these efforts.
Policy.—Prevent interference with sight distances along transportation
routes.
Policy.—Consider the potential for truck traffic through residential areas
when evaluating industrial and commercial development proposals.
Policy.—Develop beautification and buffering performance standards for
all parking facilities.
Policy.—Require that any freight loading and unloading at new or rehabili-
tated industrial and commercial developments occur off public streets.
Policy.—Require buffer zones and noise mitigation, where appropriate, to
minimize negative impacts of transportation facilities on adjacent areas.
Policy.—Require traffic impact analysis for major development proposals.
Policy.—Encourage developers to participate in financing new capital and
facility needs that development generates.
TransportationTransportation

Planning Reference Guide 166
IMPLEMENTATION STRATEGIES
Functional Classification of Roads Transportation engineers classify existing and proposed roads according to the volume of traffic they are expected to carry, the number of access points that exist, and their role in the overall transportation system. The system of classification allows the assignment of appropriate roles to spe-cific roads and increases the ability to control traffic flows within and around communities. The classes of streets and the average daily traffic (ADT) flows corresponding to them are as follows:
• Limited Access roads accommodate a large volume of traffic between communities at high rates of speed (ADT 20,000+). In order to ensure smooth traffic flow, no direct access is per-mitted to abutting properties.
• Arterial streets move a large volume of traffic through and around a town and to neighboring communities (ADTs are typically 5,000 to 20,000). Access is a secondary function. The degree to which access is controlled depends on the im-portance of the street to regional traffic flow.
• Collector streets move a smaller volume of traffic between the various connecting residential, commercial, and rural roads to each other, to community facilities, and to arterial or primary highways (ADT 1,500 to 5,000 with peak-hour traf-fic over ten percent of ADT). Service to abutting land uses is a secondary function.
• Local streets provide direct access to adjacent properties (ADT 100 to 1,500 with peak-hour traffic about ten percent of ADT). They also provide intra-neighborhood traffic. Local roads should not carry through traffic. Moving traffic is a sec-ondary function. Local streets include cul-de-sacs, marginal access streets, and reverse frontage streets.
The relationships between these various classes of streets are illustrated in
Figure 6.1. The average daily traffic (ADT) generated by a single-family
detached dwelling ranges from eight to ten trips per day. Town houses and
apartments usually generate fewer trips.
Comprehensive Plan
TransportationTransportation

Town of Van Buren 167
Roads in Van Buren are classified according to the above system in order
that planning guidelines and design standards corresponding to the differ-
ent classes of roadways are effectively applied. The streets and roads in
Van Buren are classified as follows:
Limited Access New York State Thruway I-690
Arterial Route 31 (Downer Street) Route 48 Van Buren Road
Collector Brickyard Road O’Brien Road Jones Road Warners Road Old Route 31 Canton Street
Local All other roads including: West Dead Creek Road East Sorrell Hill Road West Sorrell Hill Road Kingdom Road Perry Road
PLANNING GUIDELINES
A community’s transportation system is designed to promote safety for
vehicular and pedestrian traffic, efficiency of service for all users, and eco-
nomical land use, construction and maintenance. The system also is de-
signed to promote the maintenance or enhancement of features or elements
that make the locale an agreeable, pleasing and satisfying place in which to
live, work, or recreate. Adoption of the following guidelines and standards
will help to establish a circulation system design process in which those
considerations and principles are taken into account.
Transportation
Figure 6.1
Transportation

Planning Reference Guide 168
Service to Abutting Properties
Roadway widths, sidewalk placement, and the overall pattern of local
streets and intersections should serve to provide adequate vehicular and
pedestrian access to all parcels.
Location of New Streets Relative to Existing Collectors or Arterials
Local residential streets should be located only where an adequate amount
of space is available to buffer the lots that will front on them from collec-
tors or arterials. Provision also should be made to link new collectors with
other connectors serving adjacent developments.
Through Traffic and Excessive Vehicular Travel
The placement of residential streets should allow for quick access to col-
lectors. Travel to and from residences should not involve driving over a
series of minor residential streets. Subdivision road layouts and access
points to major traffic streets should consider the expected directional dis-
tribution of peak-hour volumes.
Comprehensibility of the Street Pattern
The pattern of local streets should be logical and understandable in order to
serve the needs of visitors as well as local residents. Avoid laying out
streets that wander directionally or turn back on themselves, except in
small cluster developments.
Maintaining Efficiency of Major Streets
Control access to local circulation systems, intersection placement, and
driveway placement so that when property is subdivided, as few parcels as
possible require direct access to any collector or arterial street. When nec-
essary, require developers whose projects abut existing collectors or arte-
rials to grant the additional rights-of-way needed for such streets to meet
minimum standards.
Scale and Character of Residential Streets
The perceived scale of a local street should be in keeping with its residen-
tial character and the intensity of use it is intended to receive. Overhanging
trees, roadside business, and adequate sight distances at crossroads and
Comprehensive Plan
TransportationTransportation

Town of Van Buren 169
driveways can help to reduce the scale and speed of residential streets.
Traffic Generators within Residential Neighborhoods
Uses that have the potential to generate high volumes of traffic in residen-
tial areas (schools, shopping facilities, churches, etc.) should be planned to
serve as focal points for circulation within and between neighborhoods.
Through traffic should be avoided.
Topography, Drainage, and Soils
Create more attractive and economical streets by carefully relating their
layout to topography, and by planning alignments to avoid excessive storm
runoff and the need for storm sewers.
Road may be oriented perpendicular to a slope as long as the route created
is not too steep and conditions allow for water collected in the road’s
drainage swales to be returned to natural drainage patterns. Road may be
oriented parallel or nearly parallel to contours as long as conditions allow
for water intercepted from the hill above to be returned to the natural drain-
age pattern downhill. Slopes immediately adjacent to the road should not
be so extreme that overly steep driveways would need to be constructed in
order for lots abutting the road to gain access to it.
Street should be located only in areas where the stability and load-carrying
capability of the roadway will not be compromised by the nature of the
sub-grade soils. Soils subject to slippage should especially be avoided.
Natural Resources
Streets should be located to minimize the effects on natural resources.
Alignments should be chosen that stay clear of streams, rivers, wetlands,
and important wooded areas.
Street Widths
Requirements for pavement widths, otherwise known as “carway” widths,
should be based on the volume and type of expected traffic, on-street park-
ing needs, probable vehicle speeds, and limitations posed by sight dis-
tances, climate, terrain, and maintenance requirements. Construction and
TransportationTransportation

Planning Reference Guide 170
maintenance costs are saved by selecting the minimum suitable width.
Many communities specify wider than necessary widths for residential
streets in the belief that wider streets are safer and more efficient. Over de-
signed streets create hazards by encouraging higher-speed driving. They
also have a negative effect on the image and character of residential areas.
DESIGN REVIEW AND IMPACT ANALYSIS
Traffic impact analysis is a specialized study that estimates the volume of
traffic a development is expected to generate and provides quantitative
evaluation of the impact of traffic on the surrounding transportation system
and development. It also identifies off-site improvements that are needed
as a result of the development.
The Transportation Planners Council of the Institute of Transportation En-
gineers has stated that a complete traffic impact analysis should be con-
ducted whenever a proposed development will generate 100 or more addi-
tional trips in the peak hour of the adjacent roadway or the generating de-
velopment. The Council has also indicated that due to the following rea-
sons, localized safety or capacity deficiencies may necessitate a study even
if the 100 trips threshold is not met:
• Current traffic problems exist in the local area (high accident rates, confusing intersection, lack of signalization, etc.).
• Levels of service of the roadway system adjacent to the de-velopment may be significantly affected.
• Areas or neighborhoods potentially impacted are especially sensitive.
• Proposed site drives are particularly close to other drives or intersections.
• The ability of the adjacent existing or planned roadway sys-tem to handle increased traffic is in doubt, or the feasibility of improving the roadway system to handle increased traffic is in doubt.
Comprehensive Plan
TransportationTransportation

Town of Van Buren 171
• Other specific problems or deficiencies exist that may be affected by
the proposed development or affect the ability of the development to
be satisfactorily accommodated.
DESIGN GUIDELINES The following design guidelines were taken from Town of Van Buren
Design Guidelines.
CIRCULATION
A) PEDESTRIAN CIRCULATION
The complete separation of vehicular and pedestrian circulation sys-
tems is usually desirable. In order to achieve reasonable pedestrian
access for each residence, three different types of sidewalks or paths
can be utilized.
1. Walkways within the residential properties to provide ac-
cess to parking and refuse disposal areas.
2. Local paths or sidewalks connecting dwelling units and
serving intermediate common services such as mailbox
clusters.
3. Walkways connecting residences with commercial and
community facilities, schools and recreation areas.
Sidewalks along some residential streets are necessary and desir-
able. The basic test should be expected use and sidewalk relation-
ship as an element of a functional pedestrian system. Sidewalks
within a street right-of-way normally should be four feet wide.
Common area paths or walks should be wide enough to provide two
pedestrian lanes or one pedestrian and one bicycle lane.
Sidewalk street crossings should be located where there is good
TransportationTransportation

Planning Reference Guide 172
sight distance along the road, curb cuts should be provided for
wheelchair users as required by ADA standards. Pedestrian crossing
signals should be integrated with vehicular traffic signals to take ad-
vantage of stopped vehicular traffic on major streets.
B) BICYCLE CIRCULATION
Paths shared by bicycles and pedestrians are appropriate for low-
speed or low-volume use, particularly if the path loops through a
subdivision but is not used by through traffic. For a shared path, an
8 foot paved area is desirable. Pavement striping can assist in sepa-
rating bicyclists and pedestrians.
TRAFFIC CALMING TECHNIQUES
Traffic Calming is the utilization of a variety of physical features
within the design of streets to slow vehicular traffic. Originally de-
veloped as a traffic control technique in Europe, traffic calming has
become widely accepted in the United States over the past 5 to 10
years (including use by NYSDOT). Traffic calming works by creat-
ing a vehicular environment that is physically and/or perceptually
comfortable at reduced speeds, generally less than 30 miles per
hour, or even slower through intersections. Benefits of traffic calm-
ing include:
• Encouragement of slower, safer motor vehicle speeds. • Reduction of collision frequency and severity. • An improvement in actual and perceived safety for pedestri-
ans and bicyclists. • A reduction in the need for police enforcement of speed
limits.
At present there are no specific recommendations for immediate im-
TransportationTransportation

Town of Van Buren 173
plementation of traffic calming elements in Van Buren. However,
as future plans for development in the more populated areas of the
Town are proposed, traffic calming techniques may need to be con-
sidered for certain areas. In particular, these may include minor
streets and locations of major pedestrian crossings such as school
cross walks.
TransportationTransportation

Planning Reference Guide 174
TransportationTransportation

Town of Van Buren 175
The Comprehensive Plan Diagram
VII. THE COMPREHENSIVE
PLAN DIAGRAM The Comprehensive Plan Diagram for the Town of Van Buren provides
geographic reference and a broad spatial context to the goals of the Com-
prehensive Plan and its most significant physical design proposals. The
Plan Diagram shows the relationships between the different elements of
the Plan and emphasizes the unity of the Town-wide physical design pro-
posals.
For a complete description about the Comprehensive Plan Diagram refer
to page 102.

Planning Reference Guide 176 Comprehensive Plan

Town of Van Buren 177
Insert Comprehensive Plan Diagram (Front)
The Comprehensive Plan DiagramThe Comprehensive Plan Diagram

Planning Reference Guide 178
Back of Comprehensive Plan Diagram
The Comprehensive Plan Diagram

Town of Van Buren 179
Notes


