1 CITIES SUPPORT PROGRAM TOWNSHIP ECONOMIC DEVELOPMENT PROJECT THEMBISA CITY OF EKURHULENI SITUATIONAL ANALYSIS REPORT DRAFT VERSION 2.5. APRIL 2021 Prepared by the Sustainable Livelihoods Foundation TED Project Team
Transcript
1
CITIES SUPPORT PROGRAM TOWNSHIP ECONOMIC DEVELOPMENT PROJECT
THEMBISA CITY OF EKURHULENI
SITUATIONAL ANALYSIS REPORT DRAFT VERSION 2.5.
APRIL 2021
Prepared by the Sustainable Livelihoods Foundation TED Project Team
2
Cities Support Programme
Township Economy Development Project
Situation Analysis Report
Project Site: Thembisa, City of Ekurhuleni
Prepared by the Sustainable Livelihoods Foundation TED Project
team
Version 2.5.
April 2021
3
I. Executive Summary
The Cities Support Programme (CSP) of National Treasury (NT) has entered into an agreement with
Ekurhuleni Metropolitan Municipality (City of Ekurhuleni - CoE) to provide technical support for a
township economy development (TED) strategy. This three-year project will strengthen the capacity of
the City of Ekurhuleni to strategize, plan, fund, implement and monitor TED projects within the township
of Thembisa.
The CSP appointed the Sustainable Livelihoods Foundation NPC (SLF) with a professional technical
assistance team (TAT) comprising a team leader; small-business development, social scientist, spatial
planning, public transport, housing, infrastructure development, environmental advisors and
community liaison persons. The TAT partner will collaborate with CoE to align the strategy to existing
and emerging development frameworks, strategies and projects and advance implementation of a
township economy development strategy through specific projects derived from the unique socio-
economic challenges and opportunities within the site.
In formulating projects and implementation plans, the TAT will facilitate processes of participatory
engagement and transversal planning to advance projects with spatial impact, whilst synergising
resources and ensuring alignment with sector plans. These strategies will provide the CoE with a
replicable area-based development approach. The project will leverage institutional impacts through
knowledge sharing, strengthening City strategies and policies, and through facilitating transversal
planning processes. It will benefit the City through the building of new partnerships and arrangements
for the implementation of economic development projects, the sourcing of funding, and gaining access
to specialist knowledge and expertise. This Situation Analysis identifies aspects and components of the
Thembisa township economy that could benefit from project interventions within an overarching
strategic alignment.
Theory of Change (ToC)
Building on prior CSP work, the ToC recognises townships as requiring a spatially and systems-oriented
development approach, influenced by 1) provision (and quality) of public goods and services, 2) the
regulatory environment, 3) the organisation of society, and 4) the character and orientation of economic
and business activities. Furthermore, there is a requirement for a context specific understanding of the
4
physical, social and psychological needs of township communities; to understand the range of shocks
that exacerbate economic vulnerability; and actions to strengthen accountability and governance.
Partners
The CSP has entered partnerships with the European Union supported Ecosystem Development for
Small Enterprise (EDSE) programme, the World Bank Group (South Africa) (WBG), and the Aspen
Network of Development Entrepreneurs (ANDE) to amplify the TED project. The EDSE partnership will
support the TED project to facilitate alignment with the Department of Small Business Development
(DSBD), Small Enterprise Development Agency (SEDA) and the Small Enterprise Finance Agency (SEFA).
In addition, the CSP TED project will work synergistically with the Neighbourhood Development
Partnership Programme (NDPP) of National Treasury.
Methods
The TAT undertook a series of seven simultaneous steps in preparing the situation analysis:
1. Establishing a transversal team of sector specialists.
2. Desk-top identification of all relevant municipal planning documents, and feasibility studies for
economic projects. In all, 117 official publications, academic publications and unpublished
reports were accessed.
3. Participatory engagement – because of COVID-19, the engage was primarily undertaken
through on-line engagements via the Thembisa Virtual Imbizo page on Facebook.
4. Spatial information - obtained data from open sources and the CoE including land use (zoning
schemes), cadastral boundaries, social and community infrastructure, water and sewerage
systems, electricity networks, telecommunications, natural features and roads and transport
infrastructure. In addition, the TAT undertook a spatial analysis of identified high streets,
business nodes and development precincts.
5. Ecosystem survey – a team of field researchers used a survey instrument to collect data within
the field, focussing on economic high streets, business precincts, retail hub and identified nodes
/ precincts. Field research was undertaken in October 2020. In Thembisa, the researchers
completed 586 interviews, which included surveys of 447 township micro-enterprise businesses.
6. Site field research and engagement to qualitatively understand the socio-economic
characteristics of business and urban dynamics.
7. Sector specific investigations into essential aspects of the township economy.
5
To mitigate the challenge of the relative scarcity of area-based data, the TAT team accessed unusual
data sources, including private sector datasets and qualitative data.
Institutional ecosystem
The TAT assessed government strategies at national, provincial and metro levels to support businesses
within the township economy. National government programmes such as those driven by the DSBD
and its associated agencies of SEDA and SEFA include:
• New incentives (with the Medium-Term Expenditure Framework (MTEF) period),
• The Small Business and Innovation Fund (R3,2b),
• Black Business Supplier Development Programme (R906m),
• National Informal Business Upliftment Scheme (R248m),
• Enterprise Incubation Programme (R186m),
• Craft Sector Programme (R36m),
• SheTrades,
• Township Entrepreneurship Fund,
• Township and Rural Entrepreneurship Fund (TREP)
Gauteng Province Programmes
The Gauteng Provincial Government (GPG) has prioritised the Township Revitalisation Strategy (TRS) to
create strategic accessibility and connectivity to markets to transform township economies. Growing
Gauteng Together (GGT) 2030 aims for ‘building sustainable development for all’, creating jobs and
opportunities, with a focus on the Gauteng City Region (GCR) and ten high-growth sectors. Furthermore,
the GGT has a strong emphasis on water and energy security and a focus on promoting renewable
energy. Within the GGT the Township Revitalisation Action Plan seeks to change how townships are
regulated and governed; allow township firms to be formally recognised; revise state procurement rules
and programmatic support; de-risk lending to township firms of all sizes by financial service providers;
turn taxi ranks into micro-CBDs and support the taxi economy to use its scale to grow supporting value
chains and industries, and convert areas with high commercial densities into township high streets.
These interventions underpin the proposed Township Economic Development Bill which aims to direct
government procurement spend, enhance access to finance, assists registering SMES, enable high street
development and redress municipal by-law barriers to enterprise formalisation. Lastly, the Gauteng City
Region (GCR) Economic Development Plan (2015- 2020) intends to drive economic growth through
strategic targeting of priority sectors. Based on the current economic structure of Gauteng Province, the
6
GCR EDP is biased towards the service sectors, especially community services, finance and transport
although purports that the manufacturing sector should be at the centre of economic growth and
development. The EDP recognises a need to invest skills in various sub-sectors of the economy and
address the high barriers of entry in many of these industries – in particular those with high growth
potential such as agro-processing and steel. Within the context of these overarching provincial
strategies, the CoE has developed its own series of guiding policies and programmes.
Ekurhuleni Programmes
The Ekurhuleni Growth and Development Strategy 2025 forms the basis of medium and short-term
planning and guides the policy budget as the City seeks to implement its mandate, to make CoE ‘a
better place in which to live, work and play’ and recognises Thembisa as one of the four major
concentrations of historically disadvantaged communities. The Ekurhuleni Integrated Development Plan
(IDP) is mainly focused on the overall development challenges facing CoE, with township revitalisation
is one of nine Flagship Projects for the City. The Economic Development Department which lead,
facilitates and promote economic transformation, inclusive growth and socio-economic development
in the City.
Enterprise activity - The Micro-Enterprise Ecosystem
Ecosystem surveys were conducted in Thembisa in October 2020 to record a ‘snapshot’ of: i) business
activities, ii) institutional facilities and iii) business hotspots and spatial opportunities. The research team
surveyed 517 businesses (micro-enterprises, SMEs and corporates), recorded 27 business hotspots and
30 institutional services. Of these businesses, 4% (23) were Corporates, 9% (47) were SMEs, and 86%
(447) micro-enterprises. All corporates and 94% (44) of SMEs were formal whilst 86% (385) of micro-
enterprises were reported as informal businesses. Of these 447 micro-enterprises, 83% (369) of
businesses were open and full interviews were recorded. The research identified clusters of trading sites,
the prominence of street traders and a wide diversity of economic activities, including SME. The most
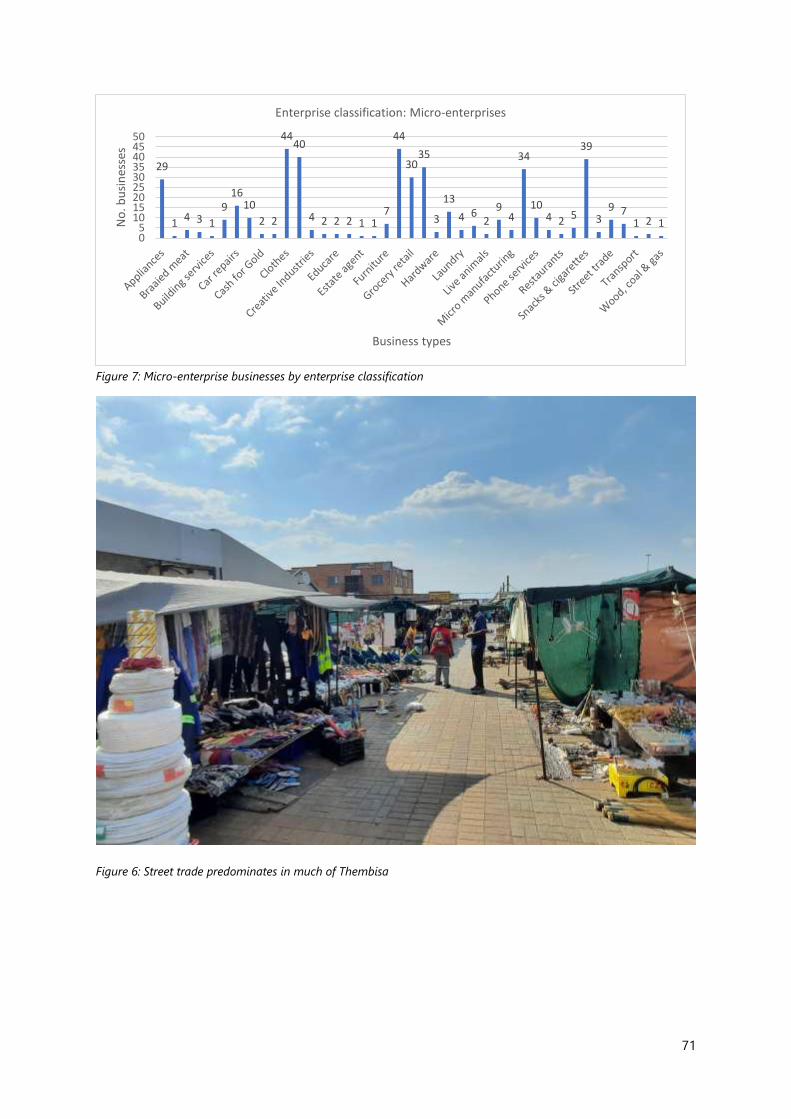
numerous informal business activity surveyed was that of (second-hand) clothes retailing (44 / 10%) –
mostly conducted as a street trading activity. Food businesses were commonplace, including retailing
of fruit and vegetables (44 / 10%), cooked food (40 / 9%) and snacks & cigarettes (39 / 9%). The service-
related business of hair salons (35 / 8%) were commonplace. Appliance repair businesses operated from
a variety of outlets - from street trading to private homes to dedicated shopfront premises (including
shipping containers) – focusing on television, kitchen appliance and cell phone repairs.
7
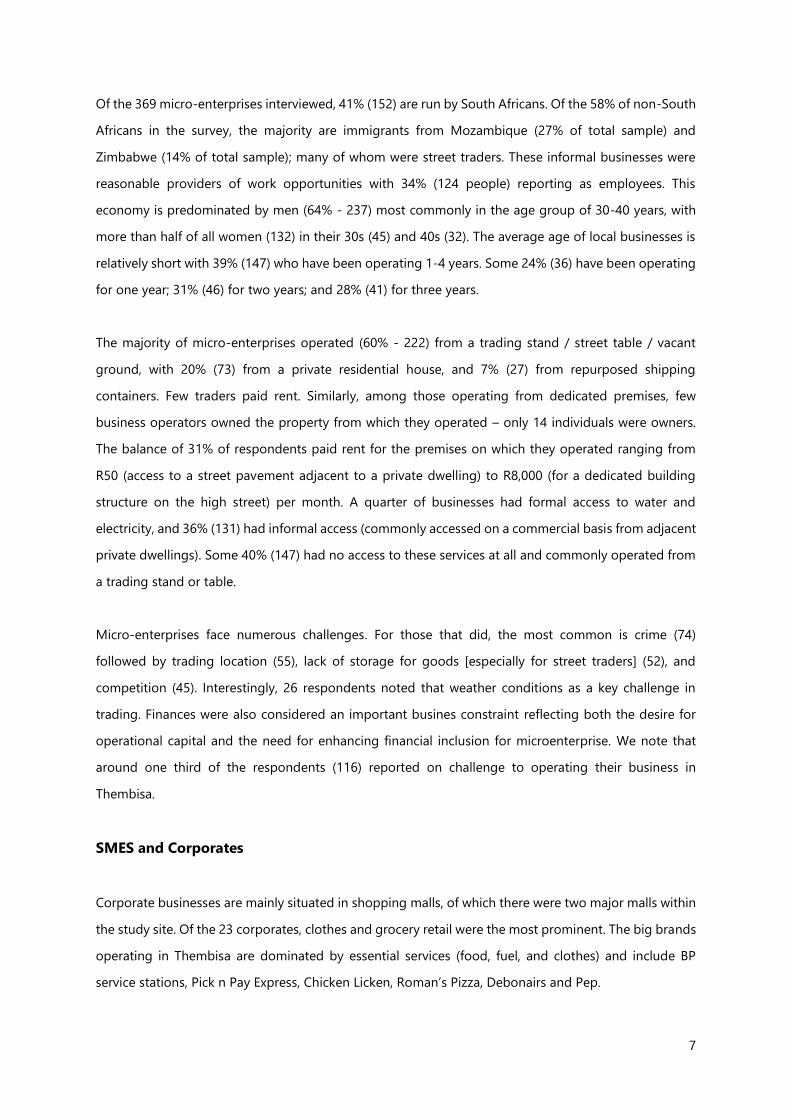
Of the 369 micro-enterprises interviewed, 41% (152) are run by South Africans. Of the 58% of non-South
Africans in the survey, the majority are immigrants from Mozambique (27% of total sample) and
Zimbabwe (14% of total sample); many of whom were street traders. These informal businesses were
reasonable providers of work opportunities with 34% (124 people) reporting as employees. This
economy is predominated by men (64% - 237) most commonly in the age group of 30-40 years, with
more than half of all women (132) in their 30s (45) and 40s (32). The average age of local businesses is
relatively short with 39% (147) who have been operating 1-4 years. Some 24% (36) have been operating
for one year; 31% (46) for two years; and 28% (41) for three years.
The majority of micro-enterprises operated (60% - 222) from a trading stand / street table / vacant
ground, with 20% (73) from a private residential house, and 7% (27) from repurposed shipping
containers. Few traders paid rent. Similarly, among those operating from dedicated premises, few
business operators owned the property from which they operated – only 14 individuals were owners.
The balance of 31% of respondents paid rent for the premises on which they operated ranging from
R50 (access to a street pavement adjacent to a private dwelling) to R8,000 (for a dedicated building
structure on the high street) per month. A quarter of businesses had formal access to water and
electricity, and 36% (131) had informal access (commonly accessed on a commercial basis from adjacent
private dwellings). Some 40% (147) had no access to these services at all and commonly operated from
a trading stand or table.
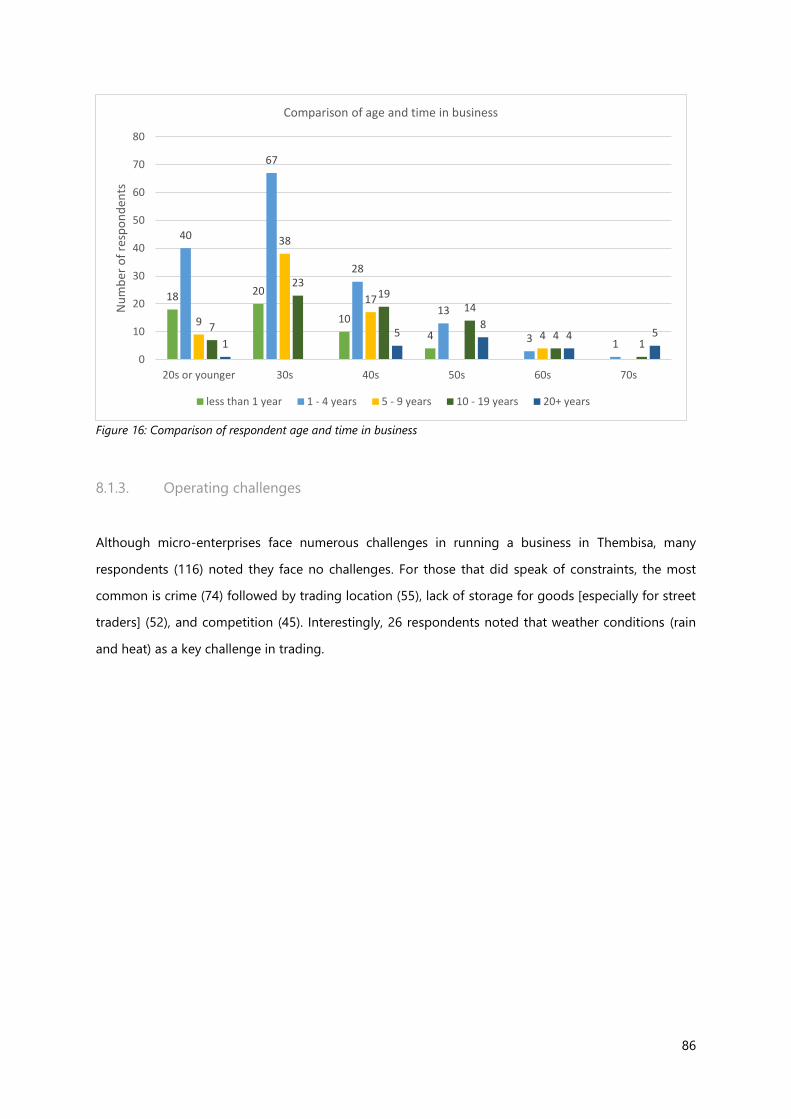
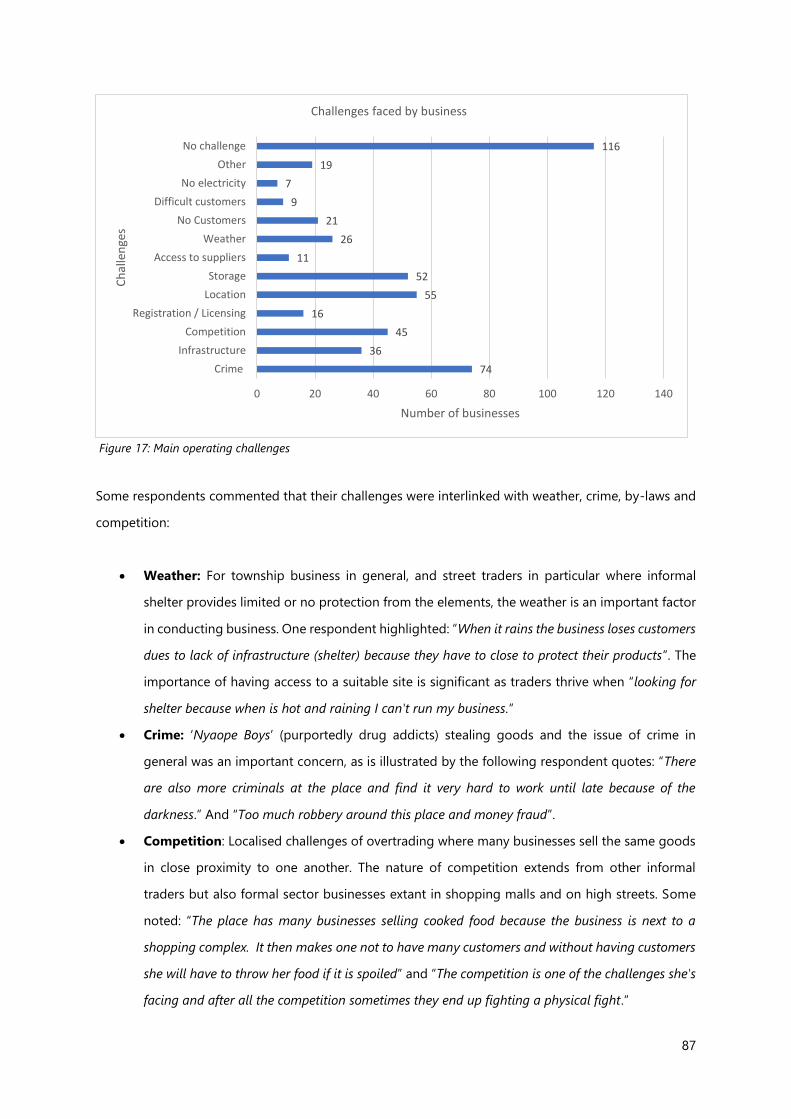
Micro-enterprises face numerous challenges. For those that did, the most common is crime (74)
followed by trading location (55), lack of storage for goods [especially for street traders] (52), and
competition (45). Interestingly, 26 respondents noted that weather conditions as a key challenge in
trading. Finances were also considered an important busines constraint reflecting both the desire for
operational capital and the need for enhancing financial inclusion for microenterprise. We note that
around one third of the respondents (116) reported on challenge to operating their business in
Thembisa.
SMES and Corporates
Corporate businesses are mainly situated in shopping malls, of which there were two major malls within
the study site. Of the 23 corporates, clothes and grocery retail were the most prominent. The big brands
operating in Thembisa are dominated by essential services (food, fuel, and clothes) and include BP
service stations, Pick n Pay Express, Chicken Licken, Roman’s Pizza, Debonairs and Pep.
8
A considerable variety of SMEs operate in Thembisa. In our survey, 23% (11) of them were health
services, followed by 14% (9) liquor sales. A variety of other SMEs were found spread throughout the
site, including funeral services, bakeries, car repairs, legal services – all of which require specialised skills
and / or equipment to operate. These businesses provide a qualitatively different level of BDS to street
based micro-enterprises.
Business Hotspots
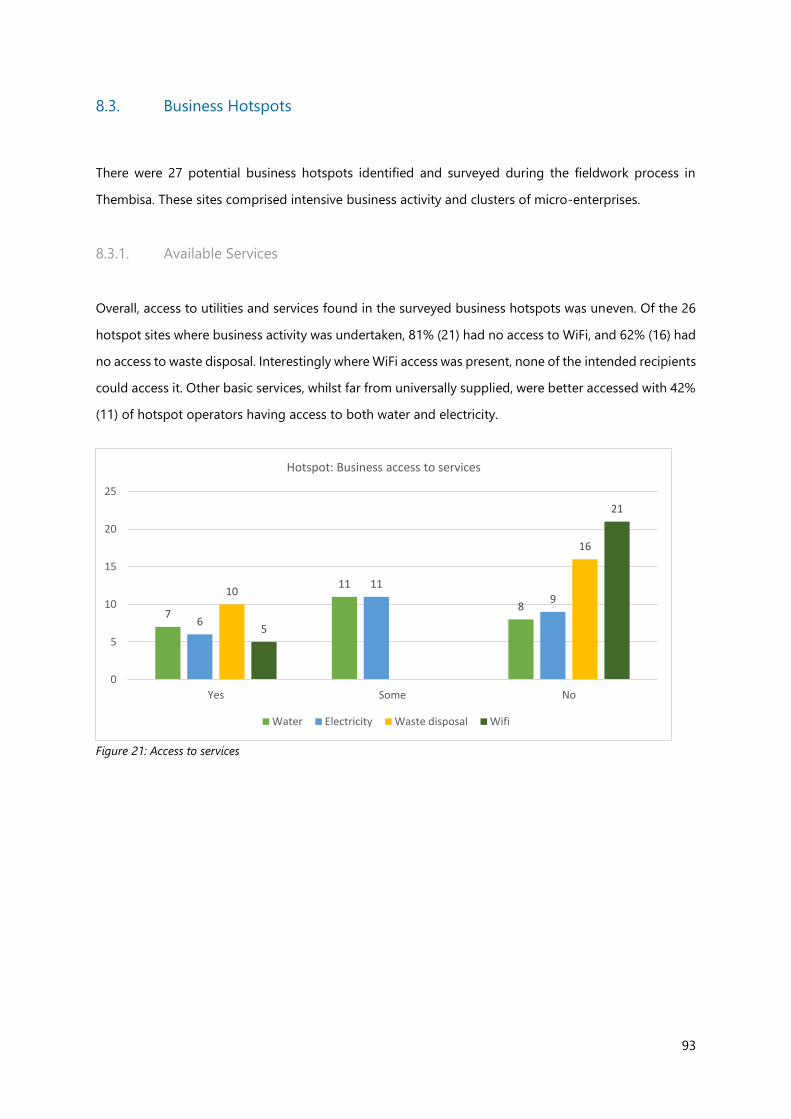
The survey recorded 27 business hotspots: these were localised sites with much business activity and
clusters of microenterprises. In these sites of strategic importance, 81% (21) had no access to WiFi, and
62% (16) had no access to waste disposal. The types of hotspots varied, made up of 27% retail nodes,
19% marketplaces and 15% high street sites. These hotspots have proven themselves to be incubators
and organic attractors of micro-enterprises. The survey revealed that some 435 businesses operated
from these hotspots with 174 from marketplaces, 88 in retail nodes, and 51 on high streets. An important
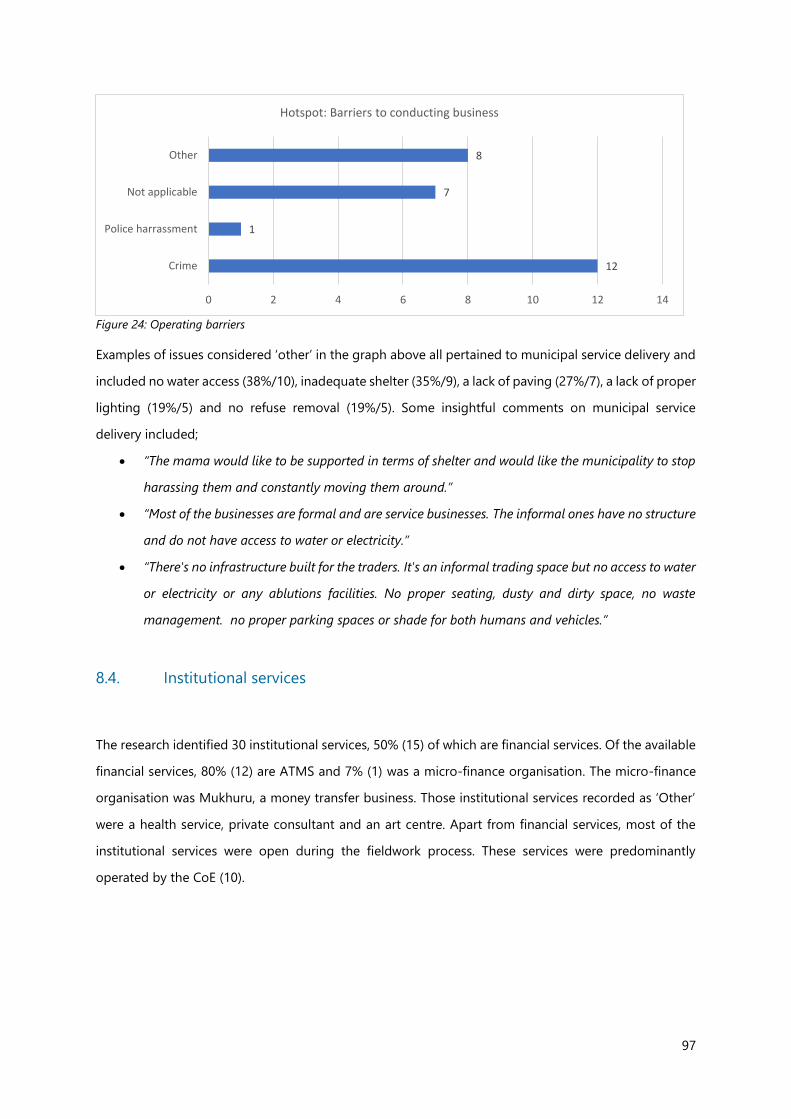
form of hotspot were open trading spaces. Fear of crime appeared to be the largest disincentive for
new businesses to occupy the available spaces within hotspots, with 46% of total hotspot business
sample considering it to be the main barrier to undertaking business.
Institutional services
There were 30 institutional services sites recorded in the survey, 50% (15) of which are financial services
including 12 (80%) ATMS from all major banks and 1 (7%) micro-finance organisation. The micro-finance
organisation was Mukhuru, a money transfer business. Those institutional services recorded as ‘Other’
were a health service, private consultant and an art centre. Apart from financial services, most of the
institutional services were open during the fieldwork process. These services were predominantly
operated by the CoE (10) and included the FabLab and business incubators.
Important Sectors
Whilst the microenterprise form and function in Thembisa is fairly consistent with South African
township economies, there are some important local sectors that stand out as having potential for
investment. These sectors have particular area advantages such as the clustering of relevant skills types
or markets,, being geographically close to important South African business sectors, or due to other
socio-economic circumstances that align to create competitive advantages.
9
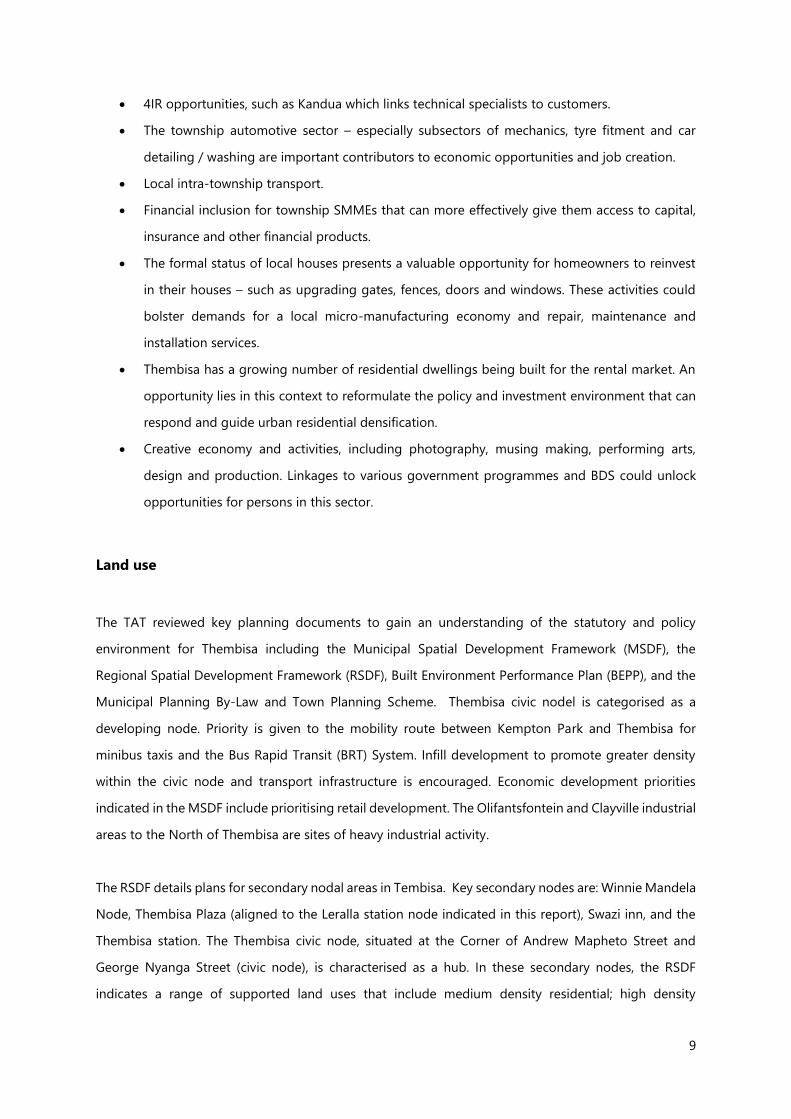
• 4IR opportunities, such as Kandua which links technical specialists to customers.
• The township automotive sector – especially subsectors of mechanics, tyre fitment and car
detailing / washing are important contributors to economic opportunities and job creation.
• Local intra-township transport.
• Financial inclusion for township SMMEs that can more effectively give them access to capital,
insurance and other financial products.
• The formal status of local houses presents a valuable opportunity for homeowners to reinvest
in their houses – such as upgrading gates, fences, doors and windows. These activities could
bolster demands for a local micro-manufacturing economy and repair, maintenance and
installation services.
• Thembisa has a growing number of residential dwellings being built for the rental market. An
opportunity lies in this context to reformulate the policy and investment environment that can
respond and guide urban residential densification.
• Creative economy and activities, including photography, musing making, performing arts,
design and production. Linkages to various government programmes and BDS could unlock
opportunities for persons in this sector.
Land use
The TAT reviewed key planning documents to gain an understanding of the statutory and policy
environment for Thembisa including the Municipal Spatial Development Framework (MSDF), the
Regional Spatial Development Framework (RSDF), Built Environment Performance Plan (BEPP), and the
Municipal Planning By-Law and Town Planning Scheme. Thembisa civic nodel is categorised as a
developing node. Priority is given to the mobility route between Kempton Park and Thembisa for
minibus taxis and the Bus Rapid Transit (BRT) System. Infill development to promote greater density
within the civic node and transport infrastructure is encouraged. Economic development priorities
indicated in the MSDF include prioritising retail development. The Olifantsfontein and Clayville industrial
areas to the North of Thembisa are sites of heavy industrial activity.
The RSDF details plans for secondary nodal areas in Tembisa. Key secondary nodes are: Winnie Mandela
Node, Thembisa Plaza (aligned to the Leralla station node indicated in this report), Swazi inn, and the
Thembisa station. The Thembisa civic node, situated at the Corner of Andrew Mapheto Street and
George Nyanga Street (civic node), is characterised as a hub. In these secondary nodes, the RSDF
indicates a range of supported land uses that include medium density residential; high density
10
residential; retail; office; entertainment; hospitality uses; service industry; taverns; and municipal and
government facilities. Leralla station, Limindlela station and Thembisa station have been identified as
Transit-Oriented Development (TOD) Nodes.
The BEPP categorizes Thembisa as a ‘marginalised peripheral township’. The township is classified as
being at moderate risk. The BEPP identifies dangerous electricity connections and air pollution as
possible sources of vulnerability (2020).
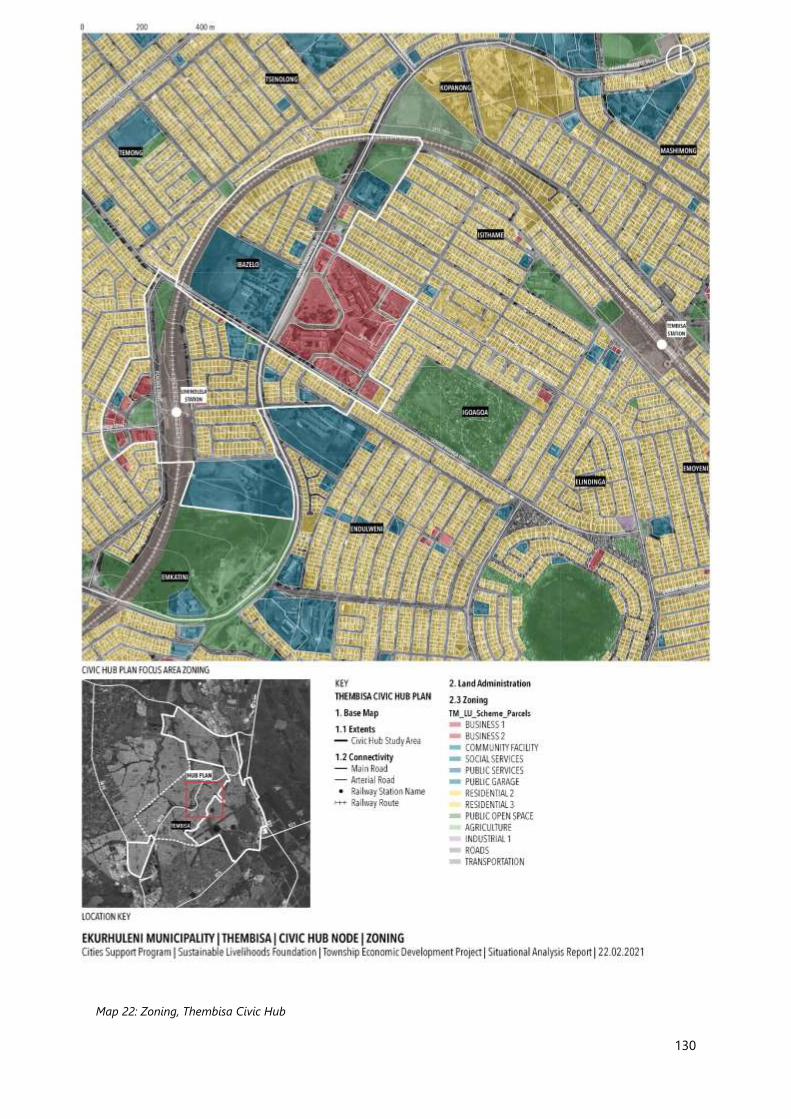
The land-use system in Thembisa follows a rather typical township arrangement of predominant
residential zoning with social/public zoning scattered throughout and limited land parcels designated
for commercial / business uses. Commercial land is evident in the civic node, but otherwise does not
noticeably feature in other more obvious situations: like transport interchanges, along high streets or at
train stations. Most of the area is zoned Single Residential 2. Business zoning is evident along Andrew
Mapheto Drive. The study site includes areas zoned Open Space, which are in varying degrees of
maintenance and use.
Various precinct development plans have been formulated, such as the Tembisa Hub Plan (2016)
developed as part of National Treasury’s NDPP to provide a mixed-use environment that is better
connected to the surrounding neighbourhoods. The hub is made up of seven sub-precincts, which are
envisioned to change over time. The aims for the short-term are as follows: the Tembisa and Limindlela
Station Precincts are to support a mix of business and medium to high density residential uses. The
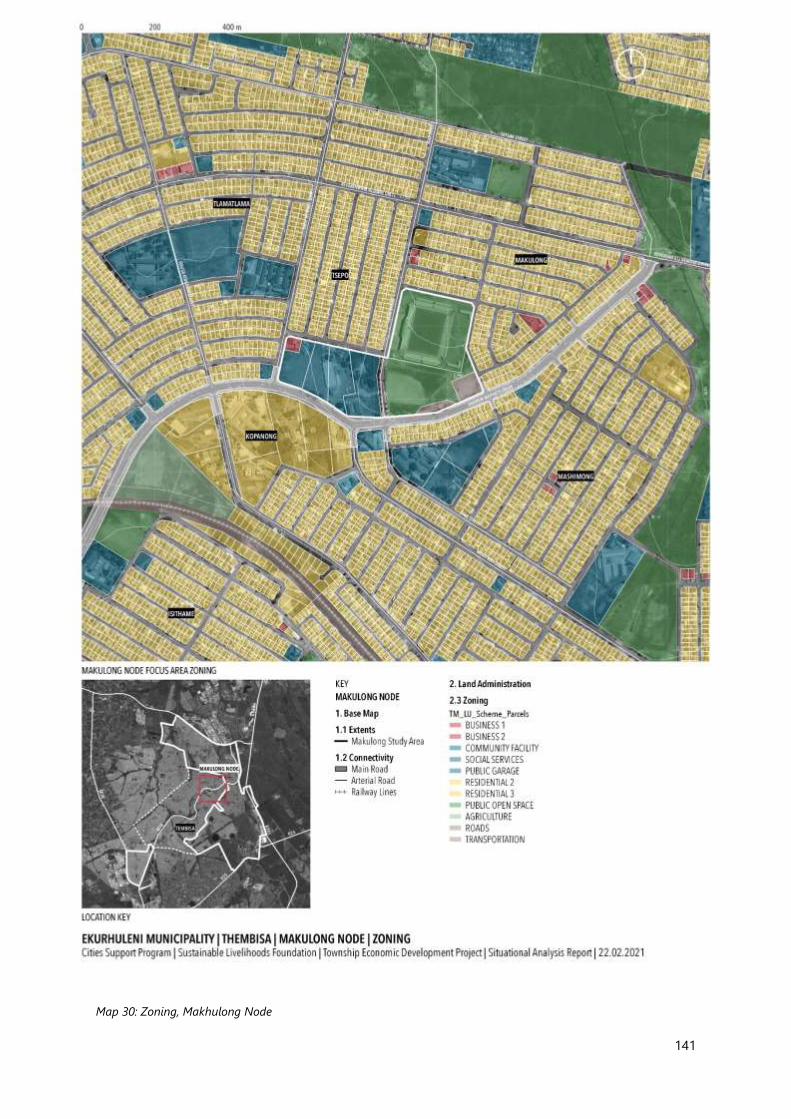
Thembisa Makhulong Community Precinct (2019) involves upgrades to the site incorporating the
Makhulong Stadium, Zion Church of Christ, Moses Molelekwa Arts and Computer Centre, YES4Youth
and hydroponics facility, informal businesses, and a soccer field. The plan is to formalize the soccer field
and motor repairs, expand the YES4Youth Hub and provide more intensive housing opportunities and
public interface opportunities.
Prioritised and high potential nodes
To inform any TED opportunities, the TAT developed a cohesive spatial overview using data from the
City, including reports and plans. Reviewing the microenterprise landscape and land use plans the team
was able to consider a range of priority nodes. These nodes are located on existing transport corridors
with a reasonable level of internodal synergy, where there is formal and operational basic infrastructure
and signs of increased residential private densification, especially around areas that have high amenity
or connectivity.
11
• Thembisa Civic Node - vibrant and active street life off a main transport corridor,
• Makhulong Community Precinct - social, sports and recreational node,
• Limindlela Station Precinct - close proximity to railway, civic node and north-south mobility
corridor,
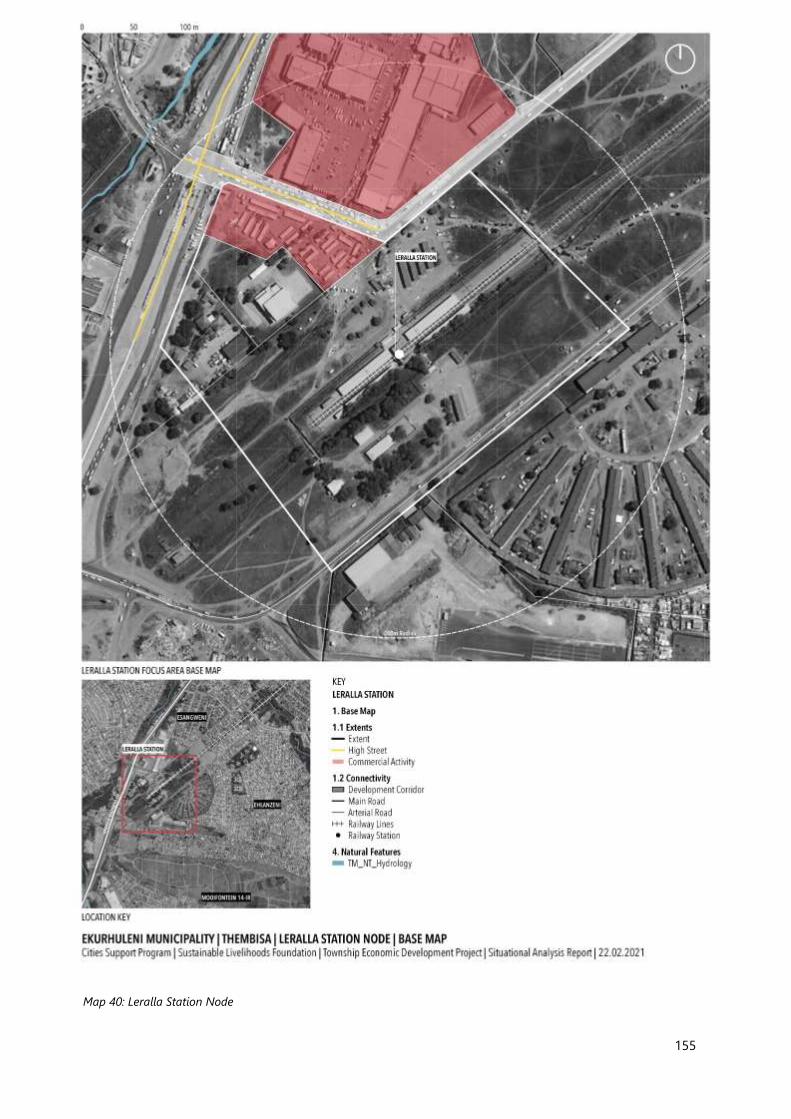
• Leralla Station Node – with significant existing assets for leveraging for growth and
diversification, especially the street traders market.
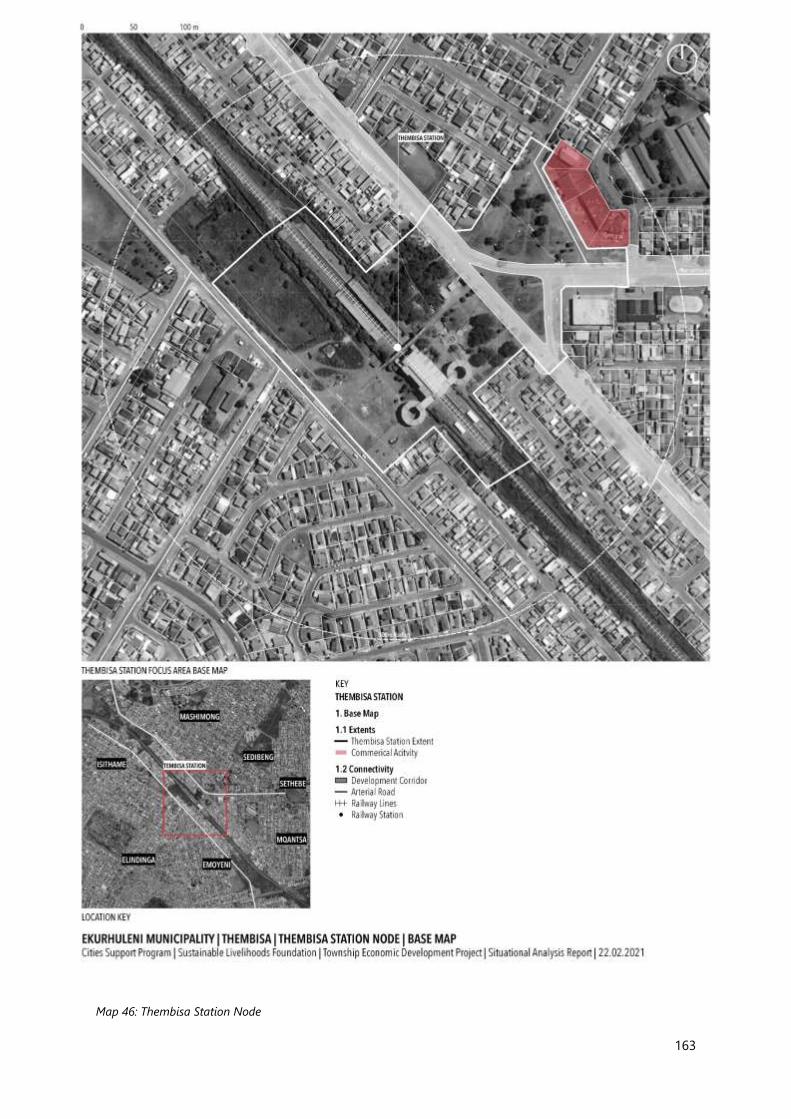
• Thembisa Station Precinct - defined by the (vulnerable) Thembisa Station.
Housing
There is growing demand for low-cost and affordable housing in Thembisa. The township is a long-
established, vibrant and sought-after place in the East Rand, relatively well-located in good proximity
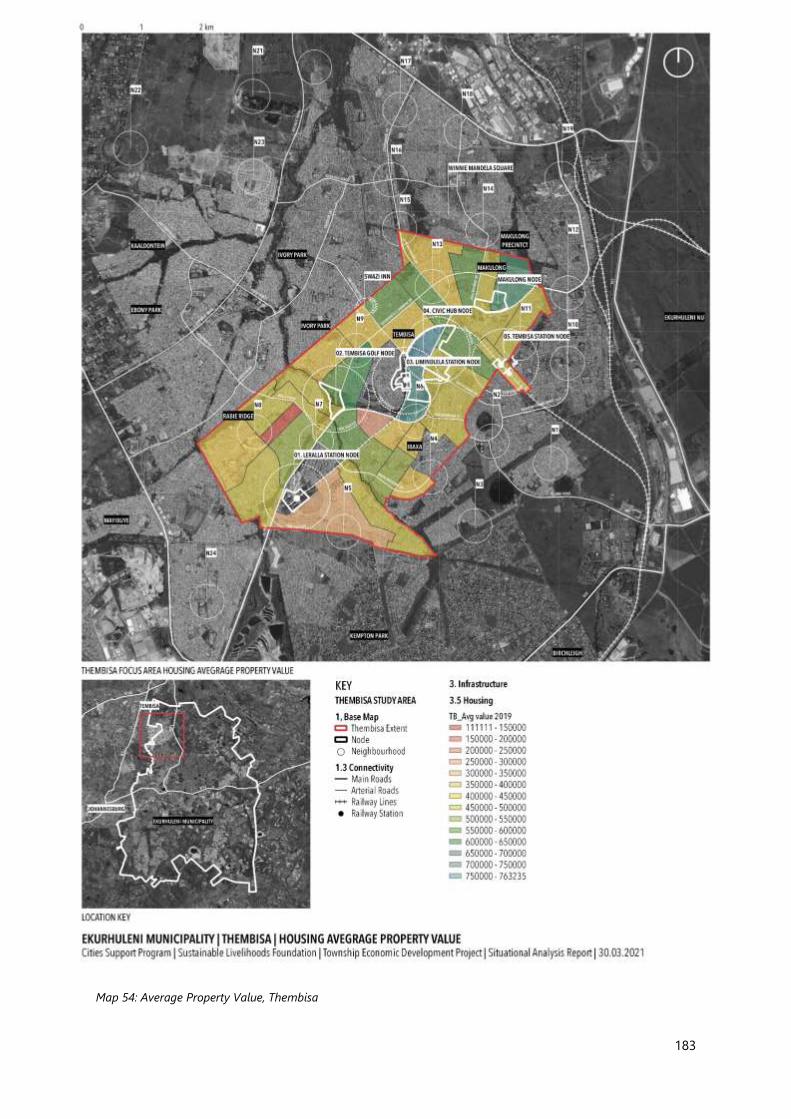
to employment opportunities and public transport routes. The areas of Endayini, Emkatini and Ibazelo
have the highest average property values in the township. There is a noticeable class of middle-income
households with higher purchasing power and a growing class of young professionals, who are seeking
higher quality housing, including rental accommodation. Homeowners in middle income strata have
made considerable investment into their properties, renovating, expanding the original building and
investing in place-making. Thembisa has a mix of formal and informal housing stock, whereas the
number of informal dwellings appear to be growing faster than formally delivered houses.
Few housing developments have taken place in recent years. A human settlements project is currently
being implemented in Extension 25 to cater for shack dwellers living in Winnie Mandela informal
settlement. However, in light of the latest announcements by the Department of Human Settlements,
indicating that free BNG housing delivery will be drastically reduced and replaced by sites and services
schemes, government investments in formal housing might be reduced. In this context it is especially
important to explore opportunities within innovative public-private partnerships to deliver higher-
density affordable housing.
Informal housing has largely absorbed the growing population in Thembisa. More specifically, informal
dwellings in the backyard of RDP/BNG houses have mushroomed across the settlement. In addition to
the low-cost shacks and ‘wendy’ houses, there has been a noticeable rise in solid single or double-storey
micro-flats. The diversification of backyard rental accommodation illustrates the existence of different
rental sub-markets catering for different income groups. Both the private and public sector have
recognised the growth and potential of the backyard real estate market.
12
High level discussions are taking place between the GPG, CoE and CSP of the National Treasury about
how to promote a precinct-based approach to backyarding in Thembisa. As financing is one of the main
challenges for homeowners to transform their low-cost structures into higher-quality, mixed used
backyard real estate, a precinct-based approach that ensures necessary scale could unlock large-scale
private sector funding from banks that is channelled via intermediaries to individual homeowners for
investment in these improvements. Linked with the right regulatory and administrative support, this
approach could contribute to the development of successful high streets. In addition, existing and future
informal settlements on well-located sites could be incrementally upgraded and vertically densified to
free up public spaces, install basic services and connect them to the rest of the township.
The low percentage of properties utilised for businesses along high streets and business hotspots
signals an opportunity for redevelopments in these sites, promoting more mixed-use buildings. The
ecosystem survey indicated a demand for commercial space in properties in those areas, as more than
80% of businesses rented the space compared to 8% who owned and 10% who did not declare their
tenure status.
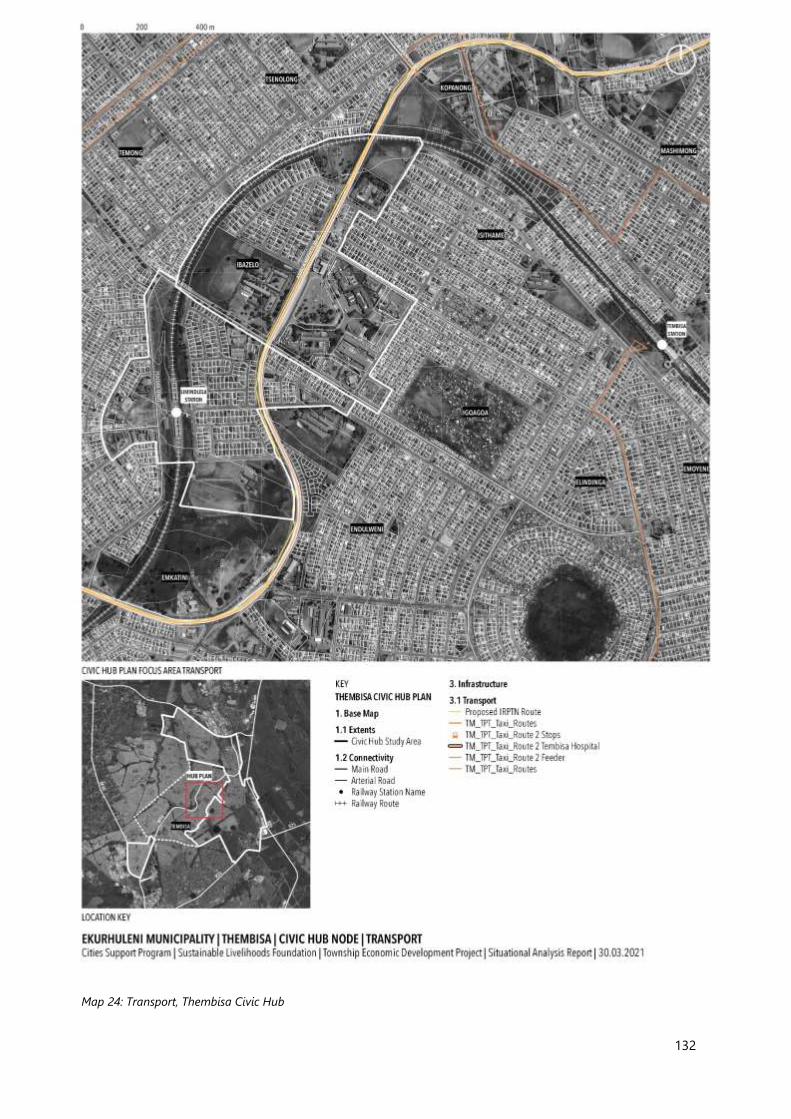
Transport
Thembisa, for the most part, has the infrastructure that is required to transform and ignite the public
transport systems, however the infrastructure is either poorly connected, unused, neglected or
damaged. Notable challenges are the Thembisa, Limindlela and Leralla train stations which are not
operational and heavily vandalized. Sidewalks are available to support non-motorised transport,
however there is theft of the paving blocks taking place. Sidewalks and road furniture such as lighting
are also commonly damaged and stolen within the site.
There is potential to achieve good connectivity between different modes of transport, though currently
the integration and connectivity is poor. Thembisa Station and Limindlela Station are spatially
disconnected from areas of high economic activity (retail nodes; malls), with some walking required
when commuters switch between transport modes. It should be noted that the terrain does allow for
relatively easy walking. In addition to the taxi rank available within the site, taxis pick up and drop off
passengers at several points along key main roads. The mini-bus taxi system operates in isolation from
the emerging BRT system. The Leralla station precinct has the potential of being an intermodal
interchange point as there are taxis that stop at that point, the Leralla station is nearby and there is the
construction of the BRT nearby with a pedestrian foot bridge to assist with accessibility across Andrew
Mapheto Drive.
13
There are 3 train stations and one major mini-bus rank within the study site. The train stations are only
partially operational. Despite the challenges facing rail passenger transport, the CoE has identified rail
as the backbone of its transport plan with the BRT system to be the main mode of public transport in
the north-south directions. Furthermore, the City recognises the need for Non-Motorised Transport
(NMT) infrastructure. Despite NMT gaining popularity in South Africa and worldwide it is important to
‘normalise’ its use to encourage adoption. NMT needs to be more visible, culturally acceptable and
safe.
Infrastructure
Public infrastructure has an important role in TED as there are various ways that infrastructure facilitates
the movement of resources between the wider economy to townships, and how it distributes resources
to households and individuals. An important aspect of these resource flows is access to the internet and
therefore the digital economy. The WiFi Connectivity National Grant has established 6 local WiFi
hotspots in public service facilities and there are numerous private suppliers including thinkwifi,
Screamer Telecoms, and ekeja.
Access to electricity is a major challenge, with many illegal power connections. Stormwater management
systems in Thembisa require upgrading as various challenges have surfaced due to the poor and
deteriorating quality of the infrastructure; the City is struggling to maintain and replace aging
infrastructure. The natural water systems in Ekurhuleni are heavily polluted by sewerage run-off. In
addition, as urbanisation has intensified, surface water run-off has increased exponentially. Wastewater
is a particular challenge in informal settlements where sanitation systems include pit latrines and
chemical toilets. There is no spare reservoir capacity available meaning that the water supply in this
area is under pressure. The sewers in Thembisa experience regular blockages and spillages. There is
evidence of sewer overflow at manholes, with flow loggings confirming that overflows are due to
insufficient capacity of the sewer, aging infrastructure, high sedimentation rates, and vandalism of
existing outfalls. Despite refuse removal services being available, informal and illegal refuse dumping
occurs throughout the site.
Environment
Cities are now mainstreaming ‘green economy’ considerations to enhance sustainability. The view that
an inclusive green economy should explicitly recognise and integrate the informal economy is gaining
14
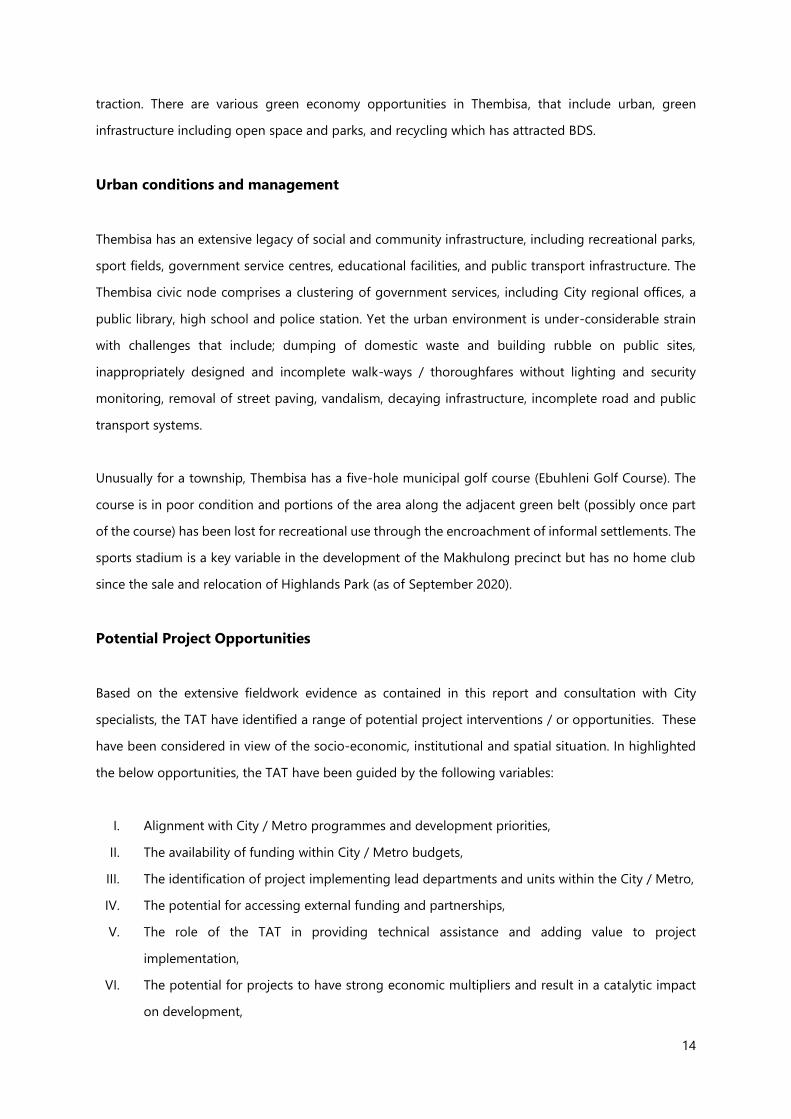
traction. There are various green economy opportunities in Thembisa, that include urban, green
infrastructure including open space and parks, and recycling which has attracted BDS.
Urban conditions and management
Thembisa has an extensive legacy of social and community infrastructure, including recreational parks,
sport fields, government service centres, educational facilities, and public transport infrastructure. The
Thembisa civic node comprises a clustering of government services, including City regional offices, a
public library, high school and police station. Yet the urban environment is under-considerable strain
with challenges that include; dumping of domestic waste and building rubble on public sites,
inappropriately designed and incomplete walk-ways / thoroughfares without lighting and security
monitoring, removal of street paving, vandalism, decaying infrastructure, incomplete road and public
transport systems.
Unusually for a township, Thembisa has a five-hole municipal golf course (Ebuhleni Golf Course). The
course is in poor condition and portions of the area along the adjacent green belt (possibly once part
of the course) has been lost for recreational use through the encroachment of informal settlements. The
sports stadium is a key variable in the development of the Makhulong precinct but has no home club
since the sale and relocation of Highlands Park (as of September 2020).
Potential Project Opportunities
Based on the extensive fieldwork evidence as contained in this report and consultation with City
specialists, the TAT have identified a range of potential project interventions / or opportunities. These
have been considered in view of the socio-economic, institutional and spatial situation. In highlighted
the below opportunities, the TAT have been guided by the following variables:
I. Alignment with City / Metro programmes and development priorities,
II. The availability of funding within City / Metro budgets,
III. The identification of project implementing lead departments and units within the City / Metro,
IV. The potential for accessing external funding and partnerships,
V. The role of the TAT in providing technical assistance and adding value to project
implementation,
VI. The potential for projects to have strong economic multipliers and result in a catalytic impact
on development,
15
VII. The potential for projects to leverage productivity enhancement,
VIII. The potential for projects to strengthen social cohesion and enhance community well-being,
including considerations of safety and security,
IX. The potential of project to contribute towards environmental sustainability and reduce the risks
from climate change,
X. The reach of projects and targeting of specific beneficiaries, including women, youth, informal
micro-enterprises and established SMEs,
XI. The timeframe for project implementation, recognising the need for immediate, short-term and
medium-term projects with varying levels of complexity,
XII. And the potential for projects to be replicable in other township localities.
The scope of potential projects is wide; the proposed opportunities allow for discussion of the merits or
otherwise of each interventiony before final selection.
The identified opportunities have been categorised within 7 headings: A) Policy and Strategy; B)
Enterprise Development; C) Nodal Development; D) Spatial Integration; E) Housing and Property; F)
Social and Community Infrastructure and G) Urban Management. The range of identified opportunities
within these categories are:
Table 1: Project Opportunities in Thembisa
A. Policy and Strategy
Opportunity Notes
Home based businesses formalised, enabling
growth and reducing business externalities.
The City to revise and develop policies on enterprise
formalisation (in respect to food retailing businesses and
home-based businesses), with reference to Gauteng
Prov. Gov. and National policies, supporting business
owners to meet compliance.
Revenue collection from rates improved. The City to develop a strategy and plan to generate rates
revenue from commercial businesses, including home-
based enterprises and businesses operating in retail
nodes.
Commercial high streets activated in strategic
sites / roads.
The City to identify sites with high potential for
commercial development and implement measures to
16
stimulate investment, including land-use, parking and
infrastructure.
Shopping malls foster and enable opportunities
for micro-enterprises.
The City to engage shopping mall owners to agree on
strategies to integrate micro-enterprises into the mall
precinct, through adherence to development planning
agreements and proactive measures to support micro-
enterprises.
TED evidence utilised in area-base strategic plans. The City to incorporate the evidence from the TED
situation analysis into strategic plans, including the IDP,
SDF, and BEPP.
Regulated business sectors are formalised and
able to access state-subsidies / industry
programmes.
The City to facilitate transversal engagement and co-
operation with the Gauteng Prov. Govt and National
Government to address constrains on ECDC, taverns /
restaurants, undertakers and other regulated sectors
from attaining compliance with business licencing.
B. Enterprise Development
Opportunity Notes
Opportunities in the creative and leisure
economies provide youth a pathway to transition
into jobs and livelihoods.
The City to conceptualise a strategy to promote creative
activities focusing on youth interests, including hobbies,
via social enterprises and community-based
programmes, use of City facilities, the staging of events,
and linkages to BDS services.
Micro-enterprises have improved access to
business development support services.
The City to promote the DSBD district information
management system as part of its enterprise
development support services, facilitating partnerships
between the City and BDS providers (including SEDA
/SEFA) to benefit Thembisa businesses.
Street signage / advertising extensively utilised to
promote local businesses.
The City to develop and implement, via partnerships, a
project to provide street signage / advertising boards to
promote local enterprises.
Mechanics / panel beaters and associated
businesses in the after-sales automotive sector
have access to business development support
services to grow and professionalise.
The City to facilitate partnership with private sector
companies, the Gauteng Prov. Gov. and the DSBD to
provide equipment / skills training / supply agreements /
finance to township entrepreneurs.
Micro-enterprises have improved access to digital
services to participate in the digital economy &
4IR technologies.
The City to facilitate partnerships, including SEDA and
Gauteng Prov. Gov., to improve digital access in
Thembisa, through (inter alia) digital hubs, free wi-fi,
broadband roll-out and the promotion of marketing
Apps.
17
An annual trade marketing event to be held in
Thembisa to link the community producers and
marketeers to business opportunities.
The City to conceptualise and facilitate a trade
promotion event in Thembisa to stimulate opportunities
for direct marketing, supplier agreements and digital
services. The event will aim to connect home-based
traders & producers to companies / markets.
The income and productivity of township recyclers
improved.
The City to facilitating partnerships and strengthen
cooperates to enable township waste recyclers to more
effectively obtain and package waste material and
improve access to markets.
Urban agriculture productivity enhanced. The City to broaden extension services for urban
producers and foster partnership with marketing
platforms (including digital platforms such as Khula -
https://khula.co.za/) and outlets.
Businesses have greater financial literacy and have
access to services and technologies, including
digital platforms.
The City to facilitate partnerships, including Gauteng
Prov. Gov. & Finmark Trust, to provide businesses with
financial literacy training and improve access to services
and technologies.
C. Nodal Development
Opportunity Notes
A precinct management plan instituted, and
upgrades completed for Leralla trader market.
The City to conceptualise and implement a plan with
projects for the revitalisation of the Leralla trader market
and institutionalisation of a precinct management.
Thembisa civic hub transformed into a business
and service hub.
The City, in partnership with the NDPP and private
investors, to advance projects and mobilise investment
into the Thembisa hub precinct.
A street trader plan implemented within the
Thembisa civic node.
The City to plan and implementing a street trader plan
within the civic hub, identifying and implementing
projects to improve the trading environment.
A financially sustainable business model
formulated to develop and operationalise taxi
ranks as business hubs.
The City, in partnership with the Gauteng Prov. Gov. and
taxi associations, to conceptualise a PPP business model
to develop the Esangweni Taxi Rank.
A precinct management and development plan
for Swazi Inn approved.
In partnership with the City of Johannesburg, the City to
undertake a study to propose a precinct management
approach and projects for Swazi Inn to enhance
opportunities for business, reduce urban management
challenges and improve safety and security.
18
D. Spatial Integration
Opportunity Notes
Train station nodes revitalised for mixed-use. The City to identify opportunities for revitalising the
station nodes (Tembisa, Limindlela, and Leralla) and
conceptualise a development strategy.
A network of NMT and pedestrian lanes
developed.
The City to conceptualise and implement projects to
build a network of NMT lanes / routes, prioritising
linkages to the civic hub.
An integrated public transport system achieved. The City to develop a strategy and partnerships,
including the Gauteng Prov. Gov., to improve integration
between minibus taxis, train, BRT and bus systems,
including the introduction of a single payment system.
Public transport networks and facilities are
operational.
The City to execute planned projects, including BRT
stations (including civic hub) and road upgrades. The City
to engage National Government and PRASA to fast-track
repairs to the railway line.
Motor cycle usage is expanded to provide
township residents with more affordable transport
and self-employment opportunities.
The City partners with private sector to increase access to
motorcycle transport, through training schemes,
marketing campaigns and working with local champions.
Infrastructure developed to provide and enable
universal access to public transport.
The City to embrace and implement designs for universal
access to ensure that people living with disabilities /
mobility requirements have access to public transport
infrastructure.
Purposeful cart & trolley designs utilised by
traders and waste collectors.
The City to facilitate a design studio, with participation of
technical training colleagues, traders and artisans, to
design, develop and manufacture protypes of
appropriate trollies to enhance access to markets.
E. Housing and Property
Opportunity Notes
Encourage private/household investment in
backyard rental housing units, and support a
gradual process of upgrading and formalisation.
The City will develop an enabling framework, simplified
regulations and active support mechanisms to upgrade
and formalize backyard rental housing units, advancing a
precinct-based approach.
Strengthen the capabilities of the local
construction industry and improve the functioning
of the housing market.
The City will establish a local housing support centre to
encourage more investment in the housing stock,
provide advice on title deeds and property transfers, and
19
facilitate the growth of local builders, property
developers, real estate agents and other housing-related
enterprises.
Encourage housing investments by the public and
private sectors in strategic sites to raise
population densities, encourage mixed land uses
and stimulate additional economic activity.
The City will introduce procedures to fast track higher
density housing investments, including PPPs, in strategic
sites, including within the civic hub.
F. Social and Community Infrastructure
Opportunity Notes
The Thembisa golf course is re-habilitated as a
recreational facility, social space and conserved
green belt.
The City to devise a plan with projects for the
improvement of the Thembisa golf course as a strategic
ecosystem resource, including the establishment of
partnerships for implementation and management.
G. Urban Management
Opportunity Notes
Facilities upgraded and precinct management
instituted in public spaces (including parks).
The City to identify and implement projects to upgrade
facilities and to develop and implement precinct
management strategies for the upkeep of parks,
including Thami Mnyele Cultural Park and Imbazelo Park.
Public Employment Programmes introduced and
utilised to address urban management challenges,
including the maintenance of recreational and
ecosystem resources.
The City to repurpose PEP to improve urban
management challenges, including dumping, through
identifying partnerships and new approaches.
Public safety enhanced through the application of
crime prevention through environmental design
and precinct management.
The City to adopt CPTED strategies and precinct
management to revitalise public spaces and support
diverse social, economic and recreational functions
across multiple users.
In the Second Phase of the TED Project, the TAT will support the CoE to conduct an evaluation of the
merits of these opportunities. This process will require high-level transversal engagement with all
affected line departments and units. An evaluation matrix tool will be utilised to record the outcome of
20
this engagement process. The results of the evaluation will guide the project steering team to re-assess
the identified opportunities to be incorporated in the TAT supported township economy development
strategy for Thembisa.
The section of the 8 projects will be determined in consideration of the following criteria AND weighting
(minimum number of projects) to ensure that the range of project interventions address economic,
socio-spatial and institutional change. The TAT will provide a high-level indication of the ‘value-add’
from technical assistance in respect to the selected projects to address the necessity for a range of
project interventions.
Criteria
Min
imu
m
# o
f P
roje
cts
aligns with identified City programme and project priorities. 4
can be funded by the City. 4
has an identified lead department / unit for implementation. 4
can unlock new partnerships via the CSP and non-state actors. 2
will benefit from CSP technical assistance. 4
can enhance productivity and stimulate economic multipliers. 4
will benefit emerging entrepreneurs and marginalised groups. 4
will enhance social cohesion, improve safety, and contribute to environmental sustainability. 1
will strengthen spatial integration. 1
will enhance the availability of decent housing and accommodation. 2
will enable immediate wins (within a 24-month timeframe). 4
will improve the township business environment and ecosystem services. 2
is replicable in other townships. 4
The TAT support may include:
• Partnership facilitation,
• Strategic and policy advice,
21
• Project conceptualisation and design,
• Business case development,
• Research support and knowledge sharing,
• Project monitoring & evaluation and impact assessment,
• Project submission within City and NT budgeting process,
• Project spatial and architectural design.
• Quick-win implementation.
• Support in the preparation of calls for proposals or tenders.
At the conclusion of the assessment process, and agreement on the ranking and weighting of the
identified opportunities, the TAT will then support the CoE advance 8 projects within the framework of
an overarching township development strategy.
22
II. Abbreviations and Acronyms
ANDE Aspen Network of Development Entrepreneurs
BBBEE Broad-Based Black Economic Empowerment
BBSDP Black Business Development Programme
BDS Business Development Support
BEPP Built Environment Performance Plan
BRT Bus Rapid Transit
CAHF Centre for Affordable Housing Finance
CIS Co-operatives Incentives Scheme
COGTA Cooperative Governance and Traditional Affairs
CSP Cities Support Programme
DALRRD Department of Agriculture, Land Report and Rural Development
DSBD Department of Small Business Development
DIMS District Information Management System
ED Economic Development
EDP Guateng City Regional Economic Development Plan
EDSE Ecosystem Development for Small Enterprise programme
CoE City of Ekurhuleni
GCR Gauteng City Region
GGT Gauteng Growing Together
GIS Geographic Information System
GPG Gauteng Provincial Government
IMEDP Informal Micro-Enterprise Development Programme
IRPTN Integrated Rapid Public Transport Network
IZ1 Integration Zone 1
LAP Local Area Plan
MPV Multi-Purpose Vehicles
MSDF Municipal Spatial Development Framework
MTEF Medium-Term Expenditure Framework
NMT Non-Motorised Transport
NT National Treasury
NYDA National Youth Development Agency
23
PPE Personal Protection Equipment
PSL Premier Soccer League
RMDSF Regional Municipal Spatial Development Framework
SEDA Small Enterprise Development Agency
SEFA Small Enterprise Finance Agency
SLF Sustainable Livelihoods Foundation
SME Small and medium enterprises
SMME Small, Medium and Micro-Enterprises
SPLUMA Spatial Development and Land Use Planning Act, 2013
StatsSA Statistics South Africa
TAT Technical Assistance Team
TED Township Economic Development Project
TEDB Township Economic Development Bill
ToC Theory of Change
ToD Transit-oriented development
TPS Town Planning Scheme
TREP Township and Rural Entrepreneurship Programme
TRS Township Revitalisation Strategy
WGB World Bank Group (South Africa)
24
III. Table of Contents
I. Executive Summary ................................................................................................................................3
II. Abbreviations and Acronyms .......................................................................................................... 22
III. Table of Contents ................................................................................................................................. 24
IV. List of Figures ........................................................................................................................................ 29
3.2. CSP TED Theory of Change ...................................................................................................................... 37
4.4. Spatial information ...................................................................................................................................... 43
7.1. National government programmes ...................................................................................................... 54
7.1.1. Small Enterprise Development Agency .......................................................................................................................... 55
7.1.2. Small Enterprise Finance Agency ...................................................................................................................................... 56
7.1.3. Black Business Supplier Development Programme .................................................................................................. 56
7.1.6. Informal and Micro Enterprises Development Programme .................................................................................. 57
25
7.1.7. The Small Business Innovation Fund............................................................................................................................... 57
7.1.8. Township and Rural Entrepreneurship Programme ................................................................................................. 58
7.1.10. District Information Management System .............................................................................................................. 59
7.1.11. The Integrated Township Economic Development Programme ................................................................... 59
7.1.12. Small Business Economic Development Portal ..................................................................................................... 60
7.1.13. NYDA – Grant Programme ............................................................................................................................................ 60
7.2. Gauteng Province Programmes.............................................................................................................. 60
7.2.1. Growing Gauteng Together 2030 .................................................................................................................................... 60
7.2.2. The Township Economic Revitalisation Action Plan ................................................................................................. 61
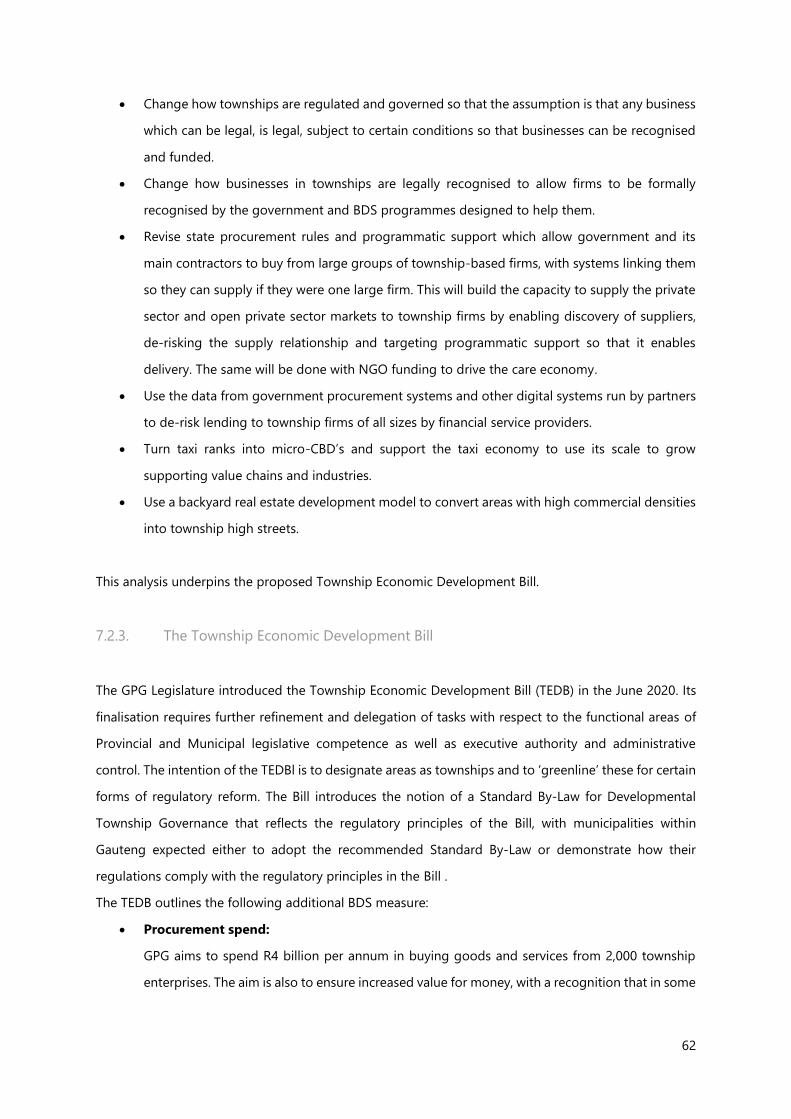
7.2.3. The Township Economic Development Bill .................................................................................................................. 62
7.3. Other Enterprise Development Support ............................................................................................. 63
7.3.1. Gauteng City Region Development Plan (2015-2020) ............................................................................................ 64
7.4.1. Ekurhuleni Growth and Development Strategy 2025 .............................................................................................. 64
7.4.2. Ekurhuleni Ten (10) Point Economic Plan ..................................................................................................................... 65
7.4.3. Integrated Development Plan (IDP) 2018/19 .............................................................................................................. 66
7.4.4. Economic Development Department ............................................................................................................................. 66
7.4.5. Business Development Services in Thembisa .............................................................................................................. 66
8.3. Business Hotspots ........................................................................................................................................ 93
8.3.1. Available Services .................................................................................................................................................................... 93
8.3.2. Hotspot Place categories ..................................................................................................................................................... 95
8.3.3. Barriers to operating .............................................................................................................................................................. 96
9. Important Sectors .............................................................................................................................. 102
9.3. Transport nodes......................................................................................................................................... 105
9.4. Building Trade ............................................................................................................................................ 107
10. Land use ................................................................................................................................................ 109
10.1. Land Administrative Policies ................................................................................................................. 109
10.2. Development Plans .................................................................................................................................. 110
10.2.1. Metropolitan Spatial Development Framework, 2015 .................................................................................... 110
10.2.2. Regional Spatial Development Framework, Region B, 2015 ........................................................................ 111
10.2.3. Transit Oriented Development Nodes................................................................................................................... 111
10.2.4. City of Ekurhuleni Built Environment Performance Plan, 2020 – 2021 .................................................... 111
10.3. Land Use Dynamics .................................................................................................................................. 112
12.2. Conceptual Framework: Housing as social, economic and financial asset ......................... 168
12.3. Housing as social asset ........................................................................................................................... 171
12.7. Housing as financial asset...................................................................................................................... 181
13. The Transport System ....................................................................................................................... 184
13.1. Transport Infrastructure .......................................................................................................................... 184
13.2. Development Challenges ....................................................................................................................... 185
13.3. Connectivity Between Different Modes ............................................................................................ 186
13.4. Transport Options and Services .......................................................................................................... 186
13.5. Integrated Public Transport Network ................................................................................................ 188
13.6. Non-Motorised Transport ..................................................................................................................... 191
14.2. Digital Infrastructure ................................................................................................................................ 200
14.4. Water and Sanitation ............................................................................................................................... 203
14.7. Energy Provision ........................................................................................................................................ 204
15.3. Green Infrastructure ................................................................................................................................. 206
15.4. Waste Collection and Recycling .......................................................................................................... 209
16. Urban conditions and management ........................................................................................... 211
17. Social and Cultural Considerations.............................................................................................. 216
18.1. Policy and Strategy ................................................................................................................................... 220
18.2. Enterprise Development ......................................................................................................................... 221
18.3. Nodal Development ................................................................................................................................. 222
19. Next Steps............................................................................................................................................. 225
Figure 3: Ecosystem Survey Instrument in the CommCare App .............................................................................. 46
Figure 4: Field work team in Thembisa .............................................................................................................................. 47
Figure 5: Overview of business size and legal status ................................................................................................... 70
Figure 6: Street trade predominates in much of Thembisa ....................................................................................... 71
Figure 7: Micro-enterprise businesses by enterprise classification ........................................................................ 71
Figure 8: Building and renovation of houses is an important local economic activity ................................... 72
Figure 9: Nationality of respondents .................................................................................................................................... 75
Figure 10: Respondent business roles and nationality ................................................................................................... 76
Figure 11: Respondent age and gender .............................................................................................................................. 76
Figure 12: Business infrastructure ........................................................................................................................................ 78
Figure 13: Occupation model and rent paid in ZAR ..................................................................................................... 80
Figure 14: Available utilities .................................................................................................................................................... 82
Figure 15: Time in business .................................................................................................................................................... 85
Figure 16: Comparison of respondent age and time in business ........................................................................... 86
Figure 17: Main operating challenges ................................................................................................................................ 87
Figure 18: Support deemed beneficial by respondents .............................................................................................. 88
Figure 19 Corporate businesses by enterprise classification ................................................................................... 89
Figure 20 SME businesses by enterprise classification ................................................................................................ 90
Figure 21: Access to services .................................................................................................................................................. 93
Figure 22: Hotspot place categories ................................................................................................................................... 95
Figure 23: Number of businesses per site type .............................................................................................................. 96
Figure 26: Linking township micro-enterprises to larger markets through the use of 4IR technology
and cost-effective transport has potential to enhance business practice and market access ................. 100
Figure 27: Linking township micro-enterprises to larger markets through the use of 4IR technology
and cost-effective transport has potential to enhance business practice and market access ................. 101
Figure 28: Building on the taxi/public transport economy ..................................................................................... 106
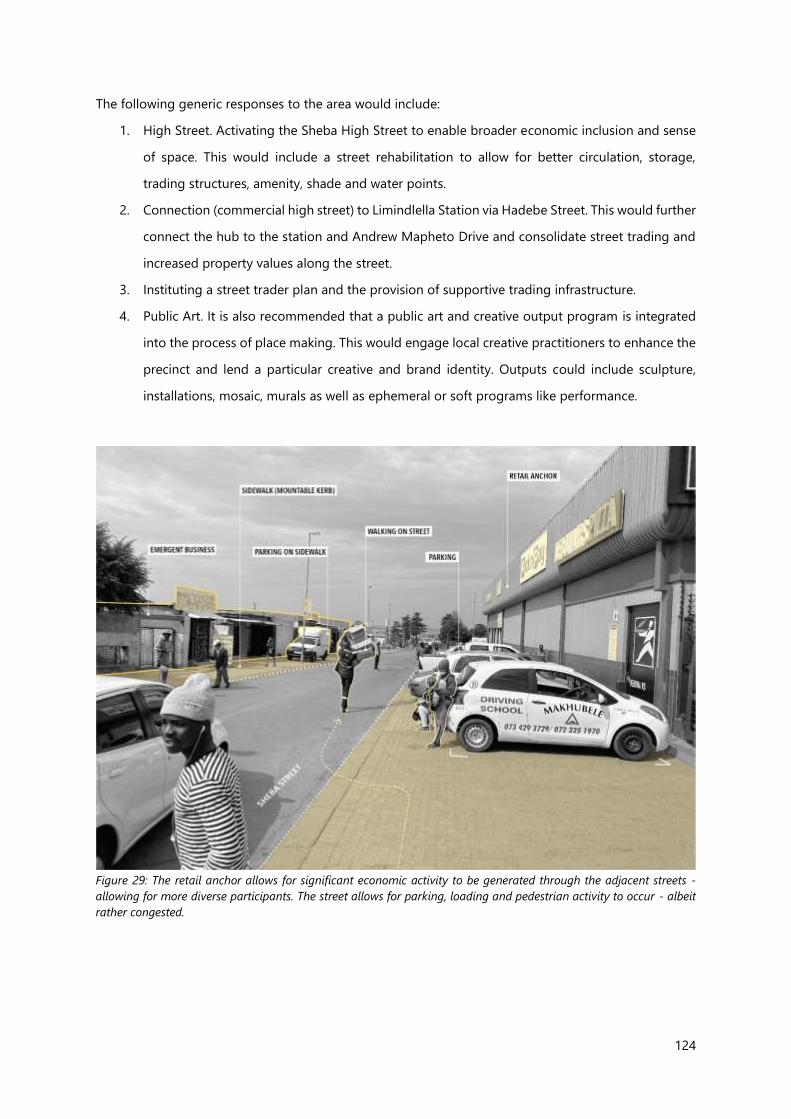
Figure 29: The retail anchor allows for significant economic activity to be generated through the
adjacent streets - allowing for more diverse participants. The street allows for parking, loading and
pedestrian activity to occur - albeit rather congested. ............................................................................................ 124
Figure 30: The recently upgrade park provides a key pedestrian railway underpass in the
neighbourhood. The amenities require augmenting and programming to ensure better use of the park
across more diverse user groups to better use the space. ..................................................................................... 125
Figure 31: Signage is critical to micro street businesses and are well located to attract potential clients
and showcase services. These signs, their business, location and coordination presents a valuable
opportunity to strategise a coordinated response to signage and space making. ...................................... 136
Figure 32: The taxi rank comprises key uses - the train station, shopping centre and market, bring
great vitality to the rank. The links between the various spaces and the poor definition of the public
space renders the space performing sub-optimally. ................................................................................................. 153
Figure 33: This busy market caters to a diversity of users activists within the area. The trading spaces
could be enhanced to better provide for amenities and services for both trades and consumers, such
as seating spaces, storage, dedicated cooking spaces and shade. ..................................................................... 153
Figure 34: The irregular train service compromises coordinated economic growth at the station nodes.
The traders along walkways currently respond to consumers using the railway bridge to cross the
railway line. The existing infrastructure here can be appropriated for new uses. ......................................... 162
Figure 35: Housing Asset Values and their contribution to TED .......................................................................... 169
Figure 36: Residents of Thembisa make investments into the security and beautification of homes .. 172
Figure 37: Mixed Use Development proposed for Makhulong Community Precinct .................................. 173
Figure 41: Private residential plots are optimised for additional rental housing - sometimes
demolishing the original house to make better spatial and economic use of the property. ................... 179
Figure 42: Micro-enterprises' use of fixed or mobile structures for trading .................................................... 180
Figure 43: Tenure status of micro-enterprises ............................................................................................................. 181
Figure 44: Typical cross-section of a complete street with a walkway/cycle track ....................................... 196
Figure 45: Examples of non-motorised and universal access infrastructure interventions........................ 198
Figure 52: Potential Development Opportunities ....................................................................................................... 219
Table 1: Project Opportunities in Thembisa..................................................................................................................... 15
Table 2: ATMs in Thembisa ..................................................................................................................................................... 98
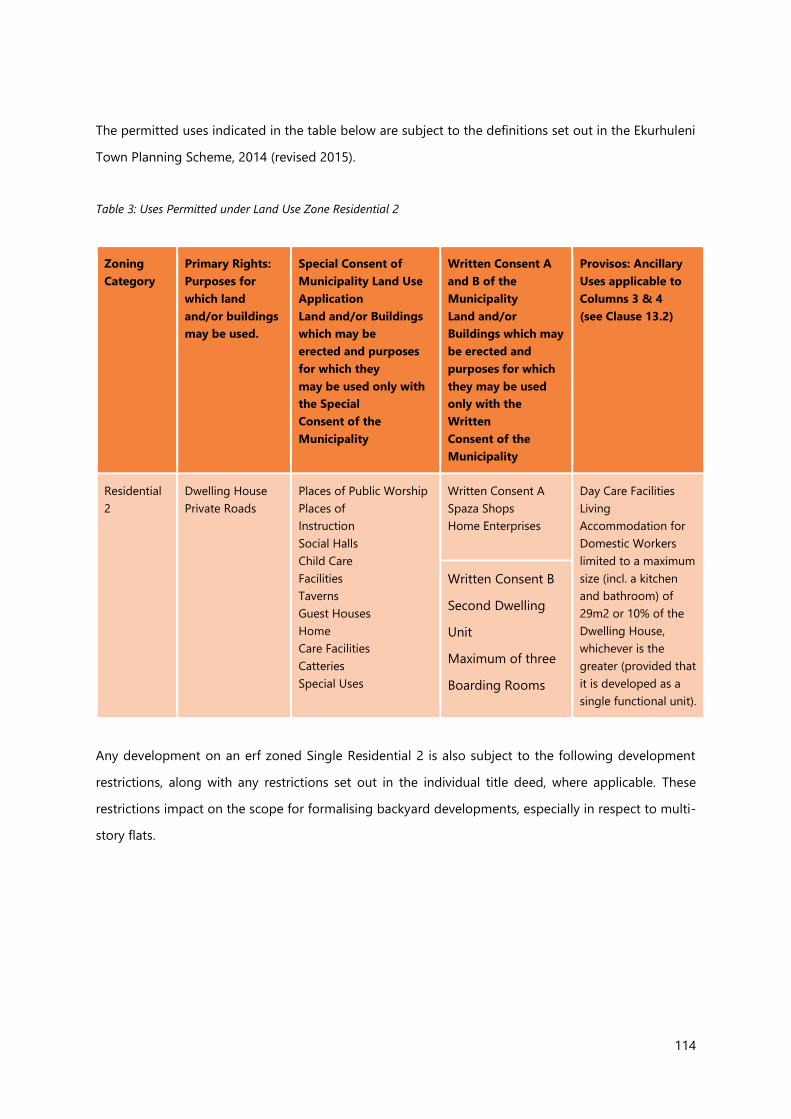
Table 3: Uses Permitted under Land Use Zone Residential 2 ................................................................................ 114
Table 4: Residential 2 Building Lines ................................................................................................................................ 115
Table 5: Residential 2 Height, Coverage and Density ............................................................................................... 115
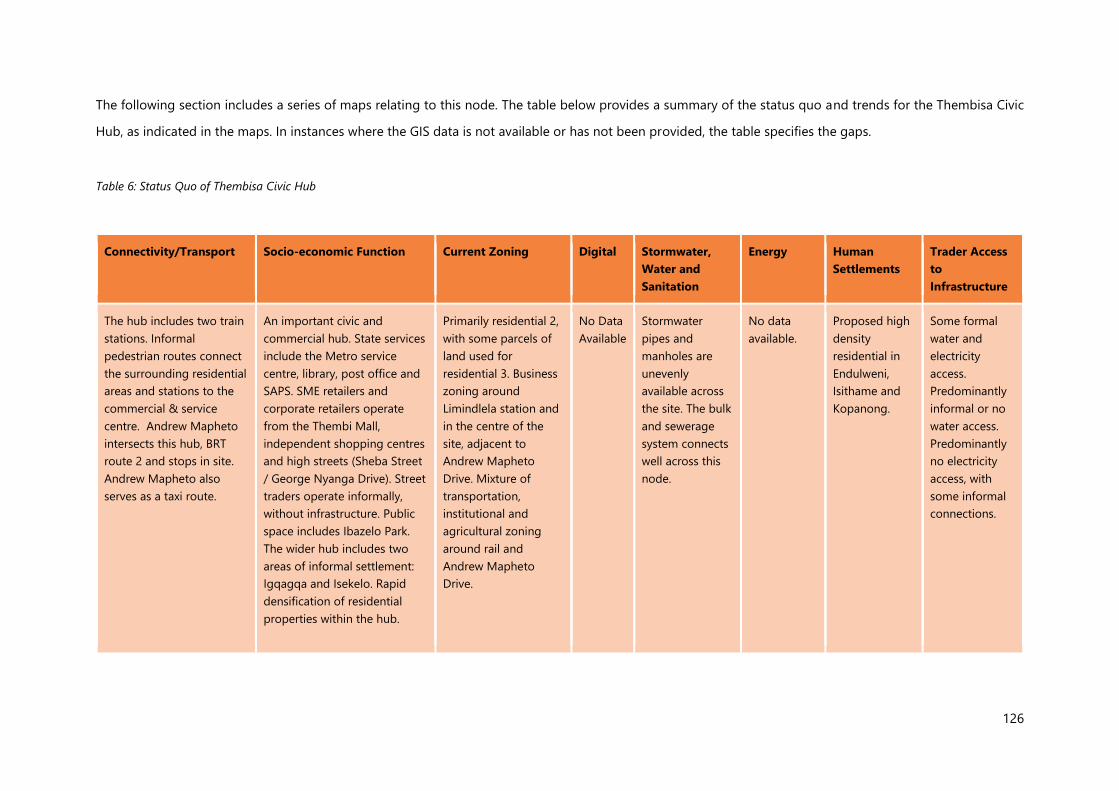
Table 6: Status Quo of Thembisa Civic Hub.................................................................................................................. 126
Table 7: Status Quo of the Makhulong Node .............................................................................................................. 137
Table 8: Status Quo of Leralla Station Node ................................................................................................................ 154
Table 9: Thembisa Transport Infrastructure (based on GIS Map) ........................................................................ 184
Table 10: Thembisa transport options and services .................................................................................................. 186
Map 1: Stormwater Infrastructure, Limindlela Station ......................................................................................................
Map 2: Thembisa in the context of the City of Ekhurhuleni ...................................................................................... 53
Map 3: Businesses, Business Hotspots and Institutions in Thembisa ................................................................... 69
Map 4: Micro-Enterprises by Classification ...................................................................................................................... 73
Map 5: Survey and Open Source Data on Micro-Enterprise Classification ......................................................... 74
Map 11: Corporates and SMEs .............................................................................................................................................. 91
Map 12: Corporates and SMEs Open-Source Data ....................................................................................................... 92
Map 13: Business Hotspots .................................................................................................................................................... 94
Map 34: Development Proposals, Makhulong Node: ............................................................................................... 145
Map 35: Limindlela Station Node ..................................................................................................................................... 147
Map 36: Land Ownership, Limindlela Station Node .................................................................................................. 148
Map 37: Zoning, Limindlela Station Node ..................................................................................................................... 149
Map 38: Transport, Limindlela Station Node........................................................................................................................
Map 39: Stormwater Infrastructure, Limindlela Station ........................................................................................... 151
Map 40: Leralla Station Node ......................................................................................................................... 153
Map 41: Leralla Station Node .....................................................................................................................................................
Map 42: Land Ownership, Leralla Station Node .......................................................................................................... 156
Map 43: Zoning, Leralla Station Node ............................................................................................................................ 157
Map 44: Transport, Leralla Station Node ....................................................................................................................... 158
Map 45: Housing Dynamics, Leralla Station Node ..................................................................................................... 159
Map 46: Stormwater Infrastructure, Leralla Station ................................................................................................... 160
Map 47: Thembisa Station Node....................................................................................................................................... 163
Map 48: Land Ownership, Thembisa Station Node ................................................................................................... 164
Map 49: Zoning, Thembisa Station Node ...................................................................................................................... 165
Map 50: Transport Facilities and Routes, Thembisa Station Node ...................................................................... 166
Map 51: Stormwater Infrastructure, Thembisa Station Node ................................................................................ 167
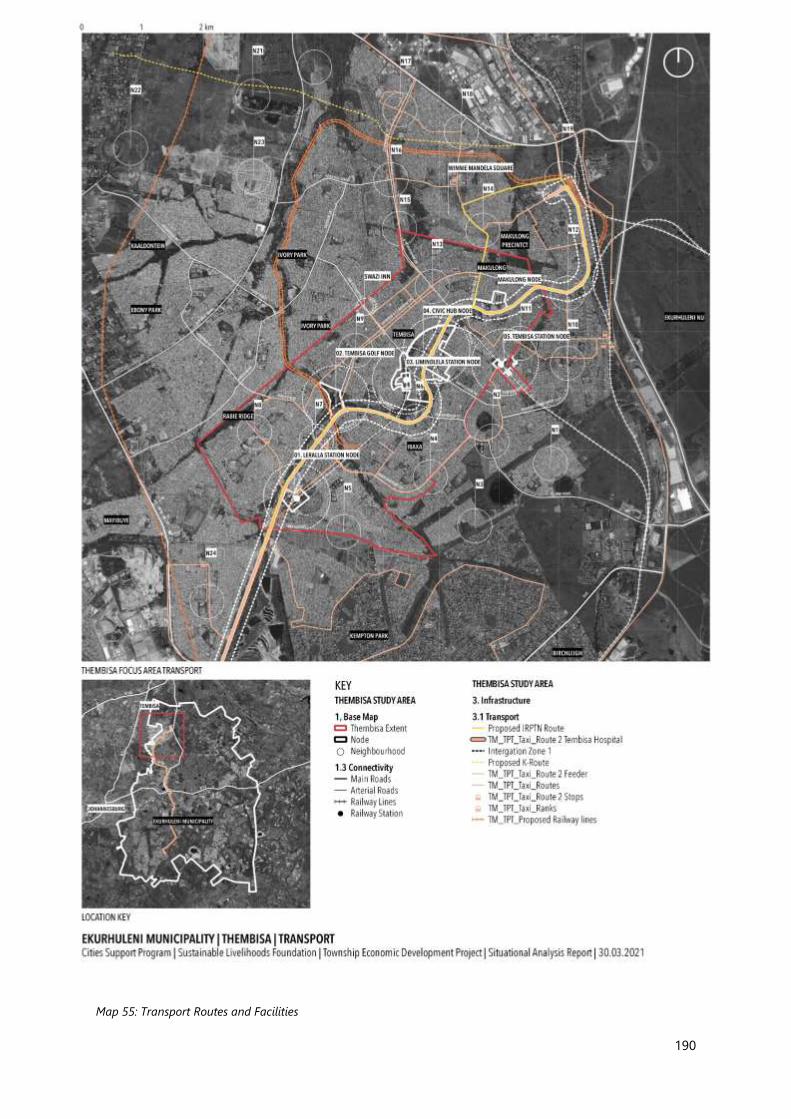
Map 56: Transport Routes and Facilities ........................................................................................................................ 190
7.3.1. Gauteng City Region Development Plan (2015-2020)
The GCR Economic Development Plan (EDP) (2015- 2020) intends to drive economic growth through
strategic targeting of priority sectors. Based on the current economic structure of Gauteng Province, the
GCR EDP is biased towards the service sectors, especially community services, finance and transport.
These sectors tend to employ less people than those such as manufacturing, transport and construction
(although these more productive sectors are experiencing a decline as a process of de-industrialisation
unfolds in the province). The GCR EDP purports that the manufacturing sector should be at the centre
of economic growth and development, and there is a need to invest skills in various sub-sectors of the
economy whilst simultaneously addressing the high barriers of entry characterised by many of these
industries – in particular those with high growth potential such as agro-processing and steel. Such an
approach would have high multiplier effects in terms of inclusion. The township economy could
potentially benefit from investments in the following sectors:
• Food and beverages
• Furniture and timber
• Clothing footwear textile and leather
• Pharmaceuticals, plastics and chemicals
• Machinery and equipment
• Construction, building material and real estate
• Automotive and components
• Mining and mineral beneficiation
• Finance and retail
• ICT
• Tourism and creative industry.
7.4. Ekurhuleni Programmes
7.4.1. Ekurhuleni Growth and Development Strategy 2025
The Growth and Development Strategy (GDS) 2025 of the City forms the basis of medium and short-
term planning, and guides the policy budget as the Cityo seeks to implement its mandate, to make
Ekurhuleni ‘a better place in which to live, work and play’. The GDS 2025 sets out the City’s overall vision,
noting the need to integrate townships into the mainstream by means of various programmes including
65
the promotion of local job opportunities by linking local labour to labour centres, the upgrading or
formalisation of informal settlements including the eradication of basic services backlog.
The GDS recognises Thembisa as one of the four major concentrations of historically disadvantaged
communities. The GDS further states that that all these communities are situated on the outskirts of the
main urban area and are in the areas furthest removed from where the bulk of job opportunities are
situated.
7.4.2. Ekurhuleni Ten (10) Point Economic Plan
The CoE launched the Ten (10) Point Economic Plan in 2018 to provide strategic prioritisation to
accelerate the development of industry and manufacturing. The plan aims promote economic
development in accordance with the principles of environmentally sustainable approaches, expanding
value chains and nurturing the place of small enterprises within these chains, and improving the labour-
absorption capacity of industry through targeted skills development. The plan focuses on 10 priority
areas:
• Revitalization of the manufacturing sector,
• Acceleration of Industrial Development Zones / Special Economic Zones programme,
• SMME support through public procurement,
• An enabling public transport system,
• Promoting localisation and production,
• Implementing the aerotropolis master-plan,
• Unlocking land for strategic development, including unused erven in the townships,
• Implementing the Township Economic Strategy,
• Undertaking infrastructure investment,
• Skill, capacity development and institutional stabilisation.
The 10 Point Plan builds-upon the GDS and IDP. It supports the densification of real estate development
along transport corridors and around economic nodes, which in turn, will enhance employment
opportunities for residents via improved public transport and locally availability opportunities for
SMMEs.
66
7.4.3. Integrated Development Plan (IDP) 2018/19
The Ekurhuleni IDP is mainly focused on the overall socio-economic development challenges facing
Ekurhuleni with elements of the plan having an indirect bearing on township economic development
The IDP reports:
“Township economy revitalisation refers to the support of all township trading activities
undertaken by community-based enterprises aimed at meeting the needs of the township
residents. Business activities in the Ekurhuleni townships are robust, diverse and range from
retail, industrial activity to construction. The City has successfully implemented innovative
programmes to create economic renewal in the townships. These initiatives include business
incubation and industrial skills programme targeting entrepreneurs in the townships. In this
regard, 262 enterprises participated in the business incubation programme and 2137 youth
benefited from the industrial skills programme in 2016/2017.”
Infrastructure development in townships is also flagged within the flagship project on Urban Renewal.
7.4.4. Economic Development Department
The mandate of the Community Enterprise and Economic Development Department is to lead, facilitate
and promote economic transformation, inclusive growth and socio-economic development within the
metro. The sub-directorate contributes towards this goal through the implementation of the Ekurhuleni
Community Enterprise Fund (ECEF). Thehe R300 million ECEF is intended to support the development
of community enterprises in the form of individual entrepreneurs, small, micro and medium enterprises,
cooperatives, informal traders and formal business. The Enterprise Fund provides financial (R50,000 to
R1.5 million) and non- financial (business plan, post investment support) assistance to promote
township economy development, industrialisation and human development..
7.4.5. Business Development Services in Thembisa
• SEDA
The Seda branch in Ekurhuleni closed in 2016/2017. It re-opened on a much smaller scale in
late 2018 and business advisors were appointed in January & February 2020 to increase capacity
and a wider reach. These capacity constraints resulted in limited services in many of the
townships in Ekurhuleni including Thembisa. Just five businesses received support from SEDS
in the last 11 months.
67
• GPG Programmes
As part of their procurement spend on township economies, GPG spent a total of just under R3
million in Thembisa on 33 contracts in Quarter 4 of 2019. Most of the expenditure on
educational services was for school nutrition programmes.
The Thembisa eKasiLab is based at the Thembisa Business Park, and is an initiative of the
Innovation Hub, under the umbrella of thee Gauteng Enterprise Development Propellor. The
eKasiLab offers a year’s incubation to youth entrepreneurs at the ideation stage of their
business, prioritising SMMEs in ICT, agro-processing, and bio-economy sectors.
• Metro Business Hubs
The Community Enterprise Department has established a series of township enterprise hubs to
support small businesses. Support is varied and can include providing space, incubation
facilities, shared industry production facilities, light manufacturing workshops, business
networks platforms and mentorship or handholding sessions. The City established the 36-unit
Thembisa Business Park in Mncatsa Section. A Chemical Incubation Hub is to be established
to support manufacturing SMMEs producing chemical detergents, cosmetics, hair care products
and perfumes.
• Youth Employment Service (YES)
The Youth Employment Service (YES) is a national initiative that aims to enable companies and
communities to create one million opportunities over time. Yes4Youth entails a partnerships
with government, civil society and labour to tackle South Africa’s youth unemployment.
The first of 100 planned Community Hubs was opened in June 2018 in Thembisa to absorb
unemployed youth, ignite local economies and promote local markets. This hub assists small
businesses to absorb youth labour. The Yes4Youth programme provides training that positions
young township residents to the modern-day economy and for work in small business. The
Yes4Youth Community Hub provides much needed business infrastructure in rural and
townships as well as seed new nodes of economic activity and growth in disadvantaged
Communities.
• Township Entrepreneur Alliance (TEA)
The Township Entrepreneur Alliance (TEA) began in Thembisa and brings workshops into
Thembisa that focus on business development and mentorship sessions.
68
8. Enterprise activity
8.1. The Micro-Enterprise Ecosystem
8.1.1. Approach
The ecosystem surveys were conducted in Thembisa in late October 2020. The aim of the ecosystem
survey was to record evidence of: i) business activities, ii) institutional facilities and iii) business hotspots
and spatial opportunities. It is important to note that the ecosystem survey is designed to provide a
snapshot of business activities. A full census would require extensive field research, which is not possible
within the scope and aims of the TED project.
The research team surveyed 517 businesses (micro-enterprises, SMEs and corporates), recorded 27
business hotspots and 30 institutional services.
The image below provides an overview of economic activity in Thembisa. Points in green are businesses,
points in yellow are institutional services, and points in white are the business hotspots on which the
research focused.
69
Map 3: Businesses, Business Hotspots and Institutions in Thembisa
70
Of the 517 businesses identified in the survey process, 4% (23) were Corporates, 9% (47) were SMEs,
and 86% (447) micro-enterprises. All corporates and 94% (44) of SMEs were formal whilst 86% (385) of
micro-enterprises were reported as informal businesses.
Figure 5: Overview of business size and legal status
8.1.2. Scale and Categorisation
Micro-enterprises make up 86% of businesses identified. Of the 447 micro-enterprises, 83% (369) of
businesses were open and full interviews were recorded. The range of categories is shown in the figure
below. Thembisa site has various clusters of trading sites, comparatively a large number of street traders
and diverse economic activities. The most numerous business activity in the site was that of (second-
hand) clothes retailing (44 / 10%) – mostly conducted as a street trading activity. Food businesses were
also commonplace, including retailing of fruit and vegetables (44 / 10%), cooked food (40 / 9%) and
snacks & cigarettes (39 / 9%). In terms of service-related businesses hair salon micro-enterprises (35 /
8%) were again commonplace. One prominent business venture that was quite widely spread
throughout Thembisa was that of appliance repairs. These businesses operated from a variety of outlets
– from street trading to private homes to dedicated shopfront premises (including shipping containers)
and specialised in television, kitchen appliance and cell phone repairs.
2344 62
3
385
0
50
100
150
200
250
300
350
400
450
corporate sme Micro-enterprise
Bu
sin
ess
lega
l sta
tus
Business size vs legal status
Formal (n=129) Informal (n=388)
71
Figure 7: Micro-enterprise businesses by enterprise classification
29
14 3 1
916
10
2 2
4440
4 2 2 2 1 17
44
3035
3
13
4 62
94
34
104 2
5
39
39 7
1 2 105
101520253035404550
No
. bu
sin
esse
s
Business types
Enterprise classification: Micro-enterprises
Figure 6: Street trade predominates in much of Thembisa
72
Figure 8: Building and renovation of houses is an important local economic activity
73
Map 4: Micro-Enterprises by Classification
74
Map 5: Survey and Open Source Data on Micro-Enterprise Classification
75
Figure 9: Nationality of respondents
Opportunity: There are many informal microenterprises operating in Thembisa that should be
included in regulated sectors (eg shebeens, ECDs, undertakers). Bringing them into the regulatory
realm would support formalisation and compliance and enhance their access to state subsidies
and industry programmes.
Demographics
The role of foreign nationals in the Thembisa local economy is considerable. Of the 369 micro-
enterprises interviewed, fewer than half or 41% (152) are run by South Africans. Of the 58% of non-
South Africans running businesses in the site, the majority are immigrants from Mozambique (27% of
total sample) and Zimbabwe (14% of total sample) – many of whom were street traders.
The informal businesses in the site are also a reasonable provider of work opportunities. Whilst some
65% of the respondents interviewed were the business owners or partners (245), the remaining 34%
(124 people) reported as employees.
152
1 1
20
3 1 3 6 1
101
9 112 1 2 3
50
20
20
40
60
80
100
120
140
160
Nu
mb
er o
f re
spo
nd
ents
Respondent's nationality
Respondents by Nationality
76
Figure 10: Respondent business roles and nationality
The local informal economy is predominated by men, who comprise 64% (237) of the respondents.
Across the sample, business operators were most commonly in the age group of 30-40 years. Some
44% (105) of male informants were in their 30s, whilst more than half of all women (132) were in their
30s (45) and 40s (32). This trend for females may also reflect their balance of economic objectives with
child-care commitments whereby many women tend to work from, or in close proximity to home in
businesses such as informal foodservice or street trading.
Figure 11: Respondent age and gender
55
105
47
188 4
24
45
32
21
7 3
0
20
40
60
80
100
120
20s or younger 30s 40s 50s 60s 70s
Respondent's Age and Gender
Male (n = 237) Female (n =132)
41
109
2
83
128
42
0
20
40
60
80
100
120
140
Employee Owner Partner
Nu
mb
er o
f re
spo
nd
ents
Comparison of business roles and nationality
South African (n=152) Non-South African (n=215) Unknown (n=2)
77
Map 6: Micro-Enterprise Respondent Gender
78
Business dynamics
The majority of micro-enterprises operated from informal or unregistered trading spaces. These
included 60% (222) businesses operating from a trading stand or table in the street or on vacant ground,
20% (73) from a private residential house, and 7% (27) from a repurposed shipping container. Street
trading is a particularly prominent modality for operating in Thembisa and represents an important
economic livelihood for its business operators.
Figure 12: Business infrastructure
27
7
222
6
73
23
11
0 50 100 150 200 250
Container
Shack/shed
Street trading table/stand
Mobile
Private house
Business premises
Other
Number of businesses
Infr
astr
uct
ure
typ
e
Structure and position for trading
79
Map 7: Micro-Enterprise Structure Classification
80
Rent
The majority of micro-enterprises operating in Thembisa reported not paying rent. As most enterprises
operated as street traders many have clearly taken advantage of the lack of municipal governance in
the site in order to set up business. Very few business operators claimed to own the property from which
they operated – only 14 individuals were owners. Collectively 31% of respondents reported the
businesses paid rent for the premises on which they operated. A quarter (36) of South Africans paid rent
whilst a third (77) of non-South Africans paid rent. Where rents were paid the monthly rental amounts
varied, ranging from R50 (access to a street pavement adjacent to a private dwelling) to R8,000 (for a
dedicated building structure on the high street). Most common monthly rental amounts were between
R1,000 and R2,500 with 15 paying R1,500, 12 paying R2,000, and five paying R2,500.
Figure 13: Occupation model and rent paid in ZAR
113
1421
221
Rented or owned premises
Rent Own Don't know NA
1315
26 2522
12
0
5
10
15
20
25
30
≦ R500 ≦ R1000 ≦ R1500 ≦ R2500 ≧R8000 Unknown
Nu
mb
er o
f b
usi
nes
ses
Rent paid
Monthly rent paid (in ZAR)
81
Map 8: Micro-Enterprise Site Rental
82
Access to utilities
Whilst a quarter of businesses had formal access to water and electricity (24% and 25%, respectively),
on average 36% (131) had informal access (commonly accessed on a commercial basis from adjacent
private dwellings), and 40% (147) had no access to these services at all. Those with no water (36% of
total sample) or electricity access (44%) were predominantly operating their business from a trading
stand or table (107 and 138, respectively).
Figure 14: Available utilities
150
87
132
113
93
163
0
20
40
60
80
100
120
140
160
180
Informal Formal None
Access to Utilities: Water and Electricity
Water Electricity
83
Map 9: Micro-Enterprise Water Access
84
Map 10: Micro-Enterprises Electricity Access
85
Opportunity: There is a need for basic services and utilities to service businesses in Thembisa. Service
delivery for these aspects should include consideration of strategies to gain important revenues
from beneficiaries of Metro services.
Time in business
The average age of local businesses is relatively short in Thembisa. Many micro-enterprises have been
established in the past few years. Of the 39% (147) who have been operating between one and four
years, certain periods stand out: 24% (36) have been operating for one year; 31% (46) for two years; and
28% (41) for three years. For the 170 businesses operating for five years or more, 13% (22) have been
operating for five years and 16% (27) for ten years.
Figure 15: Time in business
Overall, 74% (272) of businesses have been operating for less than ten years. This pattern of young
businesses emerging correlates with the relatively young age profile of the business owners as 25% (67)
report being in their 20s or younger, and 46% (125) are in their 30s.
52
147
73
68
23
6
0 20 40 60 80 100 120 140 160
less than 1 year
1 - 4 years
5 - 9 years
10 - 19 years
20+ years
Don't know
Number of traders
Tim
e in
yea
rs
Time in business
86
Figure 16: Comparison of respondent age and time in business
8.1.3. Operating challenges
Although micro-enterprises face numerous challenges in running a business in Thembisa, many
respondents (116) noted they face no challenges. For those that did speak of constraints, the most
common is crime (74) followed by trading location (55), lack of storage for goods [especially for street
traders] (52), and competition (45). Interestingly, 26 respondents noted that weather conditions (rain
and heat) as a key challenge in trading.
18 20
10
4
40
67
28
13
3 1
9
38
17
47
2319
14
411
58
4 5
0
10
20
30
40
50
60
70
80
20s or younger 30s 40s 50s 60s 70s
Nu
mb
er o
f re
spo
nd
ents
Comparison of age and time in business
less than 1 year 1 - 4 years 5 - 9 years 10 - 19 years 20+ years
87
Figure 17: Main operating challenges
Some respondents commented that their challenges were interlinked with weather, crime, by-laws and
competition:
• Weather: For township business in general, and street traders in particular where informal
shelter provides limited or no protection from the elements, the weather is an important factor
in conducting business. One respondent highlighted: “When it rains the business loses customers
dues to lack of infrastructure (shelter) because they have to close to protect their products”. The
importance of having access to a suitable site is significant as traders thrive when “looking for
shelter because when is hot and raining I can't run my business.”
• Crime: ‘Nyaope Boys’ (purportedly drug addicts) stealing goods and the issue of crime in
general was an important concern, as is illustrated by the following respondent quotes: “There
are also more criminals at the place and find it very hard to work until late because of the
darkness.” And “Too much robbery around this place and money fraud”.
• Competition: Localised challenges of overtrading where many businesses sell the same goods
in close proximity to one another. The nature of competition extends from other informal
traders but also formal sector businesses extant in shopping malls and on high streets. Some
noted: “The place has many businesses selling cooked food because the business is next to a
shopping complex. It then makes one not to have many customers and without having customers
she will have to throw her food if it is spoiled” and “The competition is one of the challenges she's
facing and after all the competition sometimes they end up fighting a physical fight.”
74
36
45
16
55
52
11
26
21
9
7
19
116
0 20 40 60 80 100 120 140
Crime
Infrastructure
Competition
Registration / Licensing
Location
Storage
Access to suppliers
Weather
No Customers
Difficult customers
No electricity
Other
No challenge
Number of businesses
Ch
alle
nge
sChallenges faced by business
88
• State harassment: The police and / or municipality chasing local businesses (especially street
traders) away for non-compliance with land use and trading regulations. As reported by the
businesses: “The location is the problem because the metro police always chasing them away”
and “The major problem here is the trading space as the space belong to the municipality. During
the lockdown the metro police used to come in to confiscate stocks as the business is not licensed
to trade here.”
• Finance is also an important microenterprise consideration: Interestingly very few participants
reported lack of financing as a business challenge although financial stresses are clearly
significant for some, with notable comments from field researchers including: “The business
started late last year in December. The employee stressed about not having a generator to fill in
the tyres with air. So, he said he would love if he can assistance with funds to get the generator.
However, he did mention that there is one man who do donate old tyres to them and they sell
those tyres as second hand tyres to their clients” and “Needs financial services support to expand
her products in terms of packaging and branding her products the way she would like her products
to be branded. Her products are really for the yuppie market with flavours such as hibiscus jam
and wild melon chutney.”
• The great majority (92% / 339) of these businesses reported not receiving any support to
operate but said that if they had a choice in what would benefit them, 12% (42) reported
financing and 8% (28) reported the need for enhanced trading spaces and adequate shelter. A
further 8% (29) enterprises claimed that they required no external support to bolster their
business activities.
Figure 18: Support deemed beneficial by respondents
42
3
28
1
11
29
5
0 5 10 15 20 25 30 35 40 45
Financing
Infrastructure
Space
Registration
Owner not here
Nothing
Don't know
Support deemed beneficial
89
8.2. SMEs and Corporates
8.2.1. Corporates
Most corporate businesses operate within shopping malls. Of the 23 corporates we surveyed, clothes
and grocery retail were the most prominent. The big brands operating in Thembisa are dominated by
essential services (food, fuel, and clothes) and include BP service stations, Pick n Pay Express, Chicken
Licken, Roman’s Pizza, Debonairs and Pep.
Figure 19 Corporate businesses by enterprise classification
8.2.2. SMEs
A considerable variety of SMEs were identified in the survey, 23% (11) of them were health services,
followed by 14% (9) liquor sales. A variety of other SMEs were found spread throughout the site,
including funeral services, bakeries, car repairs, legal services – all of which require specialised skills and
/ or equipment to operate.
3
5
3
1
2
1
4
1 1
2
0
1
2
3
4
5
6
Enterprise classification: Corporates
90
Figure 20 SME businesses by enterprise classification
3 32
1 1 1 1
5
21 1
11
2
6
1
3
1 1 1
0
2
4
6
8
10
12
Enterprise classification: SMEs
91
Map 11: Corporates and SMEs
92
Map 12: Corporates and SMEs Open-Source Data
93
8.3. Business Hotspots
There were 27 potential business hotspots identified and surveyed during the fieldwork process in
Thembisa. These sites comprised intensive business activity and clusters of micro-enterprises.
8.3.1. Available Services
Overall, access to utilities and services found in the surveyed business hotspots was uneven. Of the 26
hotspot sites where business activity was undertaken, 81% (21) had no access to WiFi, and 62% (16) had
no access to waste disposal. Interestingly where WiFi access was present, none of the intended recipients
could access it. Other basic services, whilst far from universally supplied, were better accessed with 42%
(11) of hotspot operators having access to both water and electricity.
Figure 21: Access to services
7
11
8
6
11
910
16
5
21
0
5
10
15
20
25
Yes Some No
Hotspot: Business access to services
Water Electricity Waste disposal Wifi
94
Map 13: Business Hotspots
95
8.3.2. Hotspot Place categories
The types of hotspot places varied, made up of 27% retail nodes, 19% market places and 15% high
street sites. Retail nodes represented the hotspots with highest levels of uptake and the strongest
organic emergence. These are noticeably sites that occupied by traders directly adjacent to formal
business nodes including supermarkets or shopping malls.
Figure 22: Hotspot place categories
Business hotspots in Thembisa have proven themselves to be incubators and organic attractors of
micro-enterprises. The survey revealed that some 435 businesses operated from these hotspots with
174 from market-places, including the Leralla Traders Market, 88 in retail nodes, and 51 on high streets.
Business owners in Thembisa commonly spoke favourably about the nature of such sites:
“This is a very interesting spot where a lot of car wash businesses are operating in a hub. There is a food
outlet doing well.”
“A strategic place at the intersection of roads, there is an open space on the opposite side which can also
be used for further development, this place has an ATM and functional toilets.”
3
4
5
7
1
2 2 2
0
1
2
3
4
5
6
7
8
Business hive High street Market place Retail node Taxi rank Pavement Open ground Train station
Hotspot: Place category
96
Figure 23: Number of businesses per site type
Opportunity: The high concentration of businesses within marketplaces and retail nodes presents
an important opportunity for marketing these ‘hubs’ and the businesses within them. The Metro
could, via partnerships work to provide street signage and advertising boards for this purpose.
8.3.3. Barriers to operating
Of the 26 active hotspot sites, 69% (18) had formal site infrastructure, 94% (17) of which was considered
by the occupants as functional. However, half (13) of respondents were unsure of whom the site
managers were. Within open trading spaces, 58% (15) of respondents reported there was no additional
space available to accommodate other businesses in these sites. The fieldworkers observed that there
was space within 81% of sites for other / new micro-enterprises to operate / occupy. Fear of crime
appeared to be the largest disincentive for new businesses to occupy the available spaces, with 46% of
total hotspot businesses said that crime was the main barrier to undertaking business in these settings.
24
51
174
88
39
19 1525
0
20
40
60
80
100
120
140
160
180
200
Business hive High street Market place Retail node Taxi rank Pavement Open ground Train station
Number of businesses operating in these sites
97
Figure 24: Operating barriers
Examples of issues considered ‘other’ in the graph above all pertained to municipal service delivery and
included no water access (38%/10), inadequate shelter (35%/9), a lack of paving (27%/7), a lack of proper
lighting (19%/5) and no refuse removal (19%/5). Some insightful comments on municipal service
delivery included;
• “The mama would like to be supported in terms of shelter and would like the municipality to stop
harassing them and constantly moving them around.”
• “Most of the businesses are formal and are service businesses. The informal ones have no structure
and do not have access to water or electricity.”
• “There's no infrastructure built for the traders. It's an informal trading space but no access to water
or electricity or any ablutions facilities. No proper seating, dusty and dirty space, no waste
management. no proper parking spaces or shade for both humans and vehicles.”
8.4. Institutional services
The research identified 30 institutional services, 50% (15) of which are financial services. Of the available
financial services, 80% (12) are ATMS and 7% (1) was a micro-finance organisation. The micro-finance
organisation was Mukhuru, a money transfer business. Those institutional services recorded as ‘Other’
were a health service, private consultant and an art centre. Apart from financial services, most of the
institutional services were open during the fieldwork process. These services were predominantly
operated by the CoE (10).
12
1
7
8
0 2 4 6 8 10 12 14
Crime
Police harrassment
Not applicable
Other
Hotspot: Barriers to conducting business
98
Figure 25: Institutional services
All major banks were represented in the research site, with ATM machines of the respective banks
including:
Table 2: ATMs in Thembisa
ATMs Number
Absa 3
Capitec 3
First National Bank 2
Nedbank 4
Standard Bank 3
Cash express 1
5
2
15
3
3
3
2
0 2 4 6 8 10 12 14 16
Service centre
Library
Financial services
Training facility
Other
Business support service
Business incubator
Available institutional services
99
Map 14: Institutional Environment
100
8.5. Township-Wide Ecosystem
Tembisa is strategically well placed to serve much of the CoE industrial hubs and aerotropolis economy.
Street trading is a common micro-enterprise activity. Linking the uptake of such sites by street traders
and 4IR technologies such as cellphone issued permits provides important scope for innovation in
support of this important sector.
Figure 26: Linking township micro-enterprises to larger markets through the use of 4IR technology and cost-effective
transport has potential to enhance business practice and market access
101
Land that is owned by the CoE should be increasingly made available for business purposes, to create
further hotspots. or business hubs as recommended in the 10 Point Plan. Some of the businesses that
require access to land include micro-manufacturing, car repairs / panel beating, making of furniture and
welding.
Opportunity: Building on the 10 point plan, various localities (such as the Thembisa civic hub, train
station nodes, high streets) could be further activated for business activities through local
strategic area and management plans and investment in revitalisation of the local environment in
ways suited to an enhanced business environment.
Figure 27: Linking township micro-enterprises to larger markets through the use of 4IR technology and cost-effective
transport has potential to enhance business practice and market access
102
9. Important Sectors
9.1. Fourth Industrial Revolution - 4IR
4IR projects such as Kandua which links technical specialists with customers, and digital platforms such
as Khula which market produce grown in an urban agriculture context have important potential for
application in Thembisa and should be further explored and encouraged. An important initiative that
could be driven by the Metro is enhancing access to digital services in general, and links to 4IR driven
businesses / platforms in particular.
Opportunity: Improving enterprise access to digital economy. This should include links to SEDA
and Gauteng Provincial Government who actively promote digital hubs, Wi-Fi access for
increasing 4IR access for SMMEs in the township economy. Such a programme could also support
enhanced participation in the digital formal financial sector.
9.2. Automotive Sector
The township automotive sector – especially subsectors of mechanics, tyre fitment and car detailing /
washing are important contributors to economic opportunities and job creation. It is therefore
important to promote investment activities and private sector BDS to support these SMME
opportunities.
This section of the report will be confined to opportunities that are currently accessible in the
aftermarket which includes post-sales maintenance, repairs, refitment, spares, disposal of vehicles and
recycling.
9.2.1. Stakeholders within the township automotive industry
The main stakeholders within the township automotive industry can be categorised into four main areas:
i) micro-enterprises and the associations that represent them; government and SOE; private sector
103
Original Equipment Manufacturers (OEMs) with B-BBEE targets; and customers (motorists including
those who own taxis and buses).
Micro-enterprises and the Associations
The micro-enterprise surveys revealed that the majority of automotive entrepreneurs operate in the
‘aftermarket’ offering repairs for vehicles that are out of warranty. These commonly include mechanics,
panel beaters, spray painters, tyre fitters / wheel specialists, welders and upholsterers.
The business activity is relatively commonplace and has, in some cases attracted important external
investment. For example, within the study sites some tyre fitting micro-enterprises have created links to
tyre manufacturers such as Dunlop and Tiger Wheel and Tyre and have secured professional and
branded premises. The majority however are unlinked to formal sector business and work from home
or premises along prominent township roads or near taxi ranks.
With respect to land use, most of these micro-enterprises (particularly home-based, and street-based
entities) operate in areas either outside of the regulatory frameworks, or illegally. Most work with basic
equipment and poor infrastructure, limited waste disposal, no access to ablution facilities, and poor, if
any shelter (which brings about susceptibility to changing weather). There is also a lack of storage and
the general hazard posed by them working without the necessary accreditations. Often businesses are
positioned close to their customers (near taxi ranks and busy areas where they are visible and
accessible). It is to be noted that city and state land that is available for developing hubs and providing
the much-needed infrastructure is not necessarily close to where the greatest business opportunities
lie.
A persistent challenge for township automotive micro-enterprises is access to markets. Financial and
non-financial support is important in ensuring that the enterprises are well operated and governed but,
without access to markets the enterprise have little chance of success. Market access in the township
economy is hindered through the geographic and economic isolation of the township economy away
from mainstream sectors, and also the limited market within the township economy for cars.
Furthermore, it is uncommon for reasons such as crime and logistics for vehicle owners residing outside
of the township to bring their vehicles into these locations. Finally, there are customer perception on
the quality of the service. (See opportunity listed below).
104
Several associations represent the entrepreneurs and their needs. The Retail Motor Industry (RMI)
represents retail and associated motor industry within South Africa’s automotive aftermarket. There are
eight associations represented by RMI with over 8,000 members. The RMI is the major employer
representative of the Motor Industry Bargaining Council. It is not clear at this stage how many township
entrepreneurs are represented by RMI. An important sectoral newcomer is the African Panelbeaters and
Motor Mechanics Association (APMMA), through its chairperson Sisa Mbangxa, has been heavily
involved and instrumental in the shaping of the Draft Guidelines for Competition in the Automotive
Aftermarket Industry (by the Competition Commission). APMMA’s members are largely within the
township.
State Entities
The Automotive Industry Development Centre (AIDC) and the Seda Automotive Technology Centre
(SATeC) aim to support the automotive industry, especially SMMEs. The AIDC operates the Winterveldt
Enterprise Hub and Automotive Hubs (City of Tshwane) in partnership with OEMs, providing training,
business development and financial support. SATec focuses mainly on micro-businesses in the
townships and provides general business support in the form of business training, formalising of
businesses and accreditations.
G-Fleet Management, is a Trading Entity of the Gauteng Department of Roads and Transport, that
provides vehicle leasing and fleet management services for the public sector. Their services include
short-term rentals, replacement, total fleet management services-finance, maintenance, repairs, tyres,
accident damage and other motor-related services to all government departments. The entity operates
a fleet of over 7000 vehicles. G-Fleet presents an opportunity to provide access to markets for micro
enterprises, particularly in the fleet maintenance as it relates to the aftermarket. At this stage it is unclear
whether G-Fleet has any initiatives that promote micro enterprises. G-Fleet does not have any visible
agreements with SMMEs.
Opportunity: There is scope for the after-market automotive sector in Thembisa to benefit from
City-facilitated partnerships with various stakeholders such as Provincial Government, DSBD to
provide equipment / skills training / supply agreements / finance.
105
9.2.2. Ekurhuleni Incubators
The Ekurhuleni has developed and designed the Automotive City Projects, essentially incubators for
SMMEs within the automotive sector. There are three automotive hubs and the fourth is a manufacturing
hub. The City plans to locate an automotive hub in Thembisa; a manufacturing and automotive (service)
hub in Katlehong and an automotive hub in Labore (Geluksdal). All four hubs are still in construction
phase and are anticipated to be operational in the latter part of 2021. The programme is not linked to
industry. . The development of these incubators should be coupled with the DSBD district information
management system and its associated enterprise development support services.
Opportunity: Linking Ekurhuleni incubators to business development support services – DBSD,
SEDA and SEFA which would bolster sustainability of these incubators and further support Thembisa
businesses. Furthermore, there is scope to link these incubators to markets through an annual trade
and marketing event that would link these local businesses to economic opportunities.
9.3. Transport nodes
Thembisa has a large and vibrant local public transport economy, yet unlike many other transport nodes
it generally underperforms as an incubator for business. An important opportunity lies in promoting
business alongside transport hubs / nodes that serve commuters and intra-township travellers. The
Esangweni Taxi Rank represents an important opportunity for a Public Private Partnership that would
reimagine this important transport node into an increasingly functional business node.
Opportunity: In a partnership with Gauteng Provincial Government and local taxi associations,
reimagine the Esangweni Taxi Rank as a node suited to development of business activities to
serve local commuters
106
Figure 28: Building on the taxi/public transport economy
107
9.4. Building Trade
The formal status of local houses presents a valuable opportunity for homeowners to reinvest in their
houses – such as upgrading gates, fences, doors and windows. Further, Thembisa has a growing number
of residential dwellings being built for the rental market, many of which are in the back yards of formal
dwellings. An opportunity lies in this context to facilitate the formalisation of these developments,
through addressing land-use and property-use constraints (such as zoning and by-laws). Aside from
supporting the local building trade, these activities could bolster demands for a local micro-
manufacturing economy.
Opportunity: The metro to develop policy that will enable home-owners to invest in backyard and
rental accommodation. Such a policy would encourage legitimisation of dwellings, which would, in
turn stimulate the local economy of house builders and renovators.
9.5. Financial Inclusion
SMMEs in Thembisa revealed challenges of being unable to access formal sector financial services
products such as business capital and insurance.
Most businesses are entirely reliant on cash transactions which brings about added security and
operational risks. Enhancing access to formal sector services can bolster business stability and insulate
them from economic shocks. Any programme that can enhance access to these products will be of
benefit for the local township economy.
Opportunity: There is important scope to use existing BDS services to link to provincial government
and (for example) the Finmark Trust for accessing financial literacy training and increased access
to formal sector financial services.
9.6. Creative economy
The Thembisa creative economy has potential to be more effectively linked to both government-
initiated arts and creatives funding, but also the tourism sector. The GEP, and the Metro have
programmes to support SMMEs and microenterprises through workshops, networking, registration and
108
directing them to financing. Fostering these links would be an effective tool for supporting local SMMEs.
The DSBD TREP programme specifically supports clothing, textile and leather enterprises that are
located in townships and villages in terms of business support as well as access to funding, whilst SEDA
focuses on skills development in the jewellery sector through the Ekurhuleni Jewellery Project incubator.
Opportunity: Support to Thembisa creative economy through existing BDS services and
mechanisms of enterprise formalisation in order for creatives of various sectors to gain enhanced
access to formal sector funding opportunities, such as that from the National Arts Council or the
National Lottery Commission Trust.
109
10. Land use
10.1. Land Administrative Policies
The TAT reviewed the following planning documents to gain an understanding of the statutory and
policy environment for Thembisa:
Municipal Spatial Development Framework
The Municipal Spatial Development Framework (MSDF) is a long-term spatial planning tool, which
provides metro-wide planning guidance for the spatial growth of the CoE. This tool is required in terms
of the Spatial Planning and Land Use Planning Act, 2013 (SPLUMA) and forms part of the Integrated
Development Planning (IDP) process, to the extent that it assists with providing a spatial context for
investments. In terms of the legal requirements, it is subject to review every five years.
Regional Municipal Spatial Development Framework
The Regional SDF (RSDF) provides detailed planning directives that align with the MSDF for each region
in the City. This planning tool identifies issues and directives for specific areas within each district and
provides a shorter-term directive than the MSDF.
Built Environment Performance Plan
The Built Environment Performance Plan (BEPP) is intended as mechanism to align the IDP and budget
with spatial priorities each year, to promote the effective functioning of the metropolitan built
environment, in line with the guidelines set out by National Treasury.
Municipal Planning By-Law and Town Planning Scheme
The Municipal Planning By-Law provides the legal framework that spatial policies such as the SDF play
out in at the metropolitan level. The Development Management Scheme provides the detailed zoning
110
guidelines and permissions. A wall-to-wall zoning scheme for each municipality is required in terms of
the SPLUMA, 2013.
10.2. Development Plans
The TED Situational Analysis incorporates City land use and spatial development plans as well as new
sources of information / data, including the micro-enterprises surveys. This information can enhance
future development planning process.
Opportunity: TED evidence utilised in area-base strategic plans.
10.2.1. Metropolitan Spatial Development Framework, 2015
According to the MSDF Thembisa Central is categorised as a developing node (MSDF, Section B, 2015:
55). Transport is a significant consideration in the Thembisa area – priority is given to the mobility route
between Kempton Park and Thembisa. This route is an important minibus taxi route and one of the focal
routes for the Bus Rapid Transit (BRT) System. The infrastructure for this bus system is mostly in place,
though the system is not yet operational. The Thembisa-Kempton Park mobility corridor is categorised
as Integration Zone 1. There is a lack of Non-Motorised Transport (NMT) Infrastructure in Thembisa,
which needs to be addressed (MSDF, 2015: 55). Infill development to promote greater residential density
around CBDs and transport infrastructure is encouraged. This is important for ensuring the sustainability
of the transport routes.
Economic development priorities indicated in the MSDF include prioritising retail development in
Thembisa. (MSDF, section C, 2015: 12). The Olifantsfontein and Clayville industrial areas to the North of
Thembisa are sites of heavy industrial activity and acknowledged in the plan as economically significant
areas (MSDF, Section B, 2015: 26).
The Thembisa-Kathorus Corridor is intended as a North-South development axis, which will help
stimulate integration in the City by means of higher density development paired with more intense
economic function. These objectives have been prioritised in this corridor in order to promote market-
driven development to the benefit of businesses and residents in this area (MSDF, Section C: 92).
111
10.2.2. Regional Spatial Development Framework, Region B, 2015
The RSDF identifies many of the issues and plans identified in the MSDF, 2015. It also details plans for
secondary nodal areas in Tembisa. The identified secondary nodes are: Winnie Mandela Node,
Thembisa Plaza (aligned to the Leralla station node indicated in this report), Swazi inn, and the Thembisa
station. The Thembisa CBD, situated at the Corner of Andrew Mapheto Street and George Nyanga Street
(civic node), is characterised as a hub. In these secondary nodes, the RSDF indicates a range of supported
land uses that include medium density residential; high density residential; retail; office; entertainment;
hospitality uses; service industry; taverns; and municipal and government facilities.
Opportunity: A precinct management and development plan for Swazi Inn approved.
10.2.3. Transit Oriented Development Nodes
Leralla station, Limindlela station and Thembisa station have been identified as Transit-Oriented
Development (TOD) Nodes. The general guidelines for land-use in these nodes is:
• Ensure transit supportive land uses,
• Increase density around transit stations,
• Create pedestrian-oriented design,
• Make each station a ‘place’,
• Manage parking, bus and vehicular traffic,
• Plan with the community.
For further analysis on these nodes, see chapter 11 below.
10.2.4. City of Ekurhuleni Built Environment Performance Plan, 2020 – 2021
The BEPP categorizes Thembisa as a ‘marginalised peripheral township’, which is a secondary node in
the CoE. The township is classified as being at moderate risk. The BEPP identifies dangerous electricity
connections and air pollution as possible sources of vulnerability (2020). Of relevance to the core site,
the BEPP identifies infill housing development at Isekelo.
112
10.3. Land Use Dynamics
The CoE promulgated a Municipal By-Law that is in keeping with the SPLUMA regulations in 2019.
However, the Town Planning Scheme precedes it and was set out in 2014, with revisions added in 2015.
Land use in Thembisa was previously administered in terms of the Thembisa Town Planning Scheme,
2000, with the scheme incorporated into the Town Planning Scheme, 2014 (rev 2015).
The land-use system in Thembisa follows a rather typical township arrangement of predominant
residential zoning with social/public zoning scattered throughout and limited large land parcels of
commercial uses. The commercial uses are clustered around one of the nodes, the Civic Precinct, but do
not noticeably feature in other more obvious situations: like transport interchanges, along high streets
or at train stations. The nodes are well located along the railway infrastructure, which currently is sub-
operational, but was historically important and supported adjacent commercial activities.. The poor
performance of the railway system will result in these nodes losing their economic advantages. Reliable,
consistent and responsive transport systems will arrange at market opportunities and these may not be
aligned with the designated zoning patterns, leading to increased tension between actual use and
prescribed use and further creating a situation of enforced informality.
As indicated in the map below, most of the area is zoned Single Residential 2. There are a significant
number of community facilities (including schools), along with social facilities, frequently found in close
vicinity to one another. There is little business zoning, some along Andrew Mapheto Drive and a few
areas zoned Open Space, which are in varying degrees of maintenance and use. The field research
identified many profitable SMEs, especially wholesalers and larger retailers, operating from sites zoned
for residential use. These enterprises ought to be operating from appropriate zoned sites with
correspondingly higher rates.
Opportunity: Revenue collection from rates improved.
Opportunity: Home based businesses formalised, enabling growth and reducing business
externalities.
113
Map 16: Zoning in Thembisa
114
The permitted uses indicated in the table below are subject to the definitions set out in the Ekurhuleni
Town Planning Scheme, 2014 (revised 2015).
Table 3: Uses Permitted under Land Use Zone Residential 2
Zoning
Category
Primary Rights:
Purposes for
which land
and/or buildings
may be used.
Special Consent of
Municipality Land Use
Application
Land and/or Buildings
which may be
erected and purposes
for which they
may be used only with
the Special
Consent of the
Municipality
Written Consent A
and B of the
Municipality
Land and/or
Buildings which may
be erected and
purposes for which
they may be used
only with the
Written
Consent of the
Municipality
Provisos: Ancillary
Uses applicable to
Columns 3 & 4
(see Clause 13.2)
Residential
2
Dwelling House
Private Roads
Places of Public Worship
Places of
Instruction
Social Halls
Child Care
Facilities
Taverns
Guest Houses
Home
Care Facilities
Catteries
Special Uses
Written Consent A
Spaza Shops
Home Enterprises
Day Care Facilities
Living
Accommodation for
Domestic Workers
limited to a maximum
size (incl. a kitchen
and bathroom) of
29m2 or 10% of the
Dwelling House,
whichever is the
greater (provided that
it is developed as a
single functional unit).
Written Consent B
Second Dwelling
Unit
Maximum of three
Boarding Rooms
Any development on an erf zoned Single Residential 2 is also subject to the following development
restrictions, along with any restrictions set out in the individual title deed, where applicable. These
restrictions impact on the scope for formalising backyard developments, especially in respect to multi-
story flats.
115
Table 4: Residential 2 Building Lines
Residential 2
Height Street Boundary Other Boundaries
Single Storey (Erf <500m2) 3m 1m on 2 sides
Single Storey (Erf > 500m2) 5m 2m on 2 sides
Double Storeys 5m 4m on all sides
Triple Storeys 5m 6m on all sides
Table 5: Residential 2 Height, Coverage and Density
Residential 2
Primary Rights May be increased with written consent C
Density Height in Storeys Coverage % Max height in
Storeys
Max Coverage %
One dwelling per
erf
2 0 –
300m2
60 % 3 0 –
300m2
70%
301 –
500m2
55% 301 –
500m2
60%
501 –
1000m2
50% 501 –
1000m2
55%
1001m2
above
50% 1001m2
above
50%
10.4. Precinct Plans
10.4.1. Tembisa Hub Plan, 2016
The Tembisa Hub Plan has been developed as part of National Treasury’s Neighbourhood Development
Partnership Programme. The plan was finalized in 2016. The intention for this area is to provide a mixed-
use environment that is better connected to the surrounding neighbourhoods. The plan also aims to
enhance the neighbourhood character with appropriate public-private thresholds, where the historical
116
and cultural setting for this area is reflected and celebrated, and pedestrians are the priority (2016: 14 –
15).
The hub is made up of seven sub-precincts, which are envisioned to change over time. The aims for the
short-term are as follows: the Tembisa and Limindlela Station Precincts support a mix of business and
medium to high density residential uses. The Civic Precinct is currently the site of several social facilities,
which the plan seeks to enhance, along with land use provisions for intensive business use. The interface
with George Nyanga Drive has been earmarked for low impact business use, supported by medium to
high impact residential opportunities. Detailed planning has been done for Makhulong Precinct, which
will be discussed in the section below. The remaining precincts are intended for more intensive
residential typologies (2016: 43).
10.4.2. Thembisa Makhulong Community Precinct, 2019
This precinct plan was developed in 2019. The precinct is on Andrew Mapheto Drive. It is centred around
the Makhulong Stadium, which has been upgraded in accordance with the Makhulong Stadium Master
Plan, 2011. The site currently accommodates the Makhulong Stadium, Zion Church of Christ, Moses
Molelekwa Arts and Computer Centre, YES4Youth and hydroponics hub, informal car repairs and an
informal soccer field. This site is surrounded by single residential dwellings. The design seeks to
formalize the soccer field and motor repairs, expand the YES4Youth Hub and provide more intensive
housing opportunities and public interface opportunities.
10.4.3. Leralla Node, Transit-Oriented Development Analysis and Strategy, 2016 (World
Bank Group)
The Leralla Node is located around the Leralla Train Station, which is adjacent to Andrew Maphero Drive
in the south-west of the Thembisa study area. This strategy sets up a framework for a mixed-income,
transit-oriented node. A significant proportion of the land around this train station is owned by PRASA
(16.6 Ha) and the City of Ekurhuleni (14 Ha). Tembisa Plaza, a well-established, actively used strip mall,
the Leralla Trader’s Market, the train station, the BRT station and taxi rank are all key features in this
busy node.
The primary uses considered for this node are residential and retail. This study found that there is a high
demand for housing in this area, but that the market’s ability to absorb new stock is limited. As such,
the study recommends that the CoE provide housing using the Financial Linked Individual Subsidy,
117
which would provide housing that is appropriately matched to a significant number of residents in the
area who qualify for this subsidy. The node includes old hostel stock, which could be upgraded with
assistance from the Community Residential Units (CRU) programme, which provides rental
accommodation for low-income households and is aimed at refurbishing old hostel stock and inner city
buildings. The proposal to increase the retail space in this site is based off the active role that Tembisa
Plaza plays in attracting activity into this node. It is proposed that improving the retail offering in this
node will play an important role in the intensity of this node.
118
11. Prioritised and high potential nodes
11.1. Overview
To inform any TED opportunities, we have produced a series of spatial maps upon which an analysis
could be undertaken. The maps are produced at two distinct scales (i) that of the study area – showing
the larger context of the township and the respective nodes under investigation and (ii) the nodal or
precinct area – showing a more detailed analysis of the land and infrastructure dynamics at a smaller
scale.
The maps intend to build a cohesive spatial overview. The data was largely obtained from the City,
including reports and plans. There is still data that is missing or pending. As a result, some maps have
been produced by manually through allocating data (such as land use or zoning) to the drawings from
relevant planning documents.
In order to effectively bring about impact within the township, it is critical that the geographic extents
be appropriately identified. These are often described in spatial terms as nodes – a concentration of a
variety or similarity of activity. Typically, these exist along a route or at the confluence of two or more
such routes. In defining a node, we aim to show the relative size, distribution and relationship of focus
areas with the larger study area. In conjunction with the identification of geographic extents, the urban
typologies are simultaneously identified in relation to these spaces. They may include streets, private
land parcels, industry, natural features, informal settlements that make up the physical elements of the
node. Each urban typology warrants a unique understanding and corresponding developmental
response. The size and proximity of these nodes assist in developing a strategy of how to optimize the
developmental impact, taking into consideration the spatial dynamics of these nodes as operating in
isolation or relative to each other.
The identification of nodes has been based upon the institutional knowledge and documentation.
Following our assessment of the nodes and field investigations, these nodes were either adopted,
reprioritized or removed within the projects scope and node identification. In addition to the identified
nodes, the TAT team proposed additional nodes where the data and technical evidence suggested. A
basis for the identification of new nodes included,
(i) the capacity to bring catalytic spatial and economic transformation.
119
(ii) ability to be realized within the time, budgetary and technical constraints of the project.
(iii) A response to emergent social and economic activity.
(iv) The capacity to integrate stubborn and difficult development challenges.
The prioritised nodes for Thembisa include:
(i) Tembisa Civic Hub
(ii) Makhulong Node
(iii) Limindlella Station Node
(iv) Thembisa Station Node
(v) Leralla Station Node
Opportunity: The development of nodes will foster important economic growth for Thembisa
through important strategic planning that can cater for, promote and regulate business activity.
This could include precinct management that could in turn foster partnerships such as the the NDPP
to advance projects and mobilise investment.
120
Map 17: Nodes in Thembisa
121
11.2. Infrastructure and Natural Systems
The nodes that have been identified are located on existing transport corridors, which reveal a
reasonable level of internodal synergy. The vulnerable railway system will have an impact on the
performance of these nodal systems. There is a realistic amount of formal and operational basic
infrastructure in these sites. There are encouraging signs of increased residential private densification,
especially around areas that have high amenity or connectivity. Land parcels adjacent to key transport
systems and economic hubs are not fully optimised and would benefit from an intensification and
diversification of real estate at these conditions.
The proximity of nodes to each other, their connectivity, and roles, allow for a few valuable opportunities
to invest in high street activation at a significant scale – especially as there is ample existing evidence
to support this trajectory.
Opportunity: Commercial high streets activated in strategic sites / roads.
122
Map 18: Land Ownership
123
11.3. Thembisa Civic Hub
The Thembisa Civic Hub has both commercial and civic functions. It exists off Andrew Maphetho Drive,
which is an important north-south mobility corridor. There are significant pockets of land within the
precinct that are currently empty. This vacant land is currently occupied for informal business uses.
According to the 2020 pre-feasibility plan, the empty land has been earmarked for substantial re-
development to reinforce the civic uses and introduce more mixed used amenity to the precinct,
including housing. The site is well-suited, geographically, spatially and functionally to be a highly
valuable part of the Thembisa township economy.
The scale, complexity and nature of the developments proposed in the pre-feasibility plan, while
valuable, might be prone to extensive delays and the risk of not being executed. There is no certainty
about when the infrastructure plan would be implemented or what part of it would be securely
implemented. This creates a circumstance where the complexity of the project becomes a risk to
activating the land in a timeous manner. The approach taken in these recommendations is to propose
two types of response:
• The first is Augmentative. This response accept that the development would be executed
within the next 24 months and augments it with complimentary interventions. The challenge
with this approach is the indeterminate nature of the development, which exposes the
responses to being non-operative.
• The second is Alternative. This response takes the view that the development would not be
implemented, and other developmental approaches and strategies can be proposed for this
site. This approach would be seen to be activating the land immediately (within 24 months).
This would still allow for large parts of the civic hub to realise itself over time but would ensure
that the land is immediately made effective through what we define as Rapid Enabling
Infrastructure (circulation, services, edges, business, social spaces). Social spaces would be
arranged in relation to where future buildings would be located and be built without major
disruption to the urban system.
The civic hub lacks a clear set of recommendations regarding the development for the larger area. The
design does not seem to take cognisance of transformative design, creating an inclusive economy,
providing a strategic spatial plan that considers the complex sequencing of the development and
operational function of various uses.
124
The following generic responses to the area would include:
1. High Street. Activating the Sheba High Street to enable broader economic inclusion and sense
of space. This would include a street rehabilitation to allow for better circulation, storage,
trading structures, amenity, shade and water points.
2. Connection (commercial high street) to Limindlella Station via Hadebe Street. This would further
connect the hub to the station and Andrew Mapheto Drive and consolidate street trading and
increased property values along the street.
3. Instituting a street trader plan and the provision of supportive trading infrastructure.
4. Public Art. It is also recommended that a public art and creative output program is integrated
into the process of place making. This would engage local creative practitioners to enhance the
precinct and lend a particular creative and brand identity. Outputs could include sculpture,
installations, mosaic, murals as well as ephemeral or soft programs like performance.
Figure 29: The retail anchor allows for significant economic activity to be generated through the adjacent streets -
allowing for more diverse participants. The street allows for parking, loading and pedestrian activity to occur - albeit
rather congested.
125
Opportunity: Thembisa civic hub transformed into a business and service hub.
Opportunity: A street trader plan implemented within the Thembisa civic node.
Opportunity: Facilities upgraded, and precinct management instituted in public spaces (including
parks).
Opportunity: Shopping malls foster and enable opportunities for micro-enterprises.
Opportunity: Public safety enhanced through the application of crime prevention through
environmental design and precinct management.
Figure 30: The recently upgrade park provides a key pedestrian railway underpass in the neighbourhood. The amenities
require augmenting and programming to ensure better use of the park across more diverse user groups to better use
the space.
126
The following section includes a series of maps relating to this node. The table below provides a summary of the status quo and trends for the Thembisa Civic
Hub, as indicated in the maps. In instances where the GIS data is not available or has not been provided, the table specifies the gaps.
Table 6: Status Quo of Thembisa Civic Hub
Connectivity/Transport Socio-economic Function Current Zoning Digital Stormwater,
Water and
Sanitation
Energy Human
Settlements
Trader Access
to
Infrastructure
The hub includes two train
stations. Informal
pedestrian routes connect
the surrounding residential
areas and stations to the
commercial & service
centre. Andrew Mapheto
intersects this hub, BRT
route 2 and stops in site.
Andrew Mapheto also
serves as a taxi route.
An important civic and
commercial hub. State services
include the Metro service
centre, library, post office and
SAPS. SME retailers and
corporate retailers operate
from the Thembi Mall,
independent shopping centres
and high streets (Sheba Street
/ George Nyanga Drive). Street
traders operate informally,
without infrastructure. Public
space includes Ibazelo Park.
The wider hub includes two
areas of informal settlement:
Igqagqa and Isekelo. Rapid
densification of residential
properties within the hub.
Primarily residential 2,
with some parcels of
land used for
residential 3. Business
zoning around
Limindlela station and
in the centre of the
site, adjacent to
Andrew Mapheto
Drive. Mixture of
transportation,
institutional and
agricultural zoning
around rail and
Andrew Mapheto
Drive.
No Data
Available
Stormwater
pipes and
manholes are
unevenly
available across
the site. The bulk
and sewerage
system connects
well across this
node.
No data
available.
Proposed high
density
residential in
Endulweni,
Isithame and
Kopanong.
Some formal
water and
electricity
access.
Predominantly
informal or no
water access.
Predominantly
no electricity
access, with
some informal
connections.
127
Map 19: Thembisa Civic Hub
128
Map 20: Land Use, Thembisa Civic Hub
129
Map 21: Land Ownership, Thembisa Civic Hub
130
Map 22: Zoning, Thembisa Civic Hub
131
Map 23: Sanitation, Thembisa Civic Hub
132
Map 24: Transport, Thembisa Civic Hub
133
Map 25: Housing, Thembisa Civic Hub
134
Map 26: Development Proposals, Thembisa Civic Hub
135
11.4. Makhulong Community Precinct
As a further point to section 10.3.2. above, the Makhulong Community Precinct has established and
consolidated itself as a functioning social, sports and recreational node. In its current usage, the precinct
has limited opportunities for economic activity. The facilities require a strong precinct management
strategy to ensure the optimisation of the investments. Poor urban management will result in dangerous
levels of decay and fragmentation of the infrastructure assets. This needs to be coupled with a strong
activation and marketing strategy to use the spaces more intensely.
The precinct has not been identified to change in core functions. The existing plans for the area should
be advanced. The recommendations are seen to enhance the sense of place and include:
1. Public Environment Upgrade. The sidewalks and connections across streets at the node need
to be designed to allow for better connectivity and safe walking for commuters/pedestrians and
economic opportunity for micro business. This would involve a general public environment
upgrade that would include the design and implementation of sidewalk, lighting, signage
(directional and advertising) and landscaping (hard and soft).
2. Landscape Design. A strong landscaping design with hard and soft landscaping needs to define
the various functions and zones within the precinct and would assist with greater legibility.
3. Public Art. It is also recommended that a public art and creative output program and project
is coupled with this development. This would engage local creative practitioners to enhance the
precinct and lend a particular creative and brand identity. Outputs could include sculpture,
installations, mosaic, murals as well as ephemeral or soft programs like performance.
4. The facilities by YES are in a serious state of disfunction. This is largely attributed to irregular
electricity provisions. The organisation is at advanced levels of negotiation to remove their
operations from the facility. It would be critical to find a means to ensure their presence, at their
this or another site in Thembisa.
136
Figure 31: Signage is critical to micro street businesses and are well located to attract potential clients and showcase
services. These signs, their business, location and coordination presents a valuable opportunity to strategise a
coordinated response to signage and space making.
137
The following section includes a series of maps about this precinct. The table below provides a summary of the status quo for the Makhulong Node. In instances
where data is not available or has not been made available, the table specifies the data gaps.
Table 7: Status Quo of the Makhulong Node
Connectivity/Transport Socio-economic
Function
Current Zoning Digital Stormwater, Water
and Sanitation
Energy Int Human
Settlements
Trader Access to
Infrastructure
BRT line and stop, adjacent to
Andrew Mapheto. An area
within the Thembisa Civic
Hub. Informal pedestrian
routes connect the node to
the commercial / social centre
of the hub.
Low density res,
social facilities,
sporting
facilities. The
Makhulong
Station is the
anchor.
Surrounding area is
primarily residential
2. Most of the site is
zoned for Public
Open Space, with
some business
zoning on the
western side of the
site. The eastern
side of the site is
zoned for social
services.
No Data
Available
One stormwater
manhole in the site,
with stormwater pipes
intersecting western,
central and eastern
sections of the precinct.
Stormwater
infrastructure in
surrounding area is
uneven. The bulk and
sewerage system
connects well across
this node.
No data
available.
Higher density
residential
proposed for
eastern section of
the site.
There are
approximately
nine businesses
operating in this
site. Three
businesses have
formal access to
water and
electricity, three
have informal
access and three
have no access.
138
Map 27: The Makhulong Node
139
Map 28: Land Use, Makhulong Node
140
Map 29: Land Ownership, Makhulong Node
141
Map 30: Zoning, Makhulong Node
142
Map 31: Transport, Makhulong
143
Map 32: Stormwater Infrastructure, Makhulong Node
144
Map 33: Housing Dynamics, Makhulong Node
145
Map 34: Development Proposals, Makhulong Node:
146
11.5. Limindlela Station Node
The Limindlela Station Precinct is situated in close proximity to the civic node and north-south mobility
corridor, making it highly accessible and (informally) connected. Despite the sub-optimal performance
of the railway system at present, the site attracts some degree of economic activity, but does struggle
operationally with the railway’s systemic vulnerability. This poses a great threat to businesses that
requires a predictable throughput of commuter volumes. The node also contains significant open land
or properties that can attract developmental intensification
The following recommendations are contemplated for the node:
1. Develop an urban management plan and the clearly demarcate the scope of the node. The
stakeholders would need to be clearly defined and engaged in the process of the
transformation of the node.
2. Business infrastructure support. The existing business adjacent station need to be
acknowledged as critical agents in the well-being of the precinct and their needs to be
adequately integrated into the development of the precinct.
3. Station entrance re-design. The eastern side of the station requires rehabilitation;it needs to
carefully integrate commuter flow, economic infrastructure and social spaces.
4. Public environment upgrade. The sidewalks and connections across streets at the node need to
be designed to allow for better connectivity and safe walking for commuters/pedestrians and
economic opportunity for micro-business. This would involve a general public environment
upgrade that would include the design and implementation of sidewalk, lighting, signage
(directional and advertising) and landscaping (hard and soft).
5. Park Rehabilitation. The park to the west of the station to be upgraded to introduce a sports
and recreational facility, or pocket-park. The park to form part of the urban management plan
and activated accordingly.
Opportunity: Train station nodes revitalised for mixed-use.
Opportunity: A network of NMT and pedestrian lanes developed.
147
Map 35: Limindlela Station Node
148
Map 36: Land Ownership, Limindlela Station Node
149
Map 37: Zoning, Limindlela Station Node
150
Map 38: Transport, Limindlela Station Node
151
Map 39: Stormwater Infrastructure, Limindlela Station
152
11.6. Leralla Station Node
Further to section 10.4.3. above, Leralla Station Precinct demonstrates significant existing assets,
including CoE infrastructure, that should be leveraged to consolidate more intense growth and
diversification (asset ‘sweating’). It comprises a valuable set of built infrastructure resources and
connectivity to warrant investment. The broad range of economic actors, land arrangements and
development potential make this node ideal for intense investment and coherent precinct management.
In addition to the 2016 plans, the following recommendations are contemplated for the node:
1. Urban management plan and the clear demarcation of a precinct within this node. The
stakeholders would need to be clearly defined and engaged in the process of the
transformation of the node.
2. Taxi terminus. Design of a taxi terminus that includes clear traffic management, signage, shelter,
offices, trading spaces, ablutions, waiting areas, WiFi, lighting and landscaping. This design
clarity would allow for a better operation and consolidation of economic investment at the rank.
It is important to link taxi transport to the BRT routes / station.
3. Traders market. This municipal market includes shelter ablutions (though not functioning),
trading infrastructure and social spaces. The market has the potential to be a connecter between
the taxi rank, BRT station and shopping centre. It allows for smaller scale economic actors to
participate in the opportunities generated by the adjacent transport infrastructure and mall-
based businesses.
4. Street Trader Plan. A street trader plan would need to be identified and established to ensure
there is a degree of cohesion, opportunity and legibility in how street trade is conducted. The
street trading infrastructure would relate to the Municipal Market and the transport facilities in
the node.
Opportunity: A precinct management plan instituted, and upgrades completed for Leralla trader
market.
Opportunity: Public safety enhanced through the application of crime prevention through environmental design
and precinct management.
153
Figure 32: The taxi rank comprises key uses - the train station, shopping centre and market, bring great vitality to the
rank. The links between the various spaces and the poor definition of the public space renders the space performing
sub-optimally.
Figure 33: This busy market caters to a diversity of users activists within the area. The trading spaces could be enhanced
to better provide for amenities and services for both trades and consumers, such as seating spaces, storage, dedicated
cooking spaces and shade.
154
The following section includes a series of maps relating to this node. The table below provides a summary of the status quo for the Leralla Station Node. In
instances where the GIS data is not available or has not been provided, the table indicates the gaps.
Table 8: Status Quo of Leralla Station Node
Connectivity/Transport Socio-economic
Function
Current Zoning Digital Stormwater,
Water and
Sanitation
Energy Int Human
Settlements
Trader Access to
Infrastructure
Leralla Train Station, BRT
station, mini-bus taxi rank
and informal sedan taxi
services. The node is
situated adjacent to
Andrew Mapheto.
Informal pedestrian routes
connect Ehlazeni Hostel
residents to the Plaza and
Traders. A bridge to serve
the BRT straddles Andrew
Mapheto Drive.
The node
comprises 3
precincts: the
Thembisa Plaza,
the Leralla
Trader market,
and the Leralla
Station precinct.
The node
includes a public
park and
community hall.
The area around
Leralla Station is
zoned for
transportation.
Thembisa Plaza
and the trader
site are zoned
Business 2, with
the site south of
the trader stalls
zoned for public
services.
No Data
Available
Some stormwater
facilities on
Andrew Mapheto
Drive.
Stormwater
infrastructure in
surrounding area
is uneven. The
bulk and
sewerage system
connects well
across this node.
No data
available.
No Data
Available
There are no
formal water or
electricity access
points in this
node. Most
businesses do not
have water or
electricity access,
while some have
informal access.
155
Map 40: Leralla Station Node
156
Map 41: Land Ownership, Leralla Station Node
157
Map 42: Zoning, Leralla Station Node
158
Map 43: Transport, Leralla Station Node
159
Map 44: Housing Dynamics, Leralla Station Node
160
Map 45: Stormwater Infrastructure, Leralla Station
161
11.7. Thembisa Station Node
This node is entirely defined by the Thembisa Station, which forms a sub-precinct in the Thembisa Civic
Hub Plan. The sub-precinct is highly reliant on a functional railway system – which at present is very
vulnerable. This vulnerability threatens a predictable economic climate in the node upon which a
development can be rendered feasible. While the station is present, it would be more valuable to explore
the land around the station without factoring the station as a developmental force. The proposed
Kopanong and Isithame housing developments to the west of this node will increase the density of
housing in adjacent areas.. The station building and related infrastructure are in an advanced state of
disrepair and needing urgent maintenance or upgrade.
The following recommendations are contemplated for the node:
1. Develop an urban management plan.. The stakeholders would need to be clearly defined and
engaged in the process of the transformation of the node. A stakeholder and management plan
will create a secure institutional space for increased private investment – especially through
underperforming land parcels within the node.
2. Public environment upgrade. The sidewalks and connections across streets at the node need to
be designed to allow for better connectivity and safe walking for commuters/pedestrians and
economic opportunity for micro-business. This would involve an environment upgrade that
would include the design and implementation of sidewalk, lighting, signage (directional and
advertising) and landscaping (hard and soft).
3. Trading Infrastructure. The introduction of well-designed trading infrastructure should define
the approach and entrance to the station. This would simultaneously get the traders and
commuters to be in better proximity. The traders would be dependent on the performance of
the railway system and its ability to generate significant traffic volumes.
4. Housing. Adjacent land is sub-optimally used. This land should be identified for high-density
housing.
5. Backyarding. The current proliferation of backyarding in the area needs to be formalised in
support of spatial development plans. Increased density of existing private land in a 200m radius
from the station should be encouraged.
6. Park Rehabilitation. The park outside the north entrance of the station to be upgraded as a
pocket-park. The park to form part of the urban management plan and activated accordingly.
7.
162
Opportunity: A network of NMT and pedestrian lanes developed.
Opportunity: Train station nodes revitalised for mixed-use.
Figure 34: The irregular train service compromises coordinated economic growth at the station nodes. The traders
along walkways currently respond to consumers using the railway bridge to cross the railway line. The existing
infrastructure here can be appropriated for new uses.
163
Map 46: Thembisa Station Node
164
Map 47: Land Ownership, Thembisa Station Node
165
Map 48: Zoning, Thembisa Station Node
166
Map 49: Transport Facilities and Routes, Thembisa Station Node
167
Map 50: Stormwater Infrastructure, Thembisa Station Node
168
12. Housing
12.1. Overview
This section analyses the role of housing in township economic development in Thembisa. It uses the
housing asset framework to analyse the social, economic and financial functions of housing and their
contributions to township development. It also draws attention to the roles of place-making and
institutions in increasing the all-round value of housing and stimulating economic density, i.e., higher
investment in buildings and other physical structures.
The study uses available quantitative and qualitative data to analyse the existing housing situation and
the main trends, upon which future opportunities are identified and discussed. Information gaps
presented a significant challenge to understanding the housing dynamics in Thembisa. Limited
information on basic issues including population growth, housing demand, density, informal dwellings
and local property markets render the analysis incomplete.
12.2. Conceptual Framework: Housing as social, economic and financial asset
The housing asset framework (Rust 2020) 1 offers a useful conceptual lens to understand the social,
economic and financial importance of housing and how they can contribute to township economic
development. As a social asset, housing provides township residents with a safe and secure place to
live, socialise, study and sleep. As an economic asset, housing generates income and livelihood
opportunities for homeowners. The social and economic functions of housing influence its value as a
financial asset. As a financial asset, the house can be traded for money, used as collateral to access
finance or as an investment to accumulate wealth, which can be passed on to others. The figure below
depicts the social, economic and financial asset values of housing and their contribution to township
economic development.
1 Rust, K. (2020). Framing concept: Understanding the housing asset. Centre for Affordable Housing