r------------------ _._---_._--- Report of Investigations 7867 Toxic Fumes From Explosives: Ammonium Nitrate-Fuel Oil Mixtures By R. F. Chaiken, E. B. Cook, and T. C. Ruhe Pittsburgh Mining and Safety Research Center, Pittsburgh, Pa. UNITED STATES DEPARTMENT OF THE INTERIOR Rogers C. B. Morton, Secretary BUREAU OF MINES Thomas V. Falkie, Director
Transcript
r------------------ _._---_._---
Report of Investigations 7867
Toxic Fumes From Explosives:
Ammonium Nitrate-Fuel Oil Mixtures
By R. F. Chaiken, E. B. Cook, and T. C. RuhePittsburgh Mining and Safety Research Center, Pittsburgh, Pa.
UNITED STATES DEPARTMENT OF THE INTERIORRogers C. B. Morton, Secretary
BUREAU OF MINESThomas V. Falkie, Director
EPA
Text Box
Note: This is a reference cited in AP 42, Compilation of Air Pollutant Emission Factors, Volume I Stationary Point and Area Sources. AP42 is located on the EPA web site at www.epa.gov/ttn/chief/ap42/ The file name refers to the reference number, the AP42 chapter and section. The file name "ref02_c01s02.pdf" would mean the reference is from AP42 chapter 1 section 2. The reference may be from a previous version of the section and no longer cited. The primary source should always be checked.
U,S. Dept. of the Int. Library
This publication has been cataloged as follows:
Chaiken, R FToxic fumes from explosives: ammonium nitrate-fuel oil
mixtures, by R. F. Chaiken, E. B. Cook, and T. C. Ruhe.[Washington] U.S. Bureau of Mines [1974]
622.06173no. 7867TN23.U7
24 p, illus., tables. (U.S. Bureau of Mine s , Report of investigations 7867)
Includes bibliography.
1. Explosives. 2. Fume control. I. U.S. Bureau of Mines. II.Cook, Edwin B., jt. auth, Ill. Ruhe, T. C., jt. auth, IV. Title.V. Title: Ammonium nitrate-fuel oil mixtures. (Series)
TOXIC FUMES FROM EXPLOSIVES: AMMONIUM NITRATE·FUELOIL MI XTURES
by
R. F. Chaiken, 1 E. B. Cook,2 and T. C. Ruhe3
ABSTRACT
The Bureau of Mines has carried out experimental and theoretical studieswith prilled and pulverized ammonium nitrate-fuel oil (AN-FO) mixtures containing varying amounts of fuel oil in an attempt to quantify the effects of stoichiometric composition, nonideal detonation behavior, and expansion volume onthe production of CO, NO, and NOa fumes. Experimental fume measurements wereobtained in the Bureau's large closed gallery facility (7.2 X 10⁴ liter expansion chamber) and in the standard Crawshaw-Jones apparatus (90-liter expansionchamber) using a prepackaged charge configuration containing about 450 g ofexplosive. 4 The theoretical calculation of toxic fumes was achieved with anequilibrium detonation code called ''TIGER.''
Contrary to initial expectations, the NOx (= NO + N02 ) fumes from thelarge gallery test were found to be in essential agreement with the CrawshawJones results. It was also concluded that (1) "TIGER" calculations offer agood approach to the prediction of toxic fumes; (2) there is a basic problemin extrapolating laboratory measurements of CO fumes to mine conditions--thisbeing due to postdetonation oxidation of CO to COa; and (3) the detonationvelocity decay rate of an explosive is a useful experimental parameter forcorrelating toxic fumes production with nonideal detonation behavior.
INTRODUCTION
The potential hazards of fumes from blasting operations in undergroundmines have long been recognized. These hazards stem from the fact that whenagents such as dynamite and ammonium nitrate-fuel oil mixtures (AN-FO) detonate, small (1 to 5 wt-pct) but significant amounts of CO, NO, and NOa areliberated as detonation products. Under limited ventilation conditions. suchas those which could exist in a mine, these detonation products can present asevere toxic fume hazard to mine workers. This is particularly true with NOa
lResearch chemist.zResearch chemist (now retired).3Chemist.4The term explosive in this paper will refer to both "explosives" and blasting
agents.
2
which has a lethal toxicity (~220 ppm) and threshold limit value (5 ppm) comparable to that of hydrogen cyanide ~).5
There have been numerous measurements made of NOx (that is, NO + NOa) andCO in underground mines from ammonium nitrate-based explosives and indeed hazardous concentration levels have been found (11, 14, 18, 1£-23). The qualityand quantity of fumes produced appears to depend upon a number of factors suchas explosive composition, product expansion, method of priming, length ofcharge, and confinement. Unfortunately, the difficulties in controlling theexperimental conditions in a mine make it difficult to quantitatively assessthe relationship between toxic fumes and the factors that influence theirproduction.
Laboratory determinations of toxic fumes from explosives have also beencarried out (I, 11, 14, 16, 18, li, 22-23). The experiments generally consistof detonating a small quantity (100 to 500 g) of explosive in a closed chamber,followed by sampling and analysis of the residual fumes. The Crawshaw-Jonestest (90-1 chamber) ~, li), the Bichel Gage test (14.5-1 chamber) (lQ, ~),
and the Dolgov Bomb test (50-1 chamber) (1) are typical of the types of apparatus used. Explosive confinements have included bare charges, cement blocks,and steel cannon boreholes with and without stemming. For AN-FO and otherexplosives, the values of NOx produced in the laboratory have been found to beless than those obtained in the mine lli, 18, 22-23).
There are several problems inherent to the laboratory experiments whichlikewise make it difficult to obtain toxic fume data that can be related toexplosive composition and extrapolated to mine conditions. Fir-st, it is d-if-ficult to _?_c.hieveconsistent detonatLon in ze Ia t LveLy.rsma Lk quantities of~lasdng-agents such as AN-FO. The degree of confinement plays an importantr-OTEt-lli-deterniining the det"onation state condition and work performed, andhence could affect the compos~tion of the expanded products.
Second, product expansion of detonation products to near 1 atm residualpressure requires a sizable expansion chamber even for small quantities ofexplosive (about 103 to 1 for an evacuated chamber and about 104 to 1 for anatmospheric chamber). The resulting large volume dilution of fumes imposessevere sensitivity requirements on the gas sampling and analytical techniques.Product expansions leading to higher residual pressure (that is, small expansion volumes) could lead to condensation of water from the detonation products,and removal of NOx fumes by absorption. The higher surface-to-volume ratio ofsmall expansion chambers would enhance this effect.
The Bureau of Mines has been investigating toxic fume production withAN-FO mixtures from the viewpoint of resolving the above laboratory test problems, while attempting to approach conditions amenable for theoretical analysis of the effect of mixture composition on NOx and CO fume production. Thecurrent work, which extends previous studies in the Crawshaw-Jones apparatus(~, 23), was made possible by the following recent developments:
5Underlined numbers in parentheses refer to items in the list of references atthe end of this report.
3
(1) Availability of a large, closed explosion gallery facility (7.2 X 10⁴ . 1expansion chamber), (2) a new chemi1uminescent technique for measuring smallquantities (as low as 0.1 ppm) of NO and NOa, (3) a new equilibrium computercode for calculating products of detonation, and (4) recent theoretical treatments of the kinetics of NO and CO reaction in combustion systems.
It is the purpose of this report to describe these developments and thetest results obtained with AN-FO mixtures containing varying amounts of fueloil.
ACKNOWLEDGMENTS
A number of people at the Bureau contributed directly to the work of thisreport and their efforts are gratefully acknowledged. Helen Lang and her colleagues in the Bureau's Analytical Research Group carried out many gas chromatographic and wet colorimetric analyses. John Nickovich and Paul Richardsondid much of the work of converting the large gallery to a toxic fume testfacility. Robert McNall and Ronald Brewer gave able assistance in the designand firing of the explosive charges. Elva Guastini helped prepare the explosive charges. And Dr. Charles M. Mason, research chemist, engaged in helpfuldiscussion of the results of the work.
THEORETICAL CONSIDERATIONS
Kinetics of NO and CO in Expansion
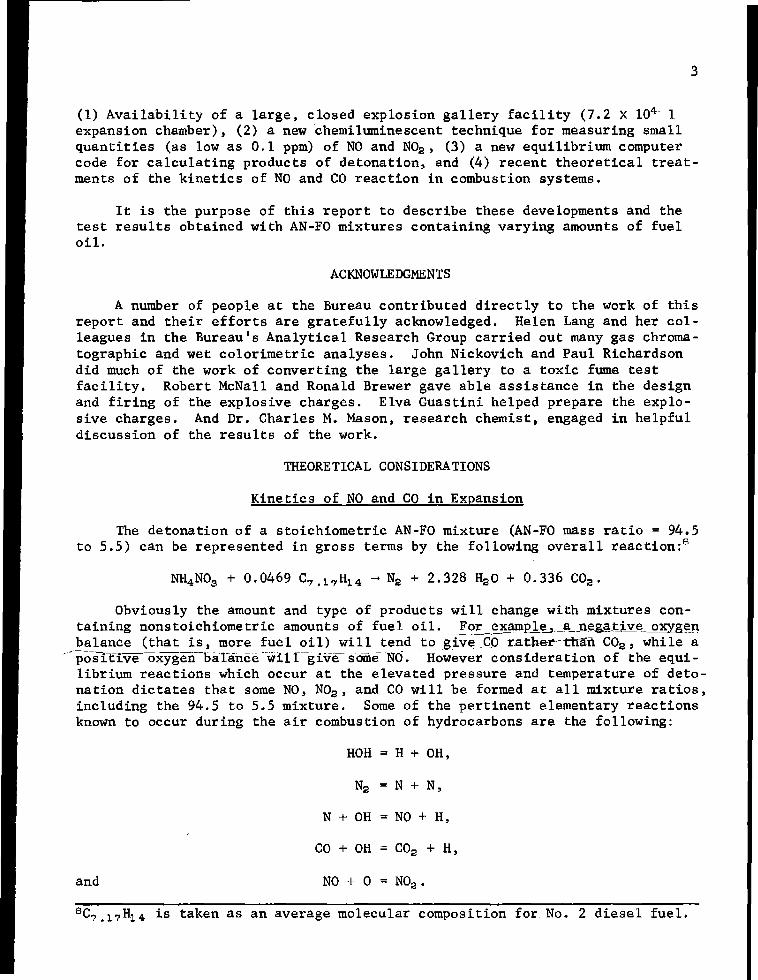
The detonation of a stoichiometric AN-FO mixture (AN-FO mass ratio = 94.5to 5.5) can be represented in gross terms by the following overall reaction: 6
Obviously the amount and type of products will change with mixtures con-taining nonstoichiometric amounts of fuel oil. For ~~~p1lL__a neg~ltiYe~&~H
balance (that is, more fuel oil) will tend to g{ve-~CO ratbe-r--1:tain COa, while a-"--po"sTfive -oxy-geii-baTance "-:Wi1 r--give" sori:i£~(j . However cons iderat ion 0 f the equi
1ibrium reactions which occur at the elevated pressure and temperature of detonation dictates that some NO, NOa, and CO will be formed at all mixture ratios,including the 94.5 to 5.5 mixture. Some of the pertinent elementary reactionsknown to occur during the air combustion of hydrocarbons are the following:
HOR = H + OH,
Na = N + N,
N + OH NO + H,
CO + OH = COa + H,
and NO + 0 = NOa•
6C?1?R14 is taken as an average molecular composition for No.2 diesel fuel.
4
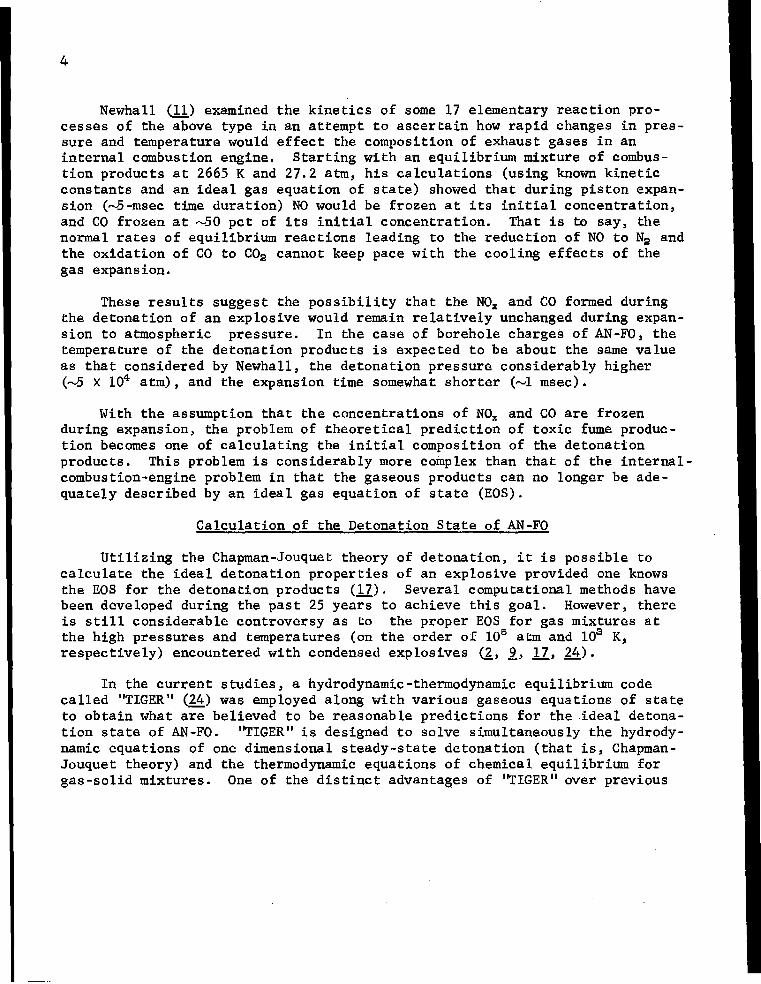
Newhall (ll) examined the kinetics of some 17 elementary reaction processes of the above type in an attempt to ascertain how rapid changes in pressure and temperature would effect the composition of exhaust gases in aninternal combustion engine. Starting with an equilibrium mixture of combustion products at 2665 K and 27.2 atm, his calculations (using known kineticconstants and an ideal gas equation of state) showed that during piston expansion (~5-msec time duration) NO would be frozen at its initial concentration,and CO frozen at ~50 pct of its initial concentration. That is to say, thenormal rates of equilibrium reactions leading to the reduction of NO to Na andthe oxidation of CO to COa cannot keep pace with the cooling effects of thegas expansion.
These results suggest the possibility that the NOx and CO formed duringthe detonation of an explosive would remain relatively unchanged during expansion to atmospheric pressure. In the case of borehole charges of AN-FO, thetemperature of the detonation products is expected to be about the same valueas that considered by Newhall, the detonation pressure considerably higher(~5 X 10⁴ atm), and the expansion time somewhat shorter (~l msec).
With the assumption that the concentrations of NO~ and CO are frozenduring expansion, the problem of theoretical prediction of toxic fume production becomes one of calculating the initial composition of the detonationproducts. This problem is considerably more complex than that of the internalcombustion~engine problem in that the gaseous products can no longer be adequately described by an ideal gas equation of state (EOS).
Calculation of the Detonation State of AN-FO
Utilizing the Chapman-Jouquet theory of detonation, it is possible tocalculate the ideal detonation properties of an explosive provided one knowsthe EOS for the detonation products (11). Several computational methods havebeen developed during the past 25 years to achieve this goal. However, thereis still considerable controversy as to the proper EOS for gas mixtures atthe high pressures and temperatures (on the order of 106 atm and lOs K,respectively) encountered with condensed explosives ~, ~, 17, 24).
In the current studies, a hydrodynamic-thermodynamic equilibrium codecalled "TIGER" ~) was employed along with various gaseous equations of stateto obtain what are believed to be reasonable predictions for the -ideal detonation state of AN-FO. 'TIGER" is designed to solve simultaneously the hydrodynamic equations of one dimensional steady-state detonation (that is, ChapmanJouquet theory) and the thermodynamic equations of chemical equilibrium forgas-solid mixtures. One of the distinct advantages of I~IGER" over previous
5
codes of its type is that different EOS subroutines can be readily programedfor use ."
(1)
(2)
For the Becker-Kistiakowsky-Wilson (BKW) equation of state (1)
p = 1 + xeSx ,
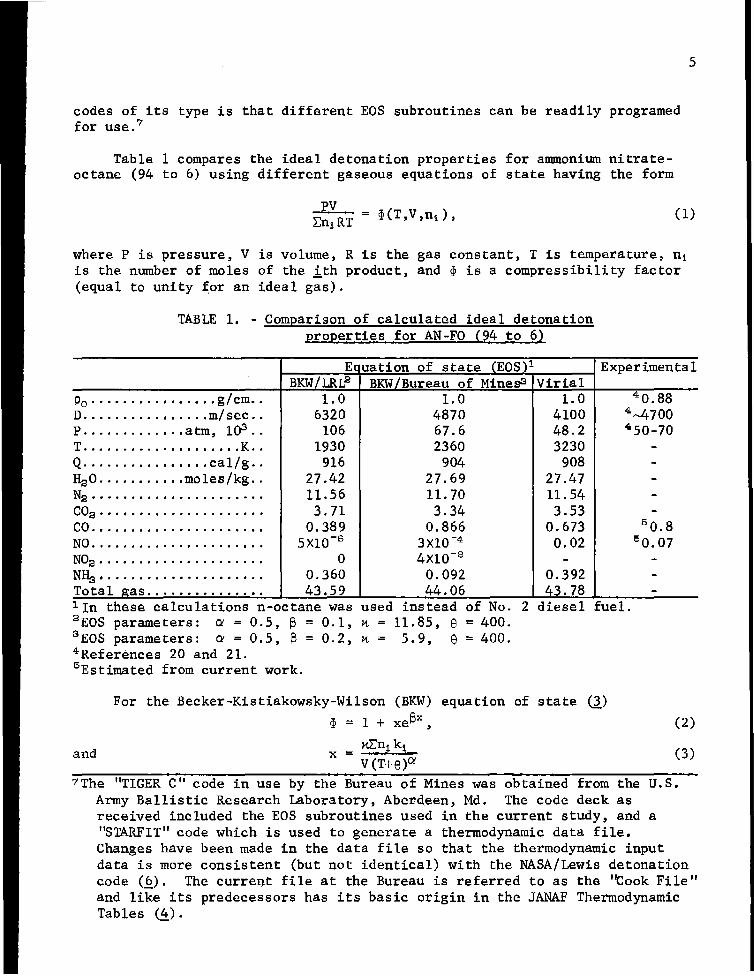
TABLE 1. - Comparison of calculated ideal detonationproperties for AN-FO (94 to 6)
Table 1 compares the ideal detonation properties for ammonium nitrateoctane (94 to 6) using different gaseous equations of state having the form
Ecuation of state (EOS)l ExperimentalBKW/LRLs BKW/Bureau of Mines3 Virial
where P is pressure, V is volume, R is the gas constant, T is temperature, n1is the number of moles of the ith product, and p is a compressibility factor(equal to unity for an ideal gas).
111:n 1 k 1and x = V(T+e)a (3)
7The "TIGER C" code in use by the Bureau of Mines was obtained from the U.S.Army Ballistic Research Laboratory, Aberdeen, Md. The code deck asreceived included the EOS subroutines used in the current study, and a"STARFIT" code which is used to generate a thermodynamic data file.Changes have been made in the data file so that the thermodynamic inputdata is more consistent (but not identical) with the NASA/LeWis detonationcode (~). The current file at the Bureau is referred to as the 'took File"and like its predecessors has its basic origin in the JANAF ThermodynamicTables (~).
lIn these calculations n-octane was used instead of No.2 diesel fuel.sEOS parameters: a = 0.5, S = 0.1, K 11.85, 8 = 400.3 EOS parameters: a = 0.5, S = 0.2, K = 5.9, 8 = 400.4References 20 and 21.5Estimated from current work.
6
8LRL refers to the Lawrence Radiation Laboratory of the University of California.(See reference 9.)
9 Wor k is in progress at the Bureau to develop an improved EOS which will overcomethe apparent inadequacies of the virial EOS.
(6)
(4)
(5)
B(T,n1)iP 1+ V +
B(T,n1) =~ :61 j~J
C(T,n1) = ~ C1j k (T)n1njnk.ijk -
and
In ''TIGER,'' the second and third viria1 coefficients, B(T) and C(T), respectively, correspond to a Leonard-Jones (6-12) intermolecular potential. The mixturerules for defining B1 j and C1j k are those suggested by Hirschfelder and coworkers~). This EOS has only recently been programed for use with TIGER. (See footnoteon page 5.) •
Examination of table 1 reveals that the BKWEOS is inadequate for calculatingtoxic fume production. Our calculations with the LRL and the Bureau of Mines parameters, as well as other values of a, ~, K, and e indicate that the predicted NOxfumes fall well below the experimental values. This occurs even with other AN-FOcompositions and other explosives (for example, pentaerythritol tetranitrate, PETN).It was, therefore, concluded that the BKW EOS is not applicable to the problem undercurrent consideration. Indeed, the fact that a drastic change in the LRL parameterswas required in order to match the experimental detonation velocity and pressure fo~
AN-FO suggests that the BKW EOS is merely an empirical relation having a limitedapplication.
The viria1 EOS appears to yield reasonable values for velocity, pressure, andproduct composition, although the values for D, detonation velocity, and P, pressure,are about 15 pct too low. This latter discrepancy is even more apparent in calculations involving higher density explosives. However, of the two types of EOS currently available and tested, it is believed that the virial EOS represents a morereasonable approach to predicting the effect of AN-FO composition on NOx and CO fumeproduction. 9
It is noteworthy that, because the calculated NOx concentration in combinationwith detonation velocity and pressure appears to be sensitive to the EOS, realistictoxic fume measurements can serve as additional test data for evaluating various proposed high-density gaseous EOS's.
Table 2 depicts the theoretical (ideal) detonation properties of 10 AN-FO compositions (0 to 10 pct fuel oil) at a bulk loading density of 0.8 gm/cm3 as determinedwith "TIGER," the virial EOS, and the "Cook File." It is seen that the quantity ofNOx fume production is expected to be at a maximum between 3 and 4 pct FO, whereasthe peak in detonation velocity and heat of detonation occurs at -6 pct FO, which ison the fuel-rich side of the stoichiometric composition (94.5 to 5.5). Below 6 pctFO little CO is to be expected; but at compositions of 6 pct and higher, the COrapidly increases.
where the k1 's are covolumes, and a, ~, K, e are constant parameters. The parameters for the-BKW/LRL8 EOS (tab1e-r) have been fitted to experimental velocity andpressure data on high explosives such as RDX (cyclotrimethylene trinitramine). ThisEOS has in the past been used extensively for calculating detonation velocity andpressure. The parameters for the BKW/Bureau of Mines EOS have been chosen to yielddetonation velocities and pressures more consistent with experimental data on AN-FO(20-21).
For the viria1 EOS ~);
~BLE 2. - Ideal detonation properties1 of AN-FON14NOg /C, .1'~4; Po = 0.8 g/cm3
The procedures for determining toxic fume production from explosives arein principal quite simple, namely detonating a given weight of explosive,expanding the gases produced into a known closed volume, and then sampling andanalyzing the gas. However, the problem is to obtain data which can be meaningfully interpreted in terms of pertinent explosive parameters and extrapolated to mine conditions. The problem requires stringent control of theexplosive geometry, the conditions of detonation, and the loss of fumes bywall effects (adsorption).
In the current work, the Bureau's large closed-gallery system (10) wasemployed. (See fig. 1.) The system consists of a cylindrical steel chamber6-1/3 ft in diameter and 80 ft in length, having a total volume of 2,550 ftS
(7.22 X 10⁴ 1). At one end of the chamber (that is, the end which is in thebuilding on the right in fig. 1) is a 5-l/l6-inch gasketed aperture againstwhich the muzzle of a steel cannon (or mortar) is forced under hydraulic loading and mechanical propping. The cannon is a steel cylinder 2 ft in diameterand 3 ft in length containing a 2-1/4- by 23-in borehole set in a special
FIGURE L - Bureau of Mines large closed-gallery facility,
9
steel liner. Anaccess door at thefar end of thechamber allowsentry into thechamber and muzzleloading of thecannon.
The inside ofthe chamber isfitted with a1,500-cfm ductedfan for stirringthe gases, and anexhaust blower forairing the chamber.Three gas samplingstations are positioned at approxi-mately 17, 44, and68 ft along thechamber length.These consist of3/8-in stainlesssteel tubesinserted throughthe chamber wallsfrom an externalmanifold leadingback to the control room. At apreset time, thegas is pumped fromthe chamber intoa preevacuated2.2-1 stainlesssteel samplingbottle (fig. ZA).A combina tionvacuum-pressuregage on the bottleenables the gaspressure to bemonitored duringfilling (generally
at 2 atm maximum). The 304-stainless steel bottles, prior to their initialuse in this work, were passivated with HN03 and NOa until no evidence of wallreaction with calibration gases could be detected «1 pct with l5-min storage).
NO +
10
Tests in the large closed-gallery system showed that with 8 to 10 minstirring after shot firing, the detonation product gases were uniformly dispersed throughout the chamber.
Gas Analysis
All gas analyses were run from the 2.2-1 stainless steel sample bottlefilled to a pressure of ~2 atm. For COa , CO, CH4, Ra, and air, standard ,aschromatography was employed. Separate glass gas sample bottles of 250 cmwere filled from the 2.2-1 steel bottle for the gas chromatographic analysis.
For the determination of NO and NO~, a Thermoelectron Corp. model lOAchemiluminescent analyzer was employed. 0 This instrument reacts a meteredflow of sample gas (taken directly from the 2.2-1 stainless steel bottle) withan excess of ozone. The reaction
*Os NOa + 0a
NO: NOa + hv
proceeds with unit quantum efficiency, and is followed by measuring the intensity of the emitted light ~). The optical detection system is designed sothat the instrument is specific to the NO: chemiluminescence with a sensitivity of -0.1 ppm, at least in the concentration range of mixtures encounteredin the current studies.
To determine NOa, the sample gas is passed through a thermal convertorunit at 6500 C, that is
A 1NOs ..... NO + "2 Os ,
prior to carrying out the ozone reaction. The NOa concentration is then thedifference between instrument readings with and without the thermal convertorunit. Although the instrument is specific to NO, interferences can enter intothe NOs measurement. The interference occurs because nitrogenous gases suchas FlNOs and NBs can also react to some extent in the thermal convertor unit toform NO. For AN-FO this problem apparently was not serious since the NOsdeterminations generally agreed with results obtained by a gas analyzer thatis specific to NOa (Environmentrics Corp. Faristor Type N46).
Explosive Charge Design
For loading explosive into the cannon, a prepackaged, instrumented chargewas used (fig. 2&). This charge design was chosen over the conventionalmethod of bulk loading and tamping ill) in order to accomplish the followinggoals: (1) To maintain uniform and reproducible charge density and size,(2) to utilize a continuous velocity probe for monitoring the detonation
lOReference to specific trade names is made to facilitate understanding anddoes not imply endorsement by the Bureau of Mines.
11
velocity of each charge, and (3) to facilitate loading the cannon and connection of electrical leads.
The prepackaged charge is cased in a glass tube 1-3/4 in ID, 1/16 in wallthickness, and about 16 in long, cut from standard-wall 48-mm Pyrex tubing.Glass was chosen for the casing material because it is inert, rugged, andreadily available. During firing the glass completely disintegrates to a finepowder which is blown from the borehole.
To assemble the charge, a booster assembly is first constructed by gluingtwo PETN pellets (1-5/8-in diam, 5/8-in length, having a density of 1.4 g/cm3
and a nominal weight of 60 g) to a plaster of paris disk, 1/2 in thick havinga diameter slightly smaller than the tube inner diameter. The plaster diskhas a center hole to accept a No. 8 electric blasting cap. The boosterassembly is then bonded (silicone rubber adhesive) into one end of the glasstube, which has been previously fitted with a Bureau type II resistance wirevelocity probe ~, 13) along the length of the inside wall. The candidateexplosive (nominally 430 g) is carefully poured into the tube, and sealed witha solid plaster disk at the end of the tube.
Preparation of the AN-FO mixtures involved unifonn blending (in a tumbler)of No. 2 diesel fuel oil (colored red with dye) with either AN prills(American Cyanamid Corp. C-2) or pulverized AN (that is, prills which had beenpreviously passed through a hammer mill, with average particle size of.......lOO um) .
Loading the charge was accomplished from inside the gallery chamber bysimply inserting the charge, detonator end first, into the cannon borehole. Afree space (that is, distance between muzzle opening and end of charge) of2 in was maintained in each case.
Measurement of Detonation Velocity
The Bureau's type II resistance wire probe is used for continuously monitoring the detonation velocity of cylindrical explosive charges. Details ofthe probe construction and operation can be found in references 10 and 13.Briefly, the pressure associated with the advancing detonation front collapsesa thin-walled aluminum tube onto a resistance wire. The collapsing aluminumshunts an electrical current flowing through the wire causing a continuouschange in voltage across the wire. The resulting voltage-time profile, whichis directly related to distance-time, is recorded on an oscilloscope.
With the present explosive charge design, the detonation wave in theAN-FO is, in each case, initially overdriven by the 60-g PETN booster. Hence,the detonation velocity must decay as the detonation front passes up thecharge, resulting in an oscilloscope trace which is curved rather than linear.In most instances the diameter and length of the prepackaged AN-FO charge andthe degree of confinement are inadequate to establish a well-defined steadystate detonation. However, the rate of decay of the wave is a measure of therate of rarefaction loss from the detonation reaction zone, and hence is ameasure of the approach to steady-state detonation or eventual extinction.
12
Charges which would sustain a steady detonation would be expected to havesmaller velocity decay rates than charges which could not sustain a steadydetonation.
To measure the decay rate from the oscilloscope trace, a computerizedmethod of data reduction was devised in which the voltage-time profile wasconverted to a smooth velocity-distance curve suitable for analysis. Discrete points (about 25) along the oscilloscope trace were converted using apencil follower to digitalized input data, punched onto paper tape. Thisinformation, along with appropriate time and resistance wire calibration constants for the conversion of voltage drop to distance along the charge, weretreated by a finite difference method to yield discrete velocity-distancedata. This was accomplished by defining the velocity, Dt , at the ith point as
Xi +1 ~ Xi -1
t 1 +1 - t i - 1
where Xi and t 1 are the distance and time of the !th point, respectively.
The resulting set of Di and Xi data was then curve-fit by an empiricalexpression,
D(x) = Do exp(_Bx).11
(7)
(8)
Here, Do can be interpreted as the initial velocity of the overdrivenwave, and B the detonation-velocity decay constant (for example, cm-1). Thewhole procedure of data reduction, including graphing equation 8, was carriedout with a program developed for the Bureau's CDC 1700 computer.
Figures 3 and 4 illustrate some typical curves obtained by this procedure.It is readily seen that the decay constant B for the pulverized AN~Fa mixtureis less than that for the corresponding prilled AN-Fa mixture. For comparisonpurposes, figure 5 depicts the detonation velocity of a catalyzed AN-FO chargewhich essentially achieved steady detonation, and figure 6 depicts the shockvelocity-distance curve obtained from a PETN booster acting on an inert chargeof sand (that is, without detonation). Some 30 velocity-distance profileswere determined in this way, and the relative probable error of the curve fitwas less than 20 pct.
As indicated above, the constant B reflects, in a relative manner, thestability of the detonation wave, which itself is influenced by factors suchas geometry, size, loading density, confinement, etc. Henc~, B is a usefulparameter for correlating the influence of these factors on toxic fumeproduction.
11 "exp" refers to exponential to naper ian e.
81 I ' I81 I I I
6 6
;;Ql -'" u..... GOE Ul.....~ E-0 =.
4> 0 4I-U >0 I-...J UUJ 0> " ...J
UJ>
2L ~~ \ J ---J 2
o 10 2001 STANCE, X (em)
30 o 10 2001STANCE, X. (em)
30
FIGUR E 3. - Decoy of detonation ve locity AN-FO (pri lied)(94 to 6); D(X) "" 4.09 exp [-0.0504 XL krn/sec,
FIGURE 4. - Decoy of detonation velocity AN-FO(pulverized) (94 to 6); D(X) "" 3.95exp [-0.00681 X], km/sec,
t-'l.JJ
I
t-'~
10. I I I
8
u I I 64>
.:: 6E.J>C-0
>-
~+,M I \ { ~ f\./~uCP
~ 4E
.J>C
> \/ \ I -0
->-t:u0...JlJJ
2'-- ---, >
o 10 20DISTANCE, X (em)
30 o 10 20DISTANCE, X (em)
30
FIGURE 5. - Decoy of detonation velocity catalyzed AN-FO(96 to 4) (equivalent); D(X) = 3.90 exp[-0.00238 X], krn/sec.
FIGURE 9. - Toxic fumes from AN-FO mixtures, carbonmonoxide.
RESULTS AND DISCUSSION
1. The CO and COaobserved from the zero percent AN-FO charges (that is,those containing no fuel oil)were considered to arisefrom all extraneous sources.The average concentrationsof these species were thensubtracted from valuesobtained from charges whichcontained oil.
A compilation of theresults of the large closedgallery and Crawshaw-Jonestests is shown in tables 3and 4. The net toxic-fumeproduction includes corrections to account for thepresence of CO, NO, NOa, andCOa fumes which arise fromextraneous sources, forexample, from the PETNbooster, carbonaceous construction materials such astape, and normal air in thegallery prior to firing.These corrections wereaccomplished in the following manner:
98
//'
~/
/
[J
4 5 6 7
FUEL OIL, percent
•
- - 0 (COx" CO+C02>\ Pulverized AN-FO
.(CO) !Iorge closed gallery
-- -- [J (COx)} Pulverized AN-FO //
• (CO) Crowshow- Jones /
-.-. (CO) Prill AN-FO 1Crawshaw-Jones (19 23) /
6 (CO) Prill AN-FO _.- /mine tunnel ;5
TheoreticallTIGER" /colcu lot ions
//
7/
/o
/[J
/;6 /. A
/ // /.[J
o /./
[J/
.6
.2
o
.4
1.8
2.2
.8
2.0
1.4CIlllJ:2~ 1.2...llJZ 1.0
..c 1.6
",'.t:
2. The NOx toxic fume production from PETN was determined in separate experiments (tables 3 and 4),andits value, normalized to the booster weight, was subtracted from the AN-FOresults. In general, this latter correction is small.
Figures 7 and 8 illustrate the variation of net NOx concentration as afunction of fuel oil content. Several different curves are depicted. Figure 7 shows a theoretical curve based upon the "TIGER" calculations given intable 2, and two experimental curves representing the averaged results of thecurrent large gallery tests for both pulverized and prilled AN-FO; figure 8compares data from the large gallery test with current and previous (12)Crawshaw-Jones data. In addition, three data points are shown which refer toa previous mine tunnel test (23). Figure 9 depicts the available CO and COx(= CO + COa) fume data in a similar manner.
17
!ABLE 3. - Large closed-gallery results for prilland pulverized AN-FO mixtures
Shotnumber
Per-cent Po' B, m-1 Do, lD (14),fuel g/cm3 NO COx km/sec km/secoilPRILL AN-FO--BLANK: NO = 0.003; NOa = 0.002; NOx 0.005;
lNOx determined by colorimetric method; B. A. Cou1ehan andH. Lang, Rapid petermination of Nitrogen Oxides With Useof Pheno1disu1fonic Acid. Environ. Sci. and Techno1.,v. 5, 1971, pp. 163-164.
When comparing the current measured and theoretical NOx curves, it isseen that only semiquantitative agreement exists between them. The predictedmaximum value of NOx fume production is in reasonable agreement with experiment; however, the peak in the experimental curve occurs at 1 to 2 pct FOwhereas the predicted peak is at 3 to 4 pct FO. This result suggests that thevirial EOS may not be totally adequate for describing the detonating state ofAN-FO. Alternatively, the discrepancy could be related to the effects ofincreased nonideal detonation at the smaller fuel oil compositions. Thispoint will be discussed further later in this section.
The fact that the shape of the theoretical curve follows the generalshape of the experimental curves, and that the numerical values are of thesame order of magnitude, lends same support to our assumption that the NOx isfrozen near its detonation-state concentration. It should be pointed out thatthis conclusion does not necessarily imply that NO and NOa each remain attheir detonation state value. It is possible that the reaction
2NO + Oa (air) ~ 2NOa
can occur to some extent during and after expansion of the borehole gases into
19
the gallery air. This occurrence would explain in part the fact that theobserved NO/NOa ratios are consistently smaller than the predicted ratios(table 5). However, for hazards evaluation purposes it is the total NOx con~
centration which is significant, and this value would be independent of theextent of the above air oxidation reaction.
TABLE 5. - Comparison of predicted and experimentalNO/NOa ratios for pulverized AN-FO
The occurrence of a similar reaction between CO and gallery air duringexpansion, for example,
2eo + O2 (air) -> 2C02 ,
can also affect the observed CO fume production. Strong evidence that thisoccurs in the gallery can be seen from figure 9. Here we note that the COxnet fume data are in reasonable agreement with theory. In fact, if the COxblank for pulverized AN-FO (that is, the gross COx measured for the zero percent FO charge) is increased by 10 pet, the experimental net COx data wouldalmost coincide with the theoretical curve, suggesting a good experimentaltotal carbon balance. On the other hand, the gallery test data for CO withfuel-rich compositions (~6 pct FO) fall well below the theoretical curve andthe Crawshaw-Jones curve. In the latter test, the products expand intovacuum (~10 torr), and little air oxidation of CO should occur. Indeed theobserved CO values for this test do agree reasonably well with theory. Allthese results point strongly to the occurrence of postdetonation oxidation ofCO in the gallery test.
Unlike the case of NOx' it is of considerable importance from a hazardsviewpoint whether carbon appears as CO or CO2 in the expanded detonationproducts. Thus it would appear that the atmospheric air expansion chamberused in the gallery may not be totally suitable for evaluating CO fume production. It is interesting to note in figure 9 that the three mine testsappear to fall more in line with the Crawshaw-Jones results than with thegallery results, in spite of the fact that the mine test involves productexpansion into air. At this time, no good explanation exists for this
20
occurrence; however, postoxidation would not be expected to be reproducibleexcept under carefully controlled test conditions.
Returning to figure 8, we see that the current gallery and Crawshaw-Jonestests with pulverized AN-FO yield very similar results for NOx except for thezero percent fuel oil composition. As will be described later, the discrepancy at zero percent fuel oil is probably due to inadequate propagation ofdetonation rather than to the different test procedures. The apparent similarity of results of the two test methods was rather surprising since it wasanticipated that condensed water, which always appears in the cooled productsfrom the Crawshaw-Jones test, would absorb NOx gas and hence give rise to amisleading low yield of NOx ' This potential problem might be indicated if onesimply compares the current prill AN-FO gallery data with the previous prillAN-FO Crawshaw-Jones data. (See fig. 8.) However, these two sets of datarefer to different explosive charge configurations (prepackaged charge andtamped borehole charge) which likewise might account for the observed results.
Some evidence for a lower value of NOx yield in the Crawshaw-Jones testcan be seen with the pulverized AN-FO containing 6 and 8 pct fuel oil. (Seetables 3 and 4.) The Crawshaw-Jones data for NOx yield are 10-3 to 10-4
ft3/lb, whereas the NOx data from the gallery are about a factor of 100 higher.
It is to be noted however that these particular data are derived from themeasurement of rather small concentrations of NOx ; about 1 ppm in the galleryand about 100 ppm in the Crawshaw-Jones apparatus. The analytical measurements in each case (NO; chemiluminescence for the gallery test and colorimetric for the Crawshaw-Jones test) are near their lower limits of reliability.Hence, the observed increase in NOx yield in the gallery with the 6 and 8 petcompositions may be due to the different analytical procedures rather than tothe different expansion chambers. In any case, such small yields of NOx fumesare generally not considered hazardous for mining applications.
Contrary to our results with CO, the three NOx mine test data points tendto follow the gallery curve and the Crawshaw-Jones curve. (See figs. 7 and 8.)The significance of this agreement is somewhat questionable, but it does support the hypothesis that laboratory tests for NOx fumes can be extrapolated tomine conditions.
It is interesting to compare the amount of NOx fumes produced by theprill AN-FO with that produced by the pulverized AN-FO (fig. 7). Although thetwo fume profiles are quite similar, there appears to be a significantincrease in NOx with the prill AN-FO at oil concentrations greater than 1 pet.Examination of the velocity decay rates and measured velocities for the twotypes of AN-FO (figs. 10-11) reveals that, in the current charge configuration,the prill AN-FO is less able to sustain a steady detonation than the pulverized AN-FO.
In fact, the values of the detonation velocity decay constant, B, and thedetonation velocity at 14 em, D (14), for the prill AN-FO (100/0), when compared to that of an inert sand charg~ indicates a complete absence of detonation reaction; for the pulverized AN-FO (100/0), only partial reaction in the
21
overdriven wave is indicated. Since significant NO was found for these rela-xtively nondetonating systems, it suggests that the AN must have partiallydecomposed during or after ejection from the cannon borehole. This, then,could also explain the large difference in the NOx yield from the gallery andCrawshaw-Jones tests of the zero percent Fa composition. Postdetonation reactions during or after expansion into air and vacuum would not be expected tobe the same. On the other hand, the two types of AN-Fa at 1 pct Fa exhibitalmost the same decay rate constants and the same NOx fume production. Theseresults are in concurrence with what has long been known in practice, namely,that inadequate initiation and propagation of detonation of AN-Fa charges willresult in higher NOx fume production ~).
987
o
•
• Prill AN-FO
o Pulverlzed AN-FO
- - Theoretical Ideal velocity0.8 gm Icm3 density
Catalyzed AN-FO ....--.-:..-96 to 4 equivalent ....--
....-- 0
///--- 0
o
...:; 3
~~<>>....zsg 2uJ>~o~~o....uJo
9
• Prill AN-FOo Pulverized AN-FO
Sand----------
~uuJ0
>-t-o 5 •0 •...JuJ>
0 00
o
-....~
~(fl~
ouuJ!;i 10cr
T~
:!!..E
~ 15
The apparent relationship between increased NOx fumes with increasedrarefaction losses (provided detonation does occur) suggests the possiblealternative explanation for the observed difference between the theoreticaland experimental curves of figure 7. If rarefaction losses increase withdecreasing fuel concentration, as suggested by the observed decay rates andthe values of the detonation velocity approximately midway through the charge(figs. 10-11), then the increase in NOx because of this factor may be sufficient to shift the peak in the composition profile to lower fuel oil concentrations (for example, 1 to 2 pct). Unfortunately, this hypothesis cannot beevaluated much further experimentally since there are limitations on the sizeof charges that can be fired in the available laboratory tests.
FIGURE 10•• Variation of velocity decayconstant with variation inpercent fuel oil.
FIGURE 11 •• Variation of detonation velocity at 14 cm with variation In
percent of fuel oil.
22
CONCLUSIONS AND RECOMMENDATIONS
Several factors are clearly seen in the results of the current study.First, the Crawshaw~Jones and large closed-gallery tests lead to similar estimates of the NOx fumes produced by an explosive in the test condition andprobably in the mine condition. However, the use of the large closed-gallerytest apparently brings to light a problem in determining CO fumes, namely thatof obtaining meaningful data on CO yield. The oxidation of CO as the detonation products expand into the air has an appreciable effect on the observedvalues and interpretation of the data. Although air oxidation of CO alsooccurs under mine conditions, its extent would not be expected to be veryreproducible. Under these circumstances, it would seem that the best that canbe offered by any toxic fume test would be an accurate determination of themaximum amount of CO formed without air oxidation. An accurate determinationcould be accomplished in the large closed-gallery test if the air in theexpansion chamber were replaced by vacuum (as in the Crawshaw-Jones test) orby nitrogen. Unfortunately, such replacement would be difficult because ofthe excessive pumping and/or purging requirements. However, a chamber approximately seven times smaller than the current one could still allow expansionssufficient to minimize water condensation and possible wall loss of NOx ' Sucha chamber (~l04 1 or ~350 ft3
) would require only 10 1 of liquid Na per shotfor purging purposes.
Second, the possibility of predicting toxic fume production in simpleexplosives has been demonstrated. Although the "TIGER" calculations with theviria1 EOS were not in exact agreement with experimental values, they didindicate the trends observed with compositional variations, and they did yieldvalues of NOx which approximated the experimental results. Owing to postdetonation oxidation of CO during product expansion into air, the calculatedCO values could not be compared with the large gallery experimental values;however, reasonable agreement was obtained between the calculated and CrawshawJones values for CO. This agreement suggests the possibility that, even withthe current EOS, it may be possible to predict the maxUnum CO to be obtainedfrom a given explosive composition.
Third, the amount of toxic fumes from AN-FO depends upon the nonidea1detonation behavior of the explosive charge system. The ve10city~decay rateconstant was found to be a useful experimental parameter for correlating toxicfume production with the degree of nonidea1 detonation. This measurementshould be employed in toxic fume tests whenever the detonation properties ofexplosives are sensitive to confinement and size conditions. It might also bepointed out that from the viewpoint of increased explosive yield and lowertoxic fumes, pulverized AN-FO would be preferable to pri11ed AN-FO for use insmall diameter blasting.
23
REFERENCES
1. Andreyev, K. K, and A. F. Belyayer. Theory of Explosive Substances.Moscow (1960). English translation FTD-MT-64-242, 1966, p. 574; available from National Technical Information Services, Springfield, Va.,AD 643597.
2. Cook, M. A. Ch. in The Science of High Explosives. Reinhold PublishingCorp., New York, 1958, pp. 61-90.
3. Cowan, R. 0., and W. T. Ficket. Calculation of the Detonation Propertiesof Solid Explosives With the Kistiakowsky-Wilson Equation of State. J.Chem. Phys., v. 24, 1956, p. 932.
4. Dow Chemical Company, Thermal Research Laboratory. JANAF ThermodynamicTables. 1970, unpaged.
5. Fontijn, A., A. J. Sabadell, and R. J. Ronco.cent Measurement of Nitric Oxide With Ozone.pp. 575-579.
HomogeneousChemiluminesAnal. Chem., v. 42, 1970,
6. Gordon, S., and B. J. McBride. Computer Program for Calculation of Complex Chemical Equilibria Compositions, Rocket Performance, Incident andReflected Shocks, and Chapman-Jouquet Detonations. NASA SP-273, 1971,245 pp.
7. Harzt, D., A. Kirsch, ,H. Seidel, and E. Ulrich. Experimental Determination of the Volume and the Toxic Components of Fumes in a 10 m3 Chamber.14th Internat. Conf. Mine-Safety Research Establishments, Donetsk,U.S.S.R. (1971); Safety Mine Res. Establishment (England) TranslationNo. 6024.
8. Hirschfelder, J. 0., C. F. Curtiss, and R. B. Bird. Ch. in MolecularTheory of Gases and Liquids. John Wiley & Sons, Inc., New York, 1954,pp. 131-273.
9. Levine, H. B., and R. E. Sharples. Operator's Manual for Ruby. University of California, Lawrence Radiation Laboratory UCRL-68l5, 1962,123 pp.
10. Mason, C. M., and E. G. Aiken. Methods for Evaluating Explosives andHazardous Materials. BuMines IC 8541, 1971, 48 pp.
11. Newhall, H. K. Kinetics of Engine-Generated Nitrogen Oxides and CarbonMonoxide. 12th Internat. Symp. on Combustion, The Combustion Institute,Pittsburgh, Pa., 1969, pp. 603-613.
12. Quinot, E., and C. Claeys. Nitrous Fumes From the Gases of Mining Explosives (Abstract). Proc. 14th Internat. Congo Occupational Health,Madrid, v. 4, No. 288, 1963, pp. 961-964 (English translation).
24
13. Ribovich, J., R. W. Watson, and F. C. Gibson. Instrumented Card-Gap Test.AIAA J., v. 6, 1968, pp. 1260~1263.
14. Rossi, B. D. Control of Noxious Gases in Blasting Work, and New Methodsof Testing Industrial Explosives. Vzryvnoe De10 Collection No. 68/25,Izdate1'stvo '~edra" Moscow (1970), U.S. Department of Interior Translation TT 70-50163; available from National Technical InformationServices, Springfield, Va., I PST, Catalog No. 5836.
15. Sax, N. I. Dangerous Properties of Industrial Materials. Reinhold BookCorp., New York, 3d ed., 1968, pp. 822, 962, and 968.
16. Streng, A. G. Evaluation of Toxic After-Detonation Gases Formed byIndustrial Explosives. Explosivstoffe, No. 34, 1971, pp. 58-64.
17. Taylor, J. Detonation in Condensed Explosives. Oxford University Press,1952, 196 pp.
18. Tiffany, E., J. Murphy, and N. E. Hanna. Comparison of Poisonous GasesFrom Permissible Explosives as Obtained in Bichel-Gage and Coal-MineTests. BuMines RI 4663, 1950, 12 pp.
19. Tournay, W. E., E. J. Murphy, G. H. Damon, and R. W. Van Dolah. SomeStudies in-Ammonium Nitrate-Fuel Oil Compositions. Univ. Mo. SchoolMines and Met. Bull., Tech. Ser. No. 97, 1959, pp. 164-174.
20. Van Dolah, R. W., F. C. Gibson, and J. N. Murphy. Further Studies onSympathetic Detonation. BuMines RI 6903, 1966, 35 pp.
21. Sympathetic Detonation of Ammonium Nitrate and Ammonium Nitrate-Fuel Oil. BuMines RI 6746, 1966, 34 pp.
22. Van Do1ah, R. W., N. E. Hanna, E. J. Murphy, and G. H. Damon. FurtherStudies on Ammonium Nitrate-Fuel Oil Compositions. Univ. Mo. SchoolMines and Met. Bull., Tech. Ser. No. 91, 1956, pp. 90-101.
23. Van Do1ah, R. W., E. J. Murphy, and N. E. Hanna. Fumes From AmmoniumNitrate-Hydrocarbon Mixtures, ed. by G. B. Clark. Internat. Symp. onMin. Res., v. 1, Pergamon Press, New York, 1961, pp. 77-89.
24. Wiebenson, W. E., Jr., W. H. Zwis1er, L. B. Seely, and S. R. Brinkley,Jr. TIGER Computer Program Documentation. Stanford Res. Inst. Rept.on Contract DA-04-200-AMC-3226(x), 1968, 394 pp .
• u.s. GPO, 1974-705-457/598 INT.-BU.OF MINES,PGH.,PA. 1911<: