37
Toxicity Assessment of a Final Outfall Sample from the Albury Pulp Mill Norske Skog Paper Mills (Australia) Ltd Test Report May 2008

Toxicity Assessment of a Final Outfall Sample from the Albury Pulp Mill Norske Skog Paper Mills (Australia) Ltd
Test Report
May 2008

Toxicity Assessment of a Final Outfall Sample from the Albury Pulp Mill Norske Skog Paper Mills (Australia) Ltd
Test Report
May 2008

Toxicity Test Report: TR0365/1 (page 1 of 1) Client: Norske Skog Paper Mills (Australia) Ltd ESA Job #: PR0365 Technical Support & Development Date Sampled: 12 May 2008 Boyer TAS 7140 Date Received: 13 May 2008 Attention: Dr Des Richardson Sampled By: client Client Ref: None provided Quote#: PL0365_q01 Lab ID No.: Sample Name: Sample Description: 2715 NS Final Outfall Aqueous sample, pH 8.4, conductivity
1920µS/cm, total ammonia <2.0 mg/L, sample received chilled in bottles of sound condition
Test Performed: 48-hr acute (survival) toxicity test using the freshwater cladoceran
Ceriodaphnia cf dubia Test Protocol: ESA SOP 101, based on USEPA (2002) Deviations from Protocol: Nil Source of Test Organisms: ESA Laboratory culture Test Initiated: 13 May 2008 at 1530h Sample 2715: NS Final Outfall Vacant Vacant Concentration
(%) % Survival (at 24 hr)
0 (control) 100 ± 0.0 6.25 100 ± 0.0 12.5 100 ± 0.0 25 100 ± 0.0 50 100 ± 0.0
100 100 ± 0.0 48 hr EC50 = >100% NOEC = 100% LOEC = >100%
The sample was not acutely toxic to the cladoceran Ceriodaphnia dubia (Steel’s Many-One Rank Test, 1 tailed, P=0.05) QA/QC Parameter Criterion This Test Criterion met? Control minimum % survival >90 % 100% Yes Test Temperature limits 25.0 ± 1 ºC 25.0-25.5ºC Yes Reference Toxicant within cusum chart limits 193.2-213.6mg KCl/L 212.1mg KCl/L Yes
Test Report Authorised by: Dr Rick Krassoi, Director on 26 May 2008 Results are based on the samples in the condition as received by ESA
NATA Accredited Laboratory Number: 14709 The tests, calibrations or methods covered by this document have been performed in accordance with NATA requirements which include the requirements of ISO/IEC 17025 and are traceable to Australian national standards of measurement. This document shall not be reproduced except in full.

Toxicity Test Report: TR0365/2 (page 1 of 1) Client: Norske Skog Paper Mills (Australia) Ltd ESA Job #: PR0365 Technical Support & Development Date Sampled: 12 May 2008 Boyer TAS 7140 Date Received: 13 May 2008 Attention: Dr Des Richardson Sampled By: client Client Ref: None provided Quote#: PL0365_q01 Lab ID No.: Sample Name: Sample Description: 2715 NS Final Outfall Aqueous sample, pH 8.4, conductivity
1920µS/cm, total ammonia <2.0 mg/L, sample received chilled in bottles of sound condition
Test Performed: 7-day partial life-cycle (chronic) toxicity test using the freshwater
cladoceran Ceriodaphnia cf dubia Test Protocol: ESA SOP 101, based on USEPA (2002) Deviations from Protocol: Nil Source of Test Organisms: ESA Laboratory culture Test Initiated: 13 May 2008 at 1530h Sample 2715: NS Final Outfall Sample 2715: NS Final Outfall Vacant Concentration
(%) % Survival (at 7 days)
Concentration (%)
Number of Young
(Mean ± SD)
0 (control) 90.0 ± 31.6 0 (control) 16.0 ± 6.5 6.25 100 ± 0.0 6.25 26.4 ± 3.7 12.5 100 ± 0.0 12.5 31.6 ± 4.9 25 100 ± 0.0 25 32.3 ± 4.0 50 100 ± 0.0 50 34.8 ± 2.0
100 90.0 ± 31.6 100 28.7 ± 11.2 7 day EC50 (survival) = >100% NOEC = 100% LOEC = >100%
7 day EC50 (reproduction) = >100% NOEC = 100% LOEC = >100%
The sample was not chronically toxic to the cladoceran Ceriodaphnia dubia (Bonferroni t test, 1 tailed, P=0.05, df=5,51) QA/QC Parameter Criterion This Test Criterion met? Control minimum % survival >80 % 90.0% Yes Control mean number of young >15 16.0 Test Temperature limits 25.0 ± 1 ºC 24.0-26.0ºC Yes Reference Toxicant within cusum chart limits 96.2-332.7mg KCl/L 223.2mg KCl/L Yes
Test Report Authorised by: Dr Rick Krassoi, Director on 26 May 2008 Results are based on the samples in the condition as received by ESA
NATA Accredited Laboratory Number: 14709 The tests, calibrations or methods covered by this document have been performed in accordance with NATA requirements which include the requirements of ISO/IEC 17025 and are traceable to Australian national standards of measurement. This document shall not be reproduced except in full.

Toxicity Test Report: TR0365/3 (page 1 of 1) Client: Norske Skog Paper Mills (Australia) Ltd ESA Job #: PR0365 Technical Support & Development Date Sampled: 12 May 2008 Boyer TAS 7140 Date Received: 13 May 2008 Attention: Dr Des Richardson Sampled By: client Client Ref: None provided Quote#: PL0365_q01 Lab ID No.: Sample Name: Sample Description: 2715 NS Final Outfall Aqueous sample, pH 8.4, conductivity
1920µS/cm, total ammonia <2.0 mg/L, sample received chilled in bottles of sound condition
Test Performed: 72-hour growth inhibition (chronic) test using the freshwater unicellular
green alga Selenastrum capricornutum (Raphidocellus subcapitata) Test Protocol: USEPA OPPTS 840.5400 and USEPA Method 1003.0 Deviations from Protocol: None. USEPA Media prepared without EDTA. A colour-matched
control was not considered necessary owing to the pale colour of the sample
Source of Test Organisms: CSIRO Culture CS-327 (axenic laboratory culture) Test Initiated: 13 May 2008 at 1330h Summary of Test Method: The test temperature was 25 ± 1 oC. The test vessels were 20mL borosilicate glass scintillation vials with 20mL test solution. There were 4 replicate vessels per treatment. The initial cell density was 10,000 cells/ mL, determined by haemocytometer counts. Cell densities were enumerated at 72 hours by haemocytometer counts. The test vessels were shaken by hand 2 times per day. Sample 2715: NS Final Outfall Vacant Vacant Concentration
(%) Cell Density
(x104 cells/mL)
0 (control) 31.6 ± 3.1 6.25 29.3 ± 5.3 12.5 37.5 ± 4.6 25 41.1 ± 2.7 50 46.0 ± 2.7
100 41.2 ± 4.9 72 hr IC50 = >100% NOEC = 100% LOEC = >100%
The sample was not toxic to the freshwater alga Selenastrum capricornutum (Dunnett’s Test, 2-tailed, P=0.05). QA/QC Parameter Criterion This Test Criterion met? Control minimum cell density >20,000 cells/mL 31,600 Yes Test Temperature limits 25.0 ± 1 ºC 25.0-26.0ºC Yes Reference Toxicant within cusum chart limits 0.25-0.44 µg Cu2+/L 0.36µg Cu2+/L Yes
Test Report Authorised by: Dr Rick Krassoi, Director on 26 May 2008 Results are based on the samples in the condition as received by ESA This document shall not be reproduced except in full.

Toxicity Test Report: TR0365/4 (page 1 of 1) Client: Norske Skog Paper Mills (Australia) Ltd ESA Job #: PR0365 Technical Support & Development Date Sampled: 12 May 2008 Boyer TAS 7140 Date Received: 13 May 2008 Attention: Dr Des Richardson Sampled By: client Client Ref: None provided Quote#: PL0365_q01 Lab ID No.: Sample Name: Sample Description: 2715 NS Final Outfall Aqueous sample, pH 8.4, conductivity
1920µS/cm, total ammonia <2.0 mg/L, sample received chilled in bottles of sound condition
Test Performed: 96-h Fish Imbalance Test using the larvae of the Eastern Rainbowfish
Melanotaenia splendida Test Protocol: ESA SOP 117, based on USEPA (2002) Deviations from Protocol: None. Source of Test Organisms: ESA Laboratory culture, sourced from Queensland Hatchery. Test Initiated: 13 May 2008 at 1500 h Sample 2715: NS Final Outfall Vacant Vacant Concentration
(%) % Un-affected
(at 96 hr)
0 (control) 100 ± 0.0 6.25 70.0 ± 47.6* 12.5 95.0 ± 10.0 25 90.0 ± 20.0 50 95.0 ± 10.0
100 100 ± 0.0 96 hr EC50 (Imbalance) = >100% NOEC = 100% LOEC = >100%
The sample did not exhibit toxicity (expressed as loss of balance) to Melanotaenia splendida over the 96 hour exposure period. * The mean % un-affected for the 6.25% treatment was reduced to 70% by the loss of balance of all fish in a single replicate vessel, most likely due to the depletion of oxygen caused by the inadvertent death of one fish. The percent saturation of dissolved oxygen was determined to be 32% in this affected replicate vessel. QA/QC Parameter Criterion This Test Criterion met? Control % survival >90 % 100% Yes Test Temperature limits 25.0 ± 1oC 25.0-26.0ºC Yes Reference Toxicant within cusum chart limits 0.21-0.60 mg Cu2+/L 0.25 mg Cu2+/L Yes
Test Report Authorised by: Dr Rick Krassoi Director, on 26 May 2008 Results are based on the samples in the condition as received by ESA This document shall not be reproduced except in full.

Page 1 of 14
Centre for Environmental Contaminants Research Lucas Heights Science and Technology Centre New Illawarra Road, Lucas Heights, NSW Private Mail Bag 7, Bangor, NSW, 2234, Australia Telephone 61 2 9710 6812 Fax 61 2 9710 6837
Microtox® Test Report – 08074M Client: Ecotox Services Australasia Project: Ecotox Services Australasia (Norske-Skog) Test Performed: Microtox® Test using the bacteria Vibrio fischeri Samples Collected: 12/5/08 Samples Received: 13/5/08 Test Initiated: 13/5/08 CSIRO Sample No. Sample Name Sample Description E08074 NS Outfall Liquid
Sample Physico-Chemistry and Preparation: The salinity of the sample as received was 1.0‰, while the pH was 8.2. The sample was centrifuged prior to testing to remove particulates.
Sample Physico-chemistry Comments pH ‰ mS/cm DO (%) E08074 (As received) 8.22 1.0 2.0 63 Light brown coloured solution E08074 (Centrifuged) 8.27 1.0 1.9 82 Light brown coloured solution ‰ = Salinity; mS/cm = Conductivity; DO = dissolved oxygen Test Method: This test measures the decrease in light output of the marine bacterium Vibrio fischeri after exposure to the sample for 5-, 15- and 30-min. The toxicity is expressed as the concentration of sample that causes a 50% reduction in the light output of the bacteria (EC50 value). The lower the EC50, the more toxic the sample. The 90% Test Protocol was used, with MOAS adjustment (Azur Environmental, 1998). Eight concentrations of each sample (27-90%) were tested (each in duplicate) using 2% NaCl as the diluent and control water. Exposure duration was 5, 15 and 30 minutes. The lowest observable effect (LOEC) and no observable effect (NOEC) concentrations were calculated using Bonferroni’s t-test (ToxCalc Version 5.0.23, Tidepool Software). Phenol was also tested for quality assurance purposes.

Page 2 of 14
Results: The NS Outfall sample was not toxic to the bacterium, with no significant inhibition observed at any concentration tested. There was, however, significant stimulation (2-13% stimulation) of light output in most test concentrations following exposure for 5, 15 and 30 minutes. Sample EC50 (%) LOEC (%) NOEC (%) 5-min 15-min 30-min 5-min 15-min 30-min 5-min 15-min 30-min NS Outfall >82 >82 >82 >82 >82 >82 82 82 82 Quality Assurance/Quality Control Criterion This Test Criterion Met? Reference toxicant 5-, 15-, 30- min EC50 (Phenol, mg/L) 13-26 17, 18, 19 Yes Comments: References:
Azur Environmental (1998) Microtox® acute toxicity test (Microtox® Manual). Azur Environmental, Carlsbad, CA, USA.
Test carried out by: Monique Binet, Anthony Platts-Baggs Test report prepared by: Monique Binet Experimental Scientist (ph: 02 9710 6812) Test report authorised by: Jenny Stauber Senior Principal Research Scientist (ph: 02 9710 6808) Date: 16/5/08

Chain-of-Custody Documentation


Statistical Printouts for the Acute Test with Ceriodaphnia dubia

Ceriodaphnia Survival and Reproduction Test-48 Hr SurvivalStart Date: 13/05/2008 15:30 Test ID: PR365/1 Sample ID: NS Final OutfallEnd Date: 15/05/2008 15:30 Lab ID: 2715 Sample Type: EFF2-IndustrialSample Date: 12/05/2008 08:45 Protocol: 101-ESA SOP101 Test Species: CD-Ceriodaphnia dubiaComments:
Conc-% 1 2 3 4DMW-Control 1.0000 1.0000 1.0000 1.0000
6.25 1.0000 1.0000 1.0000 1.000012.5 1.0000 1.0000 1.0000 1.0000
25 1.0000 1.0000 1.0000 1.000050 1.0000 1.0000 1.0000 1.0000
100 1.0000 1.0000 1.0000 1.0000
Transform: Arcsin Square Root Rank 1-Tailed IsotoConc-% Mean N-Mean Mean Min Max CV% N Sum Critical Mean
DMW-Control 1.0000 1.0000 1.3453 1.3453 1.3453 0.000 4 1.00006.25 1.0000 1.0000 1.3453 1.3453 1.3453 0.000 4 18.00 10.00 1.000012.5 1.0000 1.0000 1.3453 1.3453 1.3453 0.000 4 18.00 10.00 1.0000
25 1.0000 1.0000 1.3453 1.3453 1.3453 0.000 4 18.00 10.00 1.000050 1.0000 1.0000 1.3453 1.3453 1.3453 0.000 4 18.00 10.00 1.0000
100 1.0000 1.0000 1.3453 1.3453 1.3453 0.000 4 18.00 10.00 1.0000
Auxiliary Tests Statistic Critical SkewShapiro-Wilk's Test indicates normal distribution (p > 0.01) 1 0.884Equality of variance cannot be confirmedHypothesis Test (1-tail, 0.05) NOEC LOEC ChV TUSteel's Many-One Rank Test 100 >100 1
Log-Logit Interpolation (200 Resamples)Point % SD 95% CL(Exp) SkewIC05 >100IC10 >100IC15 >100IC20 >100IC25 >100IC40 >100IC50 >100
0.0
0.1
0.2
0.3
0.4
0.5
0.6
0.7
0.8
0.9
1.0
1 10 100
Dose %
Res
pons
e
Page 1 ToxCalc v5.0.23 Reviewed by:_____

Ceriodaphnia Survival and Reproduction Test-48 Hr SurvivalStart Date: 13/05/2008 15:30 Test ID: PR365/1 Sample ID: NS Final OutfallEnd Date: 15/05/2008 15:30 Lab ID: 2715 Sample Type: EFF2-IndustrialSample Date: 12/05/2008 08:45 Protocol: 101-ESA SOP101 Test Species: CD-Ceriodaphnia dubiaComments:
Auxiliary Data SummaryConc-% Parameter Mean Min Max SD CV% N
DMW-Control % survival 100.00 100.00 100.00 0.00 0.00 46.25 100.00 100.00 100.00 0.00 0.00 412.5 100.00 100.00 100.00 0.00 0.00 4
25 100.00 100.00 100.00 0.00 0.00 450 100.00 100.00 100.00 0.00 0.00 4
100 100.00 100.00 100.00 0.00 0.00 4DMW-Control Temp C 25.00 25.00 25.00 0.00 0.00 1
6.25 25.00 25.00 25.00 0.00 0.00 112.5 25.00 25.00 25.00 0.00 0.00 1
25 25.00 25.00 25.00 0.00 0.00 150 25.00 25.00 25.00 0.00 0.00 1
100 25.00 25.00 25.00 0.00 0.00 1DMW-Control pH 8.30 8.30 8.30 0.00 0.00 1
6.25 8.40 8.40 8.40 0.00 0.00 112.5 8.40 8.40 8.40 0.00 0.00 1
25 8.30 8.30 8.30 0.00 0.00 150 8.30 8.30 8.30 0.00 0.00 1
100 8.30 8.30 8.30 0.00 0.00 1DMW-Control Cond uS/cm 170.00 170.00 170.00 0.00 0.00 1
6.25 312.00 312.00 312.00 0.00 0.00 112.5 441.00 441.00 441.00 0.00 0.00 1
25 679.00 679.00 679.00 0.00 0.00 150 1124.00 1124.00 1124.00 0.00 0.00 1
100 1923.00 1923.00 1923.00 0.00 0.00 1DMW-Control DO %sat 100.20 100.20 100.20 0.00 0.00 1
6.25 100.80 100.80 100.80 0.00 0.00 112.5 100.30 100.30 100.30 0.00 0.00 1
25 99.90 99.90 99.90 0.00 0.00 150 98.80 98.80 98.80 0.00 0.00 1
100 81.80 81.80 81.80 0.00 0.00 1
Page 2 ToxCalc v5.0.23 Reviewed by:_____

Statistical Printouts for the 7-d Chronic Test with Ceriodaphnia dubia

Ceriodaphnia Survival and Reproduction Test-7 Day SurvivalStart Date: 13/05/2008 15:30 Test ID: PR365/2 Sample ID: NS Final OutfallEnd Date: 20/05/2008 16:00 Lab ID: 2715 Sample Type: EFF2-IndustrialSample Date: 12/05/2008 08:45 Protocol: 102-ESA SOP102 Test Species: CD-Ceriodaphnia dubiaComments:
Conc-% 1 2 3 4 5 6 7 8 9 10DMW-Control 1.0000 0.0000 1.0000 1.0000 1.0000 1.0000 1.0000 1.0000 1.0000 1.0000
6.25 1.0000 1.0000 1.0000 1.0000 1.0000 1.0000 1.0000 1.0000 1.0000 1.000012.5 1.0000 1.0000 1.0000 1.0000 1.0000 1.0000 1.0000 1.0000 1.0000 1.0000
25 1.0000 1.0000 1.0000 1.0000 1.0000 1.0000 1.0000 1.0000 1.0000 1.000050 1.0000 1.0000 1.0000 1.0000 1.0000 1.0000 1.0000 1.0000 1.0000 1.0000
100 0.0000 1.0000 1.0000 1.0000 1.0000 1.0000 1.0000 1.0000 1.0000 1.0000
Not Fisher's 1-Tailed IsotoConc-% Mean N-Mean Resp Resp Total N Exact P Critical Mean
DMW-Control 0.9000 1.0000 1 9 10 10 0.98006.25 1.0000 1.1111 0 10 10 10 0.5000 0.0500 0.980012.5 1.0000 1.1111 0 10 10 10 0.5000 0.0500 0.9800
25 1.0000 1.1111 0 10 10 10 0.5000 0.0500 0.980050 1.0000 1.1111 0 10 10 10 0.5000 0.0500 0.9800
100 0.9000 1.0000 1 9 10 10 0.7632 0.0500 0.9000
Hypothesis Test (1-tail, 0.05) NOEC LOEC ChV TUFisher's Exact Test 100 >100 1
Log-Logit Interpolation (200 Resamples)Point % SD 95% CL SkewIC05 84.785IC10 >100IC15 >100IC20 >100IC25 >100IC40 >100IC50 >100
-0.2
-0.1
0.0
0.1
0.2
0.3
0.4
0.5
0.6
0.7
0.8
0.9
1.0
1 10 100
Dose %
Res
pons
e
Page 1 ToxCalc v5.0.23 Reviewed by:_____

Ceriodaphnia Survival and Reproduction Test-7 Day SurvivalStart Date: 13/05/2008 15:30 Test ID: PR365/2 Sample ID: NS Final OutfallEnd Date: 20/05/2008 16:00 Lab ID: 2715 Sample Type: EFF2-IndustrialSample Date: 12/05/2008 08:45 Protocol: 102-ESA SOP102 Test Species: CD-Ceriodaphnia dubiaComments:
Auxiliary Data SummaryConc-% Parameter Mean Min Max SD CV% N
DMW-Control % survival 90.00 0.00 100.00 31.62 6.25 106.25 100.00 100.00 100.00 0.00 0.00 1012.5 100.00 100.00 100.00 0.00 0.00 10
25 100.00 100.00 100.00 0.00 0.00 1050 100.00 100.00 100.00 0.00 0.00 10
100 90.00 0.00 100.00 31.62 6.25 10DMW-Control Temp C 25.00 25.00 25.00 0.00 0.00 1
6.25 25.00 25.00 25.00 0.00 0.00 112.5 25.00 25.00 25.00 0.00 0.00 1
25 25.00 25.00 25.00 0.00 0.00 150 25.00 25.00 25.00 0.00 0.00 1
100 25.00 25.00 25.00 0.00 0.00 1DMW-Control pH 8.30 8.30 8.30 0.00 0.00 1
6.25 8.50 8.50 8.50 0.00 0.00 112.5 8.60 8.60 8.60 0.00 0.00 1
25 8.60 8.60 8.60 0.00 0.00 150 8.60 8.60 8.60 0.00 0.00 1
100 8.50 8.50 8.50 0.00 0.00 1DMW-Control Cond uS/cm 170.00 170.00 170.00 0.00 0.00 1
6.25 312.00 312.00 312.00 0.00 0.00 112.5 441.00 441.00 441.00 0.00 0.00 1
25 679.00 679.00 679.00 0.00 0.00 150 1124.00 1124.00 1124.00 0.00 0.00 1
100 1423.00 1423.00 1423.00 0.00 0.00 1DMW-Control DO %sat 100.20 100.20 100.20 0.00 0.00 1
6.25 100.80 100.80 100.80 0.00 0.00 112.5 100.30 100.30 100.30 0.00 0.00 1
25 99.90 99.90 99.90 0.00 0.00 150 98.80 98.80 98.80 0.00 0.00 1
100 81.80 81.80 81.80 0.00 0.00 1
Page 2 ToxCalc v5.0.23 Reviewed by:_____

Ceriodaphnia Survival and Reproduction Test-ReproductionStart Date: 13/05/2008 15:30 Test ID: PR365/3 Sample ID: NS Final OutfallEnd Date: 20/05/2008 16:00 Lab ID: 2715 Sample Type: EFF2-IndustrialSample Date: 12/05/2008 08:45 Protocol: 102-ESA SOP102 Test Species: CD-Ceriodaphnia dubiaComments:
Conc-% 1 2 3 4 5 6 7 8 9 10DMW-Control 24.000 0.000 20.000 16.000 16.000 20.000 20.000 12.000 16.000 16.000
6.25 28.000 28.000 24.000 28.000 24.000 26.000 30.000 22.000 33.000 21.00012.5 31.000 26.000 21.000 32.000 34.000 34.000 38.000 32.000 32.000 36.000
25 35.000 31.000 35.000 32.000 31.000 35.000 31.000 30.000 24.000 39.00050 35.000 34.000 34.000 36.000 34.000 40.000 34.000 34.000 33.000 34.000
100 35.000 37.000 26.000 30.000 35.000 33.000 38.000 31.000 22.000 0.000
Transform: Untransformed Rank 1-Tailed IsotoConc-% Mean N-Mean Mean Min Max CV% N Sum Critical Mean
DMW-Control 16.000 1.0000 16.000 0.000 24.000 40.825 10 28.3006.25 26.400 1.6500 26.400 21.000 33.000 14.083 10 152.00 75.00 28.30012.5 31.600 1.9750 31.600 21.000 38.000 15.517 10 154.00 75.00 28.300
25 32.300 2.0188 32.300 24.000 39.000 12.474 10 154.50 75.00 28.30050 34.800 2.1750 34.800 33.000 40.000 5.715 10 155.00 75.00 28.300
100 28.700 1.7938 28.700 0.000 38.000 39.148 10 144.50 75.00 28.300
Auxiliary Tests Statistic Critical SkewKolmogorov D Test indicates non-normal distribution (p <= 0.01) 1.406229 1.035 -2.27746Bartlett's Test indicates unequal variances (p = 3.75E-05) 27.93536 15.08627Hypothesis Test (1-tail, 0.05) NOEC LOEC ChV TUSteel's Many-One Rank Test 100 >100 1
Linear Interpolation (200 Resamples)Point % SD 95% CL SkewIC05 >100IC10 >100IC15 >100IC20 >100IC25 >100IC40 >100IC50 >100
-1.3-1.2-1.1-1.0-0.9-0.8-0.7-0.6-0.5-0.4-0.3-0.2-0.10.00.10.20.30.40.50.60.70.80.91.0
0 50 100 150
Dose %
Res
pons
e
Page 1 ToxCalc v5.0.23 Reviewed by:_____

Ceriodaphnia Survival and Reproduction Test-ReproductionStart Date: 13/05/2008 15:30 Test ID: PR365/3 Sample ID: NS Final OutfallEnd Date: 20/05/2008 16:00 Lab ID: 2715 Sample Type: EFF2-IndustrialSample Date: 12/05/2008 08:45 Protocol: 102-ESA SOP102 Test Species: CD-Ceriodaphnia dubiaComments:
Auxiliary Data SummaryConc-% Parameter Mean Min Max SD CV% N
DMW-Control # young 16.00 0.00 24.00 6.53 15.97 106.25 26.40 21.00 33.00 3.72 7.30 1012.5 31.60 21.00 38.00 4.90 7.01 10
25 32.30 24.00 39.00 4.03 6.21 1050 34.80 33.00 40.00 1.99 4.05 10
100 28.70 0.00 38.00 11.24 11.68 10DMW-Control Temp C 25.00 25.00 25.00 0.00 0.00 1
6.25 25.00 25.00 25.00 0.00 0.00 112.5 25.00 25.00 25.00 0.00 0.00 1
25 25.00 25.00 25.00 0.00 0.00 150 25.00 25.00 25.00 0.00 0.00 1
100 25.00 25.00 25.00 0.00 0.00 1DMW-Control pH 8.30 8.30 8.30 0.00 0.00 1
6.25 8.50 8.50 8.50 0.00 0.00 112.5 8.60 8.60 8.60 0.00 0.00 1
25 8.60 8.60 8.60 0.00 0.00 150 8.60 8.60 8.60 0.00 0.00 1
100 8.50 8.50 8.50 0.00 0.00 1DMW-Control Cond uS/cm 170.00 170.00 170.00 0.00 0.00 1
6.25 312.00 312.00 312.00 0.00 0.00 112.5 441.00 441.00 441.00 0.00 0.00 1
25 679.00 679.00 679.00 0.00 0.00 150 1124.00 1124.00 1124.00 0.00 0.00 1
100 1423.00 1423.00 1423.00 0.00 0.00 1DMW-Control DO %sat 100.20 100.20 100.20 0.00 0.00 1
6.25 100.80 100.80 100.80 0.00 0.00 112.5 100.30 100.30 100.30 0.00 0.00 1
25 99.90 99.90 99.90 0.00 0.00 150 98.80 98.80 98.80 0.00 0.00 1
100 81.80 81.80 81.80 0.00 0.00 1
Page 2 ToxCalc v5.0.23 Reviewed by:_____

Statistical Printouts for the Selenastrum Growth Inhibition Tests

Phytoplankton Test-Growth-Cell DensityStart Date: 13/05/2008 13:30 Test ID: PR365/5 Sample ID: NS Final OutfallEnd Date: 16/05/2008 13:30 Lab ID: 2715 Sample Type: EFF2-IndustrialSample Date: 12/05/2008 08:45 Protocol: 103-ESA SOP103 Test Species: SC-Selenastrum capricornutumComments:
Conc-% 1 2 3 4DMW-Control 327000 270000 330000 337000
6.25 330000 230000 287000 35000012.5 367000 417000 403000 313000
25 377000 403000 437000 42700050 427000 493000 463000 457000
100 343000 433000 457000 413000
Transform: Untransformed 1-Tailed IsotoConc-% Mean N-Mean Mean Min Max CV% N t-Stat Critical MSD Mean
DMW-Control 316000 1.0000 316000 270000 337000 9.795 4 378791.76.25 299250 0.9470 299250 230000 350000 17.753 4 0.586 2.410 68838.39 378791.712.5 375000 1.1867 375000 313000 417000 12.371 4 -2.066 2.410 68838.39 378791.7
25 411000 1.3006 411000 377000 437000 6.517 4 -3.326 2.410 68838.39 378791.750 460000 1.4557 460000 427000 493000 5.882 4 -5.041 2.410 68838.39 378791.7
100 411500 1.3022 411500 343000 457000 11.927 4 -3.343 2.410 68838.39 378791.7
Auxiliary Tests Statistic Critical SkewShapiro-Wilk's Test indicates normal distribution (p > 0.01) 0.927964 0.884 -0.66141Bartlett's Test indicates equal variances (p = 0.78) 2.501499 15.08627Hypothesis Test (1-tail, 0.05) NOEC LOEC ChV TU MSDu MSDp MSB MSE F-ProbDunnett's Test 100 >100 1 68838.39 0.217843 1.52E+10 1.63E+09 1.6E-04
Linear Interpolation (200 Resamples)Point % SD 95% CL(Exp) SkewIC05 >100IC10 >100IC15 >100IC20 >100IC25 >100IC40 >100IC50 >100
-0.6-0.5-0.4-0.3-0.2-0.10.00.10.20.30.40.50.60.70.80.91.0
0 50 100 150
Dose %
Res
pons
e
Page 1 ToxCalc v5.0.23 Reviewed by:_____
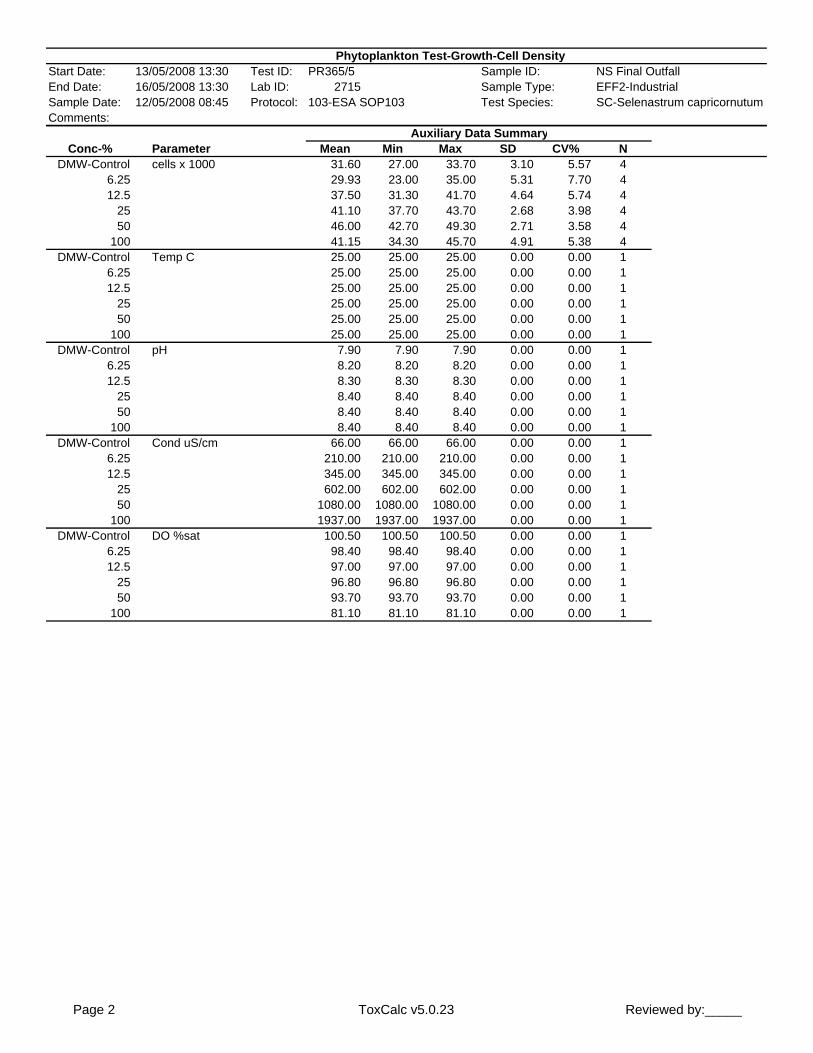
Phytoplankton Test-Growth-Cell DensityStart Date: 13/05/2008 13:30 Test ID: PR365/5 Sample ID: NS Final OutfallEnd Date: 16/05/2008 13:30 Lab ID: 2715 Sample Type: EFF2-IndustrialSample Date: 12/05/2008 08:45 Protocol: 103-ESA SOP103 Test Species: SC-Selenastrum capricornutumComments:
Auxiliary Data SummaryConc-% Parameter Mean Min Max SD CV% N
DMW-Control cells x 1000 31.60 27.00 33.70 3.10 5.57 46.25 29.93 23.00 35.00 5.31 7.70 412.5 37.50 31.30 41.70 4.64 5.74 4
25 41.10 37.70 43.70 2.68 3.98 450 46.00 42.70 49.30 2.71 3.58 4
100 41.15 34.30 45.70 4.91 5.38 4DMW-Control Temp C 25.00 25.00 25.00 0.00 0.00 1
6.25 25.00 25.00 25.00 0.00 0.00 112.5 25.00 25.00 25.00 0.00 0.00 1
25 25.00 25.00 25.00 0.00 0.00 150 25.00 25.00 25.00 0.00 0.00 1
100 25.00 25.00 25.00 0.00 0.00 1DMW-Control pH 7.90 7.90 7.90 0.00 0.00 1
6.25 8.20 8.20 8.20 0.00 0.00 112.5 8.30 8.30 8.30 0.00 0.00 1
25 8.40 8.40 8.40 0.00 0.00 150 8.40 8.40 8.40 0.00 0.00 1
100 8.40 8.40 8.40 0.00 0.00 1DMW-Control Cond uS/cm 66.00 66.00 66.00 0.00 0.00 1
6.25 210.00 210.00 210.00 0.00 0.00 112.5 345.00 345.00 345.00 0.00 0.00 1
25 602.00 602.00 602.00 0.00 0.00 150 1080.00 1080.00 1080.00 0.00 0.00 1
100 1937.00 1937.00 1937.00 0.00 0.00 1DMW-Control DO %sat 100.50 100.50 100.50 0.00 0.00 1
6.25 98.40 98.40 98.40 0.00 0.00 112.5 97.00 97.00 97.00 0.00 0.00 1
25 96.80 96.80 96.80 0.00 0.00 150 93.70 93.70 93.70 0.00 0.00 1
100 81.10 81.10 81.10 0.00 0.00 1
Page 2 ToxCalc v5.0.23 Reviewed by:_____

Statistical Printouts for the Larval Fish Imbalance Tests

Fish Imbalance Test-96 Hr SurvivalStart Date: 13/05/2008 15:00 Test ID: pr365/7 Sample ID: NS Final OutfallEnd Date: 17/05/2008 15:00 Lab ID: 2715 Sample Type: EFF2-IndustrialSample Date: 12/05/2008 Protocol: 117-ESA SOP117 Test Species: MX-Melanotaenia splendidaComments:
Conc-% 1 2 3 4D-Control 1.0000 1.0000 1.0000 1.0000
6.25 0.8000 0.0000 1.0000 1.000012.5 1.0000 0.8000 1.0000 1.0000
25 1.0000 1.0000 0.6000 1.000050 1.0000 1.0000 0.8000 1.0000
100 1.0000 1.0000 1.0000 1.0000
Transform: Arcsin Square Root Rank 1-Tailed IsotoConc-% Mean N-Mean Mean Min Max CV% N Sum Critical Mean
D-Control 1.0000 1.0000 1.3453 1.3453 1.3453 0.000 4 1.00006.25 0.7000 0.7000 1.0058 0.2255 1.3453 52.910 4 14.00 10.00 0.900012.5 0.9500 0.9500 1.2857 1.1071 1.3453 9.261 4 16.00 10.00 0.9000
25 0.9000 0.9000 1.2305 0.8861 1.3453 18.660 4 16.00 10.00 0.900050 0.9500 0.9500 1.2857 1.1071 1.3453 9.261 4 16.00 10.00 0.9000
100 1.0000 1.0000 1.3453 1.3453 1.3453 0.000 4 18.00 10.00 0.9000
Auxiliary Tests Statistic Critical SkewShapiro-Wilk's Test indicates non-normal distribution (p <= 0.01) 0.762041 0.884 -2.02527Equality of variance cannot be confirmedHypothesis Test (1-tail, 0.05) NOEC LOEC ChV TUSteel's Many-One Rank Test 100 >100 1
Log-Logit Interpolation (200 Resamples)Point % SD 95% CL(Exp) SkewIC05* 4.8705IC10 >100IC15 >100IC20 >100IC25 >100IC40 >100IC50 >100* indicates IC estimate less than the lowest concentration
0.0
0.1
0.2
0.3
0.4
0.5
0.6
0.7
0.8
0.9
1.0
1 10 100
Dose %
Res
pons
e
Page 1 ToxCalc v5.0.23 Reviewed by:_____

Fish Imbalance Test-96 Hr SurvivalStart Date: 13/05/2008 15:00 Test ID: pr365/7 Sample ID: NS Final OutfallEnd Date: 17/05/2008 15:00 Lab ID: 2715 Sample Type: EFF2-IndustrialSample Date: 12/05/2008 Protocol: 117-ESA SOP117 Test Species: MX-Melanotaenia splendidaComments:
Auxiliary Data SummaryConc-% Parameter Mean Min Max SD CV% N
D-Control % UN-AFFECTED 100.00 100.00 100.00 0.00 0.00 46.25 70.00 0.00 100.00 47.61 9.86 412.5 95.00 80.00 100.00 10.00 3.33 4
25 90.00 60.00 100.00 20.00 4.97 450 95.00 80.00 100.00 10.00 3.33 4
100 100.00 100.00 100.00 0.00 0.00 4D-Control Temp C 25.00 25.00 25.00 0.00 0.00 1
6.25 25.00 25.00 25.00 0.00 0.00 112.5 25.00 25.00 25.00 0.00 0.00 1
25 25.00 25.00 25.00 0.00 0.00 150 25.00 25.00 25.00 0.00 0.00 1
100 25.00 25.00 25.00 0.00 0.00 1D-Control pH 8.00 8.00 8.00 0.00 0.00 1
6.25 8.20 8.20 8.20 0.00 0.00 112.5 8.20 8.20 8.20 0.00 0.00 1
25 8.20 8.20 8.20 0.00 0.00 150 8.20 8.20 8.20 0.00 0.00 1
100 8.10 8.10 8.10 0.00 0.00 1D-Control Cond uS/cm 175.00 175.00 175.00 0.00 0.00 1
6.25 295.00 295.00 295.00 0.00 0.00 112.5 416.00 416.00 416.00 0.00 0.00 1
25 657.00 657.00 657.00 0.00 0.00 150 1087.00 1087.00 1087.00 0.00 0.00 1
100 1927.00 1927.00 1927.00 0.00 0.00 1D-Control DO %sat 99.90 99.90 99.90 0.00 0.00 1
6.25 99.80 99.80 99.80 0.00 0.00 112.5 98.70 98.70 98.70 0.00 0.00 1
25 98.20 98.20 98.20 0.00 0.00 150 98.80 98.80 98.80 0.00 0.00 1
100 102.10 102.10 102.10 0.00 0.00 1
Page 2 ToxCalc v5.0.23 Reviewed by:_____

Statistical Printouts for the Acute Microtox® Toxicity Tests
Page 3 of 14
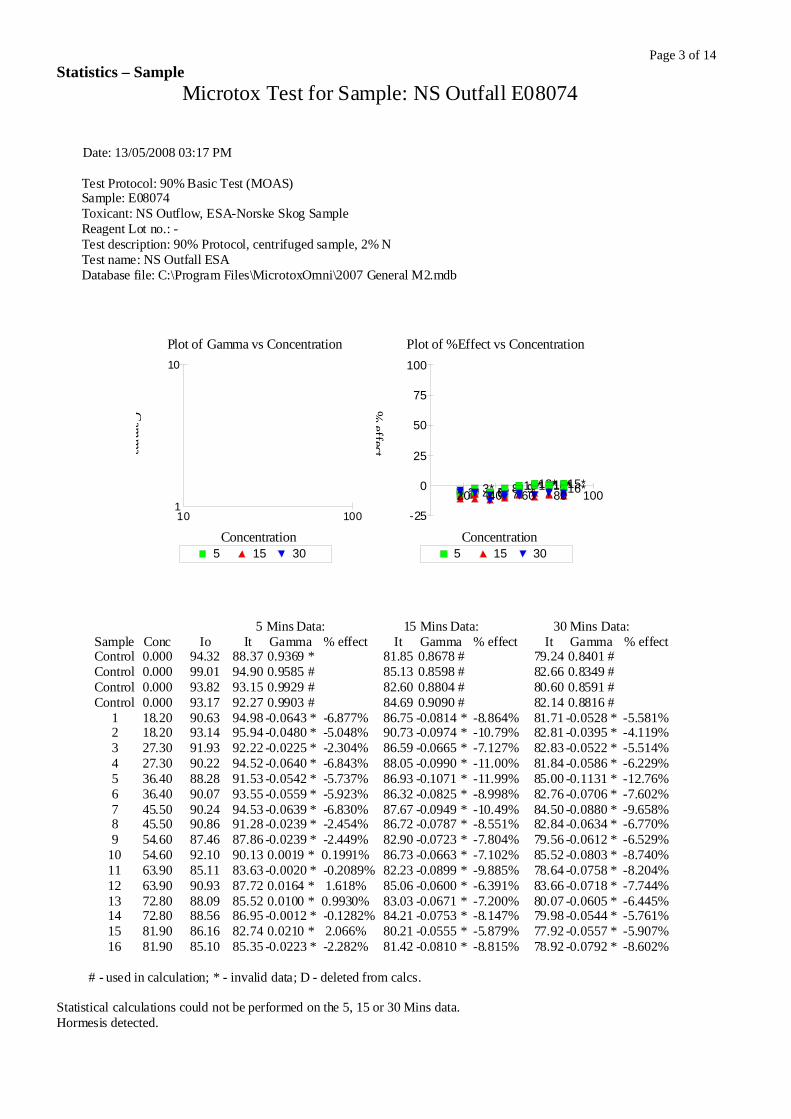
Statistics – Sample Microtox Test for Sample: NS Outfall E08074
Date: 13/05/2008 03:17 PM
Test Protocol: 90% Basic Test (MOAS) Sample: E08074 Toxicant: NS Outflow, ESA-Norske Skog Sample Reagent Lot no.: - Test description: 90% Protocol, centrifuged sample, 2% N Test name: NS Outfall ESA Database file: C:\Program Files\MicrotoxOmni\2007 General M2.mdb
Plot of Gamma vs Concentration
5 15 30
Gam
ma
Concentration
1
10
10 100
Plot of %Effect vs Concentration
5 15 30
%effect
Concentration
1* 2* 3* 4* 5* 6* 7* 8* 9* 10* 11* 12* 13* 14* 15* 16*
-25
0
25
50
75
100
20 40 60 80 100
5 Mins Data: 15 Mins Data: 30 Mins Data: Sample Conc Io It Gamma % effect It Gamma % effect It Gamma % effect Control 0.000 94.32 88.37 0.9369 * 81.85 0.8678 # 79.24 0.8401 # Control 0.000 99.01 94.90 0.9585 # 85.13 0.8598 # 82.66 0.8349 # Control 0.000 93.82 93.15 0.9929 # 82.60 0.8804 # 80.60 0.8591 # Control 0.000 93.17 92.27 0.9903 # 84.69 0.9090 # 82.14 0.8816 # 1 18.20 90.63 94.98 -0.0643 * -6.877% 86.75 -0.0814 * -8.864% 81.71 -0.0528 * -5.581% 2 18.20 93.14 95.94 -0.0480 * -5.048% 90.73 -0.0974 * -10.79% 82.81 -0.0395 * -4.119% 3 27.30 91.93 92.22 -0.0225 * -2.304% 86.59 -0.0665 * -7.127% 82.83 -0.0522 * -5.514% 4 27.30 90.22 94.52 -0.0640 * -6.843% 88.05 -0.0990 * -11.00% 81.84 -0.0586 * -6.229% 5 36.40 88.28 91.53 -0.0542 * -5.737% 86.93 -0.1071 * -11.99% 85.00 -0.1131 * -12.76% 6 36.40 90.07 93.55 -0.0559 * -5.923% 86.32 -0.0825 * -8.998% 82.76 -0.0706 * -7.602% 7 45.50 90.24 94.53 -0.0639 * -6.830% 87.67 -0.0949 * -10.49% 84.50 -0.0880 * -9.658% 8 45.50 90.86 91.28 -0.0239 * -2.454% 86.72 -0.0787 * -8.551% 82.84 -0.0634 * -6.770% 9 54.60 87.46 87.86 -0.0239 * -2.449% 82.90 -0.0723 * -7.804% 79.56 -0.0612 * -6.529% 10 54.60 92.10 90.13 0.0019 * 0.1991% 86.73 -0.0663 * -7.102% 85.52 -0.0803 * -8.740% 11 63.90 85.11 83.63 -0.0020 * -0.2089% 82.23 -0.0899 * -9.885% 78.64 -0.0758 * -8.204% 12 63.90 90.93 87.72 0.0164 * 1.618% 85.06 -0.0600 * -6.391% 83.66 -0.0718 * -7.744% 13 72.80 88.09 85.52 0.0100 * 0.9930% 83.03 -0.0671 * -7.200% 80.07 -0.0605 * -6.445% 14 72.80 88.56 86.95 -0.0012 * -0.1282% 84.21 -0.0753 * -8.147% 79.98 -0.0544 * -5.761% 15 81.90 86.16 82.74 0.0210 * 2.066% 80.21 -0.0555 * -5.879% 77.92 -0.0557 * -5.907% 16 81.90 85.10 85.35 -0.0223 * -2.282% 81.42 -0.0810 * -8.815% 78.92 -0.0792 * -8.602% # - used in calculation; * - invalid data; D - deleted from calcs.
Statistical calculations could not be performed on the 5, 15 or 30 Mins data. Hormesis detected.
Page 4 of 14
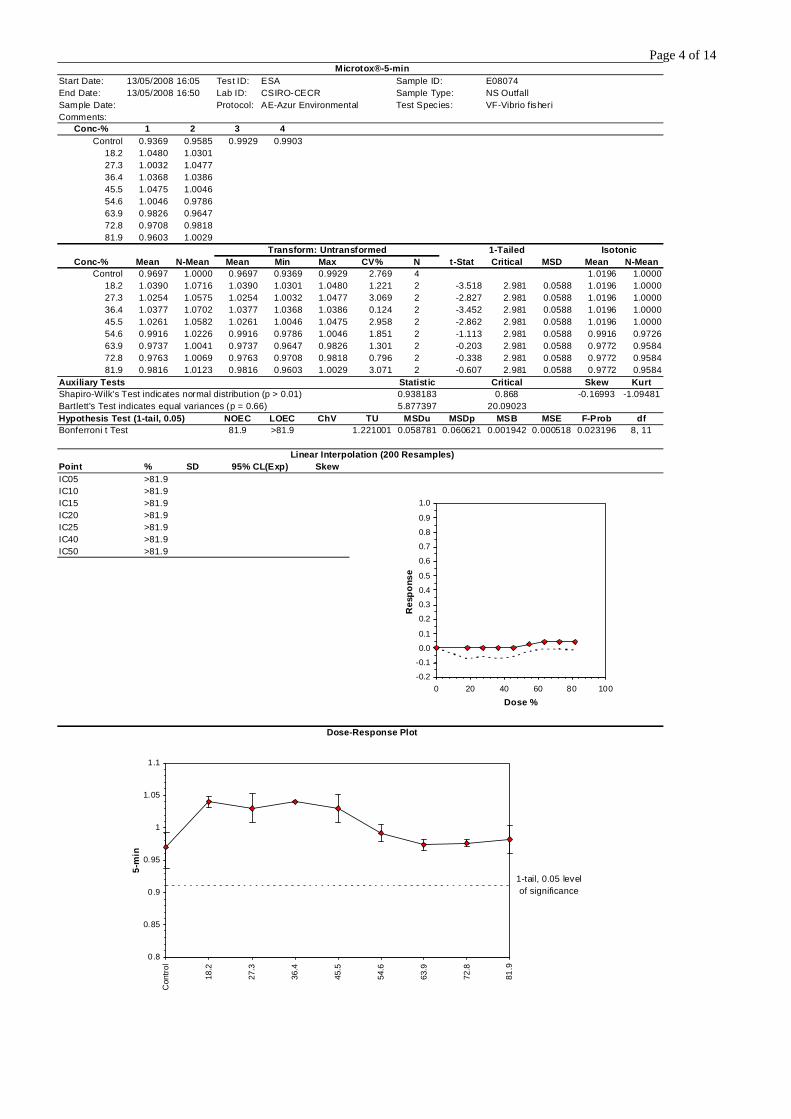
Microtox®-5-minStart Date: 13/05/2008 16:05 Test ID: ESA Sample ID: E08074End Date: 13/05/2008 16:50 Lab ID: CSIRO-CECR Sample Type: NS OutfallSample Date: Protocol: AE-Azur Environmental Test Species: VF-Vibrio fisheriComments:
Conc-% 1 2 3 4Control 0.9369 0.9585 0.9929 0.9903
18.2 1.0480 1.030127.3 1.0032 1.047736.4 1.0368 1.038645.5 1.0475 1.004654.6 1.0046 0.978663.9 0.9826 0.964772.8 0.9708 0.981881.9 0.9603 1.0029
Transform: Untransformed 1-Tailed IsotonicConc-% Mean N-Mean Mean Min Max CV% N t-Stat Critical MSD Mean N-Mean
Control 0.9697 1.0000 0.9697 0.9369 0.9929 2.769 4 1.0196 1.000018.2 1.0390 1.0716 1.0390 1.0301 1.0480 1.221 2 -3.518 2.981 0.0588 1.0196 1.000027.3 1.0254 1.0575 1.0254 1.0032 1.0477 3.069 2 -2.827 2.981 0.0588 1.0196 1.000036.4 1.0377 1.0702 1.0377 1.0368 1.0386 0.124 2 -3.452 2.981 0.0588 1.0196 1.000045.5 1.0261 1.0582 1.0261 1.0046 1.0475 2.958 2 -2.862 2.981 0.0588 1.0196 1.000054.6 0.9916 1.0226 0.9916 0.9786 1.0046 1.851 2 -1.113 2.981 0.0588 0.9916 0.972663.9 0.9737 1.0041 0.9737 0.9647 0.9826 1.301 2 -0.203 2.981 0.0588 0.9772 0.958472.8 0.9763 1.0069 0.9763 0.9708 0.9818 0.796 2 -0.338 2.981 0.0588 0.9772 0.958481.9 0.9816 1.0123 0.9816 0.9603 1.0029 3.071 2 -0.607 2.981 0.0588 0.9772 0.9584
Auxiliary Tests Statistic Critical Skew KurtShapiro-Wilk's Test indicates normal distribution (p > 0.01) 0.938183 0.868 -0.16993 -1.09481Bartlett's Test indicates equal variances (p = 0.66) 5.877397 20.09023Hypothesis Test (1-tail, 0.05) NOEC LOEC ChV TU MSDu MSDp MSB MSE F-Prob dfBonferroni t Test 81.9 >81.9 1.221001 0.058781 0.060621 0.001942 0.000518 0.023196 8, 11
Linear Interpolation (200 Resamples)Point % SD 95% CL(Exp) SkewIC05 >81.9IC10 >81.9IC15 >81.9IC20 >81.9IC25 >81.9IC40 >81.9IC50 >81.9
Dose-Response Plot
-0.2
-0.1
0.0
0.1
0.2
0.3
0.4
0.5
0.6
0.7
0.8
0.9
1.0
0 20 40 60 80 100
Dose %
Res
pons
e
1-tail, 0.05 levelof significance
0.8
0.85
0.9
0.95
1
1.05
1.1
Con
trol
18.2
27.3
36.4
45.5
54.6
63.9
72.8
81.9
5-m
in
Page 5 of 14
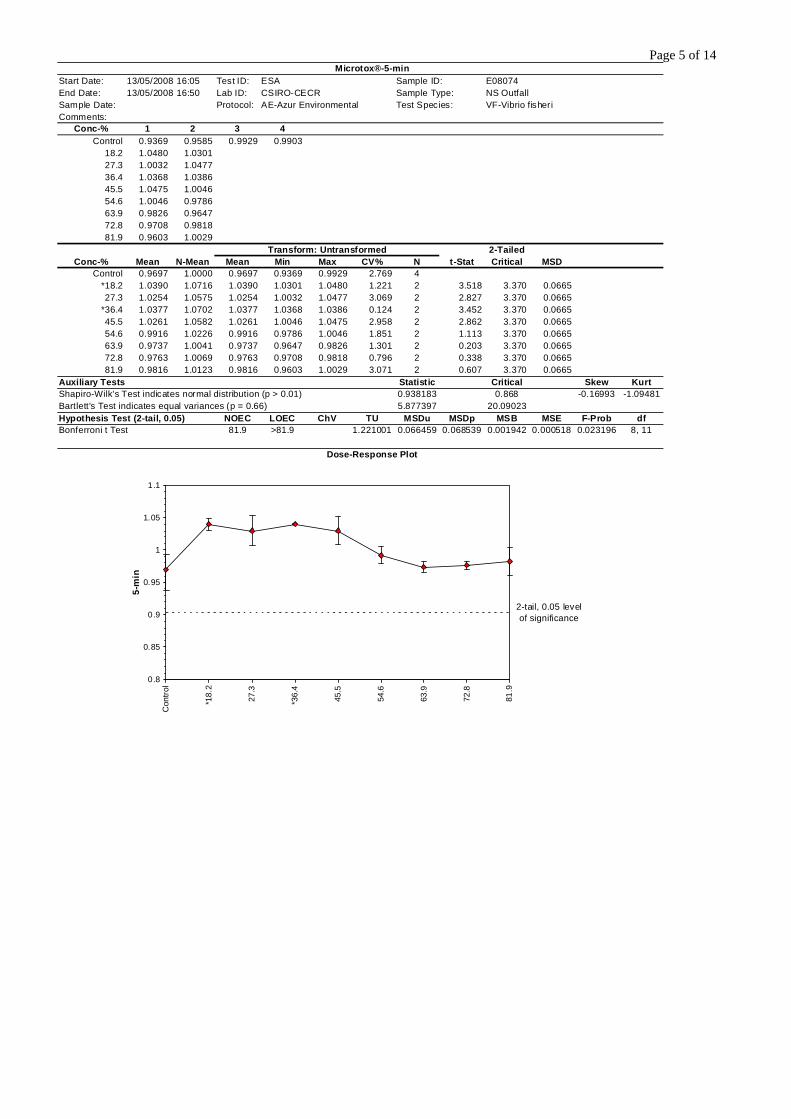
Microtox®-5-minStart Date: 13/05/2008 16:05 Test ID: ESA Sample ID: E08074End Date: 13/05/2008 16:50 Lab ID: CSIRO-CECR Sample Type: NS OutfallSample Date: Protocol: AE-Azur Environmental Test Species: VF-Vibrio fisheriComments:
Conc-% 1 2 3 4Control 0.9369 0.9585 0.9929 0.9903
18.2 1.0480 1.030127.3 1.0032 1.047736.4 1.0368 1.038645.5 1.0475 1.004654.6 1.0046 0.978663.9 0.9826 0.964772.8 0.9708 0.981881.9 0.9603 1.0029
Transform: Untransformed 2-TailedConc-% Mean N-Mean Mean Min Max CV% N t-Stat Critical MSD
Control 0.9697 1.0000 0.9697 0.9369 0.9929 2.769 4*18.2 1.0390 1.0716 1.0390 1.0301 1.0480 1.221 2 3.518 3.370 0.066527.3 1.0254 1.0575 1.0254 1.0032 1.0477 3.069 2 2.827 3.370 0.0665
*36.4 1.0377 1.0702 1.0377 1.0368 1.0386 0.124 2 3.452 3.370 0.066545.5 1.0261 1.0582 1.0261 1.0046 1.0475 2.958 2 2.862 3.370 0.066554.6 0.9916 1.0226 0.9916 0.9786 1.0046 1.851 2 1.113 3.370 0.066563.9 0.9737 1.0041 0.9737 0.9647 0.9826 1.301 2 0.203 3.370 0.066572.8 0.9763 1.0069 0.9763 0.9708 0.9818 0.796 2 0.338 3.370 0.066581.9 0.9816 1.0123 0.9816 0.9603 1.0029 3.071 2 0.607 3.370 0.0665
Auxiliary Tests Statistic Critical Skew KurtShapiro-Wilk's Test indicates normal distribution (p > 0.01) 0.938183 0.868 -0.16993 -1.09481Bartlett's Test indicates equal variances (p = 0.66) 5.877397 20.09023Hypothesis Test (2-tail, 0.05) NOEC LOEC ChV TU MSDu MSDp MSB MSE F-Prob dfBonferroni t Test 81.9 >81.9 1.221001 0.066459 0.068539 0.001942 0.000518 0.023196 8, 11
Dose-Response Plot
2-tail, 0.05 levelof significance
0.8
0.85
0.9
0.95
1
1.05
1.1
Con
trol
*18.
2
27.3
*36.
4
45.5
54.6
63.9
72.8
81.9
5-m
in
Page 6 of 14
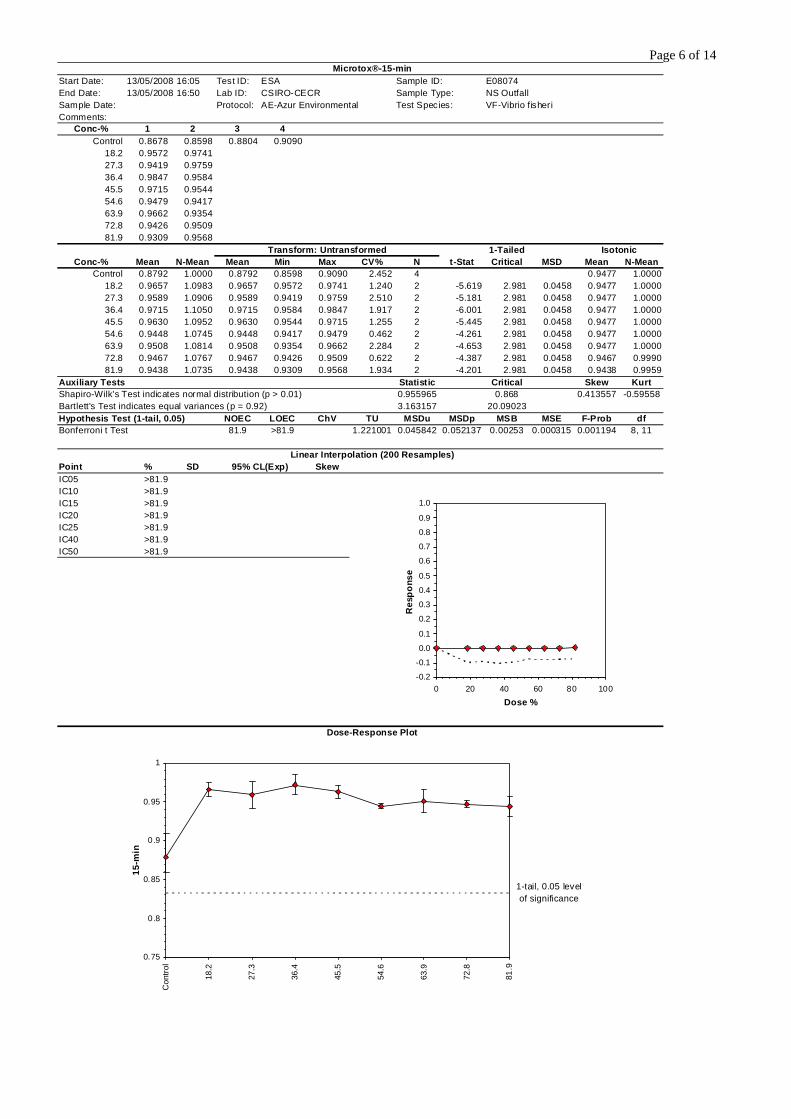
Microtox®-15-minStart Date: 13/05/2008 16:05 Test ID: ESA Sample ID: E08074End Date: 13/05/2008 16:50 Lab ID: CSIRO-CECR Sample Type: NS OutfallSample Date: Protocol: AE-Azur Environmental Test Species: VF-Vibrio fisheriComments:
Conc-% 1 2 3 4Control 0.8678 0.8598 0.8804 0.9090
18.2 0.9572 0.974127.3 0.9419 0.975936.4 0.9847 0.958445.5 0.9715 0.954454.6 0.9479 0.941763.9 0.9662 0.935472.8 0.9426 0.950981.9 0.9309 0.9568
Transform: Untransformed 1-Tailed IsotonicConc-% Mean N-Mean Mean Min Max CV% N t-Stat Critical MSD Mean N-Mean
Control 0.8792 1.0000 0.8792 0.8598 0.9090 2.452 4 0.9477 1.000018.2 0.9657 1.0983 0.9657 0.9572 0.9741 1.240 2 -5.619 2.981 0.0458 0.9477 1.000027.3 0.9589 1.0906 0.9589 0.9419 0.9759 2.510 2 -5.181 2.981 0.0458 0.9477 1.000036.4 0.9715 1.1050 0.9715 0.9584 0.9847 1.917 2 -6.001 2.981 0.0458 0.9477 1.000045.5 0.9630 1.0952 0.9630 0.9544 0.9715 1.255 2 -5.445 2.981 0.0458 0.9477 1.000054.6 0.9448 1.0745 0.9448 0.9417 0.9479 0.462 2 -4.261 2.981 0.0458 0.9477 1.000063.9 0.9508 1.0814 0.9508 0.9354 0.9662 2.284 2 -4.653 2.981 0.0458 0.9477 1.000072.8 0.9467 1.0767 0.9467 0.9426 0.9509 0.622 2 -4.387 2.981 0.0458 0.9467 0.999081.9 0.9438 1.0735 0.9438 0.9309 0.9568 1.934 2 -4.201 2.981 0.0458 0.9438 0.9959
Auxiliary Tests Statistic Critical Skew KurtShapiro-Wilk's Test indicates normal distribution (p > 0.01) 0.955965 0.868 0.413557 -0.59558Bartlett's Test indicates equal variances (p = 0.92) 3.163157 20.09023Hypothesis Test (1-tail, 0.05) NOEC LOEC ChV TU MSDu MSDp MSB MSE F-Prob dfBonferroni t Test 81.9 >81.9 1.221001 0.045842 0.052137 0.00253 0.000315 0.001194 8, 11
Linear Interpolation (200 Resamples)Point % SD 95% CL(Exp) SkewIC05 >81.9IC10 >81.9IC15 >81.9IC20 >81.9IC25 >81.9IC40 >81.9IC50 >81.9
Dose-Response Plot
-0.2
-0.1
0.0
0.1
0.2
0.3
0.4
0.5
0.6
0.7
0.8
0.9
1.0
0 20 40 60 80 100Dose %
Res
pons
e
1-tail, 0.05 levelof significance
0.75
0.8
0.85
0.9
0.95
1
Con
trol
18.2
27.3
36.4
45.5
54.6
63.9
72.8
81.9
15-m
in

Page 7 of 14
Microtox®-15-minStart Date: 13/05/2008 16:05 Test ID: ESA Sample ID: E08074End Date: 13/05/2008 16:50 Lab ID: CSIRO-CECR Sample Type: NS OutfallSample Date: Protocol: AE-Azur Environmental Test Species: VF-Vibrio fisheriComments:
Conc-% 1 2 3 4Control 0.8678 0.8598 0.8804 0.9090
18.2 0.9572 0.974127.3 0.9419 0.975936.4 0.9847 0.958445.5 0.9715 0.954454.6 0.9479 0.941763.9 0.9662 0.935472.8 0.9426 0.950981.9 0.9309 0.9568
Transform: Untransformed 2-TailedConc-% Mean N-Mean Mean Min Max CV% N t-Stat Critical MSD
Control 0.8792 1.0000 0.8792 0.8598 0.9090 2.452 4*18.2 0.9657 1.0983 0.9657 0.9572 0.9741 1.240 2 5.619 3.370 0.0518*27.3 0.9589 1.0906 0.9589 0.9419 0.9759 2.510 2 5.181 3.370 0.0518*36.4 0.9715 1.1050 0.9715 0.9584 0.9847 1.917 2 6.001 3.370 0.0518*45.5 0.9630 1.0952 0.9630 0.9544 0.9715 1.255 2 5.445 3.370 0.0518*54.6 0.9448 1.0745 0.9448 0.9417 0.9479 0.462 2 4.261 3.370 0.0518*63.9 0.9508 1.0814 0.9508 0.9354 0.9662 2.284 2 4.653 3.370 0.0518*72.8 0.9467 1.0767 0.9467 0.9426 0.9509 0.622 2 4.387 3.370 0.0518*81.9 0.9438 1.0735 0.9438 0.9309 0.9568 1.934 2 4.201 3.370 0.0518
Auxiliary Tests Statistic Critical Skew KurtShapiro-Wilk's Test indicates normal distribution (p > 0.01) 0.955965 0.868 0.413557 -0.59558Bartlett's Test indicates equal variances (p = 0.92) 3.163157 20.09023Hypothesis Test (2-tail, 0.05) NOEC LOEC ChV TU MSDu MSDp MSB MSE F-Prob dfBonferroni t Test <18.2 18.2 0.051829 0.058947 0.00253 0.000315 0.001194 8, 11
Dose-Response Plot
2-tail, 0.05 levelof significance
0.7
0.75
0.8
0.85
0.9
0.95
1
Con
trol
*18.
2
*27.
3
*36.
4
*45.
5
*54.
6
*63.
9
*72.
8
*81.
9
15-m
in

Page 8 of 14
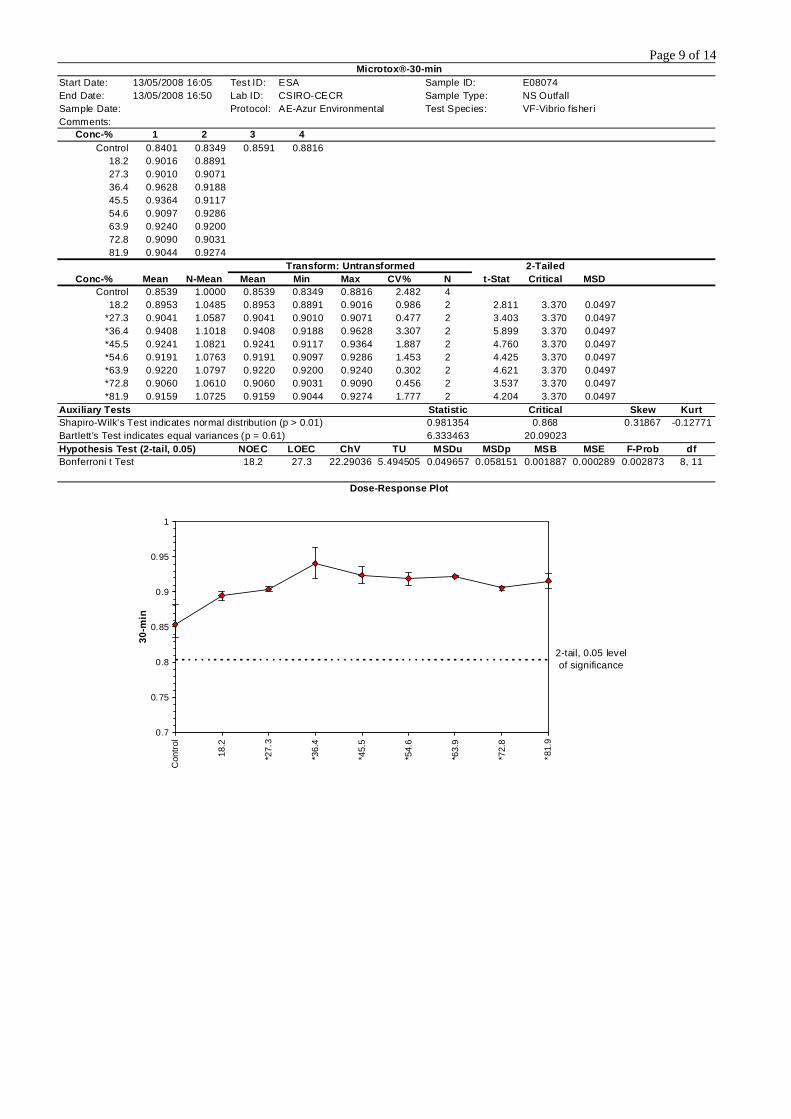
Microtox®-30-minStart Date: 13/05/2008 16:05 Test ID: ESA Sample ID: E08074End Date: 13/05/2008 16:50 Lab ID: CSIRO-CECR Sample Type: NS OutfallSample Date: Protocol: AE-Azur Environmental Test Species: VF-Vibrio fisheriComments:
Conc-% 1 2 3 4Control 0.8401 0.8349 0.8591 0.8816
18.2 0.9016 0.889127.3 0.9010 0.907136.4 0.9628 0.918845.5 0.9364 0.911754.6 0.9097 0.928663.9 0.9240 0.920072.8 0.9090 0.903181.9 0.9044 0.9274
Transform: Untransformed 1-Tailed IsotonicConc-% Mean N-Mean Mean Min Max CV% N t-Stat Critical MSD Mean N-Mean
Control 0.8539 1.0000 0.8539 0.8349 0.8816 2.482 4 0.9090 1.000018.2 0.8953 1.0485 0.8953 0.8891 0.9016 0.986 2 -2.811 2.981 0.0439 0.9090 1.000027.3 0.9041 1.0587 0.9041 0.9010 0.9071 0.477 2 -3.403 2.981 0.0439 0.9090 1.000036.4 0.9408 1.1018 0.9408 0.9188 0.9628 3.307 2 -5.899 2.981 0.0439 0.9090 1.000045.5 0.9241 1.0821 0.9241 0.9117 0.9364 1.887 2 -4.760 2.981 0.0439 0.9090 1.000054.6 0.9191 1.0763 0.9191 0.9097 0.9286 1.453 2 -4.425 2.981 0.0439 0.9090 1.000063.9 0.9220 1.0797 0.9220 0.9200 0.9240 0.302 2 -4.621 2.981 0.0439 0.9090 1.000072.8 0.9060 1.0610 0.9060 0.9031 0.9090 0.456 2 -3.537 2.981 0.0439 0.9090 1.000081.9 0.9159 1.0725 0.9159 0.9044 0.9274 1.777 2 -4.204 2.981 0.0439 0.9090 1.0000
Auxiliary Tests Statistic Critical Skew KurtShapiro-Wilk's Test indicates normal distribution (p > 0.01) 0.981354 0.868 0.31867 -0.12771Bartlett's Test indicates equal variances (p = 0.61) 6.333463 20.09023Hypothesis Test (1-tail, 0.05) NOEC LOEC ChV TU MSDu MSDp MSB MSE F-Prob dfBonferroni t Test 81.9 >81.9 1.221001 0.04392 0.051434 0.001887 0.000289 0.002873 8, 11
Linear Interpolation (200 Resamples)Point % SD 95% CL(Exp) SkewIC05 >81.9IC10 >81.9IC15 >81.9IC20 >81.9IC25 >81.9IC40 >81.9IC50 >81.9
Dose-Response Plot
-0.2
-0.1
0.0
0.1
0.2
0.3
0.4
0.5
0.6
0.7
0.8
0.9
1.0
0 20 40 60 80 100
Dose %
Res
pons
e
1-tail, 0.05 levelof significance
0.7
0.75
0.8
0.85
0.9
0.95
1
Con
trol
18.2
27.3
36.4
45.5
54.6
63.9
72.8
81.9
30-m
in
Page 9 of 14
Microtox®-30-minStart Date: 13/05/2008 16:05 Test ID: ESA Sample ID: E08074End Date: 13/05/2008 16:50 Lab ID: CSIRO-CECR Sample Type: NS OutfallSample Date: Protocol: AE-Azur Environmental Test Species: VF-Vibrio fisheriComments:
Conc-% 1 2 3 4Control 0.8401 0.8349 0.8591 0.8816
18.2 0.9016 0.889127.3 0.9010 0.907136.4 0.9628 0.918845.5 0.9364 0.911754.6 0.9097 0.928663.9 0.9240 0.920072.8 0.9090 0.903181.9 0.9044 0.9274
Transform: Untransformed 2-TailedConc-% Mean N-Mean Mean Min Max CV% N t-Stat Critical MSD
Control 0.8539 1.0000 0.8539 0.8349 0.8816 2.482 418.2 0.8953 1.0485 0.8953 0.8891 0.9016 0.986 2 2.811 3.370 0.0497
*27.3 0.9041 1.0587 0.9041 0.9010 0.9071 0.477 2 3.403 3.370 0.0497*36.4 0.9408 1.1018 0.9408 0.9188 0.9628 3.307 2 5.899 3.370 0.0497*45.5 0.9241 1.0821 0.9241 0.9117 0.9364 1.887 2 4.760 3.370 0.0497*54.6 0.9191 1.0763 0.9191 0.9097 0.9286 1.453 2 4.425 3.370 0.0497*63.9 0.9220 1.0797 0.9220 0.9200 0.9240 0.302 2 4.621 3.370 0.0497*72.8 0.9060 1.0610 0.9060 0.9031 0.9090 0.456 2 3.537 3.370 0.0497*81.9 0.9159 1.0725 0.9159 0.9044 0.9274 1.777 2 4.204 3.370 0.0497
Auxiliary Tests Statistic Critical Skew KurtShapiro-Wilk's Test indicates normal distribution (p > 0.01) 0.981354 0.868 0.31867 -0.12771Bartlett's Test indicates equal variances (p = 0.61) 6.333463 20.09023Hypothesis Test (2-tail, 0.05) NOEC LOEC ChV TU MSDu MSDp MSB MSE F-Prob dfBonferroni t Test 18.2 27.3 22.29036 5.494505 0.049657 0.058151 0.001887 0.000289 0.002873 8, 11
Dose-Response Plot
2-tail, 0.05 levelof significance
0.7
0.75
0.8
0.85
0.9
0.95
1
Con
trol
18.2
*27.
3
*36.
4
*45.
5
*54.
6
*63.
9
*72.
8
*81.
9
30-m
in

Page 10 of 14
Reference Toxicant: Microtox Test for Sample: Phenol Std 13.05.08
Date: 13/05/2008 04:20 PM
Test Protocol: Phenol Standard Sample: Phenol 13.05.08 Toxicant: Phenol Reagent Lot no.: - Test description: Phenol Standard 13.05.08, beside NS Ou Test name: Phenol 13.05.08 Database file: C:\Program Files\MicrotoxOmni\2007 General M2.mdb
Plot of Gamma vs Concentration
5 15 30 Fit
Gam
ma
Concentration
1# 2#
3# 4#
5# 6# 7# 8#
0.1
1
10
1 10 100
Plot of %Effect vs Concentration
5 15 30
%effect
Concentration
1# 2#
3# 4#
5# 6# 7# 8#
0
25
50
75
100
0 20 40 60 80 100
5 Mins Data: 15 Mins Data: 30 Mins Data: Sample Conc Io It Gamma % effect It Gamma % effect It Gamma % effect Control 0.000 94.51 83.50 0.8835 # 77.87 0.8239 # 73.66 0.7794 # Control 0.000 98.42 85.39 0.8676 # 79.45 0.8073 # 75.76 0.7698 # Control 0.000 98.81 84.15 0.8516 # 79.55 0.8051 # 76.28 0.7720 # Control 0.000 95.94 81.93 0.8540 # 79.23 0.8258 # 75.16 0.7834 # 1 5.625 94.13 58.66 0.3867 # 27.89% 58.25 0.3179 # 24.12% 55.13 0.3252 # 24.54% 2 5.625 85.02 55.24 0.3301 # 24.82% 53.91 0.2861 # 22.25% 53.44 0.2348 # 19.01% 3 11.25 97.96 48.94 0.7298 # 42.19% 47.66 0.6762 # 40.34% 45.73 0.6626 # 39.85% 4 11.25 95.27 47.61 0.7293 # 42.17% 45.84 0.6949 # 41.00% 45.53 0.6240 # 38.43% 5 22.50 96.83 36.53 1.291 # 56.34% 35.24 1.241 # 55.37% 32.75 1.295 # 56.42% 6 22.50 95.94 35.68 1.324 # 56.97% 34.00 1.301 # 56.54% 33.16 1.246 # 55.47% 7 45.00 92.15 24.71 2.223 # 68.97% 23.65 2.178 # 68.53% 22.33 2.203 # 68.78% 8 45.00 97.88 26.61 2.179 # 68.54% 25.16 2.173 # 68.48% 23.93 2.175 # 68.50% # - used in calculation; * - invalid data; D - deleted from calcs.

Page 11 of 14
Microtox Test for Sample: Phenol Std 13.05.08 continued…
Calculations on 5 Mins data: EC50 Concentration:17.27mg/L (95% confidence range: 16.06 to 18.57) 95% Confidence Factor: 1.076 Estimating Equation:LOG C =1.138 x LOG G +1.237 Coeff. of Determination (R²):0.9913 Slope: 0.8710 Correction Factor: 0.8642 Calculations on 15 Mins data: EC50 Concentration:18.42mg/L (95% confidence range: 16.94 to 20.03) 95% Confidence Factor: 1.087 Estimating Equation:LOG C =1.047 x LOG G +1.265 Coeff. of Determination (R²):0.9887 Slope: 0.9442 Correction Factor: 0.8155 Calculations on 30 Mins data: EC50 Concentration:18.93mg/L (95% confidence range: 16.88 to 21.23) 95% Confidence Factor: 1.121 Estimating Equation:LOG C =0.9852 x LOG G +1.277 Coeff. of Determination (R²):0.9792 Slope: 0.9939 Correction Factor: 0.7761

Page 12 of 14
Microtox®-5-minStart Date: 13/05/2008 17:05 Test ID: ESA Sample ID: REF-Ref ToxicantEnd Date: 13/05/2008 17:50 Lab ID: CSIRO-CECR Sample Type: PH-Phenol StandardSample Date: Protocol: AE-Azur Environmental Test Species: VF-Vibrio fisheriComments: nominal concentrations
Conc-mg/L 1 2 3 4Control 0.8835 0.8676 0.8516 0.8540
5.625 0.6232 0.649711.25 0.4996 0.4997
22.5 0.3773 0.371945 0.2681 0.2719
Transform: Untransformed 1-TailedConc-mg/L Mean N-Mean Mean Min Max CV% N t-Stat Critical MSD
Control 0.8642 1.0000 0.8642 0.8516 0.8835 1.699 4*5.625 0.6365 0.7365 0.6365 0.6232 0.6497 2.950 2 21.778 2.841 0.0297*11.25 0.4997 0.5782 0.4997 0.4996 0.4997 0.021 2 34.860 2.841 0.0297
*22.5 0.3746 0.4335 0.3746 0.3719 0.3773 1.012 2 46.823 2.841 0.0297*45 0.2700 0.3124 0.2700 0.2681 0.2719 0.973 2 56.824 2.841 0.0297
Auxiliary Tests Statistic Critical Skew KurtShapiro-Wilk's Test indicates normal distribution (p > 0.01) 0.931444 0.805 0.51508 0.314235Bartlett's Test indicates equal variances (p = 0.05) 9.514215 13.2767Hypothesis Test (1-tail, 0.05) NOEC LOEC ChV TU MSDu MSDp MSB MSE F-Prob dfBonferroni t Test <5.625 5.625 0.029709 0.034379 0.154655 0.000146 8.1E-10 4, 7
Dose-Response Plot
1-tail, 0.05 levelof significance
0
0.1
0.2
0.3
0.4
0.5
0.6
0.7
0.8
0.9
1
Con
trol
*5.6
25
*11.
25
*22.
5
*45
5-m
in

Page 13 of 14
Microtox®-15-minStart Date: 13/05/2008 17:05 Test ID: ESA Sample ID: REF-Ref ToxicantEnd Date: 13/05/2008 17:50 Lab ID: CSIRO-CECR Sample Type: PH-Phenol StandardSample Date: Protocol: AE-Azur Environmental Test Species: VF-Vibrio fisheriComments: nominal concentrations
Conc-mg/L 1 2 3 4Control 0.8239 0.8073 0.8051 0.8258
5.625 0.6188 0.634111.25 0.4865 0.4812
22.5 0.3639 0.354445 0.2566 0.2570
Transform: Untransformed 1-TailedConc-mg/L Mean N-Mean Mean Min Max CV% N t-Stat Critical MSD
Control 0.8155 1.0000 0.8155 0.8051 0.8258 1.333 4*5.625 0.6265 0.7682 0.6265 0.6188 0.6341 1.723 2 25.069 2.841 0.0214*11.25 0.4838 0.5933 0.4838 0.4812 0.4865 0.784 2 43.979 2.841 0.0214
*22.5 0.3592 0.4404 0.3592 0.3544 0.3639 1.880 2 60.510 2.841 0.0214*45 0.2568 0.3149 0.2568 0.2566 0.2570 0.111 2 74.076 2.841 0.0214
Auxiliary Tests Statistic Critical Skew KurtShapiro-Wilk's Test indicates normal distribution (p > 0.01) 0.954338 0.805 -0.00519 -1.27497Bartlett's Test indicates equal variances (p = 0.25) 5.37606 13.2767Hypothesis Test (1-tail, 0.05) NOEC LOEC ChV TU MSDu MSDp MSB MSE F-Prob dfBonferroni t Test <5.625 5.625 0.021428 0.026276 0.136519 7.58E-05 1.3E-10 4, 7
Dose-Response Plot
1-tail, 0.05 levelof significance
0
0.1
0.2
0.3
0.4
0.5
0.6
0.7
0.8
0.9
Con
trol
*5.6
25
*11.
25
*22.
5
*45
15-m
in

Page 14 of 14
Microtox®-30-minStart Date: 13/05/2008 17:05 Test ID: ESA Sample ID: REF-Ref ToxicantEnd Date: 13/05/2008 17:50 Lab ID: CSIRO-CECR Sample Type: PH-Phenol StandardSample Date: Protocol: AE-Azur Environmental Test Species: VF-Vibrio fisheriComments: nominal concentrations
Conc-mg/L 1 2 3 4Control 0.7794 0.7698 0.7720 0.7834
5.625 0.5857 0.628611.25 0.4668 0.4779
22.5 0.3382 0.345645 0.2423 0.2445
Transform: Untransformed 1-TailedConc-mg/L Mean N-Mean Mean Min Max CV% N t-Stat Critical MSD
Control 0.7761 1.0000 0.7761 0.7698 0.7834 0.819 4*5.625 0.6071 0.7822 0.6071 0.5857 0.6286 4.994 2 15.349 2.841 0.0313*11.25 0.4724 0.6086 0.4724 0.4668 0.4779 1.659 2 27.586 2.841 0.0313
*22.5 0.3419 0.4406 0.3419 0.3382 0.3456 1.533 2 39.431 2.841 0.0313*45 0.2434 0.3136 0.2434 0.2423 0.2445 0.628 2 48.378 2.841 0.0313
Auxiliary Tests Statistic Critical Skew KurtShapiro-Wilk's Test indicates normal distribution (p > 0.01) 0.937092 0.805 0.009236 2.362406Bartlett's Test indicates equal variances (p = 0.14) 6.966578 13.2767Hypothesis Test (1-tail, 0.05) NOEC LOEC ChV TU MSDu MSDp MSB MSE F-Prob dfBonferroni t Test <5.625 5.625 0.031287 0.040312 0.123858 0.000162 2.5E-09 4, 7
Dose-Response Plot
1-tail, 0.05 levelof significance
0
0.1
0.2
0.3
0.4
0.5
0.6
0.7
0.8
0.9
Con
trol
*5.6
25
*11.
25
*22.
5
*45
30-m
in


