15
TPP Regulatory Coherence Auckland, New Zealand December 6, 2010 Sean Heather Executive Director Global Regulatory Cooperation Project U.S. Chamber of Commerce [email protected]

TPP Regulatory Coherence
Auckland, New ZealandDecember 6, 2010
Sean HeatherExecutive Director
Global Regulatory Cooperation ProjectU.S. Chamber of [email protected]

Why Regulatory Coherence
Trade Liberalization and Regulation
In 1947 the average tariff on industrial products between industrialized nations was more than 40%. Today the average is less than 1%.*
Tariffs matter but the emerging and future challenge is for trade agreements to better address the vast array of behind-the-border (regulatory) measures that impeded trade flows and investment.
*Source WTO

Why Regulatory Coherence
Regulation & Compliance
#1 GLOBAL BUSINESS RISK
Source: 2010 Ernst & Young Survey of the Top Ten Business Risks Companies Face Globally

Why Regulatory Coherence
WEF – DAVOS Survey Approx 1,200 CEOs
1) Global Recovery2) Regulation
“Over two-thirds of CEOs prioritized cooperation with regulators as they seek to rebuild trust in their industries. Nearly 60% believe that smarter regulation will stem from working more closely together...”
Source: PriceWaterhouseCoopers – 2010 Annual Global CEO Survey

Why Regulatory CoherenceWEF – DAVOS Survey Cont’d
Regulatory Priority Areas –
59% Work together to maintain competitiveness57% Regulation stable & clear45% Work to harmonize regulation across nations39% Emphasis on fair enforcement of existing regulation32% Focus on outcomes, not Process
Lowest Ranked – 15% Empower multilateral organization to become global regulators
Source: PriceWaterhouseCoopers – 2010 Annual Global CEO Survey

Why Regulatory Coherence
Ex. Toothpaste
• Food, Drug, or Cosmetic Regulations• Safety and Effectiveness Regulations• Ingredients Regulation • Packaging, Labeling, Marketing Regulations
Government and Industry Standards• Testing and Conformity Requirements• Application and Approval Process

Measuring the Impact
Tariffs easily quantifiable….
Regulatory Coherence….Much, More Difficult– Trade Perspective– Compliance Perspective– Competitiveness Perspective– Government Perspective– Regulatory Beneficiary Perspective

Measuring the ImpactTrade Perspective
Example: U.S.-EU
Reducing Transatlantic Regulatory Divergence
• 122 Billion Euros per year in GDP growth & 2.1% growth in exports per year for Europe.
• 41 Billion Euro per year in GDP, 6.1% growth in exports per year for the U.S.
This study only measured the impact on the direct trade relationship, it didn’t capture spill over impacts domestically by having better regulation in place whereby increasing competitiveness.
Source: ECORYS - Non-Tariff Measures in EU-US Trade and Investment An Economic Analysis

Measuring the Impact
Regulatory Compliance Perspective
Example: REACH – EU Chemical Directive
Compliance is expensive – estimated to represent a 4% to 20% surcharge on production costs.*
Source: PriceWaterhouseCoopers
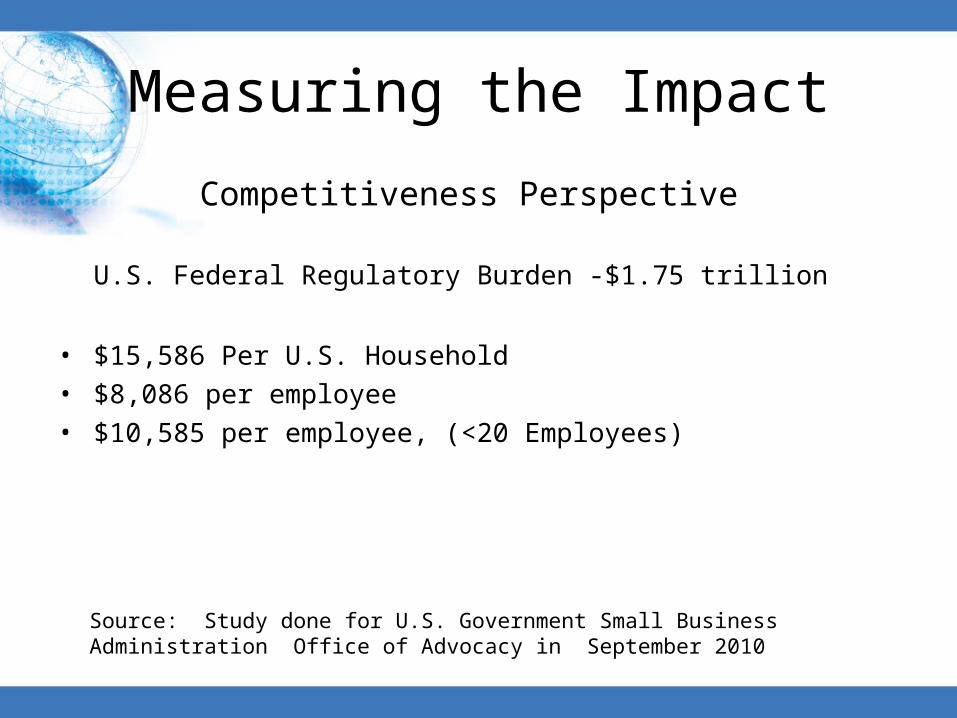
Measuring the Impact
Competitiveness Perspective
U.S. Federal Regulatory Burden -$1.75 trillion
• $15,586 Per U.S. Household• $8,086 per employee • $10,585 per employee, (<20 Employees)
Source: Study done for U.S. Government Small Business Administration Office of Advocacy in September 2010

Measuring the Impact
Report: Susan Dudley and Melinda Warren George Washington University and Washington University in St. Louis
Government Perspective

Measuring the Impact
Regulatory Beneficiary Perspective
No Adverse Impact
Goal – Not to reduce the effectiveness of the regulation, but to maintain/increase quality
outcomes but at a reduced cost.

AXIOMS of Regulatory Coherence
•Regulatory coherence is not about less regulation (anti-regulation), nor is it about more regulation (pro-regulation).
•It simply seeks better regulation that is effective, but also not market- distorting.
•Regulatory coherence is about competitiveness. An optimal regulatory environment allows the market to be more competitive and innovative.

AXIOMS of Regulatory Coherence
•Regulatory Coherence is not harmonization.
•Regulatory Coherence is about process. Better process, better outcome.
•Regulatory coherence is not a trade negotiation. The political trade-offs that can plague trade negotiations should not exist in regulatory coherence. It is about doing something better together.

Why Regulatory Coherence &TPP?
World Bank: Ease of Doing Business Report 2011• Singapore #1 Peru #36• New Zealand #3 Chile #43• U.S. #5 Vietnam #78• Australia #10 Brunei #114• Malaysia #21 Top 10 Reformers in 2010
• Peru #3• Vietnam #4• Brunei #10


